-
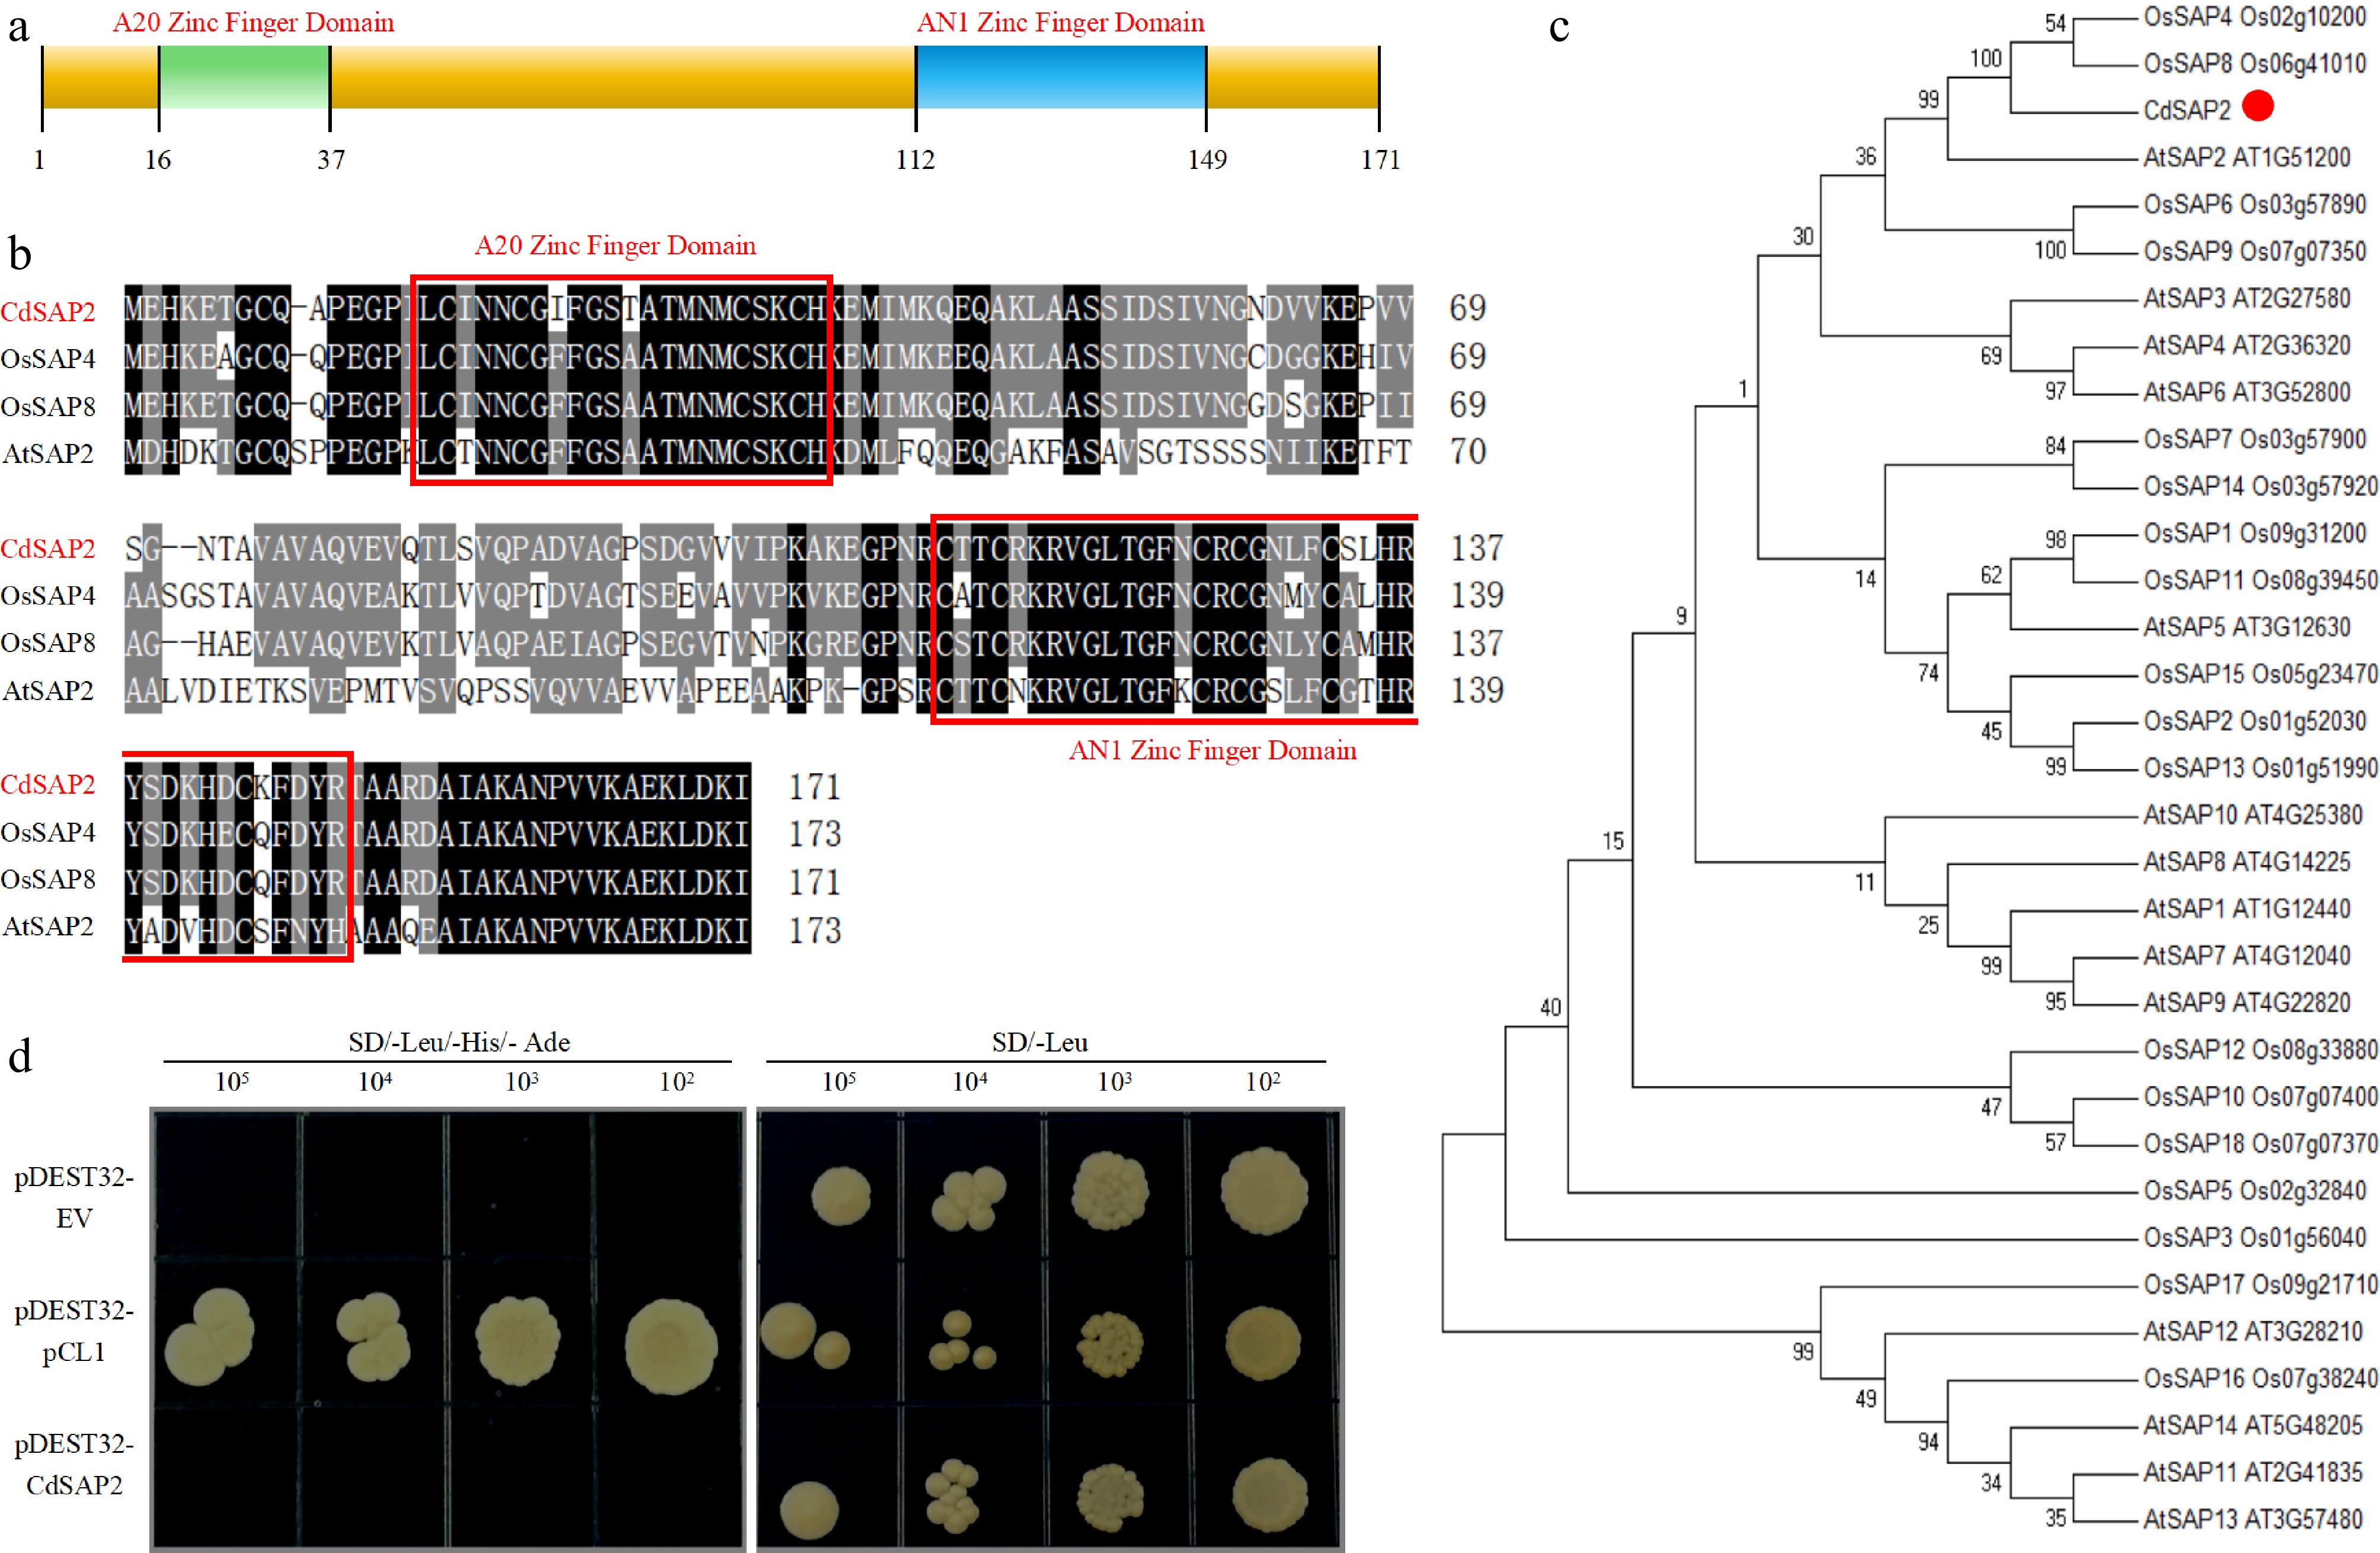
Figure 1.
Sequence analysis, phylogenetic relationship, and transcription activation activity of CdSAP2. (a) The domain composition of CdSAP2. (b) Alignment of amino acid sequences of CdSAP2 with the closest orthologs AtSAP2, OsSAP4, and OsSAP8. The A20 zinc finger domain and the AN1 zinc finger domain are framed in red. (c) Phylogenetic tree of CdSAP2 and 32 additional orthologs. (d) Transcription activation activity of CdSAP2 in yeast cells. The positive control was pCL1, and the negative control was pDEST32 empty vector.
-
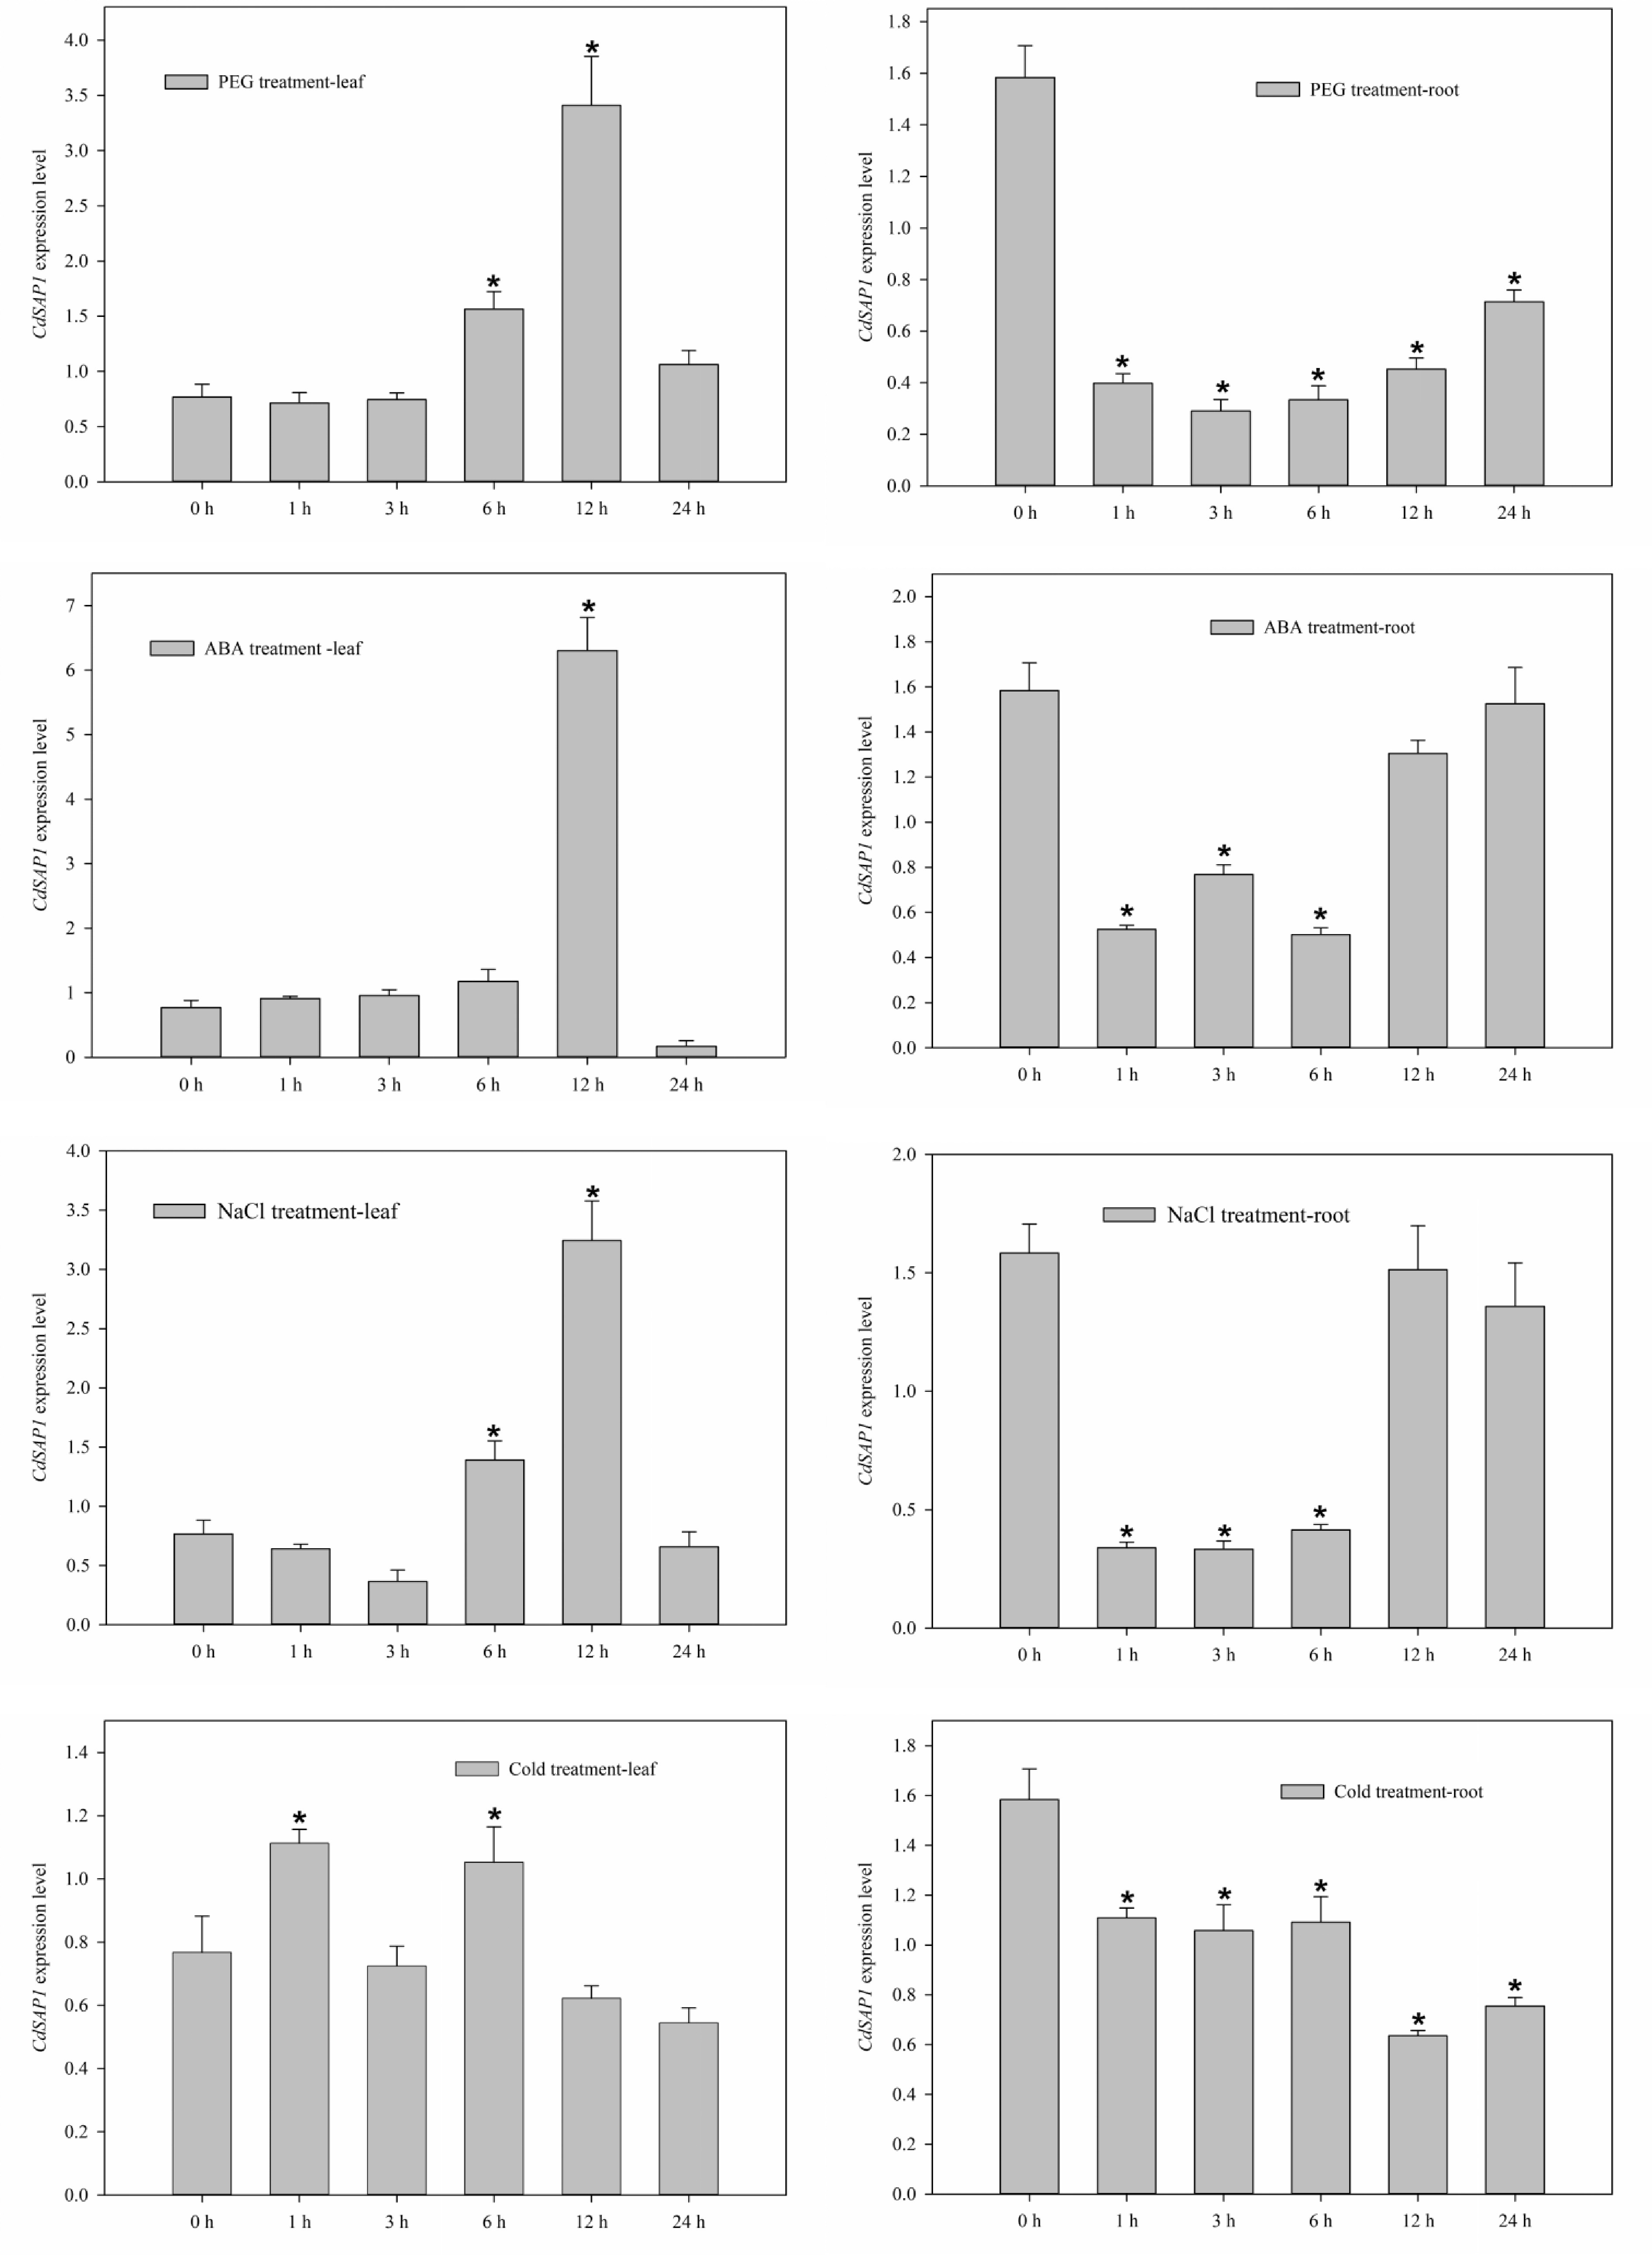
Figure 2.
Expression patterns of CdSAP2 in response to PEG-6000 (30%), ABA (100 mM), NaCl (300 mM), and cold (4 °C) treatments. Data shown were mean values ± SE of three independent biological replicates. Asterisks indicate significant differences according to Fisher's protected LSD test (p < 0.05).
-
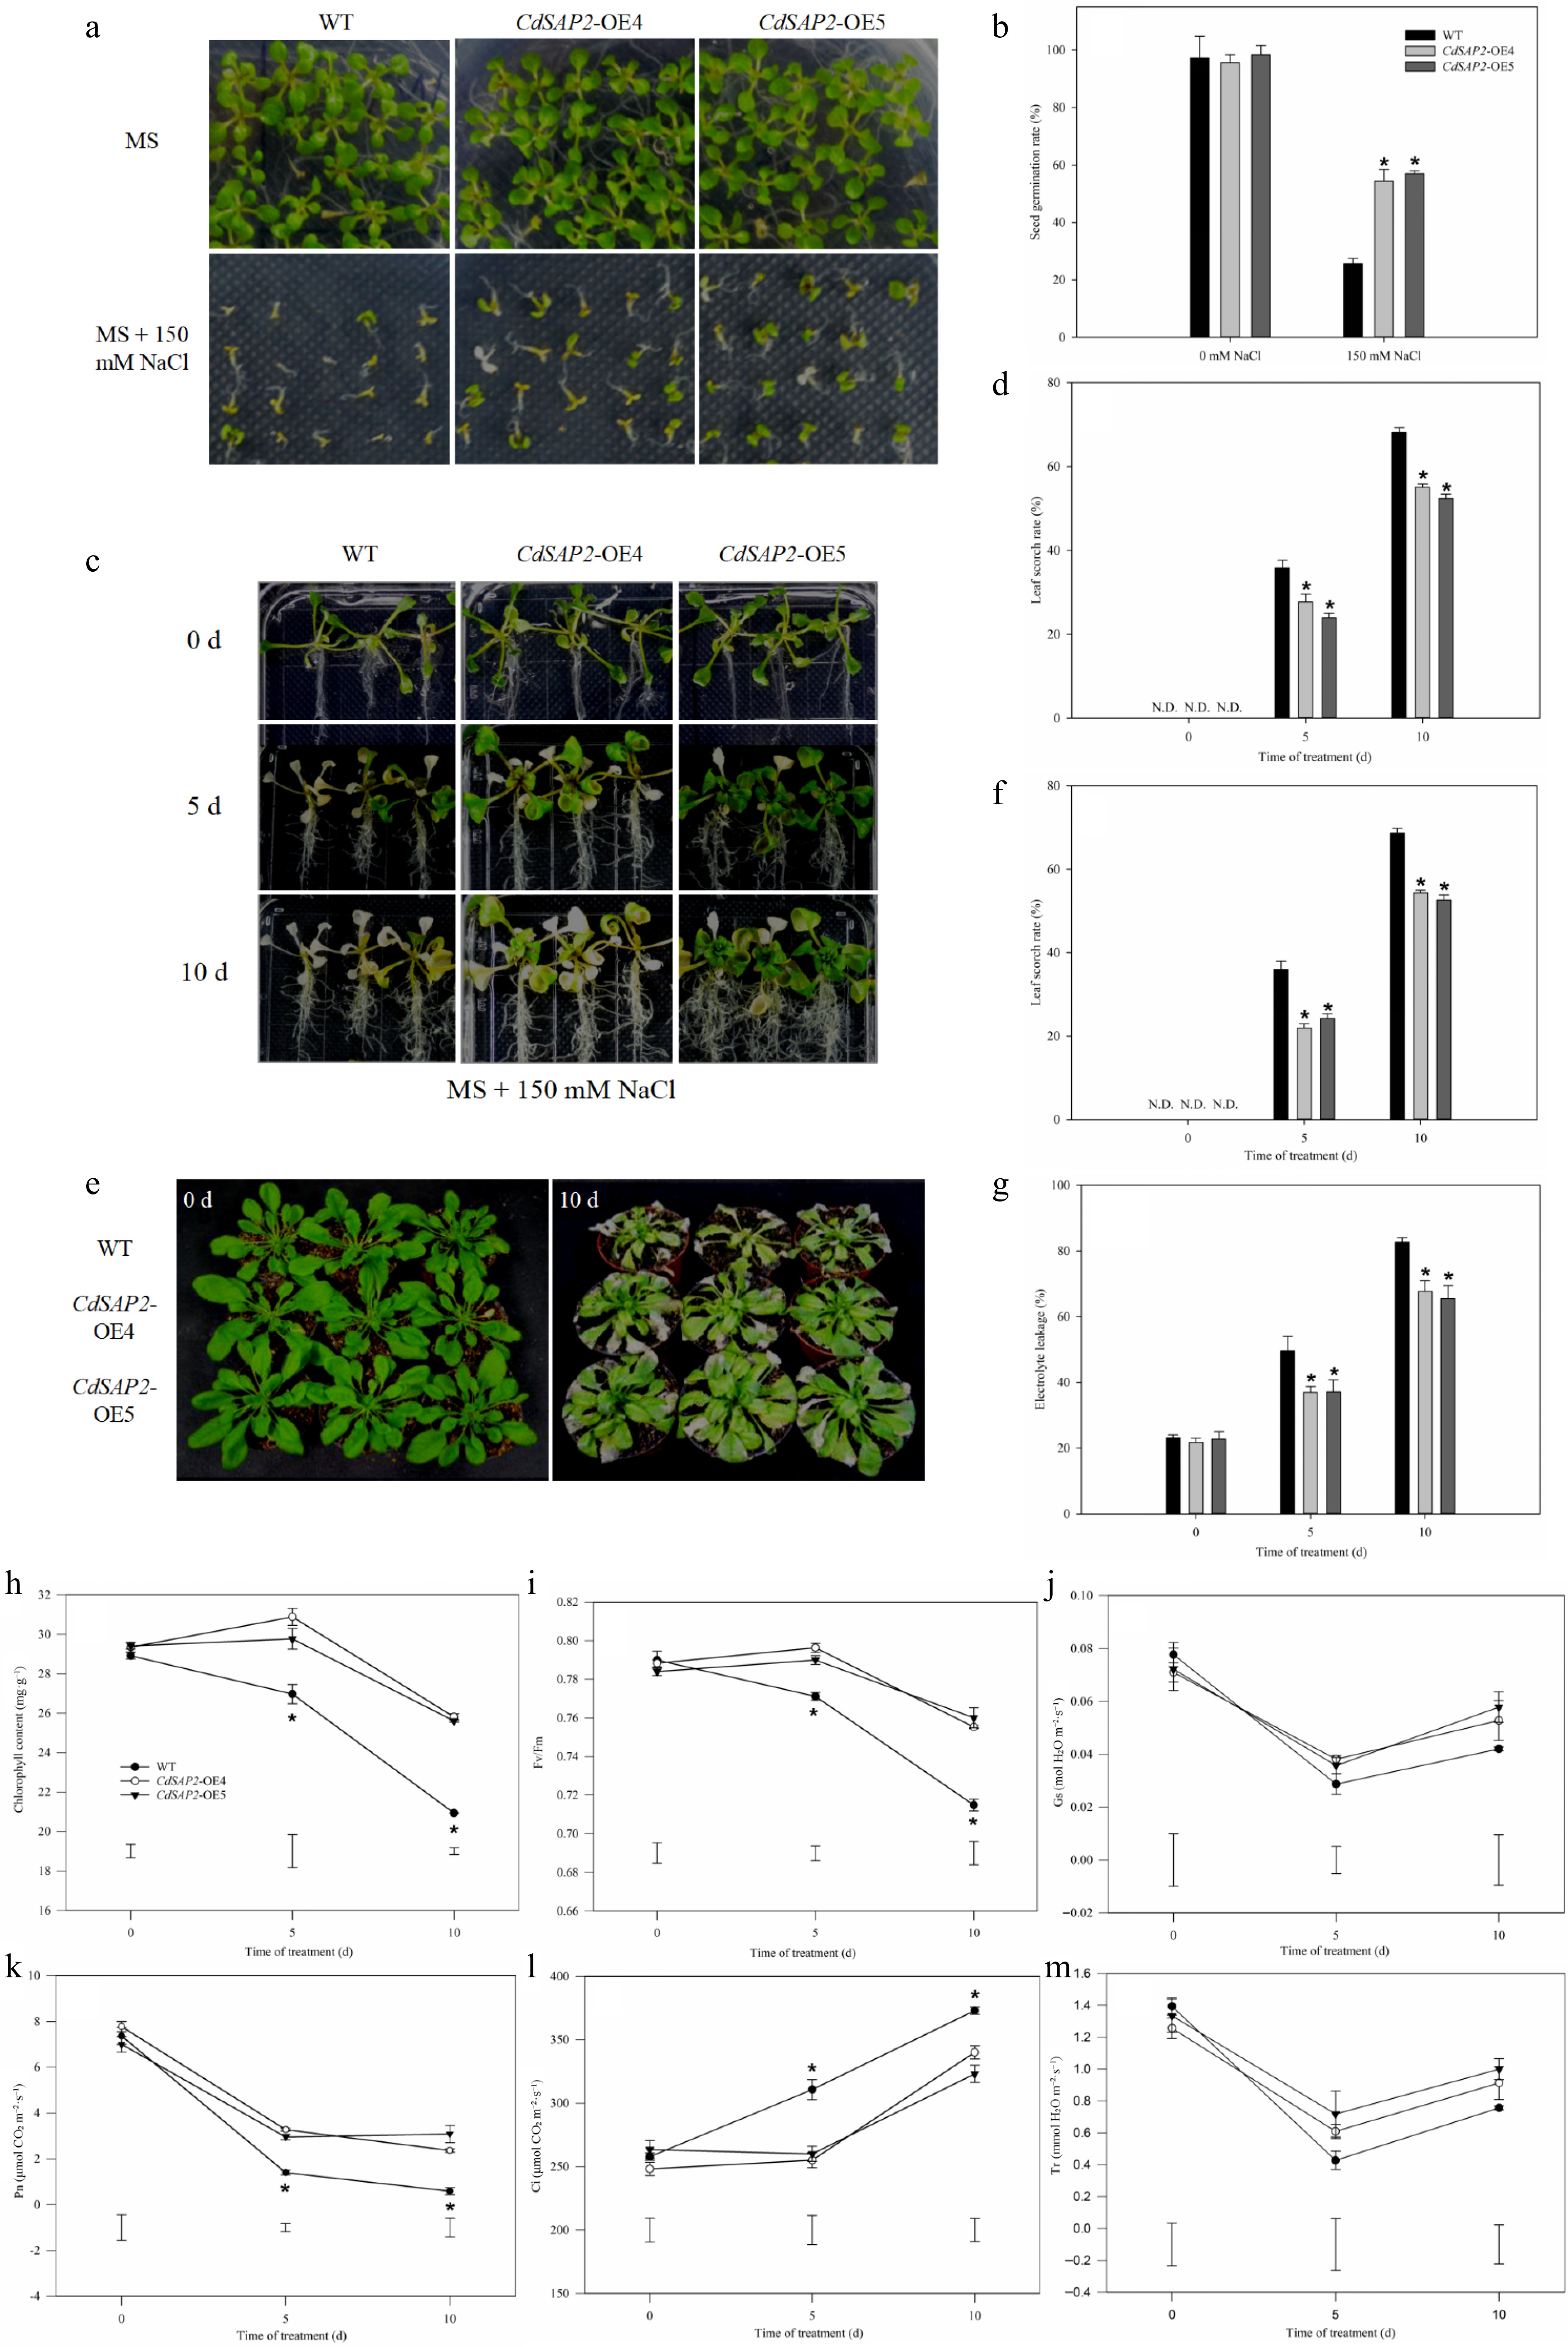
Figure 3.
CdSAP2-overexpression enhanced salt tolerance of Arabidopsis under salt stress. (a) Germination phenotype of WT and transgenic Arabidopsis on MS medium with 150 mM NaCl for 10 d. (b) Seed germination rate of WT and transgenic Arabidopsis on MS medium with 150 mM NaCl. (c) Salt tolerance phenotypes of WT and CdSAP2-overexpressing transgenic Arabidopsis on MS medium with 150 mM NaCl. (d) Statistical analysis of leaf scorch rate. (e) Salt tolerance phenotypes of WT and CdSAP2-overexpressing transgenic Arabidopsis in soil with 150 mM NaCl. (f) Statistical analysis of leaf scorch rate. (g) Statistical analysis of electrolyte leakage. (h) Chlorophyll content. (i) Photochemical efficiency (Fv/Fm). (j) Stomatal conductance (Gs). (k) Net photosynthetic rate (Pn). (l) Intercellular CO2 concentration (Ci). (m) Transpiration rate (Tr). N.D. means not detected. The leaf scorch rate was calculated by estimating the percentage of leaves that were scorched (white or pale color). Data shown were mean values ± SE of three independent biological replicates. Asterisks indicate significant differences according to Fisher's protected LSD test (p < 0.05).
-
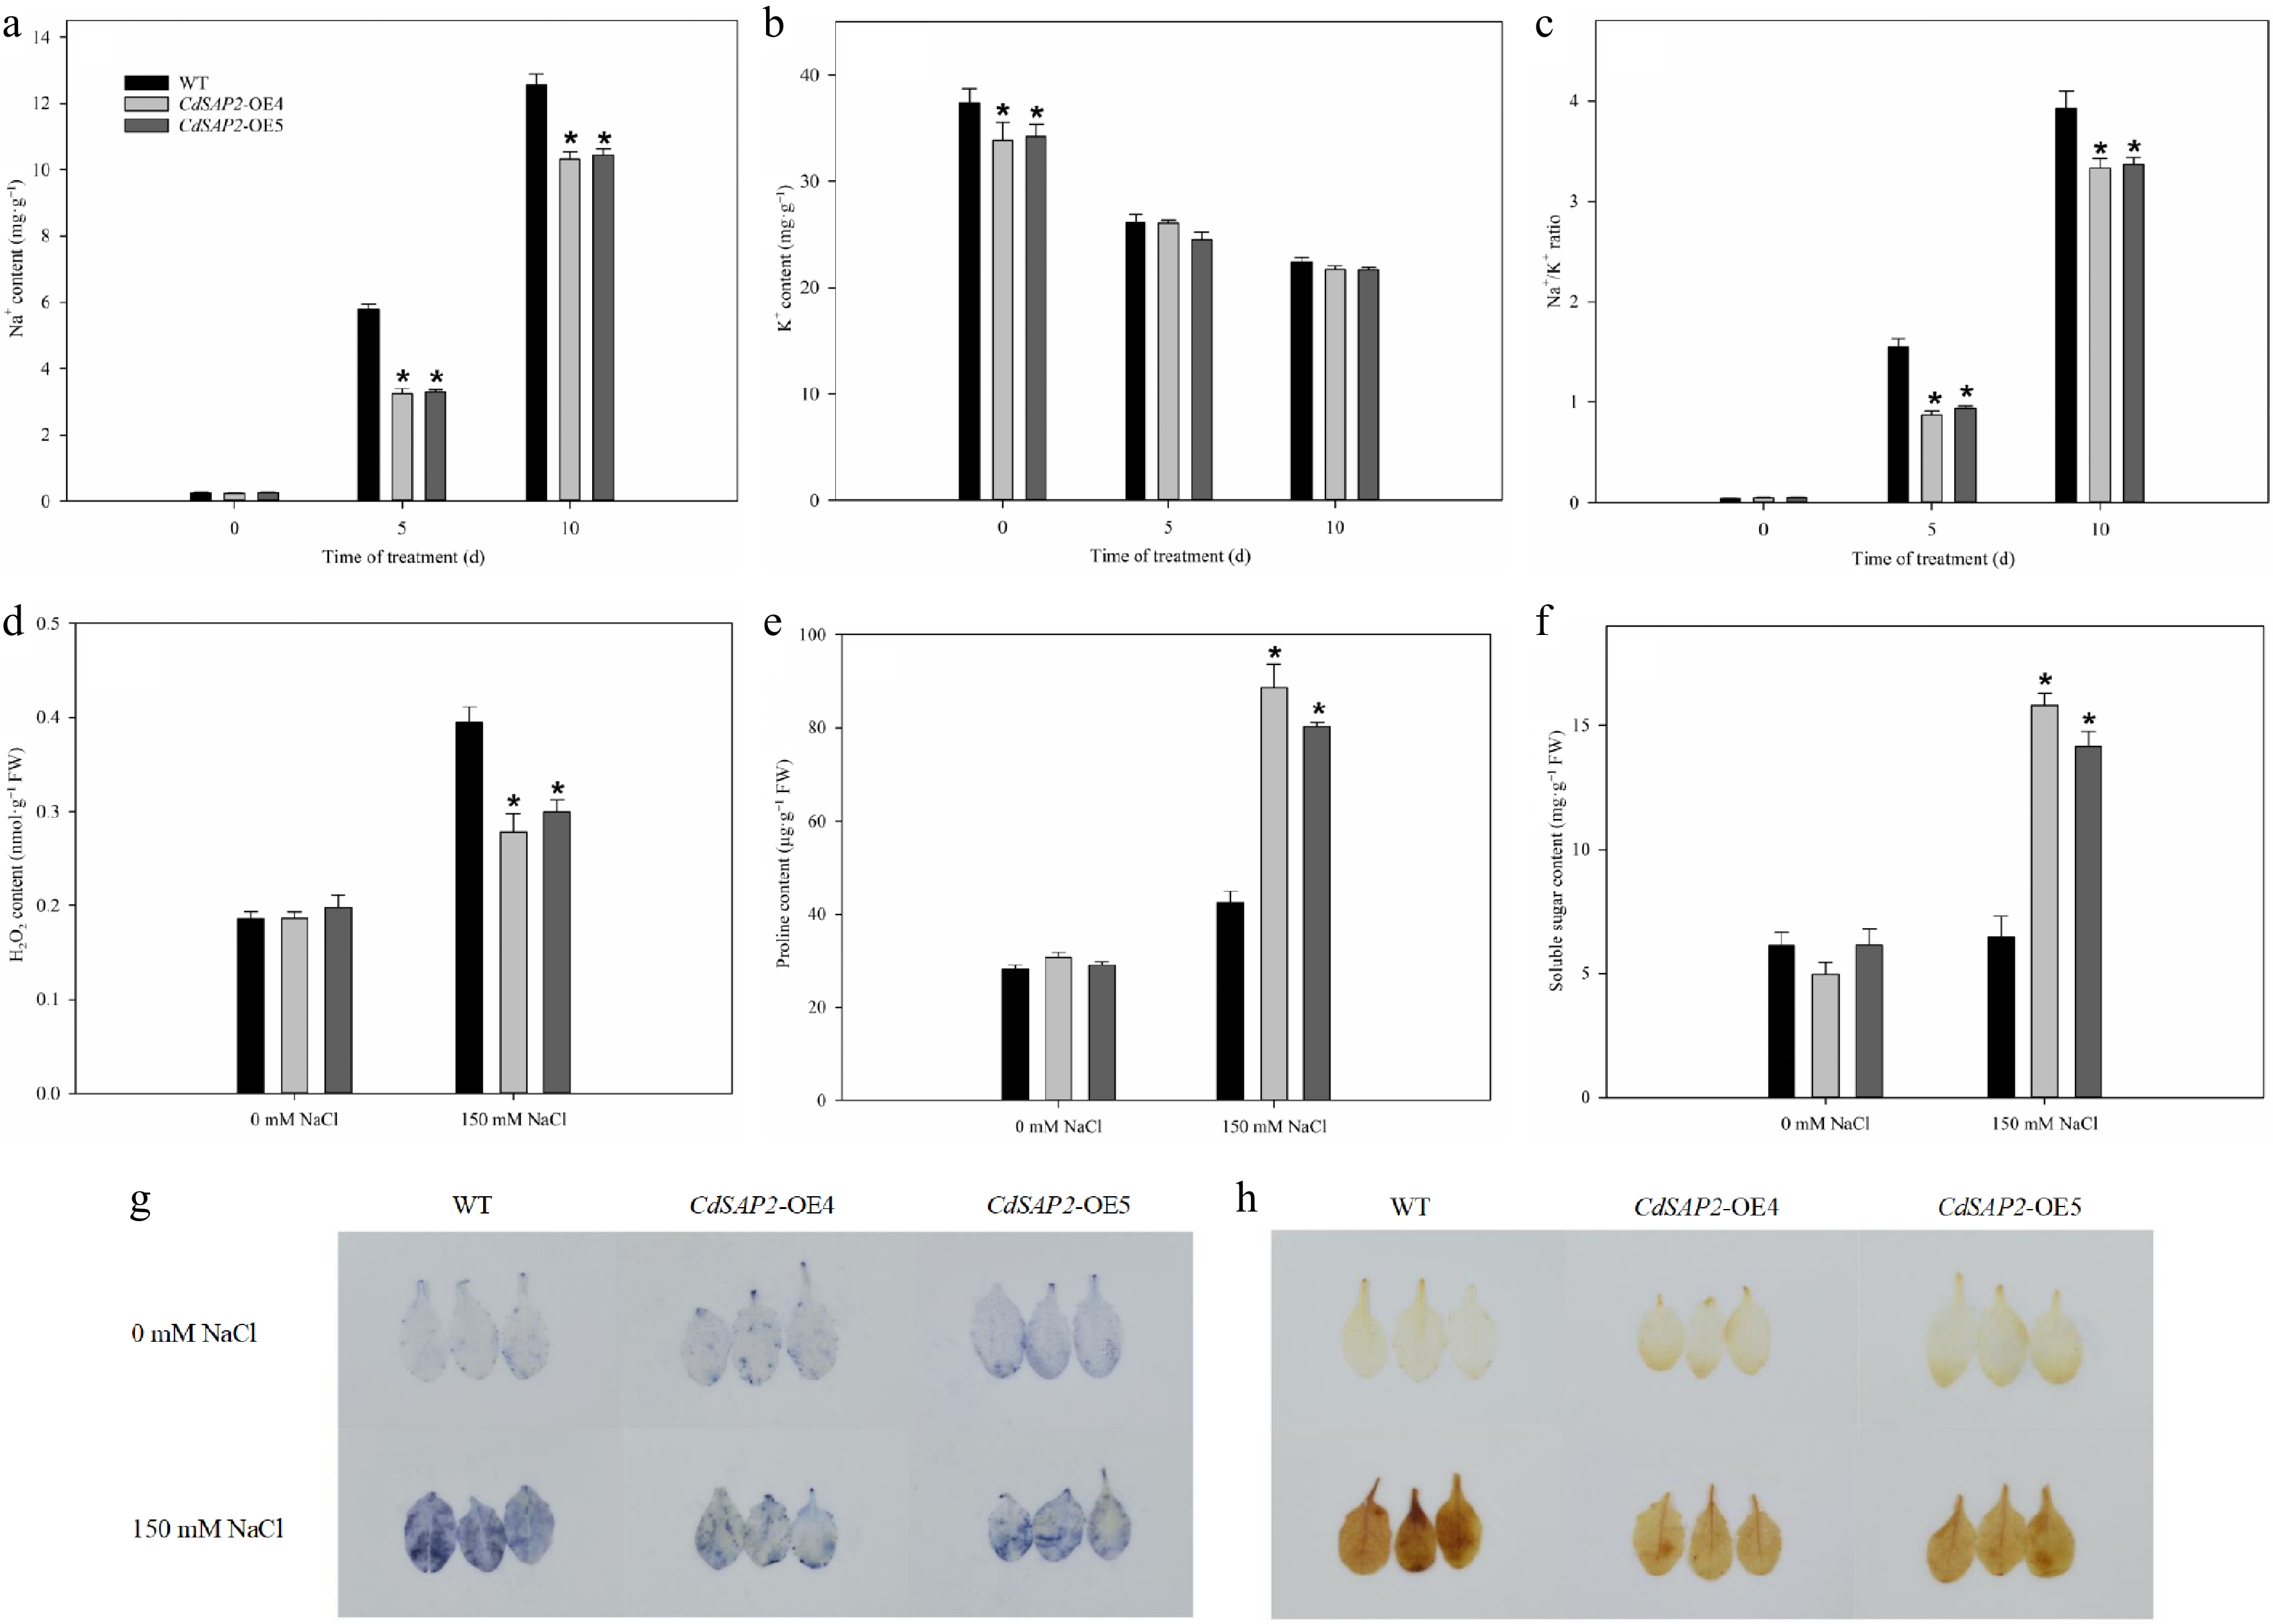
Figure 4.
Overexpression of CdSAP2 affected the content of ions, reactive oxygen species, and osmotic adjustment substances in Arabidopsis leaves under salt stress. (a) Na+ content. (b) K+ content. (c) Na+/K+ ratio. (d) H2O2 content. (e) Proline content. (f) Soluble sugar content. (g) O2·− accumulation by NBT staining. (h) H2O2 accumulation by DAB staining. Data shown were mean values ± SE of three independent biological replicates. Asterisks indicate significant differences according to Fisher's protected LSD test (p < 0.05).
-
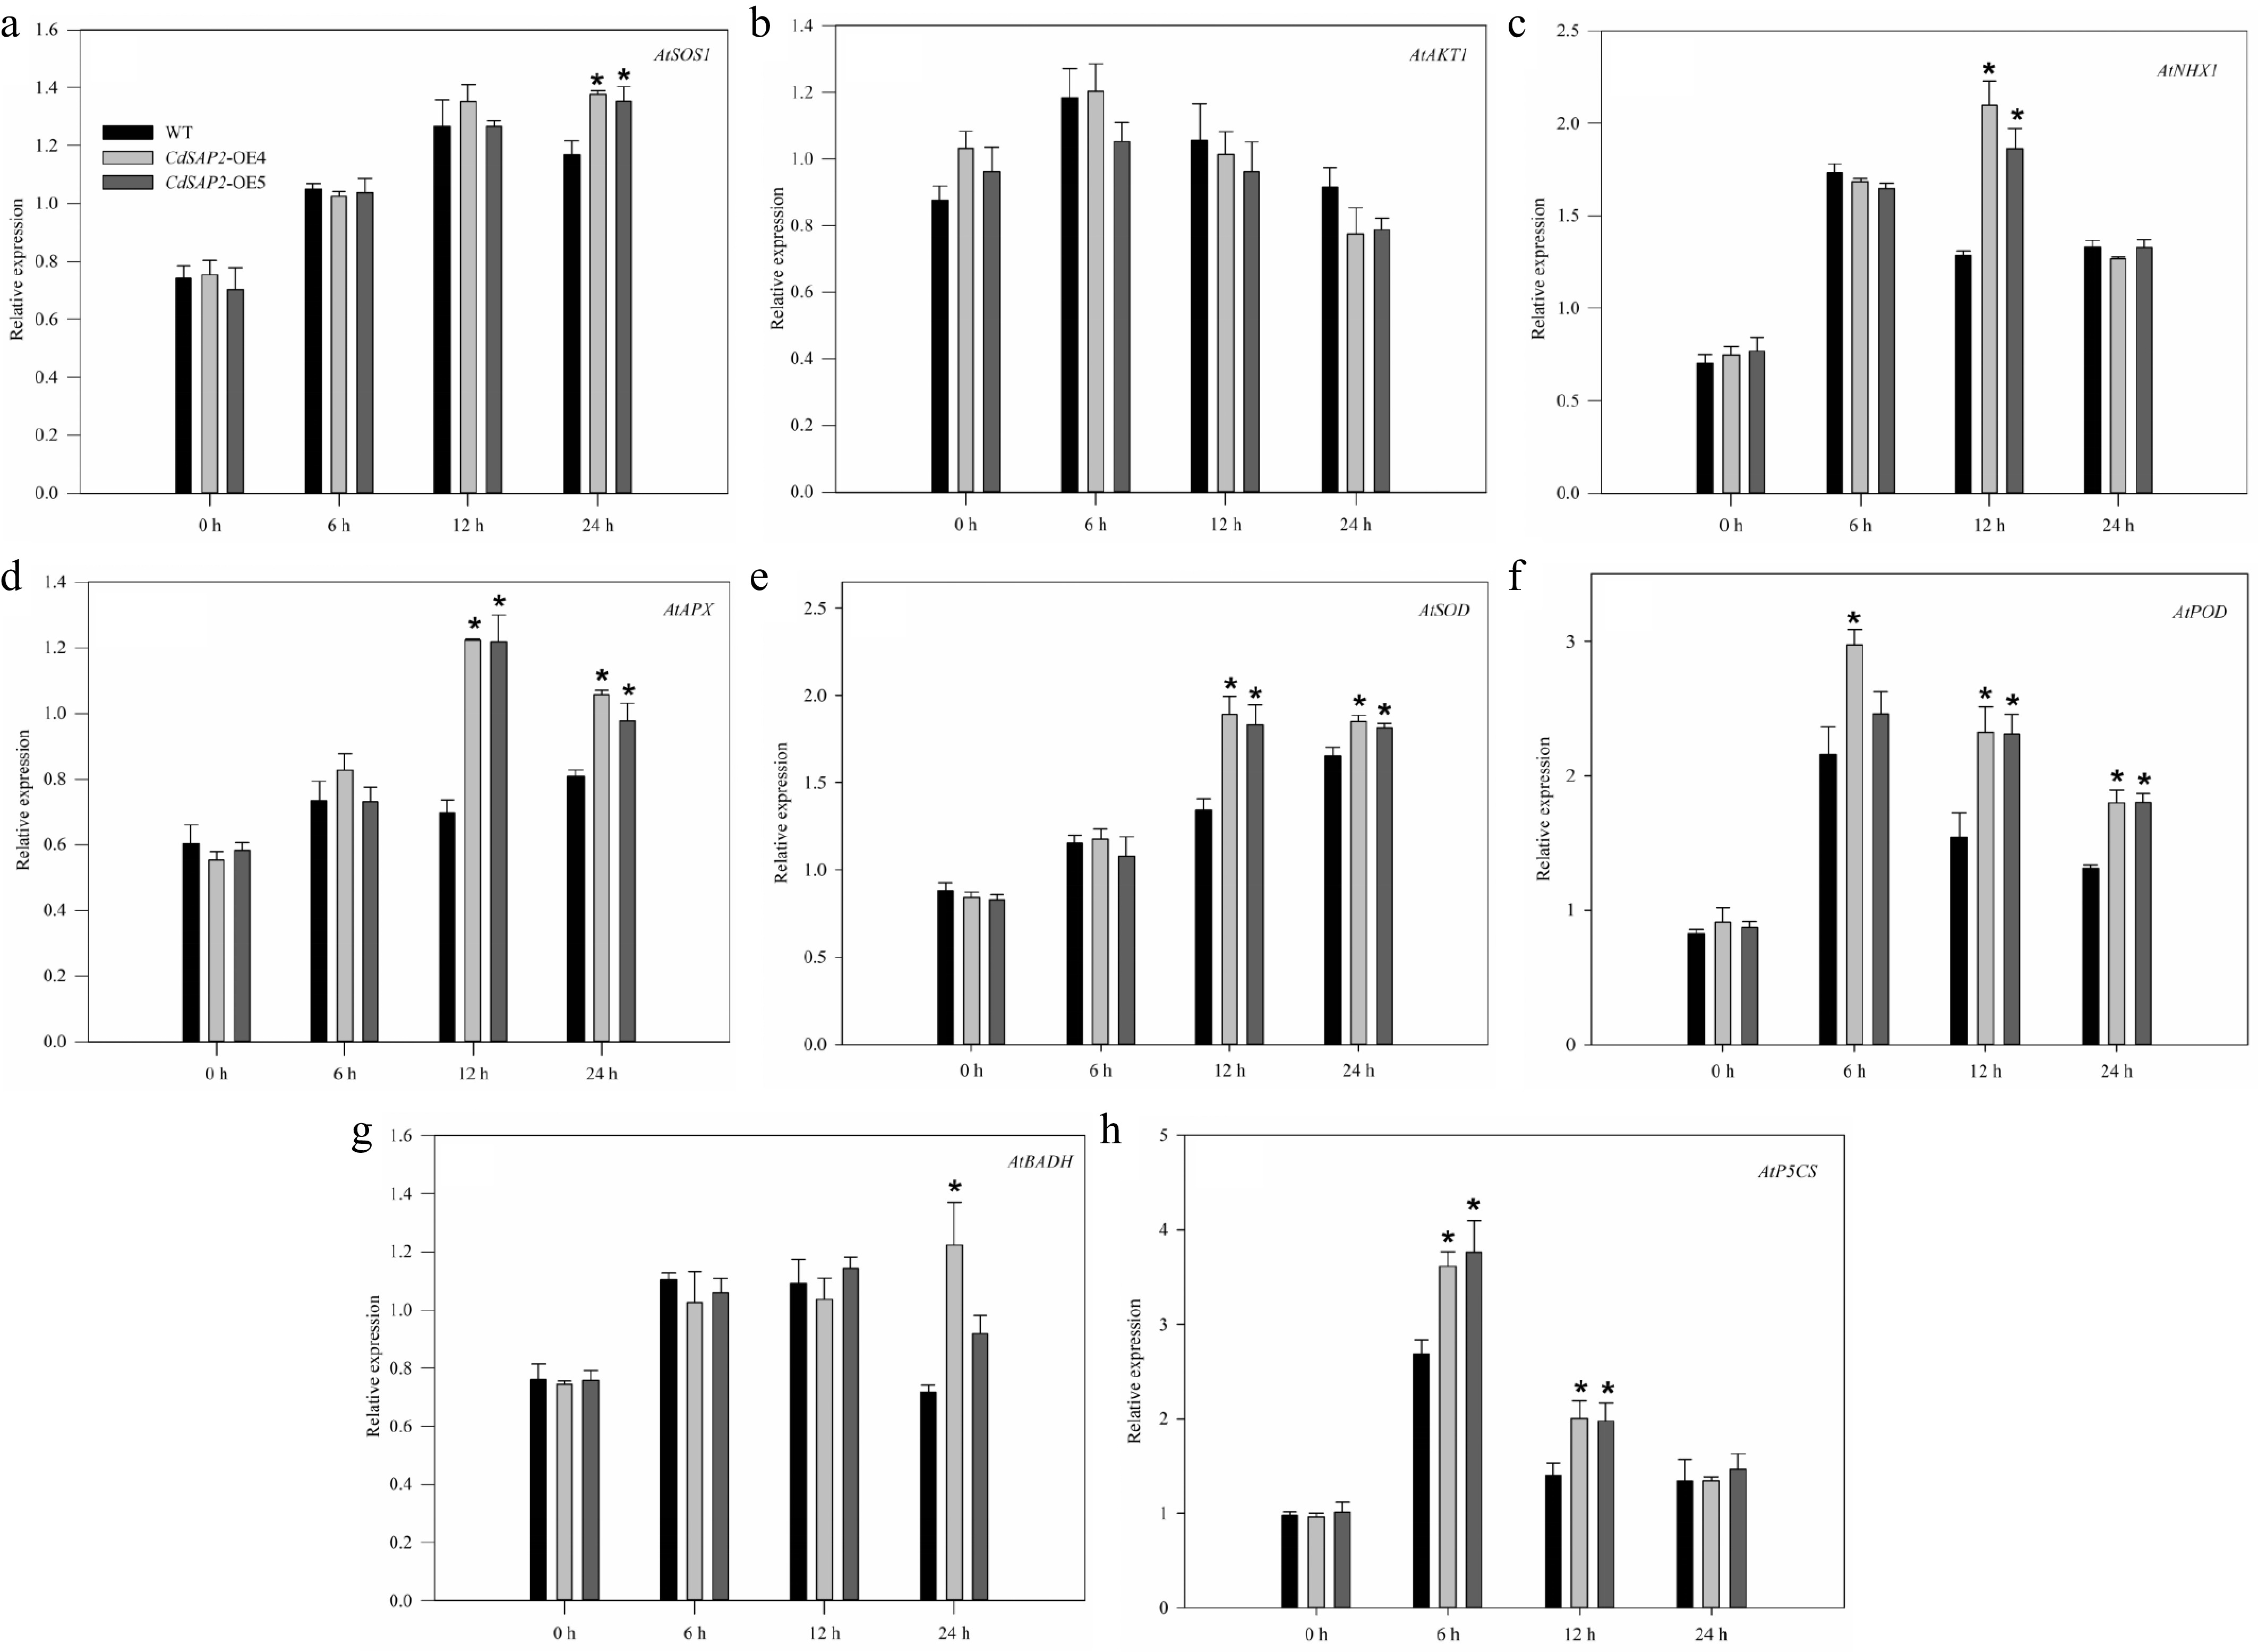
Figure 5.
Overexpression of CdSAP2 affected expression patterns of stress tolerance related genes in Arabidopsis leaves under salt stress. Data shown were mean values ± SE of three independent biological replicates. Asterisks indicate significant differences according to Fisher's protected LSD test (p < 0.05).
Figures
(5)
Tables
(0)