-
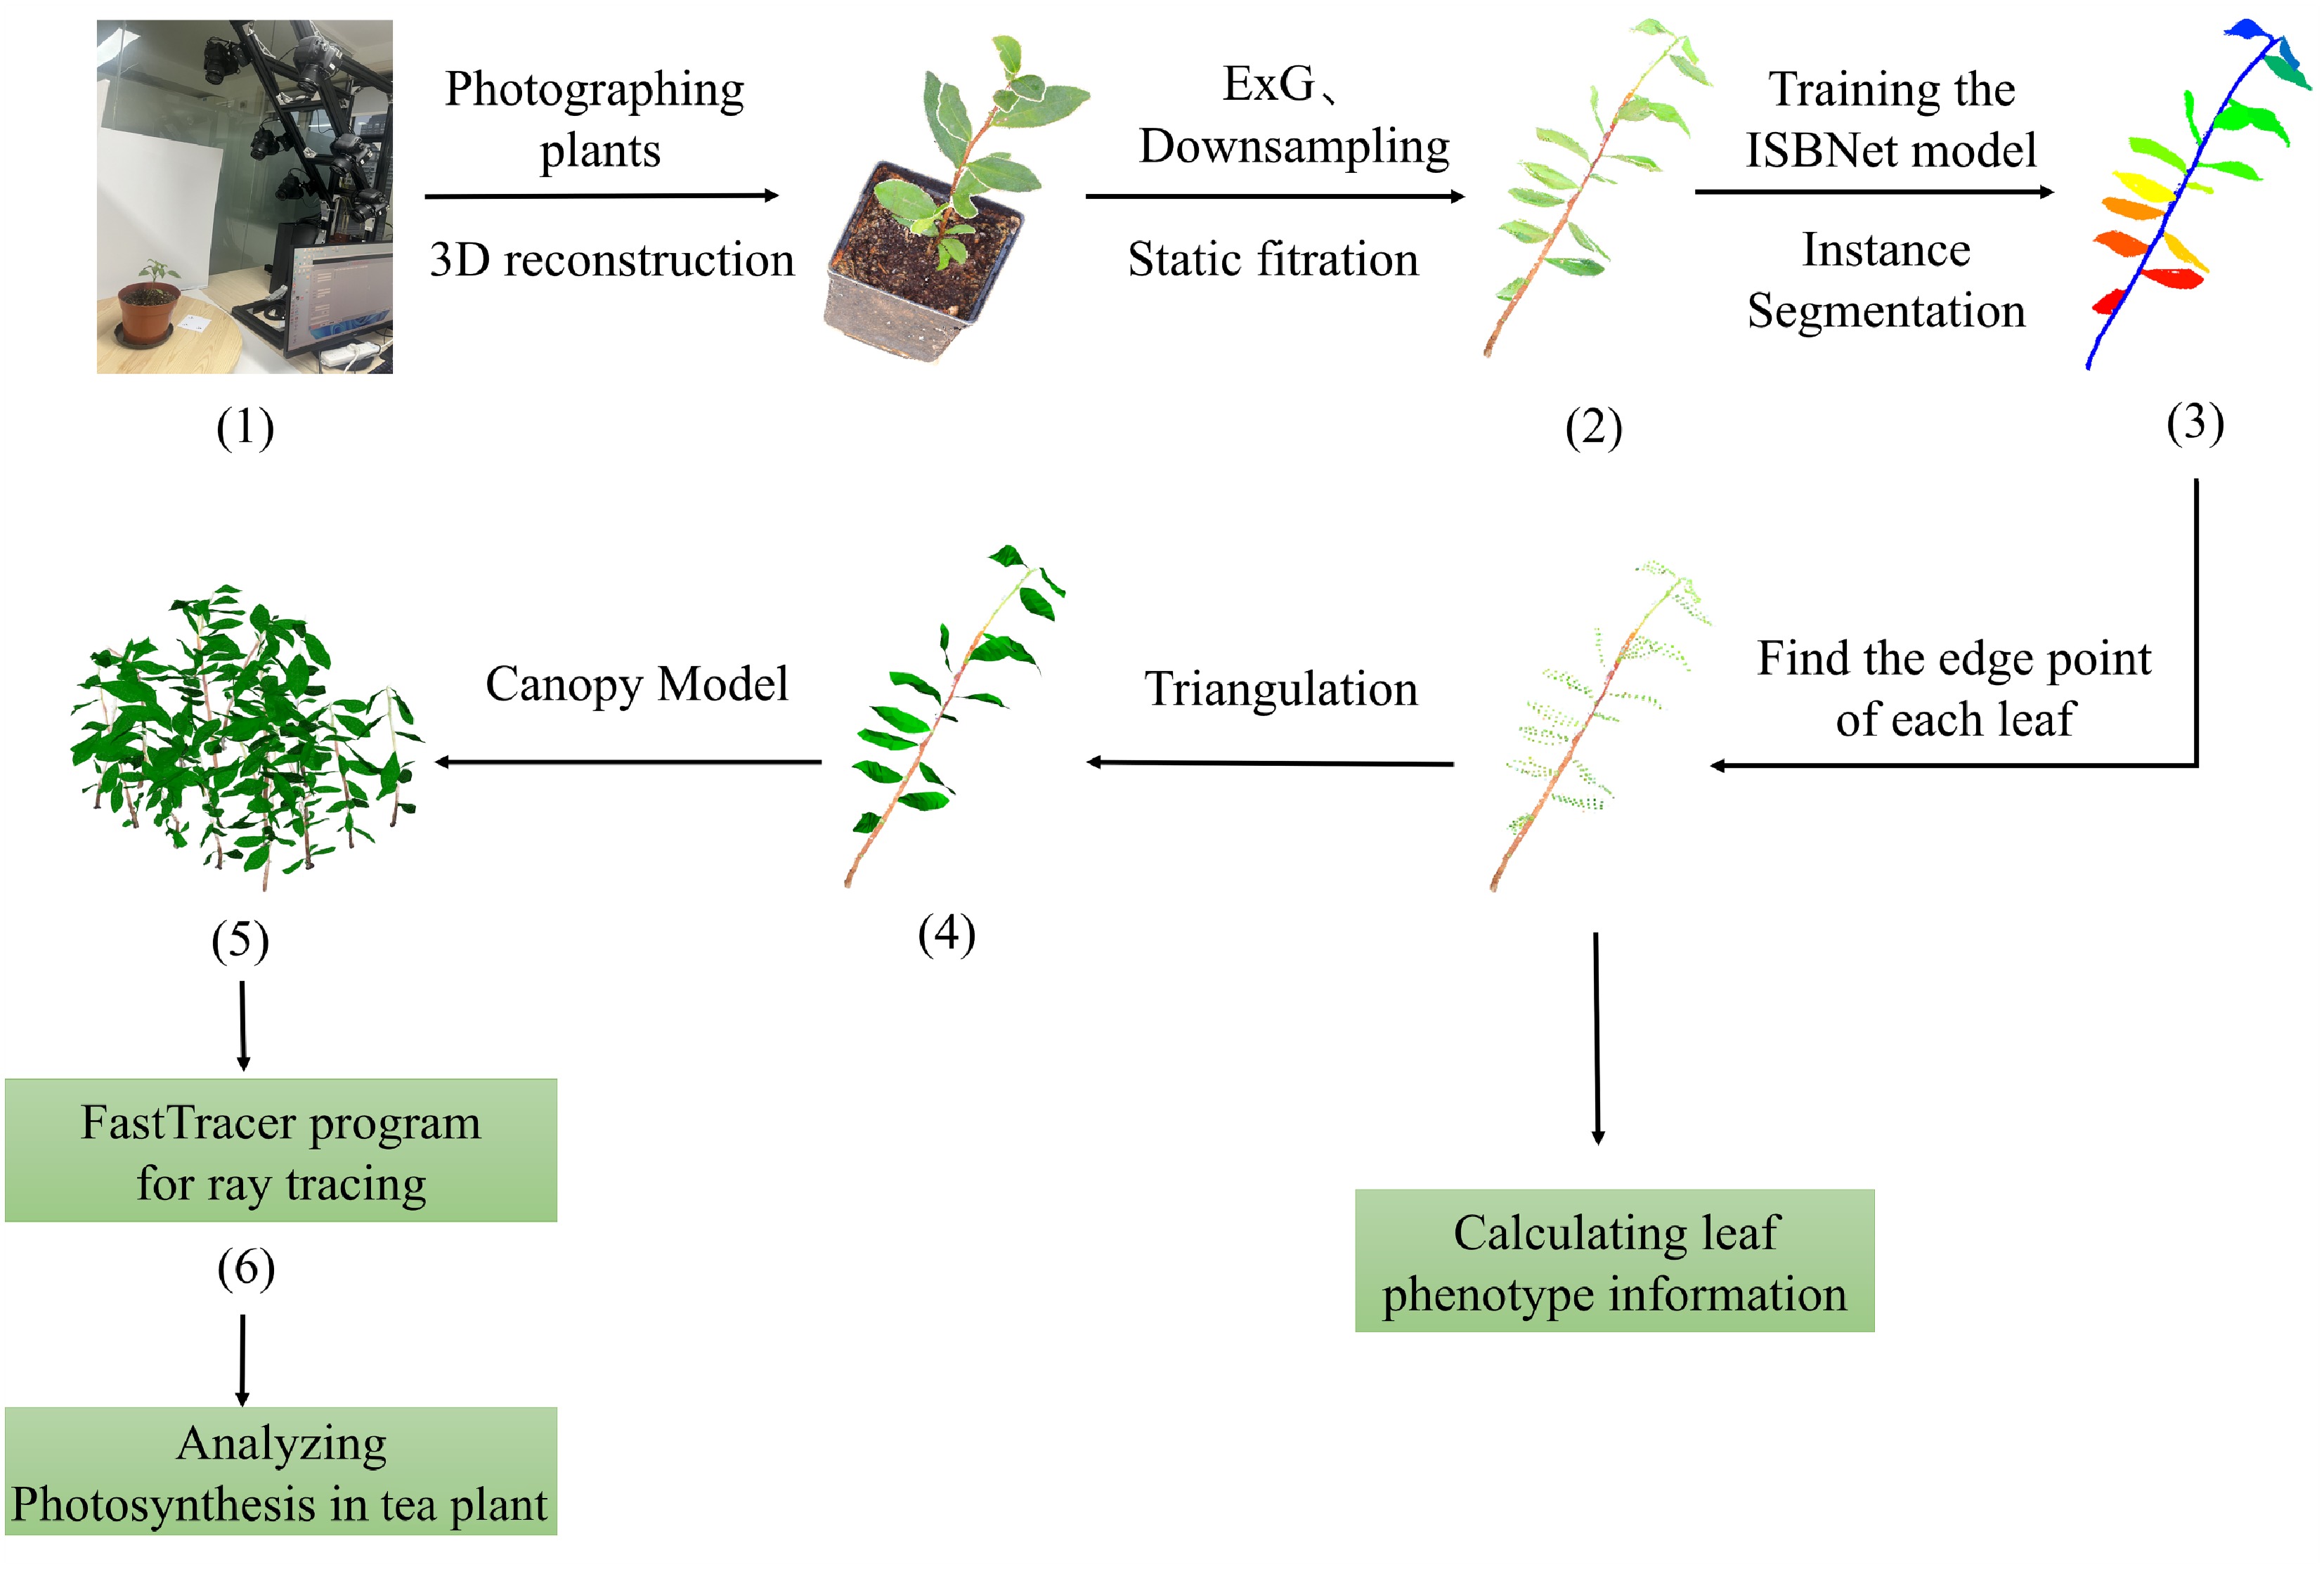
Figure 1.
Schematic overview of the computational workflow for canopy photosynthesis analysis in tea plant. The workflow progresses through the following stages. (1) Multi-view stereo imaging generates a high-resolution 3D point cloud of tea saplings. (2) Raw point clouds undergo preprocessing via Excess Green Index (ExG) filtering and voxel-based downsampling to remove noise and optimize the data density. (3) Instance-aware semantic segmentation using the ISBNet architecture isolates individual leaves from stems within the refined point cloud. (4) Application of the plant leaf meshing algorithm (PLMA) constructs biologically accurate triangular mesh models for segmented leaves. (5) Canopy architectural models are generated by integrating plant-specific 3D reconstructions with predefined planting configurations. (6) The FastTracer ray tracing platform simulates the spatiotemporal distribution of light (photosynthetic photon flux density, PPFD) within the canopy, enabling calculation of the photosynthetic rates and establishing quantitative assessment metrics for architectural optimization of tea plant.
-
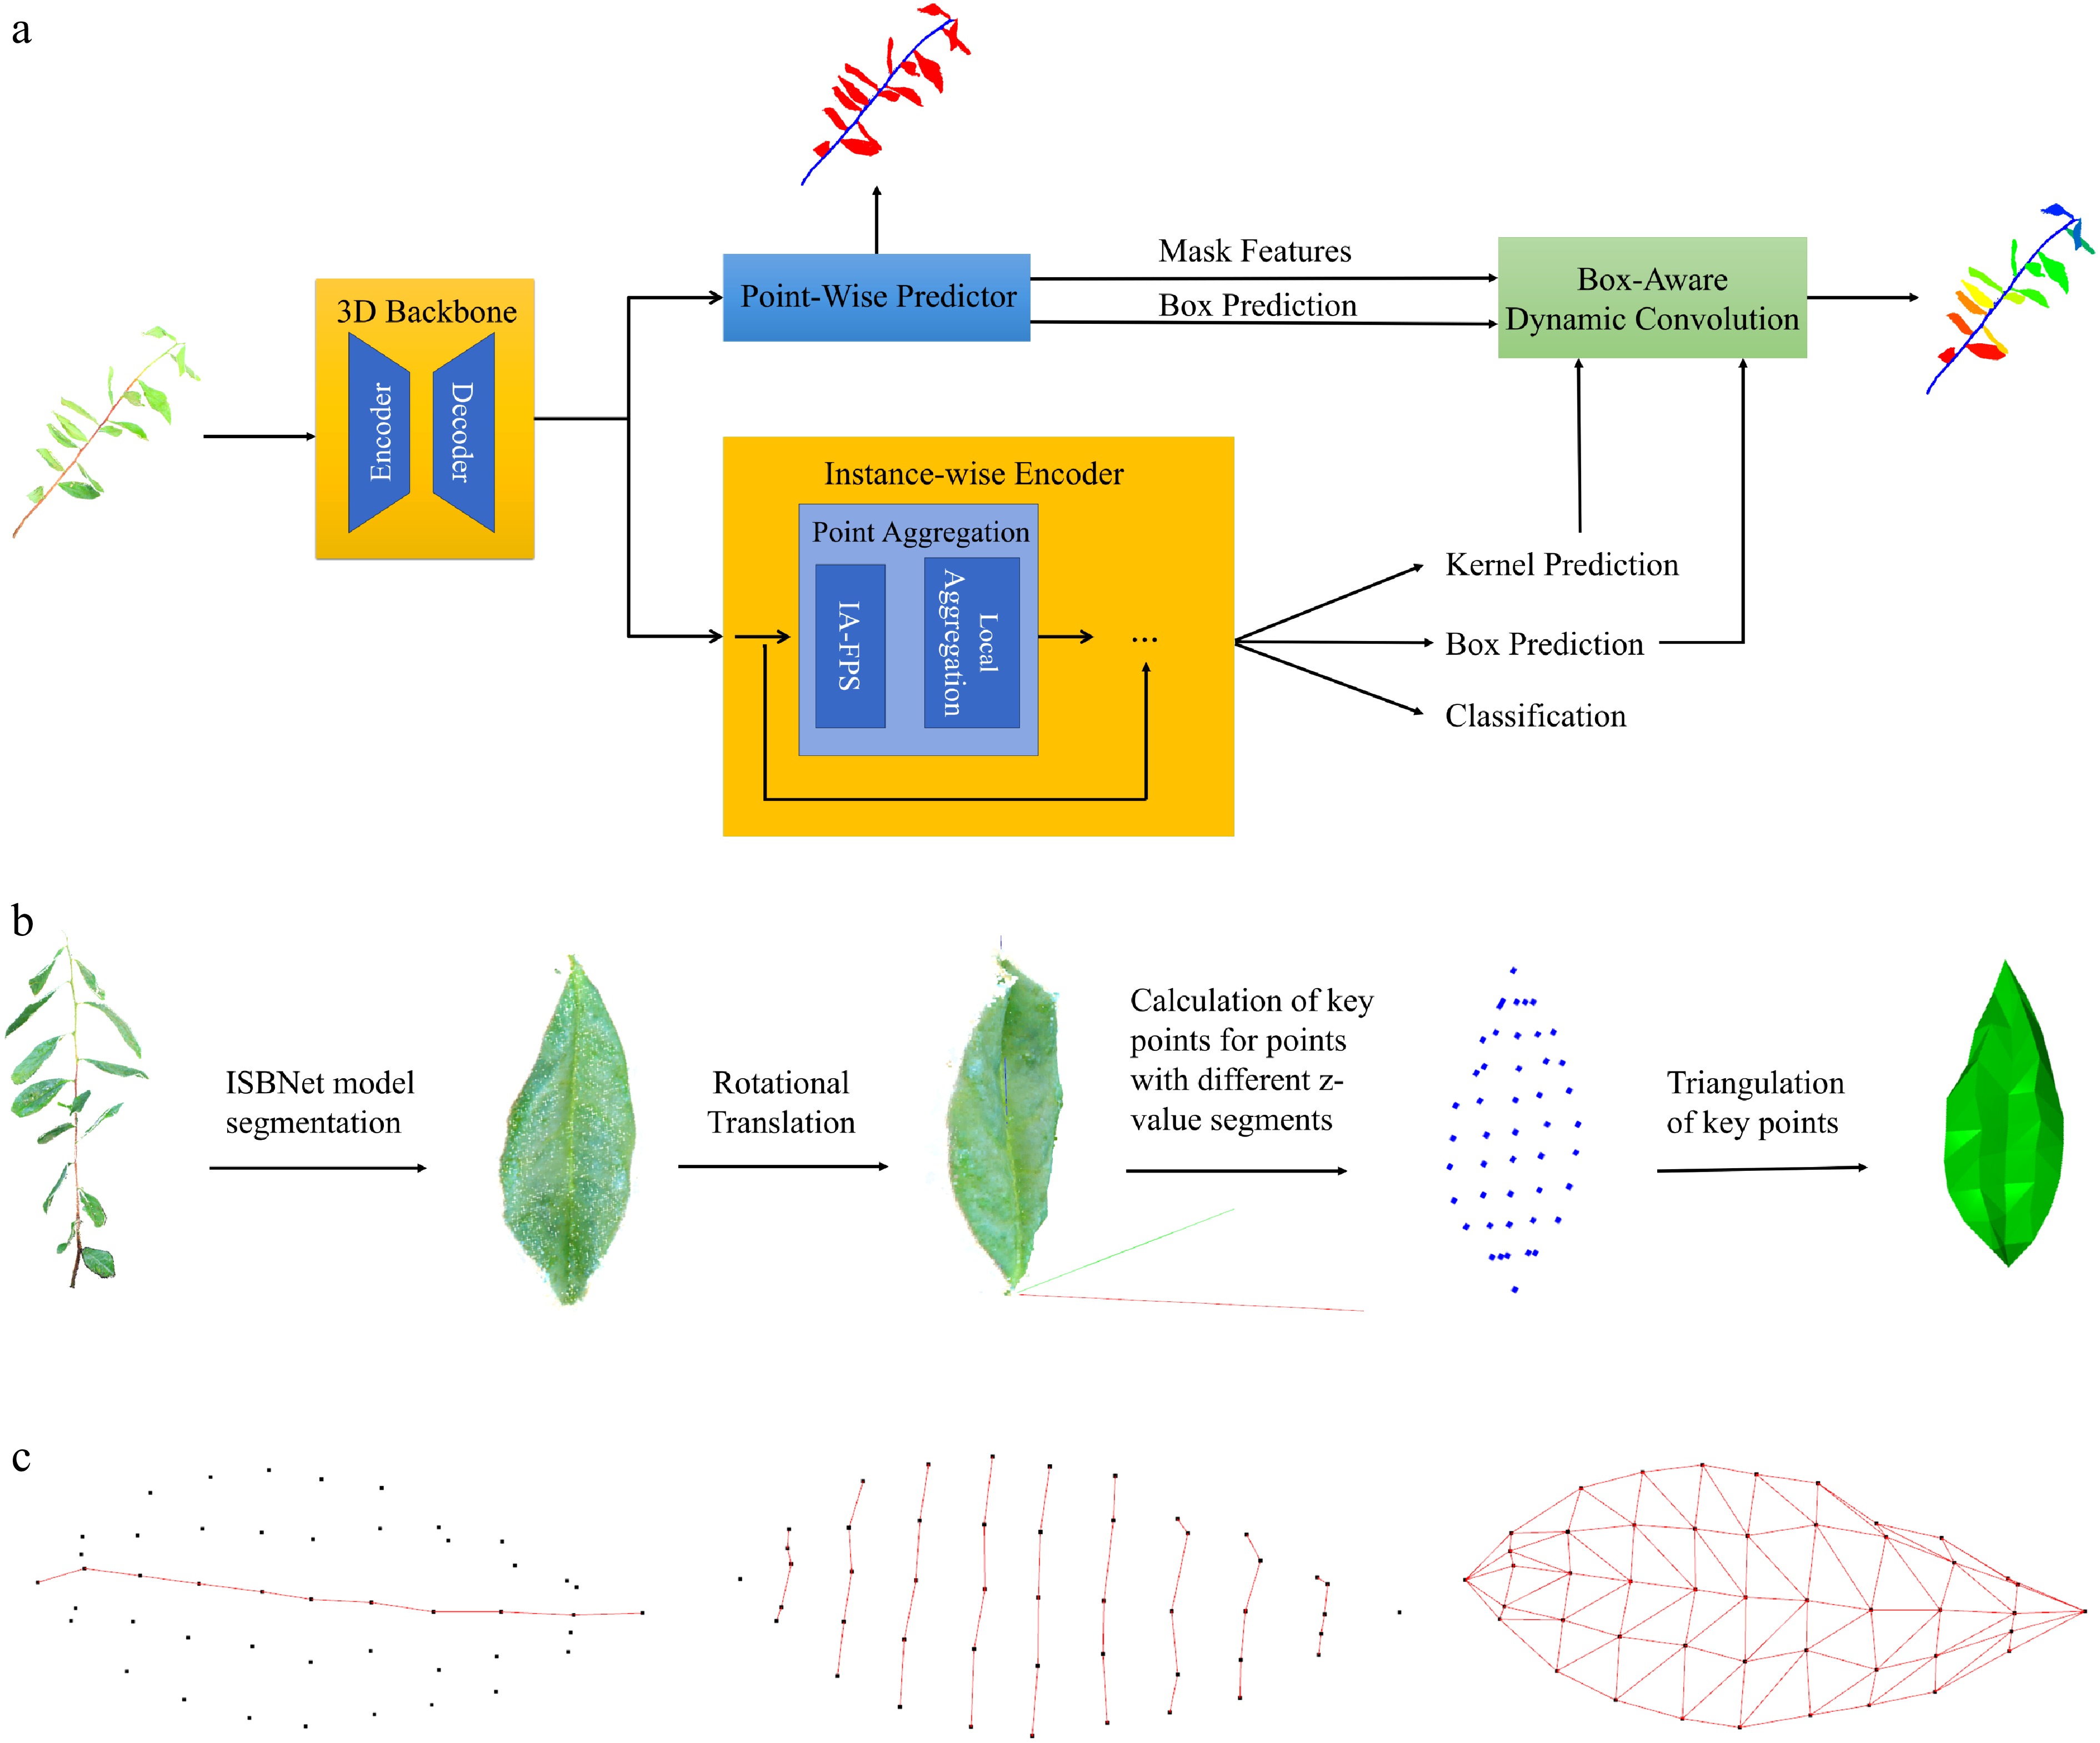
Figure 2.
Workflow of high-precision 3D instance segmentation and phenotypic trait extraction for tea plant. (a) Architectural workflow of the ISBNet model for high-precision 3D instance segmentation of tea plant point clouds. (b) Workflow of the PLMA for constructing 3D leaf models from tea plant point clouds. (c) Illustration of phenotypic parameter extraction from plant leaf models processed by the PLMA.
-
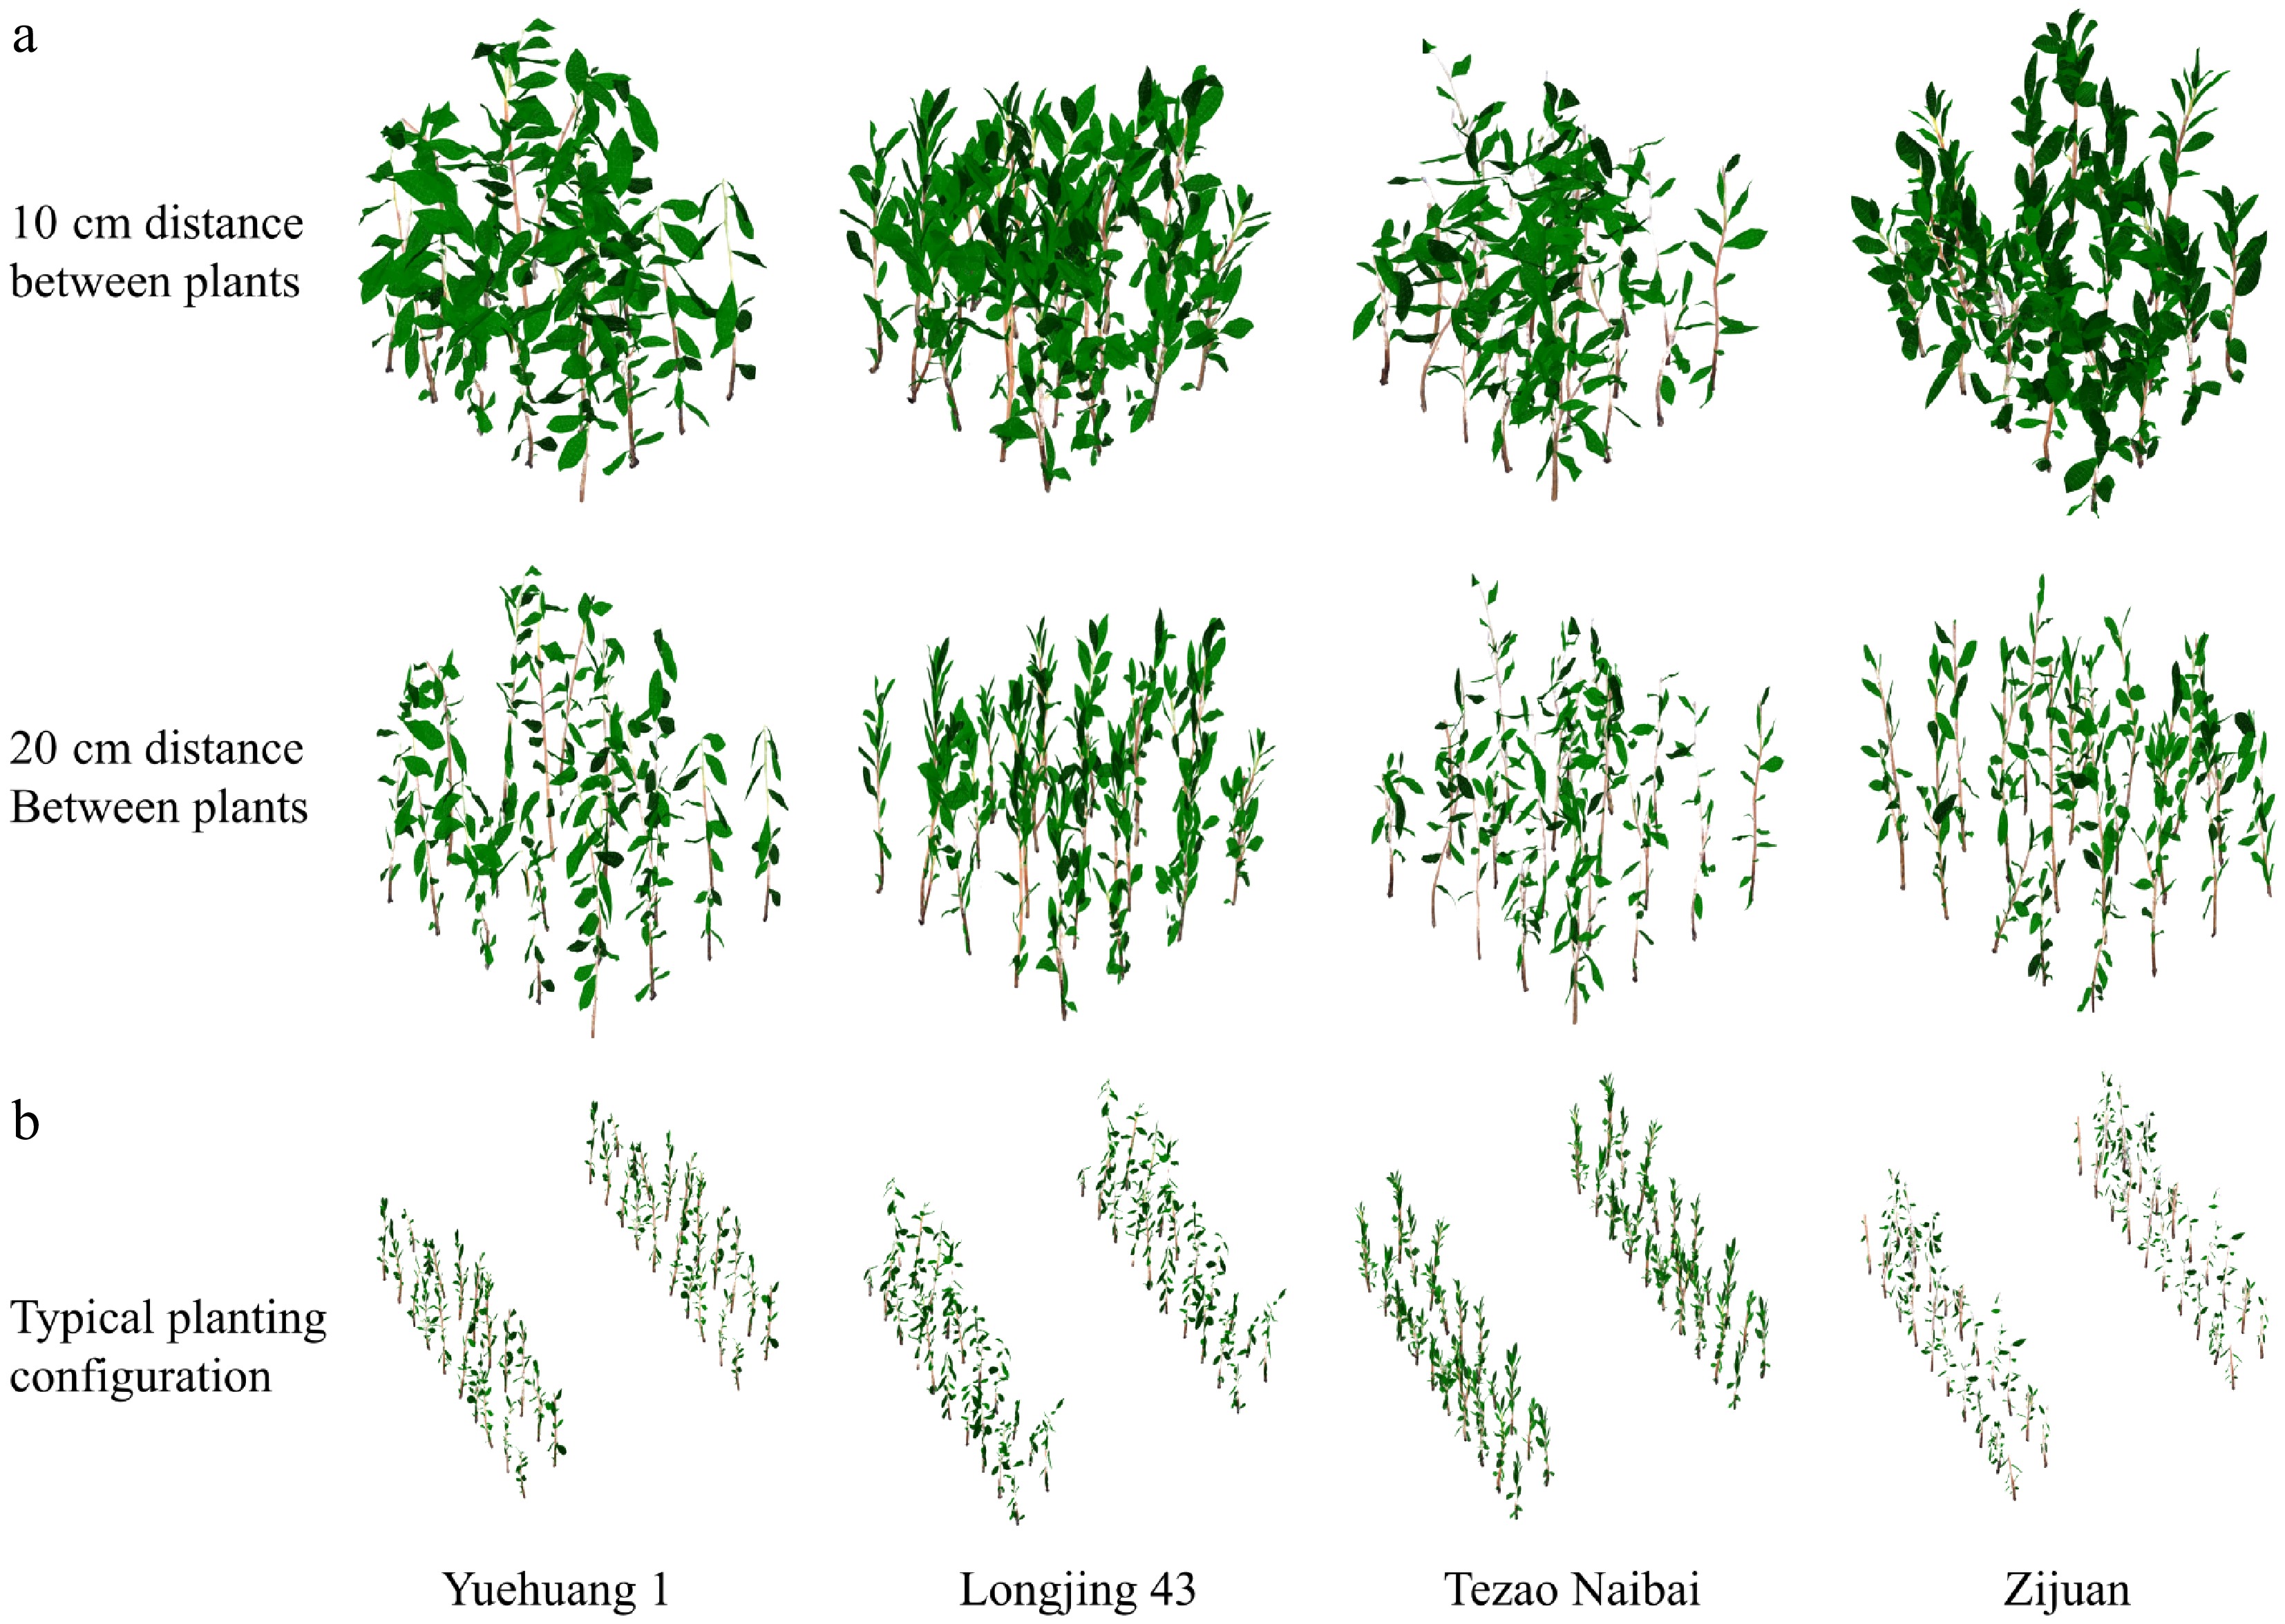
Figure 3.
Multi-scale modeling of the canopy photosynthesis characteristics of tea plant. (a) Schematic representations of canopy photosynthesis models for four tea plant cultivars ('Yuehuang 1', 'Longjing 43', 'Tezao Naibai', and 'Zijuan') are presented for two planting configurations: 10-cm inter-plant spacing (first row, left to right) and 20-cm inter-plant spacing (second row). Each row displays the 3D models in sequential columns corresponding to the listed cultivars. (b) Canopy photosynthesis models for the four tea plant cultivars under a typical planting configuration, depicting the spatial arrangement. Each paired row configuration features a wide inter-row spacing of 150 cm, with an inter-plant spacing of 30 cm between adjacent saplings within the paired rows.
-
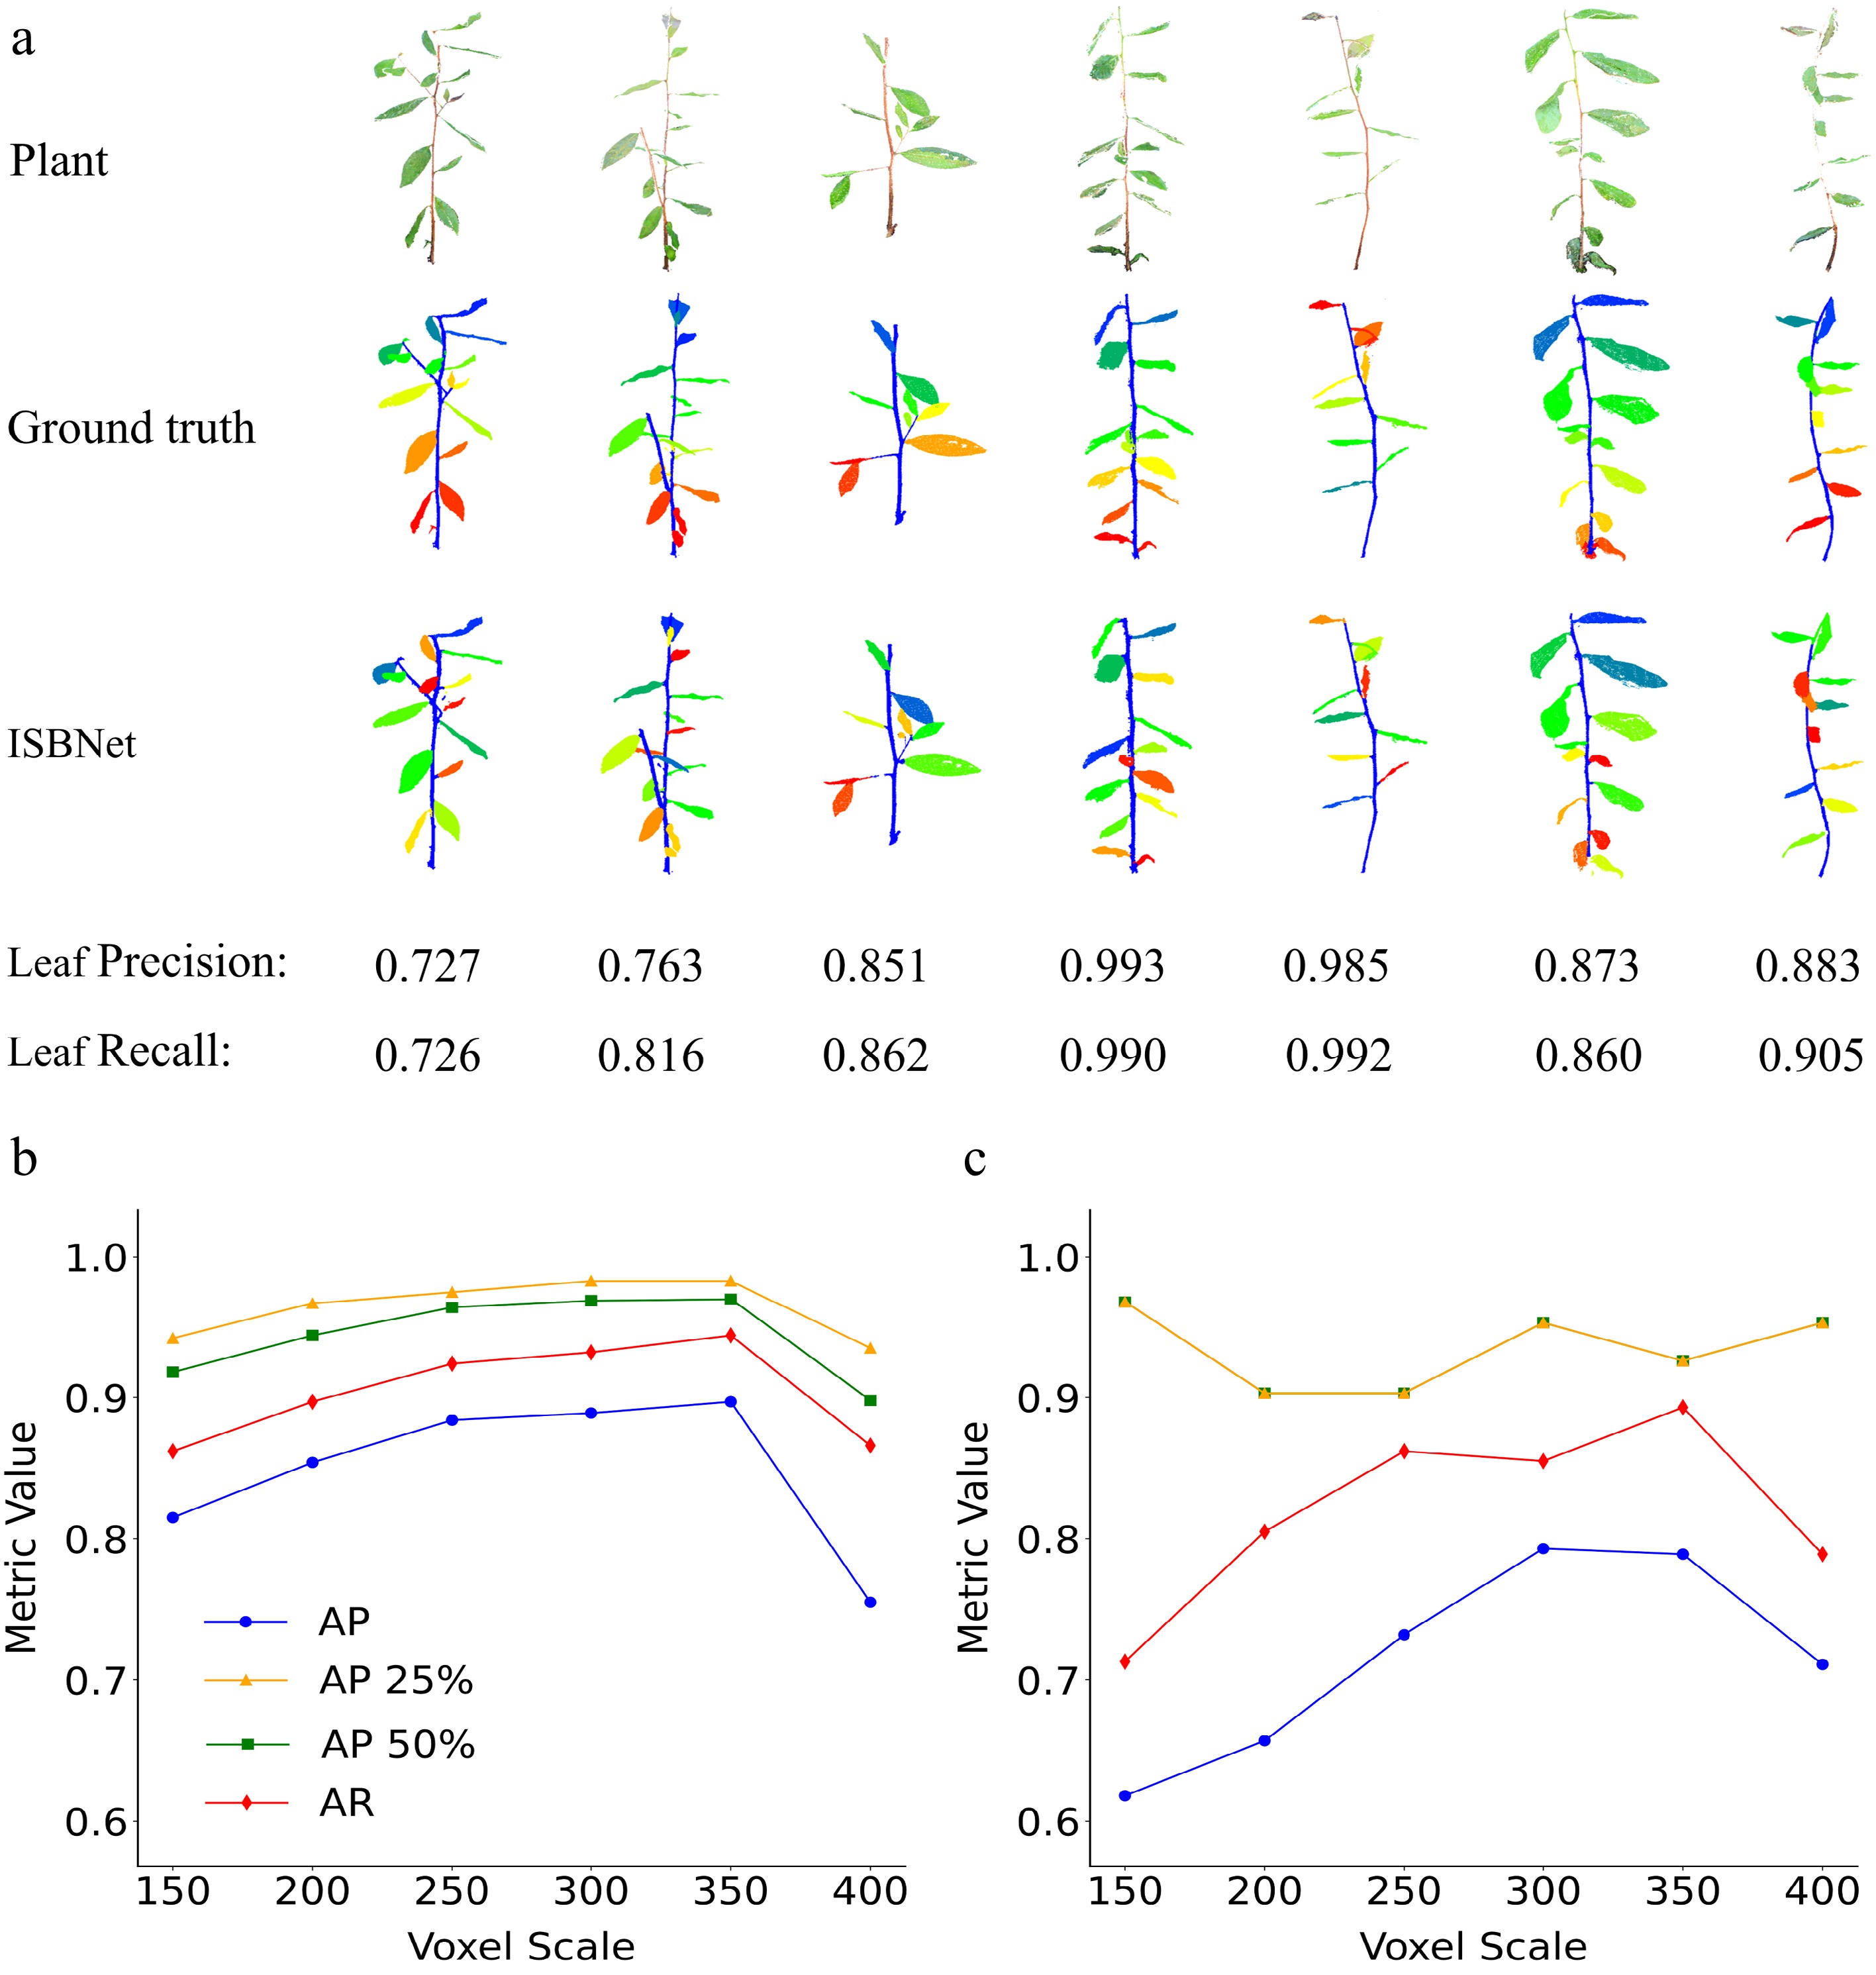
Figure 4.
Instance segmentation and performance evaluation of tea plant point clouds using ISBNet. (a) Schematic representation of the 3D point cloud segmentation workflow for tea plant saplings. Raw 3D point cloud data were acquired via multi-view stereo imaging (XYZ + RGB data). Ground-truth annotation: Expert-annotated labels were generated using CloudCompare v2.13, distinguishing stems (blue) and individual leaves (distinct colors) for supervised training. ISBNet Segmentation Output: Instance-aware semantic segmentation results, demonstrating precise organ-level separation with minimal boundary artifacts. This comparative visualization validates the model's capability to replicate the accuracy of manual annotation while enabling automated high-throughput phenotyping. Accuracy of (b) leaf segmentation across different voxel scale settings and (c) stem segmentation under varying voxel scales.
-
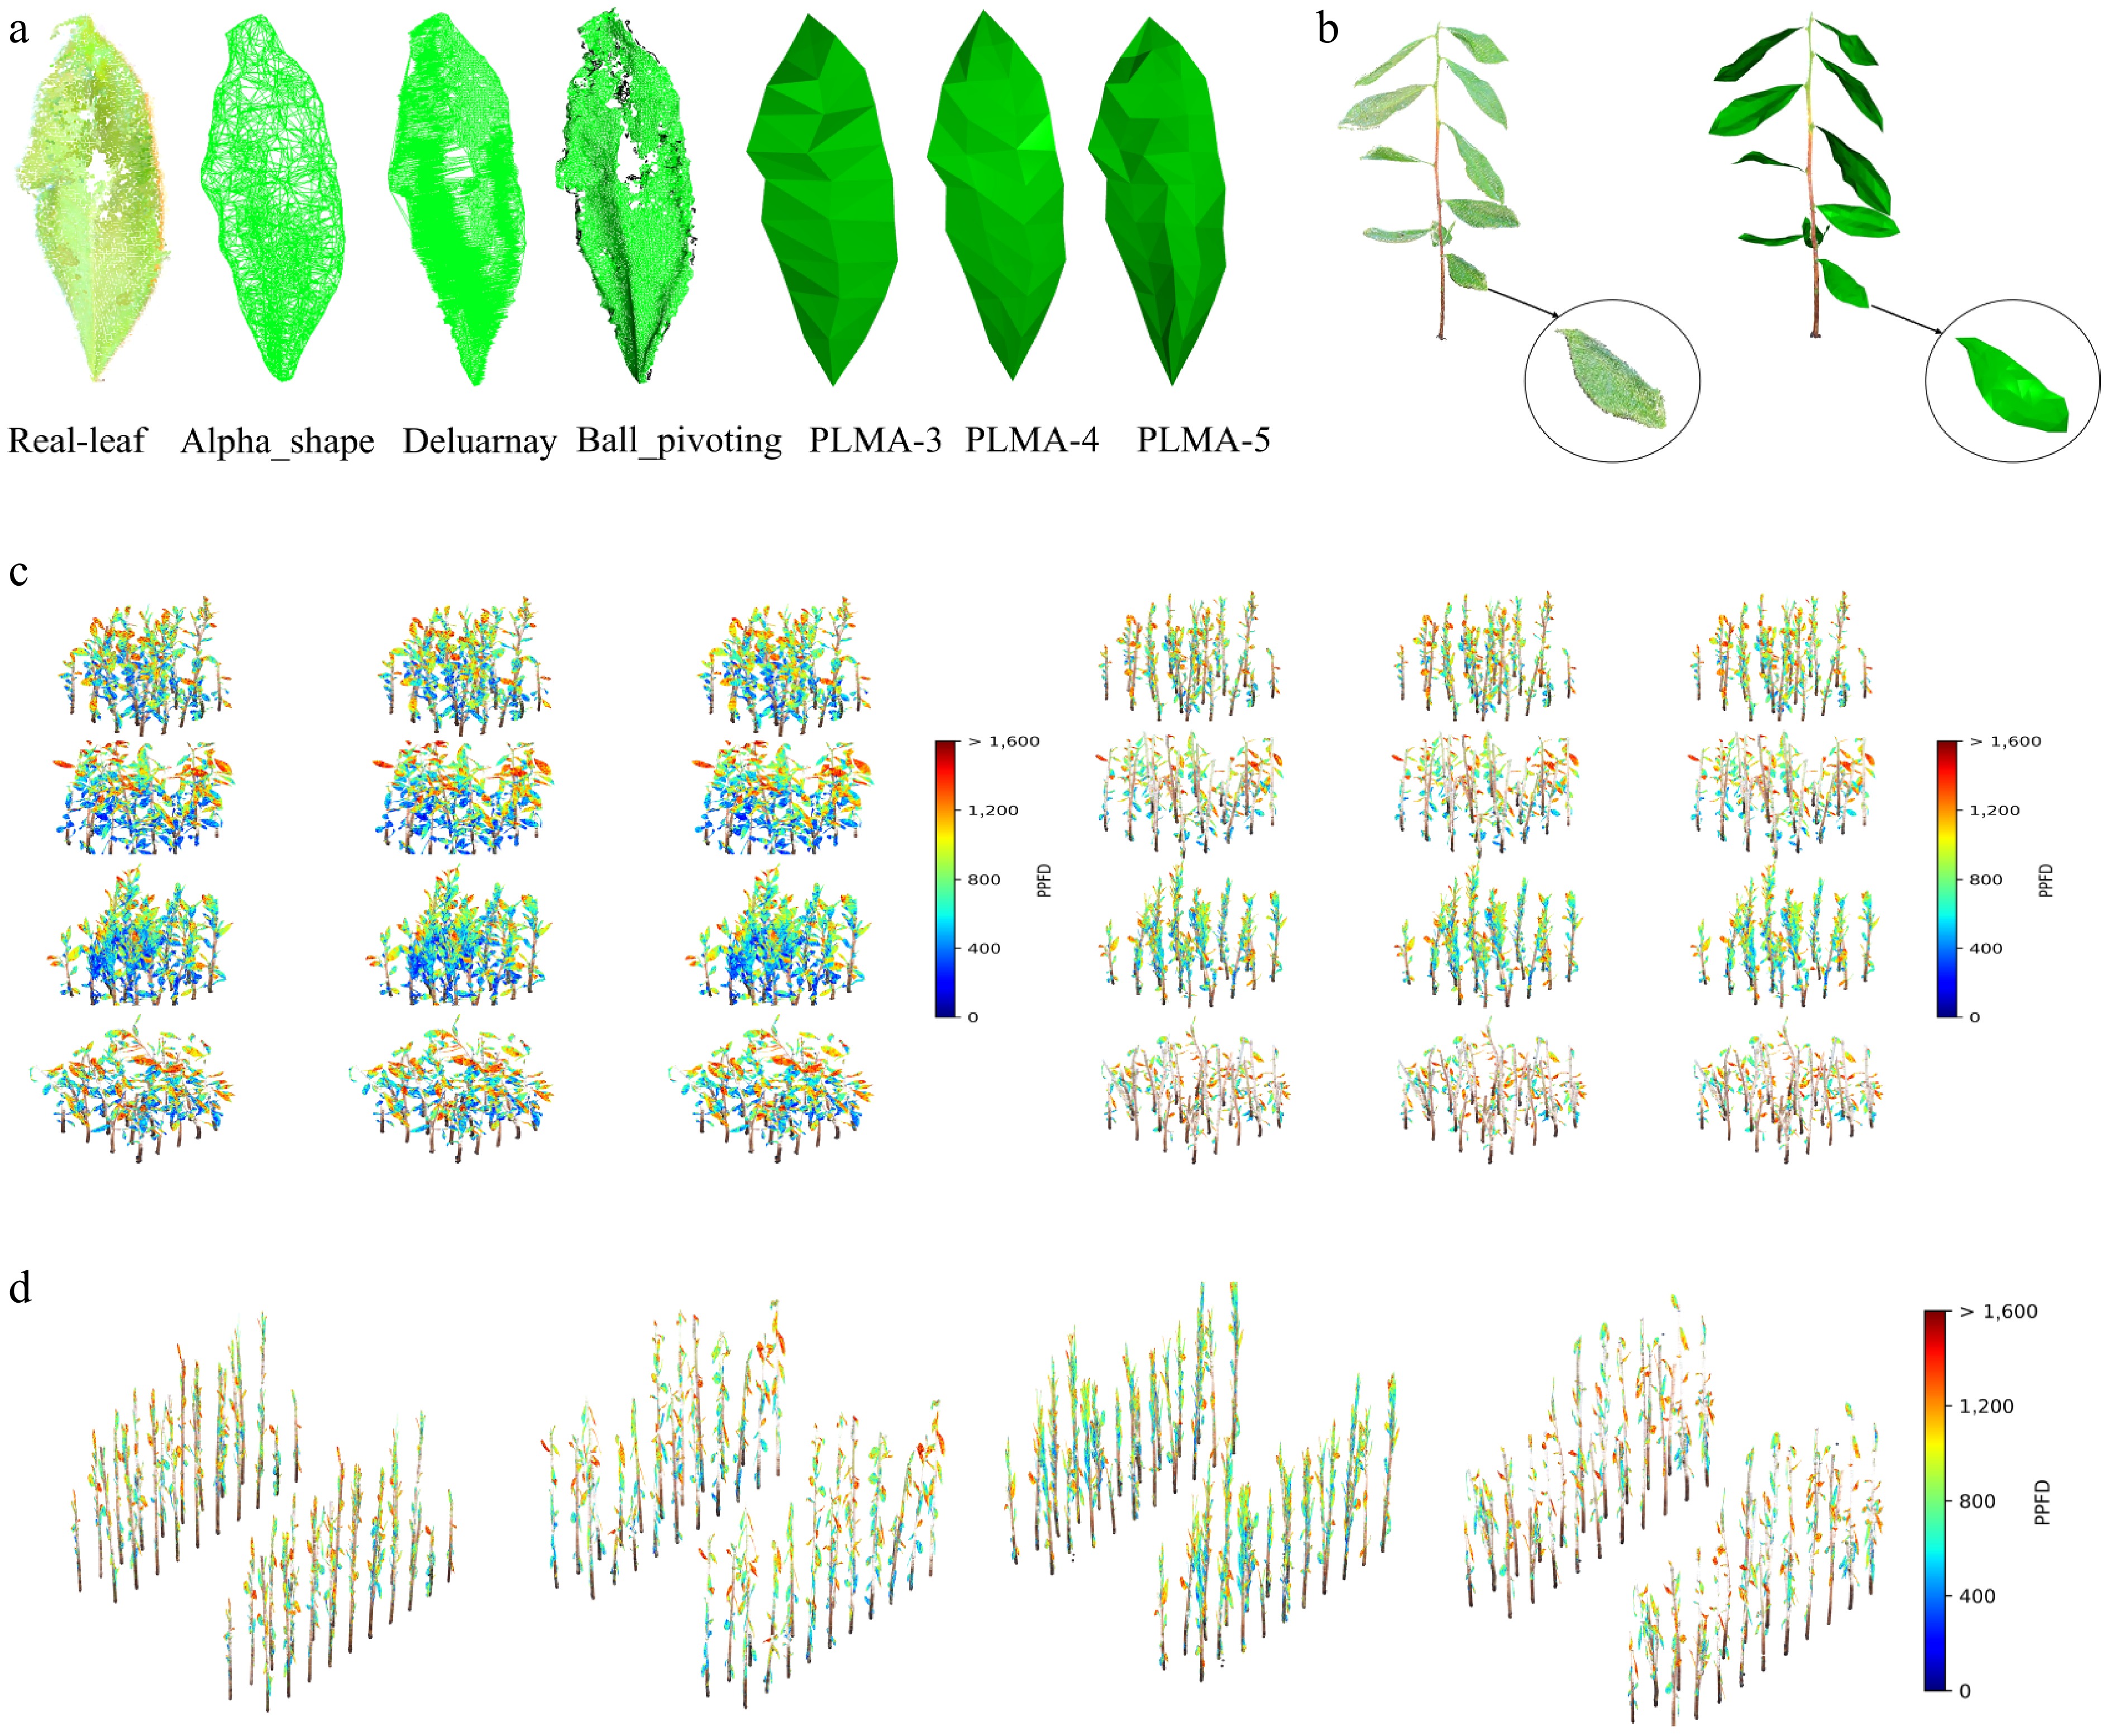
Figure 5.
(a) Comparison of meshing performance across conventional algorithms and the PLMA for tea plant leaves. Traditional methods: Alpha shape, Delaunay triangulation, and ball pivoting, which exhibit excessive triangulation and geometric distortions (e.g., cubic artifacts, edge discontinuities). The PLMA with 3, 4, and 5 keypoint columns. This comparative framework validates the PLMA's adaptability in optimizing the trade-off between geometric accuracy and computational efficiency for canopy photosynthesis modeling. (b) Visualization of the whole plant's point cloud and the meshing effects using the PLMA. (c) The simulated PPFD distributions under inter-plant spacings of 10 and 20 cm, using the canopy photosynthesis model. Each section illustrates the impact of these spacings on four different tea cultivars: 'Longjing 43', 'Tezao Naibai', 'Yuehuang 1', and 'Zijuan' (arranged from top to bottom). Within each section, columns from left to right correspond to models generated with different PLMA configurations: PLMA-5 (five longitudinal axes), PLMA-4 (four longitudinal axes), and PLMA-3 (three longitudinal axes). The color gradient in these sections represents the PPFD values (μmol photons m−2·s−1) absorbed by the canopy at 12:00 PM, demonstrating how spacing influences light absorption. (d) A typical planting configuration, showing the distribution of PPFD for the same cultivars, from left to right. This section highlights the light distribution patterns specific to each cultivar under standard planting arrangements, with the color gradient indicating the PPFD values absorbed by the canopy at 12:00 PM.
-
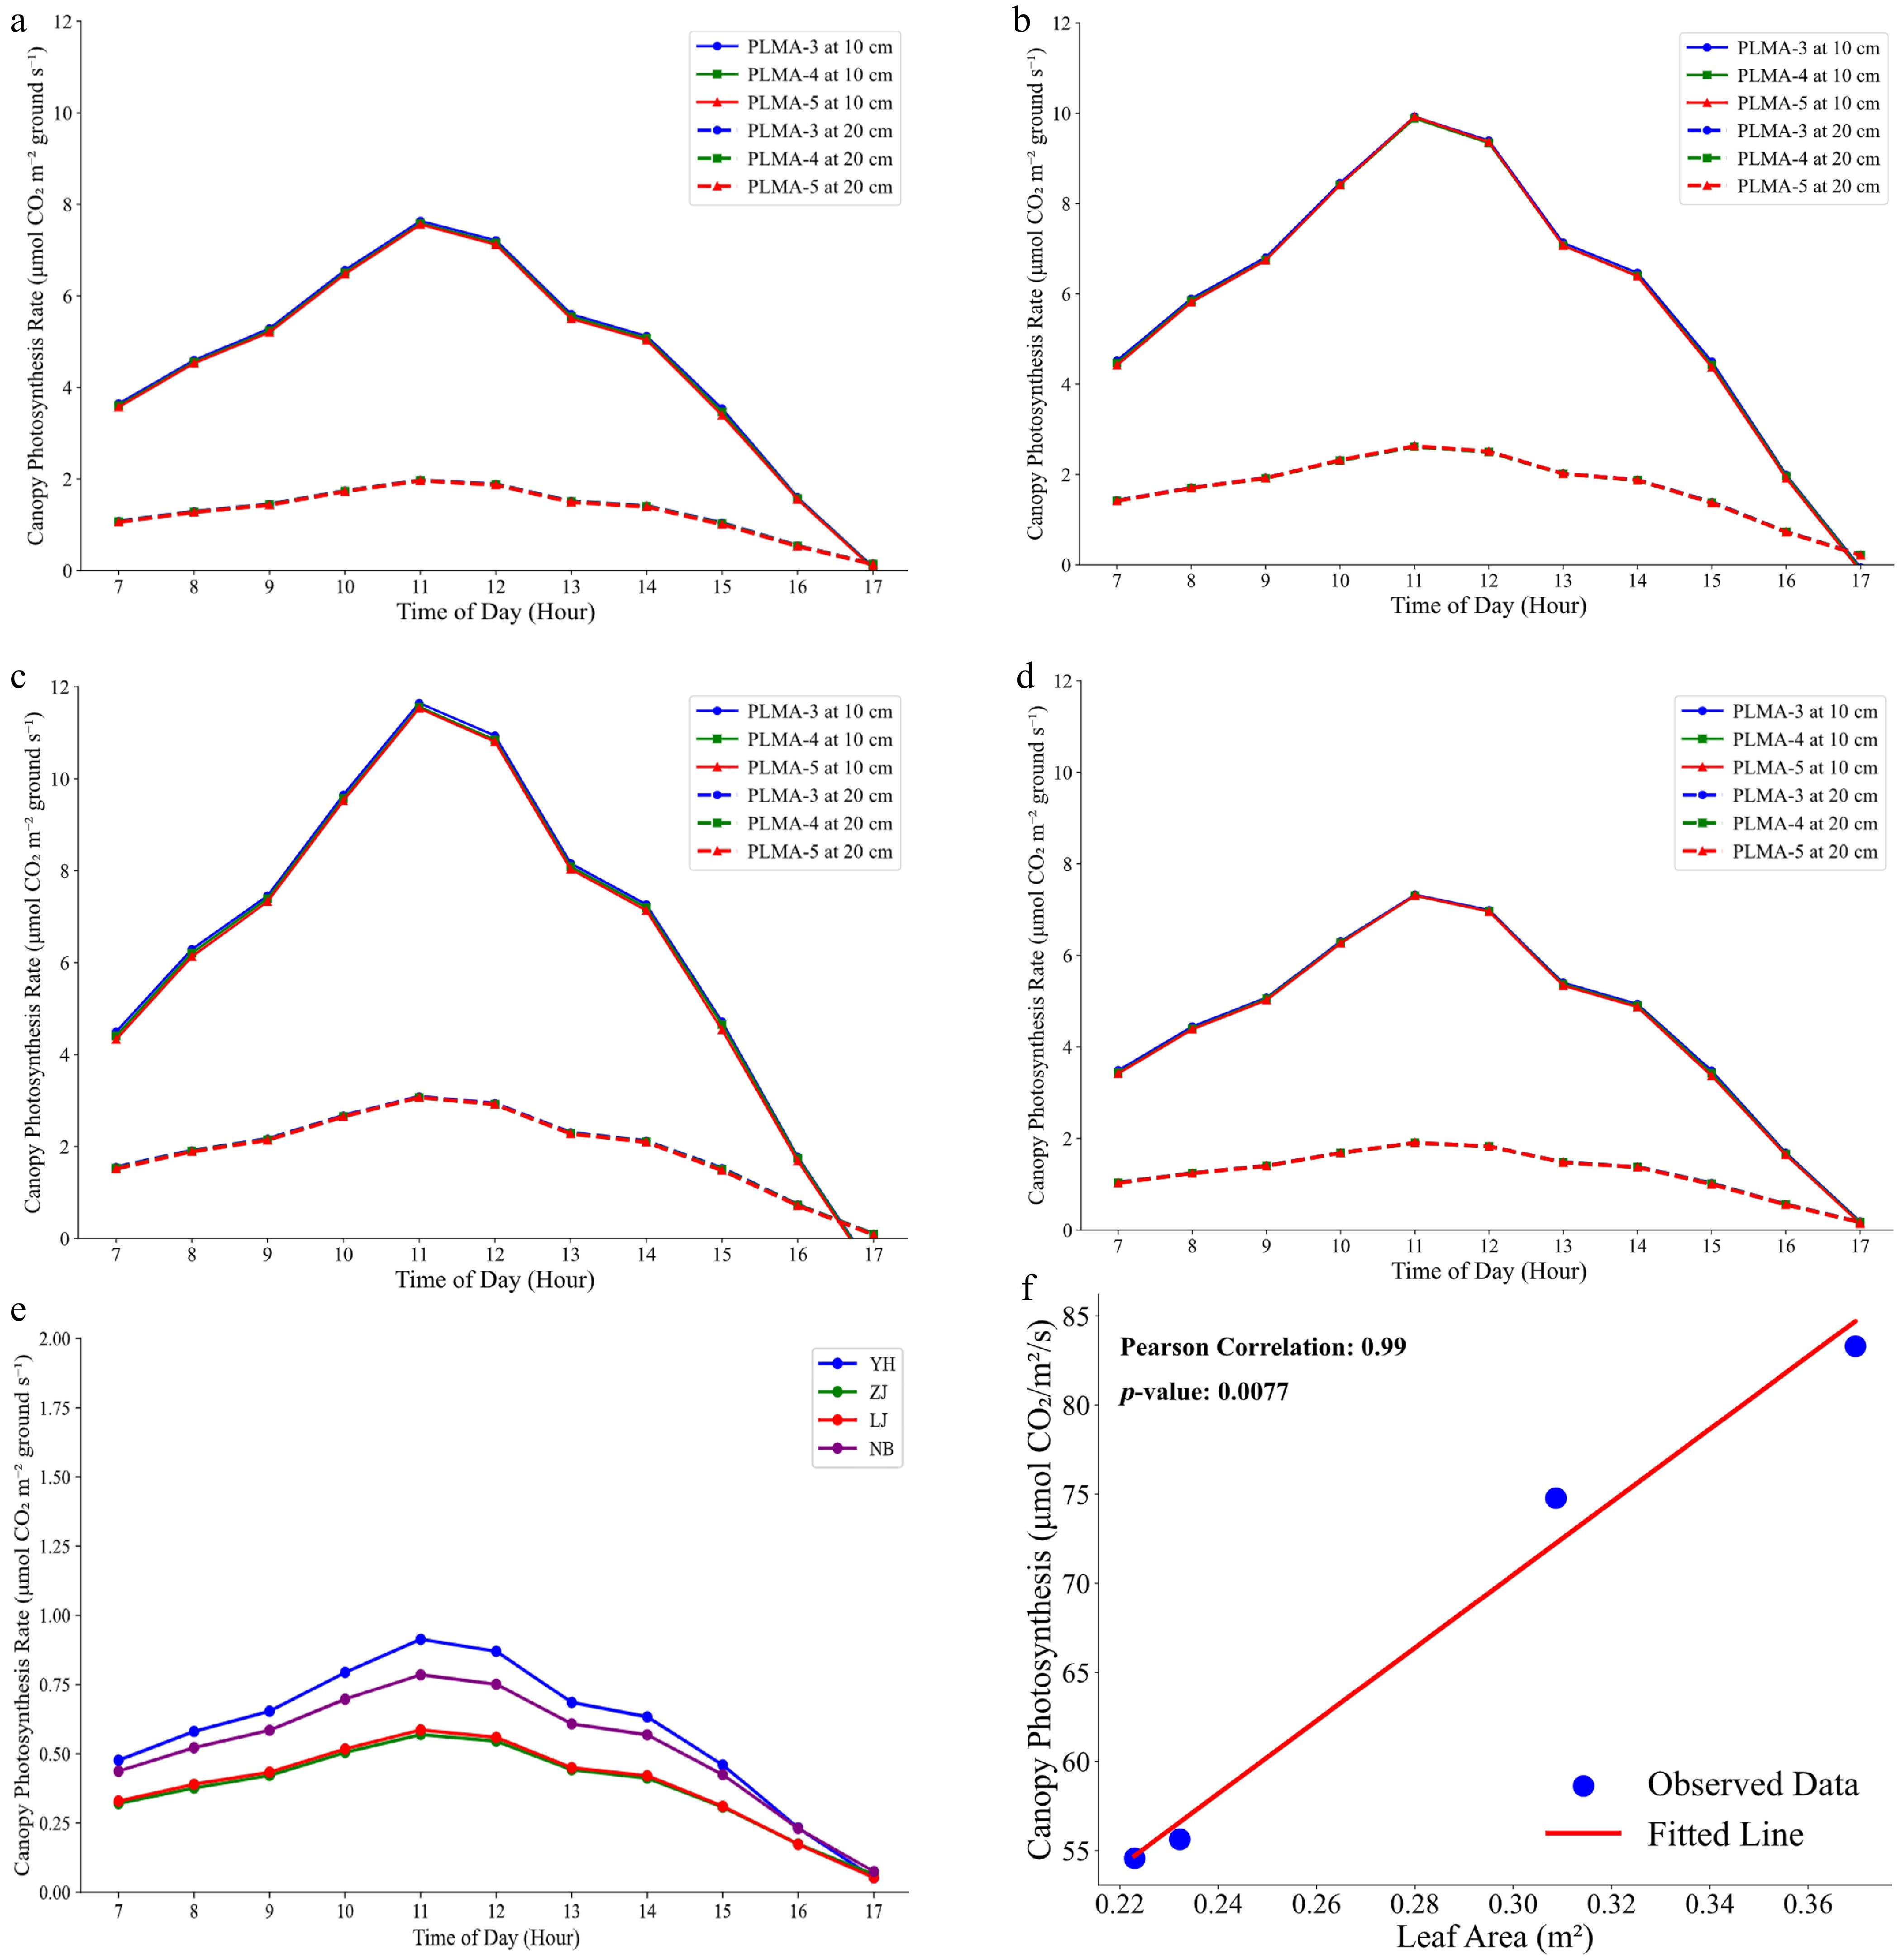
Figure 6.
(a)–(d) Diurnal variation of photosynthetic rate at a spacing of 10 and 20 cm using the PLMA-3 (three longitudinal axes), PLMA-4 (four longitudinal axes), and PLMA-5 (five longitudinal axes) configurations for four cultivars, namely (a) 'Longjing 43', (b) 'Tezao Naibai', (c) 'Yuehuang 1', and (d) 'Zijuan'. Different curves represent different PLMA configurations and different spacings. (e) The canopy's photosynthetic rate was lower with larger plant spacing when using the standard planting method of tea plant, illustrating the population photosynthetic efficiency of different varieties. (f) Correlation between the canopy's photosynthetic rate and total leaf area of the canopy. The Pearson correlation is 0.99, emphasizing the crucial role of leaf area in determining photosynthetic efficiency.
-
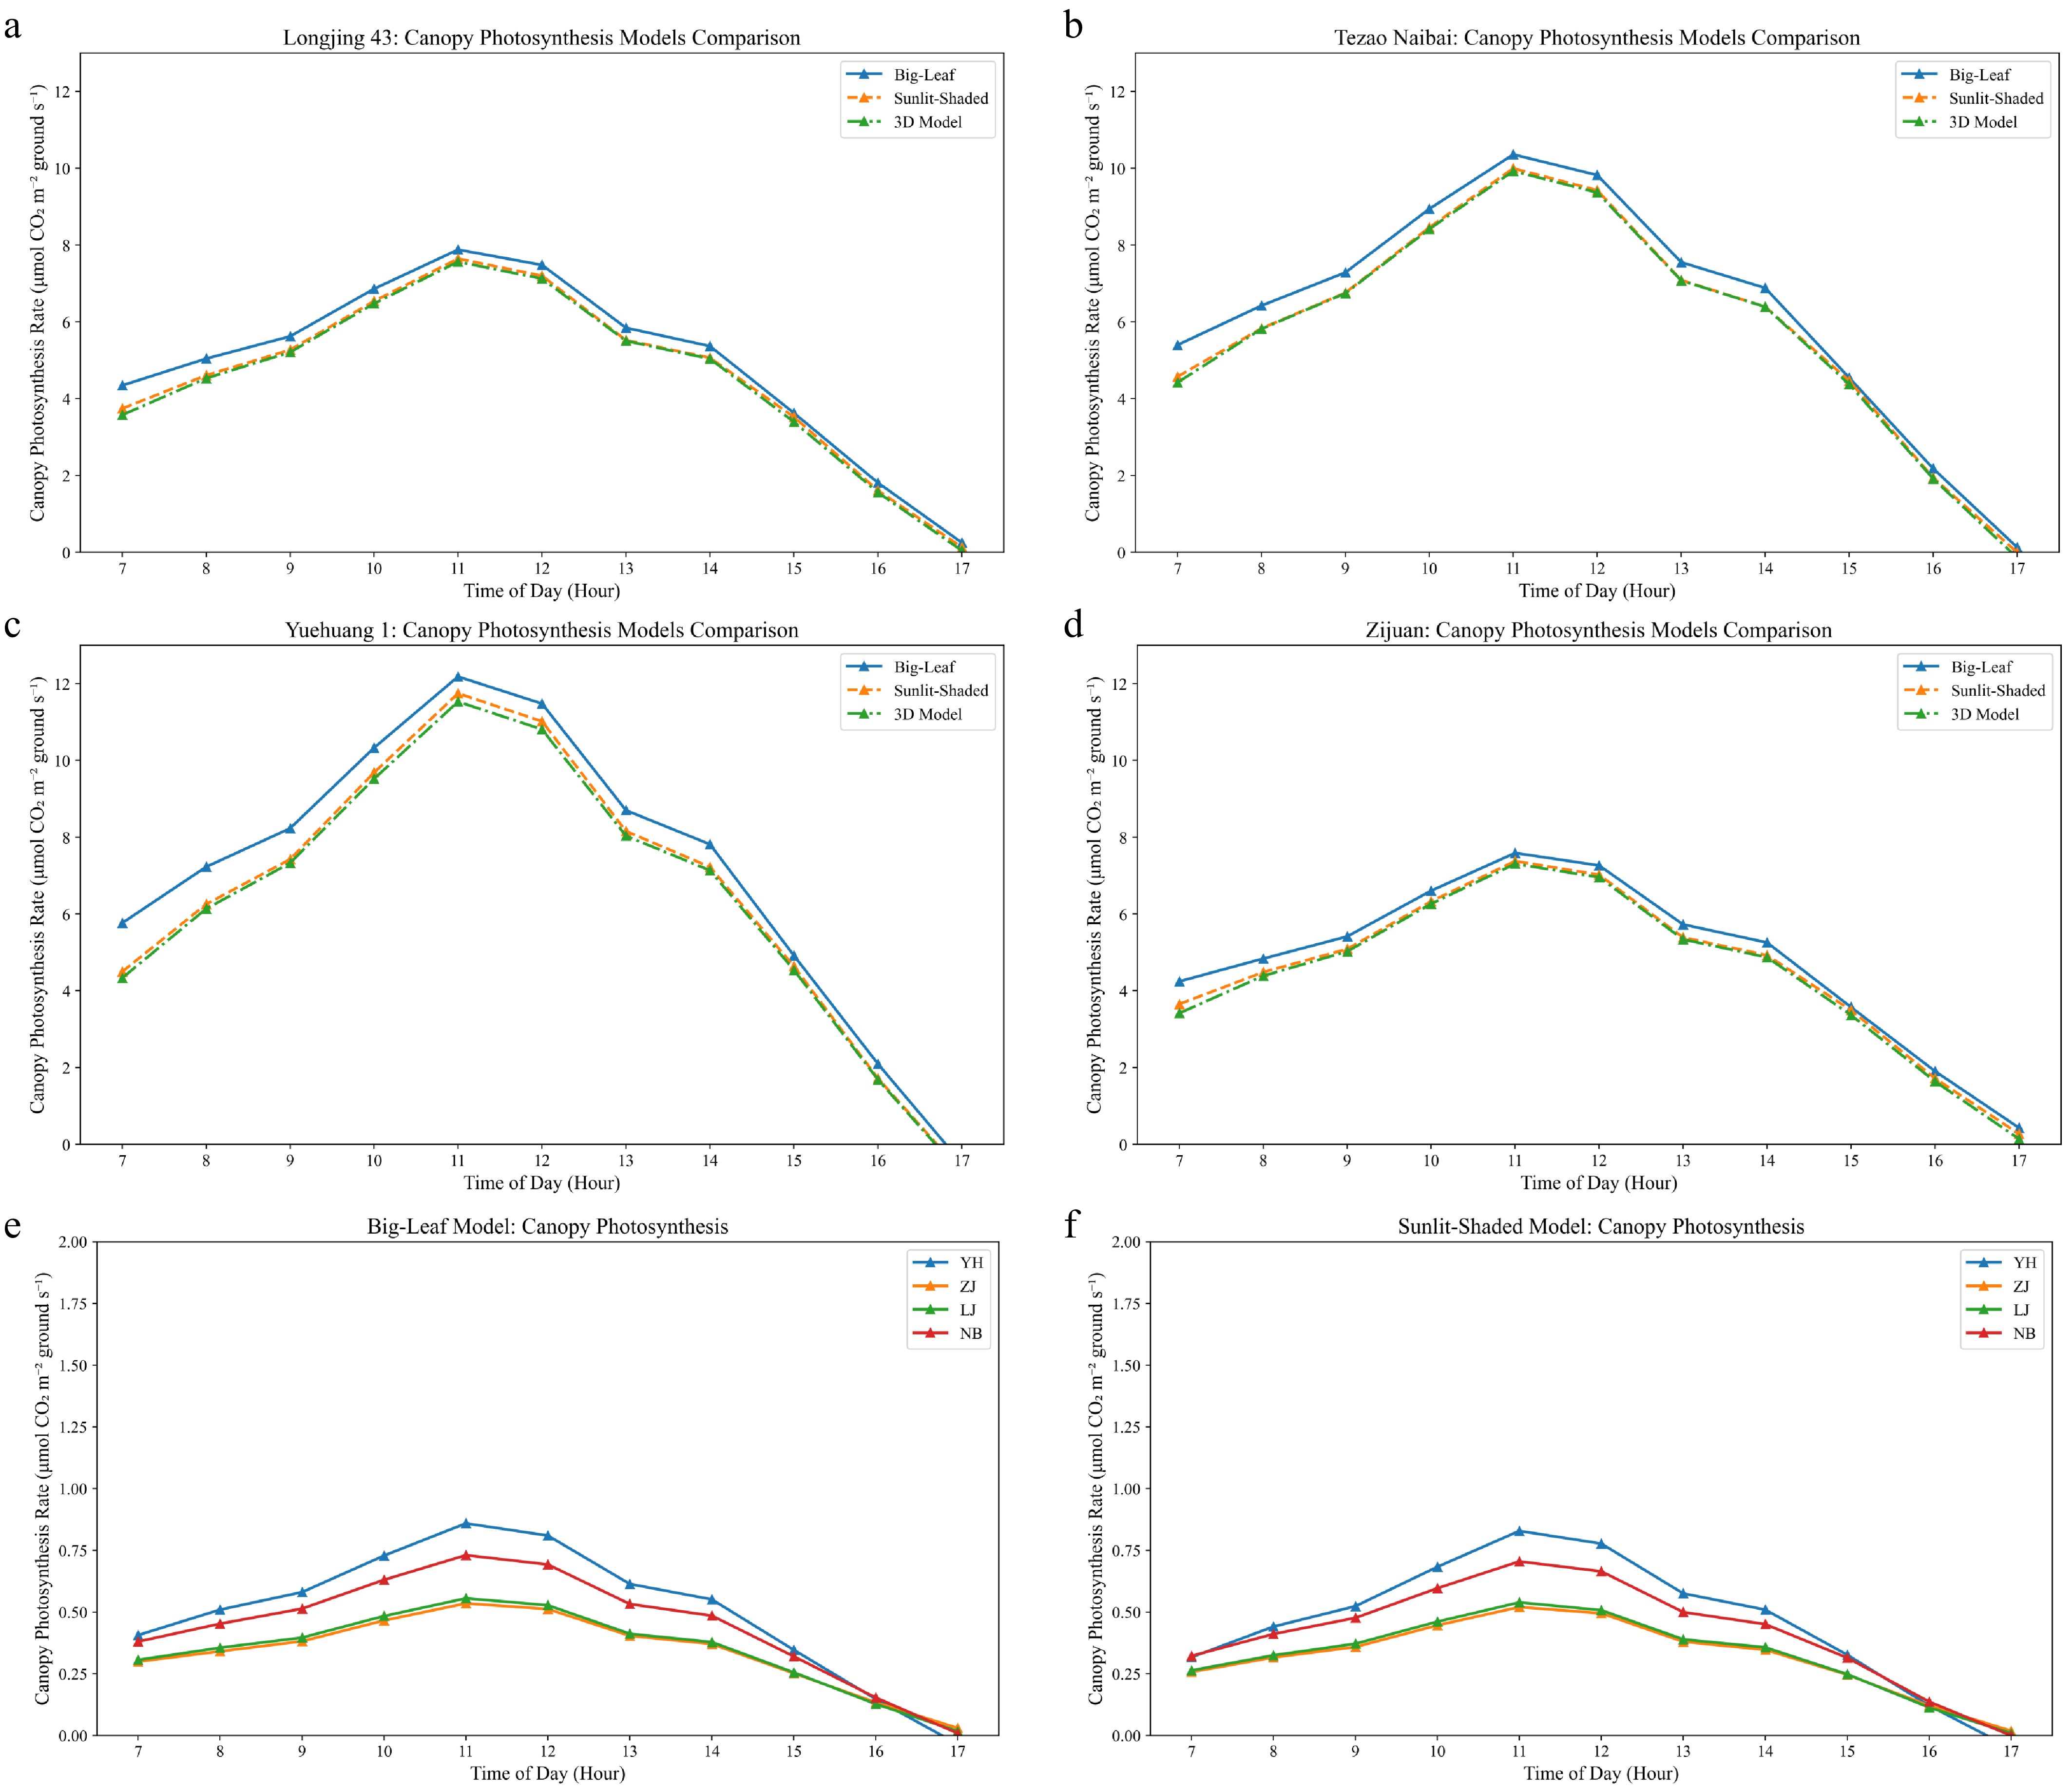
Figure 7.
Comparison of predicted canopy photosynthesis with the three modeling approaches. (a)–(d) Diurnal variations in the canopy's photosynthetic rates for four tea cultivars ('Longjing 43', 'Tezao Naibai', 'Yuehuang 1', and 'Zijuan') under dense planting conditions (10-cm spacing) using the Big-Leaf model (blue line), the Sunlit-Shaded model (orange line), and the 3D voxel-based model (green line). (e), (f) The canopy's photosynthetic performance under the standard planting configuration for (e) the Big-Leaf model and (f) the Sunlit-Shaded model, corresponding to the 3D model's results shown in Fig. 6e. All simulations were conducted using the nonrectangular hyperbola model for light response curves.
-
Voxel
scalePlant
organAP AP_50% AP_25% AR RC_50% RC_25% 150 Leaf 0.815 0.918 0.942 0.862 0.930 0.954 Stem 0.618 0.968 0.968 0.713 1.000 1.000 200 Leaf 0.854 0.944 0.967 0.897 0.955 0.975 Stem 0.657 0.903 0.903 0.805 1.000 1.000 250 Leaf 0.884 0.964 0.975 0.924 0.973 0.983 Stem 0.732 0.903 0.903 0.862 1.000 1.000 300 Leaf 0.889 0.969 0.983 0.932 0.977 0.992 Stem 0.793 0.953 0.953 0.855 1.000 1.000 350 Leaf 0.897 0.970 0.983 0.944 0.978 0.990 Stem 0.789 0.926 0.926 0.893 1.000 1.000 400 Leaf 0.755 0.898 0.935 0.866 0.941 0.976 Stem 0.711 0.953 0.953 0.789 1.000 1.000 Evaluation metrics include average precision (AP) across all intersection over union (IoU) thresholds, AP at 50% and 25% IoU thresholds (AP_50%, AP_25%), average recall (AR), and recall curve area (RCA) at 50% and 25% IoU thresholds (RC_50%, RC_25%). Table 1.
Segmentation performance of the ISBNet model trained under different voxel size configurations for plant organ detection.
Figures
(7)
Tables
(1)