


-
The tea plant (Camellia sinensis), a highly important economic crop, is extensively cultivated worldwide. It serves as the primary raw material for the tea industry and occupies a crucial position in both the international tea market and the domain of human health, owing to its notable medicinal attributes[1]. With the continuous growth of consumer demand for high-quality tea products, the breeding of tea plant has become increasingly important[2]. In recent years, remarkable advancements have been made in tea breeding technology. This progress has enabled the selection of tea varieties with desirable traits such as drought resistance, disease resistance, high yield potential, and excellent quality[2−4].
Photosynthesis is of utmost importance for the growth and development of tea plant[5]. Consequently, investigations of the relationship between photosynthesis and tea plant's growth have long been a significant subject in the field of tea science. Nevertheless, traditional methods for evaluating photosynthesis, hampered by technological and methodological constraints, typically demand a substantial amount of labor and time[6]. To overcome these limitations, canopy photosynthesis models have been developed to simulate the impacts of environmental factors (such as photosynthetic photon flux density [PPFD]) and plant traits on photosynthetic performance, providing an effective research tool[7,8]. While canopy models have been developed for various crops like corn, rice, soybeans, and sugarcane[9−14], tea plant present unique challenges because of their perennial woody nature, complex branching patterns, and dense, multi-layered canopy structure with overlapping leaves that create intricate light interception patterns. Unlike annual crops with relatively simple, regular architectures, tea plant canopies require specialized modeling approaches. A major limitation in applying these models is constructing an accurate three-dimensional (3D) canopy architecture. Traditional methods rely on manual measurement of a plant's architectural traits, such as leaf length, plant height, and tiller numbers[15], which is time-consuming and labor-intensive. Three-dimensional point cloud technology offers a solution, enabling automated plant reconstruction and canopy modeling[16]. However, plant organ segmentation remains challenging, as traditional algorithms like skeleton extraction and mesh tessellation are highly dependent on the plant type and parameter settings. Although end-to-end automated plant point cloud segmentation and the development of efficient triangular tessellation algorithms have been used in major crops, the method for developing a canopy model of the tea plant has not been developed.
Deep learning has revolutionized 3D point cloud processing by overcoming the limitations of traditional methods such as clustering[17−19], threshold processing[20−22], and edge detection[23−25], which struggle with complex plant structures. PointNet[26] pioneered direct feature learning from raw point cloud data, while PointNet++[27] advanced this with hierarchical feature extraction, enabling multi-scale learning of both fine-grained details and global structures[28]. These developments have enabled various applications: Attention and Structure Aware (ASAP)-PointNet with Density-Based Spatial Clustering of Applications with Noise (DBSCAN) for cabbage phenotyping[29], PartNet-based methods for lettuce leaf segmentation[30], and PointNet++ with Hierarchical Aggregation for Instance Segmentation (HAIS) for corn analysis[31].
Building upon PointNet++'s local feature extraction framework, ISBNet[32] introduces instance-aware segmentation strategies and dynamic receptive fields through its novel network architecture. This advancement enables direct discrimination of adjacent plant organs with similar semantic labels—a critical capability for complex tea plant structures—without requiring post-processing. The architecture's enhanced feature learning mechanisms allow for precise identification and segmentation of distinct botanical entities within 3D point clouds, especially for addressing the challenges posed by densely overlapping plant structures. This model has demonstrated superior performance on multiple publicly available point cloud datasets, including S3DIS, STPLS3D, and ScanNetV2, thereby showing its accuracy and robustness in complex scenarios. Consequently, in this study, the ISBNet model is employed for the instance segmentation of tea plant point clouds.
After accurately segmenting the 3D point cloud of the tea plant, the subsequent crucial step entails the utilization of an efficient meshing algorithm to construct a 3D model. This model is employed for simulating the absorption and distribution of light within the canopy and calculating canopy photosynthesis. Although traditional meshing methods, such as Delaunay triangulation[33], alpha shape[34], and ball pivoting[35], are extensively applied in 3D reconstruction tasks, they frequently encounter issues of low efficiency and overly complex models when dealing with intricate biological structures. This is primarily because these algorithms have to process a substantial amount of redundant point cloud data and have not been optimized for the distinctive morphological features of plants. Consequently, there is an urgent necessity for a novel meshing algorithm specifically tailored to plants.
In this study, we have developed a novel pipeline for constructing a canopy photosynthesis model for tea plant. This pipeline encompasses 3D point cloud segmentation using deep learning, a new meshing algorithm (the precision leaf mesh algorithm [PLMA]) optimized for plant structures, a ray tracing algorithm, and a 3D canopy photosynthesis model specifically tailored for tea plant.
-
This study established an integrated computational framework for constructing a 3D canopy photosynthesis model for tea plant by synergizing multi-view stereo 3D reconstruction, deep learning, and a novel meshing algorithm (the PLMA) tailored to plant leaf morphology (Fig. 1). Initially, tea saplings were imaged using a commercially available multi-view stereo system (A-CTP, MilletHill Biotech, Shanghai, China), and raw 3D point clouds were generated through photogrammetric reconstruction. The acquired point clouds were preprocessed using Excess Green Index (ExG) filtering, static noise removal, and voxel-grid downsampling methodologies. Subsequently, the ISBNet architecture was applied to achieve precise organ-level segmentation, isolating individual leaves from stems within the point cloud data. The segmented leaf point clouds were then transformed into high-fidelity triangular mesh models via the PLMA, enabling the simultaneous extraction of key phenotypic parameters. Finally, the FastTracer ray tracing engine was employed to simulate the spatiotemporal distribution of light within the reconstructed canopies, thereby quantifying canopy-level photosynthetic efficiency. This framework significantly improves the precision and scalability of phenotyping and photosynthetic modeling of tea plant, facilitating advancements in genomic selection, precision agriculture, and functional-structural plant phenomics.
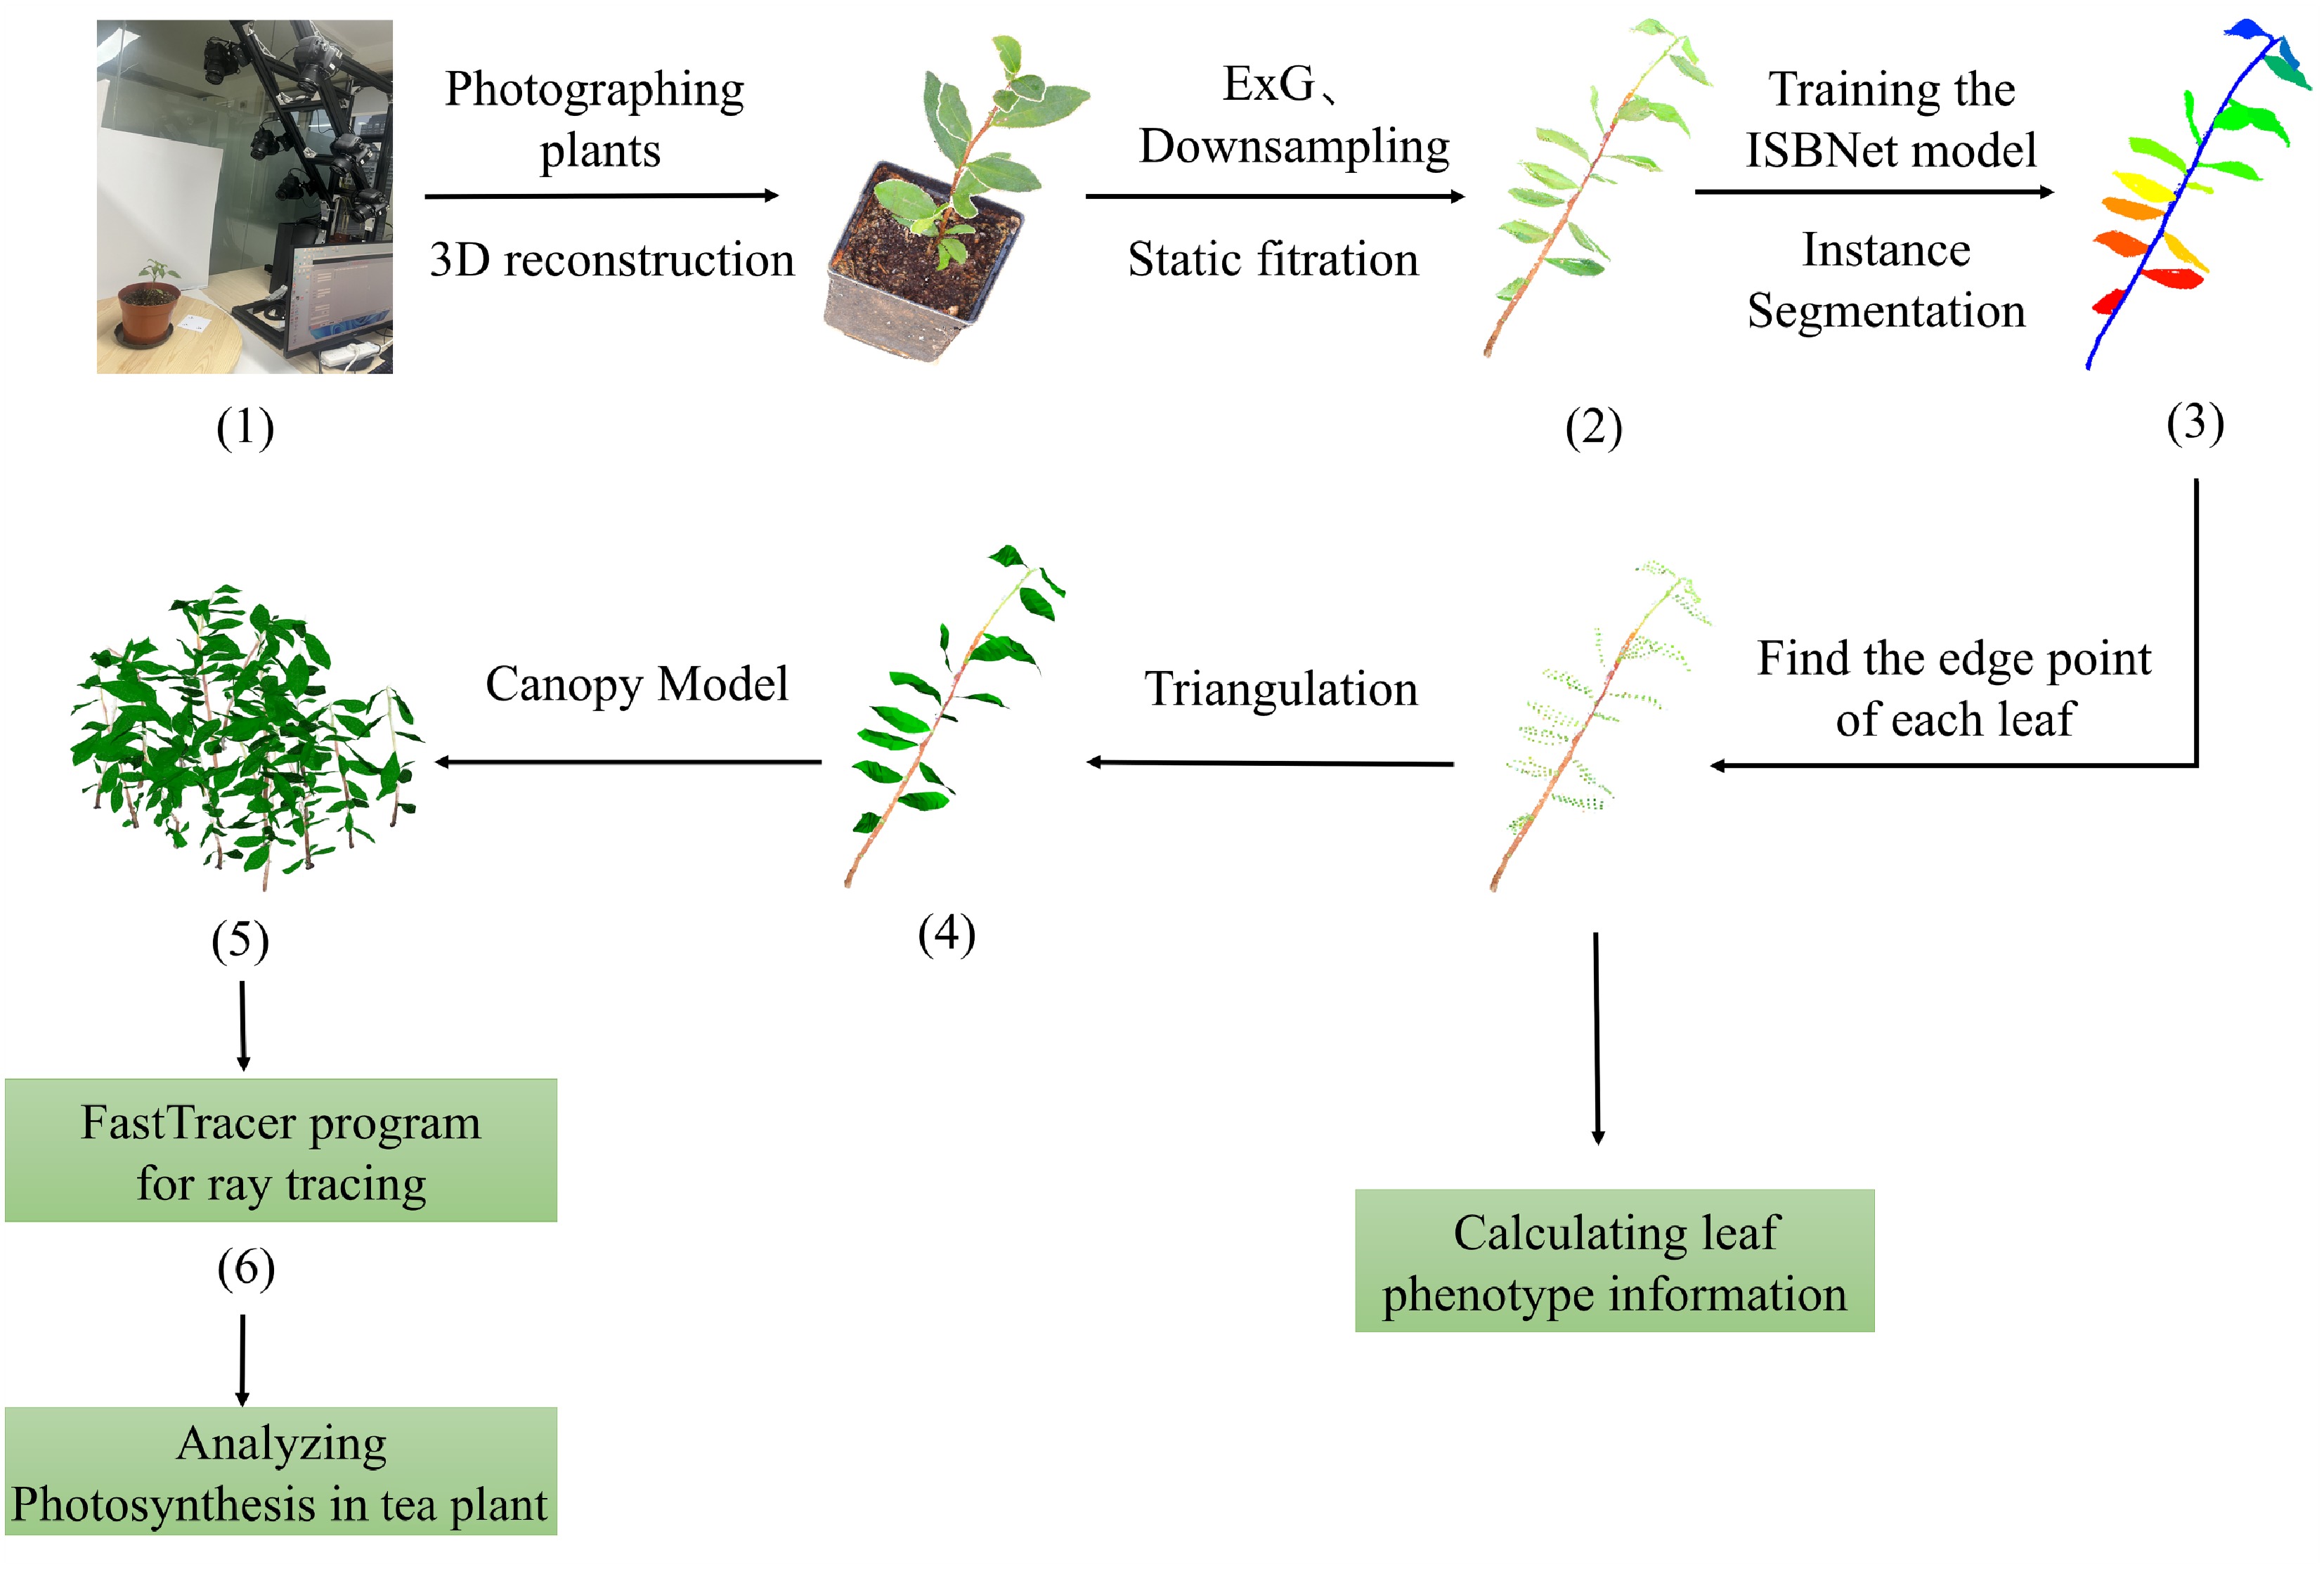
Figure 1.
Schematic overview of the computational workflow for canopy photosynthesis analysis in tea plant. The workflow progresses through the following stages. (1) Multi-view stereo imaging generates a high-resolution 3D point cloud of tea saplings. (2) Raw point clouds undergo preprocessing via Excess Green Index (ExG) filtering and voxel-based downsampling to remove noise and optimize the data density. (3) Instance-aware semantic segmentation using the ISBNet architecture isolates individual leaves from stems within the refined point cloud. (4) Application of the plant leaf meshing algorithm (PLMA) constructs biologically accurate triangular mesh models for segmented leaves. (5) Canopy architectural models are generated by integrating plant-specific 3D reconstructions with predefined planting configurations. (6) The FastTracer ray tracing platform simulates the spatiotemporal distribution of light (photosynthetic photon flux density, PPFD) within the canopy, enabling calculation of the photosynthetic rates and establishing quantitative assessment metrics for architectural optimization of tea plant.
Data collection
Plant material and imaging
-
Four tea plant varieties (Camellia sinensis cv. 'Tezao Naibai', 'Yuehuang 1', 'Longjing 43', and 'Zijuan'), exhibiting distinct phenotypic architectures and leaf morphologies, were sampled for this study. Multi-view stereo imaging was conducted using a multi-view six-stereo (MVS-06) system (MilletHill Biotech, Shanghai, China) equipped with six Canon EOS 1300D digital single-lens reflex (DSLR) cameras. During image acquisition, each camera captured nine images per acquisition cycle, followed by incremental 40° rotations of the automated turntable to achieve full 360° coverage. This protocol yielded 54 high-resolution images per plant.
Three-dimensional reconstruction and preprocessing
-
Three-dimensional point clouds were reconstructed from the acquired images using Agisoft Metashape (v1.6.1, Agisoft LLC, St. Petersburg, Russia). The reconstruction achieved high fidelity with average point densities of 20,000–300,000 points per plant and millimeter spatial resolution, effectively capturing fine-scale morphological features of the leaves and branching architecture. The reconstructed point clouds preserved detailed leaf surface textures, including the venation patterns and serrated leaf edges characteristic of tea plant. Complex structural elements such as overlapping leaves, intricate branch bifurcations, and emerging buds were accurately reproduced with millimeter-level precision (Supplementary Fig. S1). Each point cloud dataset included XYZ spatial coordinates, red–green–blue (RGB) spectral values, and surface normal vectors. Raw point cloud data underwent preprocessing in the CERS Suite (MilletHill Biotech), involving Excess Green Index (ExG) filtering to isolate plant structures from background artifacts, static noise removal to eliminate spurious points, and voxel-grid downsampling (5-mm resolution) to optimize the computational efficiency while preserving morphological fidelity. The point clouds' accuracy was validated through manual inspection of the key morphological landmarks and a comparison with reference measurements, ensuring the precision of the spatial coordinates within a tolerance of ± 2 mm.
Dataset curation and annotation
-
A manually annotated training dataset was constructed using CloudCompare software (v2.13) to enable supervised deep learning. Each point cloud was assigned to two semantic classes (stem and leaf) with instance-level labels distinguishing individual leaves. The final dataset comprised 160 tea plant specimens, representing diverse architectural phenotypes, to train the ISBNet model for instance segmentation and validate the PLMA.
The ISBNet model for instance segmentation of tea plant organs
-
Given the robust performance and adaptive capabilities of the ISBNet model (Fig. 2a) in processing complex 3D datasets, this study investigated its applicability to botanical point cloud analysis through systematic hyperparameter optimization (e.g., voxel size). The model's architecture comprises four core components, as described below.
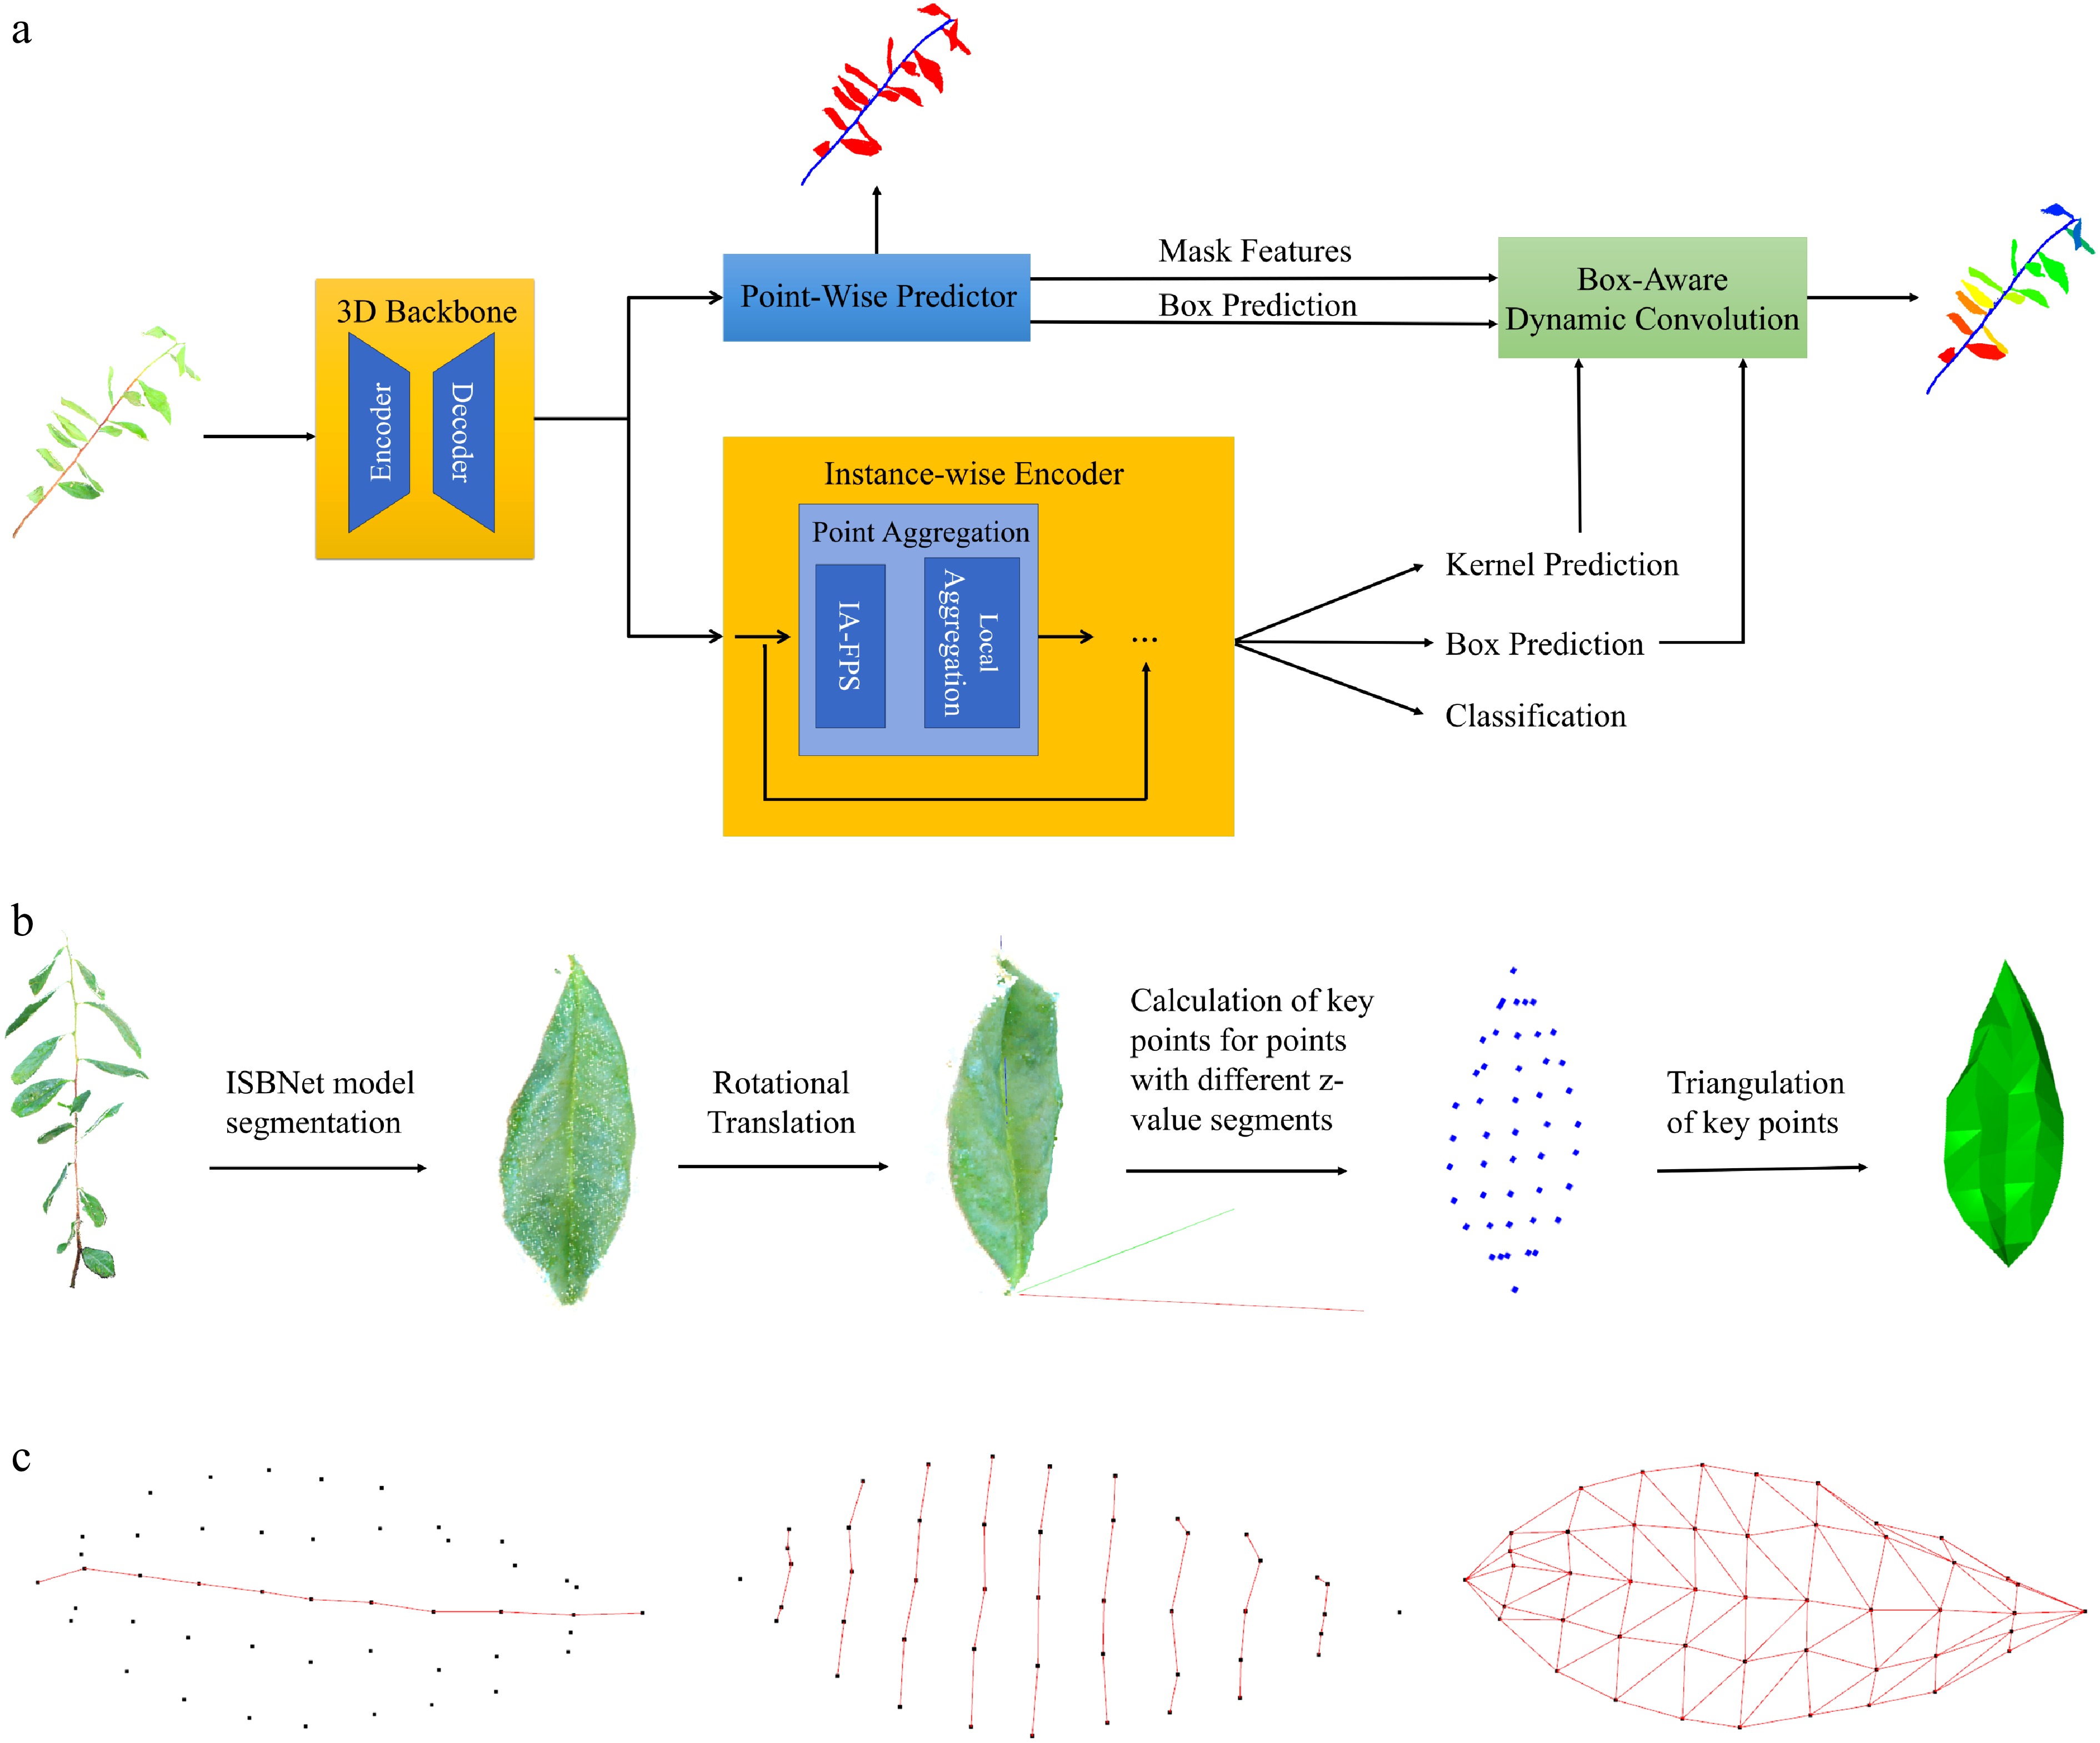
Figure 2.
Workflow of high-precision 3D instance segmentation and phenotypic trait extraction for tea plant. (a) Architectural workflow of the ISBNet model for high-precision 3D instance segmentation of tea plant point clouds. (b) Workflow of the PLMA for constructing 3D leaf models from tea plant point clouds. (c) Illustration of phenotypic parameter extraction from plant leaf models processed by the PLMA.
Three-dimensional backbone network
-
Input point cloud data
$ P\in {\mathbb{R}}^{N\times 6} $ $ F\in {\mathbb{R}}^{N\times D} $ Point-wise predictor
-
Features from the backbone network are processed through a point-wise predictor to generate semantic predictions, including the axis-aligned bounding boxes
$ {F}_{box}\in {\mathbb{R}}^{N\times 6} $ $ {F}_{mask}\in {\mathbb{R}}^{N\times H} $ Sampling-based instance-wise encoder
-
This component employs instance-aware farthest point sampling (IA-FPS) with local feature aggregation to transform point-wise features into instance-level representations,
$ F\in {\mathbb{R}}^{K\times D} $ Box-aware dynamic convolution
-
By integrating the 3D bounding box priors with dynamic convolution operators, this module modulates prediction discrepancies between candidate points to produce instance-specific binary masks, achieving sub-organ segmentation precision.
Data loader development
-
To accommodate the structural characteristics of plant point clouds, we customized the ISBNet framework by developing a dedicated data loader. This tool synchronizes RGB spectral data with XYZ spatial coordinates, ensuring dimensional consistency and the integrity of the input for tea plant datasets.
Parameter optimization
-
We conducted systematic hyperparameter optimization, focusing on the voxel scale (voxel_size = 1/voxel_scale). Empirical trials across scaling factors (150–400, in increments of 50) revealed a precision–efficiency trade-off: Finer voxel scales (150–250) preserved morphological details at higher computational costs, whereas coarser scales (300–400) improved throughput but reduced edge fidelity. We identified an optimal parameter setting that performs best in terms of balancing segmentation accuracy and computational efficiency.
Architectural enhancements
-
Beyond hyperparameter tuning, we modified the data ingestion pipeline and architectural framework to better align with the plant point cloud's properties. Specifically, we adjusted the spatial configuration parameters (e.g., spatial_shape) and optimized the spatial cropping strategy by reducing cropping ranges to plant-appropriate dimensions, addressing the smaller volumes that are characteristic of individual plant specimens. Point density thresholding was implemented to handle uneven density distributions, ensuring that cropped regions maintained sufficient point density for effective training. These preprocessing modifications improved the model's ability to capture complex plant structural patterns while maintaining computational efficiency. Batch size was calibrated to optimize GPU memory allocation without compromising training stability.
Model training
-
A curated dataset of 160 tea plant saplings was partitioned into 120 training and 30 validation samples. To mitigate overfitting and enhance generalizability, the training samples were augmented via three biologically constrained strategies: (1) Leaf rotations with stem-anchored transformations centered at leaf–stem junction points, applying lateral rotations within a ± 30° range and vertical rotations within a ± 10° range; (2) global spatial random translation applied to the entire plant point cloud; and (3) point cloud density normalization by standardizing samples to a range of 20,000–100,000 points through adaptive sampling. These biologically constrained augmentation parameters ensured morphological realism while providing sufficient training variation, generating four transformations per sample.
Training was executed on a cloud-based computational platform featuring an AMD EPYC 7551P CPU (8 cores), 24 GB RAM, and an NVIDIA RTX 3090 GPU (24 GB VRAM), hosted on a Linux Ubuntu 20.04 environment. The model underwent 300 training epochs with an initial learning rate of 0.001. A cosine annealing scheduler dynamically adjusted the learning rate, facilitating accelerated convergence while minimizing loss oscillations.
Triangular meshing of leaves
-
To construct canopy photosynthesis models, point cloud data must be converted into triangular mesh representations capable of simulating light absorption dynamics and calculating the leaf surface area. Although conventional algorithms (e.g., alpha shape, Delaunay triangulation, and ball pivoting) have been widely adopted for 3D reconstruction, they exhibit pronounced limitations when processing botanical point clouds. First, they are subject to noise artifacts and nonuniform distributions. Noise and irregular point spacing generate extraneous triangular facets, uneven edges, and topological discontinuities in leaf meshes. Though parameter tuning (e.g., the alpha radius) can mitigate these issues, optimal configurations are species-dependent. Second, they are prone to geometric distortions. Sparse or unevenly sampled point clouds often produce nonplanar geometric approximations (e.g., cubic artifacts), introducing significant errors in leaf area estimation and subsequent ray tracing simulations. Lastly, they (3) Computational Overhead. Excessive triangle counts from traditional meshing impose prohibitive computational costs for large-scale canopy light simulations.
To address these limitations, we introduce the precision leaf mesh algorithm (PLMA), a novel triangular meshing framework tailored to plant leaf point cloud morphologies. The PLMA is designed to eliminate redundant vertices while preserving maximal geometric fidelity through three sequential stages (Fig. 2b) as follows.
Geometric alignment
-
Leaf point clouds undergo rotational transformations using Rodrigues rotation to align the principal leaf vein (constructed from the basal point Pbase closest to the stem and the farthest tip point Ptip) with the z-axis. The leaf vector is first normalized as:
$ \overrightarrow{{v}_{leaf}}=\dfrac{{p}_{tip}-{p}_{base}}{\left|\left|{p}_{tip}-{p}_{base}\right|\right|},\text{}\overrightarrow{Z}=\left[\mathrm{0,0},1\right] $ (1) The rotation axis and angle are calculated through cross-product and dot-product operations:
$ \overrightarrow{u}=\overrightarrow{{v}_{leaf}}\times \overrightarrow{Z},\text{}\mathrm{\theta }=\mathrm{arccos}\left(\overrightarrow{{v}_{leaf}}\cdot \overrightarrow{Z}\right) $ (2) The Rodrigues rotation matrix R is then constructed to align the leaf vector with the z-axis direction:
$ R=I+\mathrm{sin}\mathrm{\theta }{\left[\overrightarrow{u}\right]}_{\times }+\left(1-\mathrm{cos}\mathrm{\theta }\right){\left[\overrightarrow{u}\right]}_{\times }^{2} $ (3) where, [·]x denotes the skew-symmetric matrix operator, standardizing the spatial orientation and eliminating any modeling deviations caused by natural leaf curvature.
Edge and vein detection
-
The aligned leaf is uniformly divided into N segments (N = 10) along the z-axis. For each segment k, local point sets are extracted within tolerance zones defined as:
$ {Q}_{k}=\{\mathrm{p}\in P|{Z}_{k}-\mathrm{\varepsilon }\leqslant p.z\leqslant {Z}_{k}+{\varepsilon }\},{\varepsilon }=0.1\times {L}_{segment} $ (4) Within each Qk, k keypoints are systematically identified corresponding to k longitudinal axes (columns) across the leaf width. The selection of the longitudinal axis number (three to five columns) is based on three criteria. (1) Leaf morphological complexity: Simple elongated leaves (aspect ratio: > 3:1) utilize three columns for computational efficiency, while complex broad leaves (aspect ratio: < 2:1) require five columns for adequate surface representation. (2) Point cloud density: Sparse datasets (< 1,000 points/cm2) are processed with three columns to prevent overparameterization, while dense datasets (> 5,000 points/cm2) use five columns for enhanced geometric fidelity. (3) Computational efficiency, which balancing triangle generation rates with processing constraints for large-scale canopy simulations.
Topologically structured meshing
-
Triangle construction follows a systematic connectivity algorithm ensuring anatomical fidelity. The connectivity pattern generates triangular facets between adjacent segments as follows:
$ {T}_{total}=8+8\times \left(N-2\right)=8N-8 $ (5) where, the basal and tip segments each contribute four triangular facets, and each intermediate segment pair generates eight facets. All triangular orientations follow the right-hand rule to ensure consistent normal vectors for accurate ray tracing computations.
Acquisition of phenotypic leaf traits
-
Leveraging the PLMA framework developed in this study, we quantitatively extract critical morphometric traits from leaf point clouds. The algorithm performs segment-wise analysis of leaf point clouds, precisely identifying the base, tip, and vein node coordinates required to derive leaf length, width, and projected surface area.
Leaf length
-
Leaf length is computed as the cumulative Euclidean distance between sequential vein nodes along the principal axis (Fig. 2c). The calculation is formalized as:
$ L={\sum }_{i=1}^{n-1}\sqrt{({x}_{i+1}-{x}_{i}{)}^{2}+({y}_{i+1}-{y}_{i}{)}^{2}+({z}_{i+1}-{z}_{i}{)}^{2}} $ (6) where, (xi, yi, zi) denotes the 3D coordinates of the i-th vein node, and n represents the total number of nodes.
Leaf width
-
The leaf width is defined as the maximum lateral distance within each segment corresponding to a specific Z-value of the leaf. As illustrated by the red lines in Fig. 2c, the width W of the leaf at each segment associated with a particular Z-value is calculated using the following formula. This formula incorporates width measurements from all segments corresponding to the different Z-values of the leaf.
$ W=ma{x}_{z}\left(ma{x}_{pi,pj\in Sz}\sqrt{({x}_{j}-{x}_{i}{)}^{2}+({y}_{j}-{y}_{i}{)}^{2}}\right) $ (7) Leaf area
-
The estimation of leaf area is performed using the triangular meshing model of the leaf. As illustrated in Fig. 2c, the model comprises triangles generated by connecting key points across segments. The area of each triangle is computed using the cross-product method, which accurately quantifies the total area enclosed by the leaf.
$ {a}_{k}=\dfrac{1}{2}\left\|(\overrightarrow{{p}_{k}^{1}}-\overrightarrow{{p}_{k}^{0}})\times \left(\overrightarrow{{p}_{k}^{2}}-\overrightarrow{{p}_{k}^{0}}\right)\right\| $ (8) $ A={\sum }_{k=1}^{m}{a}_{k} $ (9) This algorithm is of significant importance for plant phenotypic analysis and presents a novel, nondestructive, and precise approach to measuring leaf morphology. By directly extracting key points from the point cloud data, this method mitigates potential damage to plant specimens and provides accurate data support for subsequent genetic and environmental adaptability studies.
Construction of the canopy photosynthesis model
-
In this study, canopy models were developed for four tea plant sapling varieties: 'Yuehuang 1', 'Longjing 43', 'Tezao Naibai', and 'Zijuan' (Supplementary Fig. S2). Three planting configurations were simulated: (1) A compact layout with 20-cm plant spacing within a 60 cm × 80 cm plot configuration (arranged in four rows with five saplings per row) (Fig. 3a); (2) a denser compact layout with 10-cm plant spacing within a 30 cm × 40 cm plot configuration (four rows with five saplings per row) (Fig. 3a); and (3) a typical planting pattern characterized by 150-cm row spacing across four rows, with a spacing of 30 cm between individual saplings in each paired row (Fig. 3b).
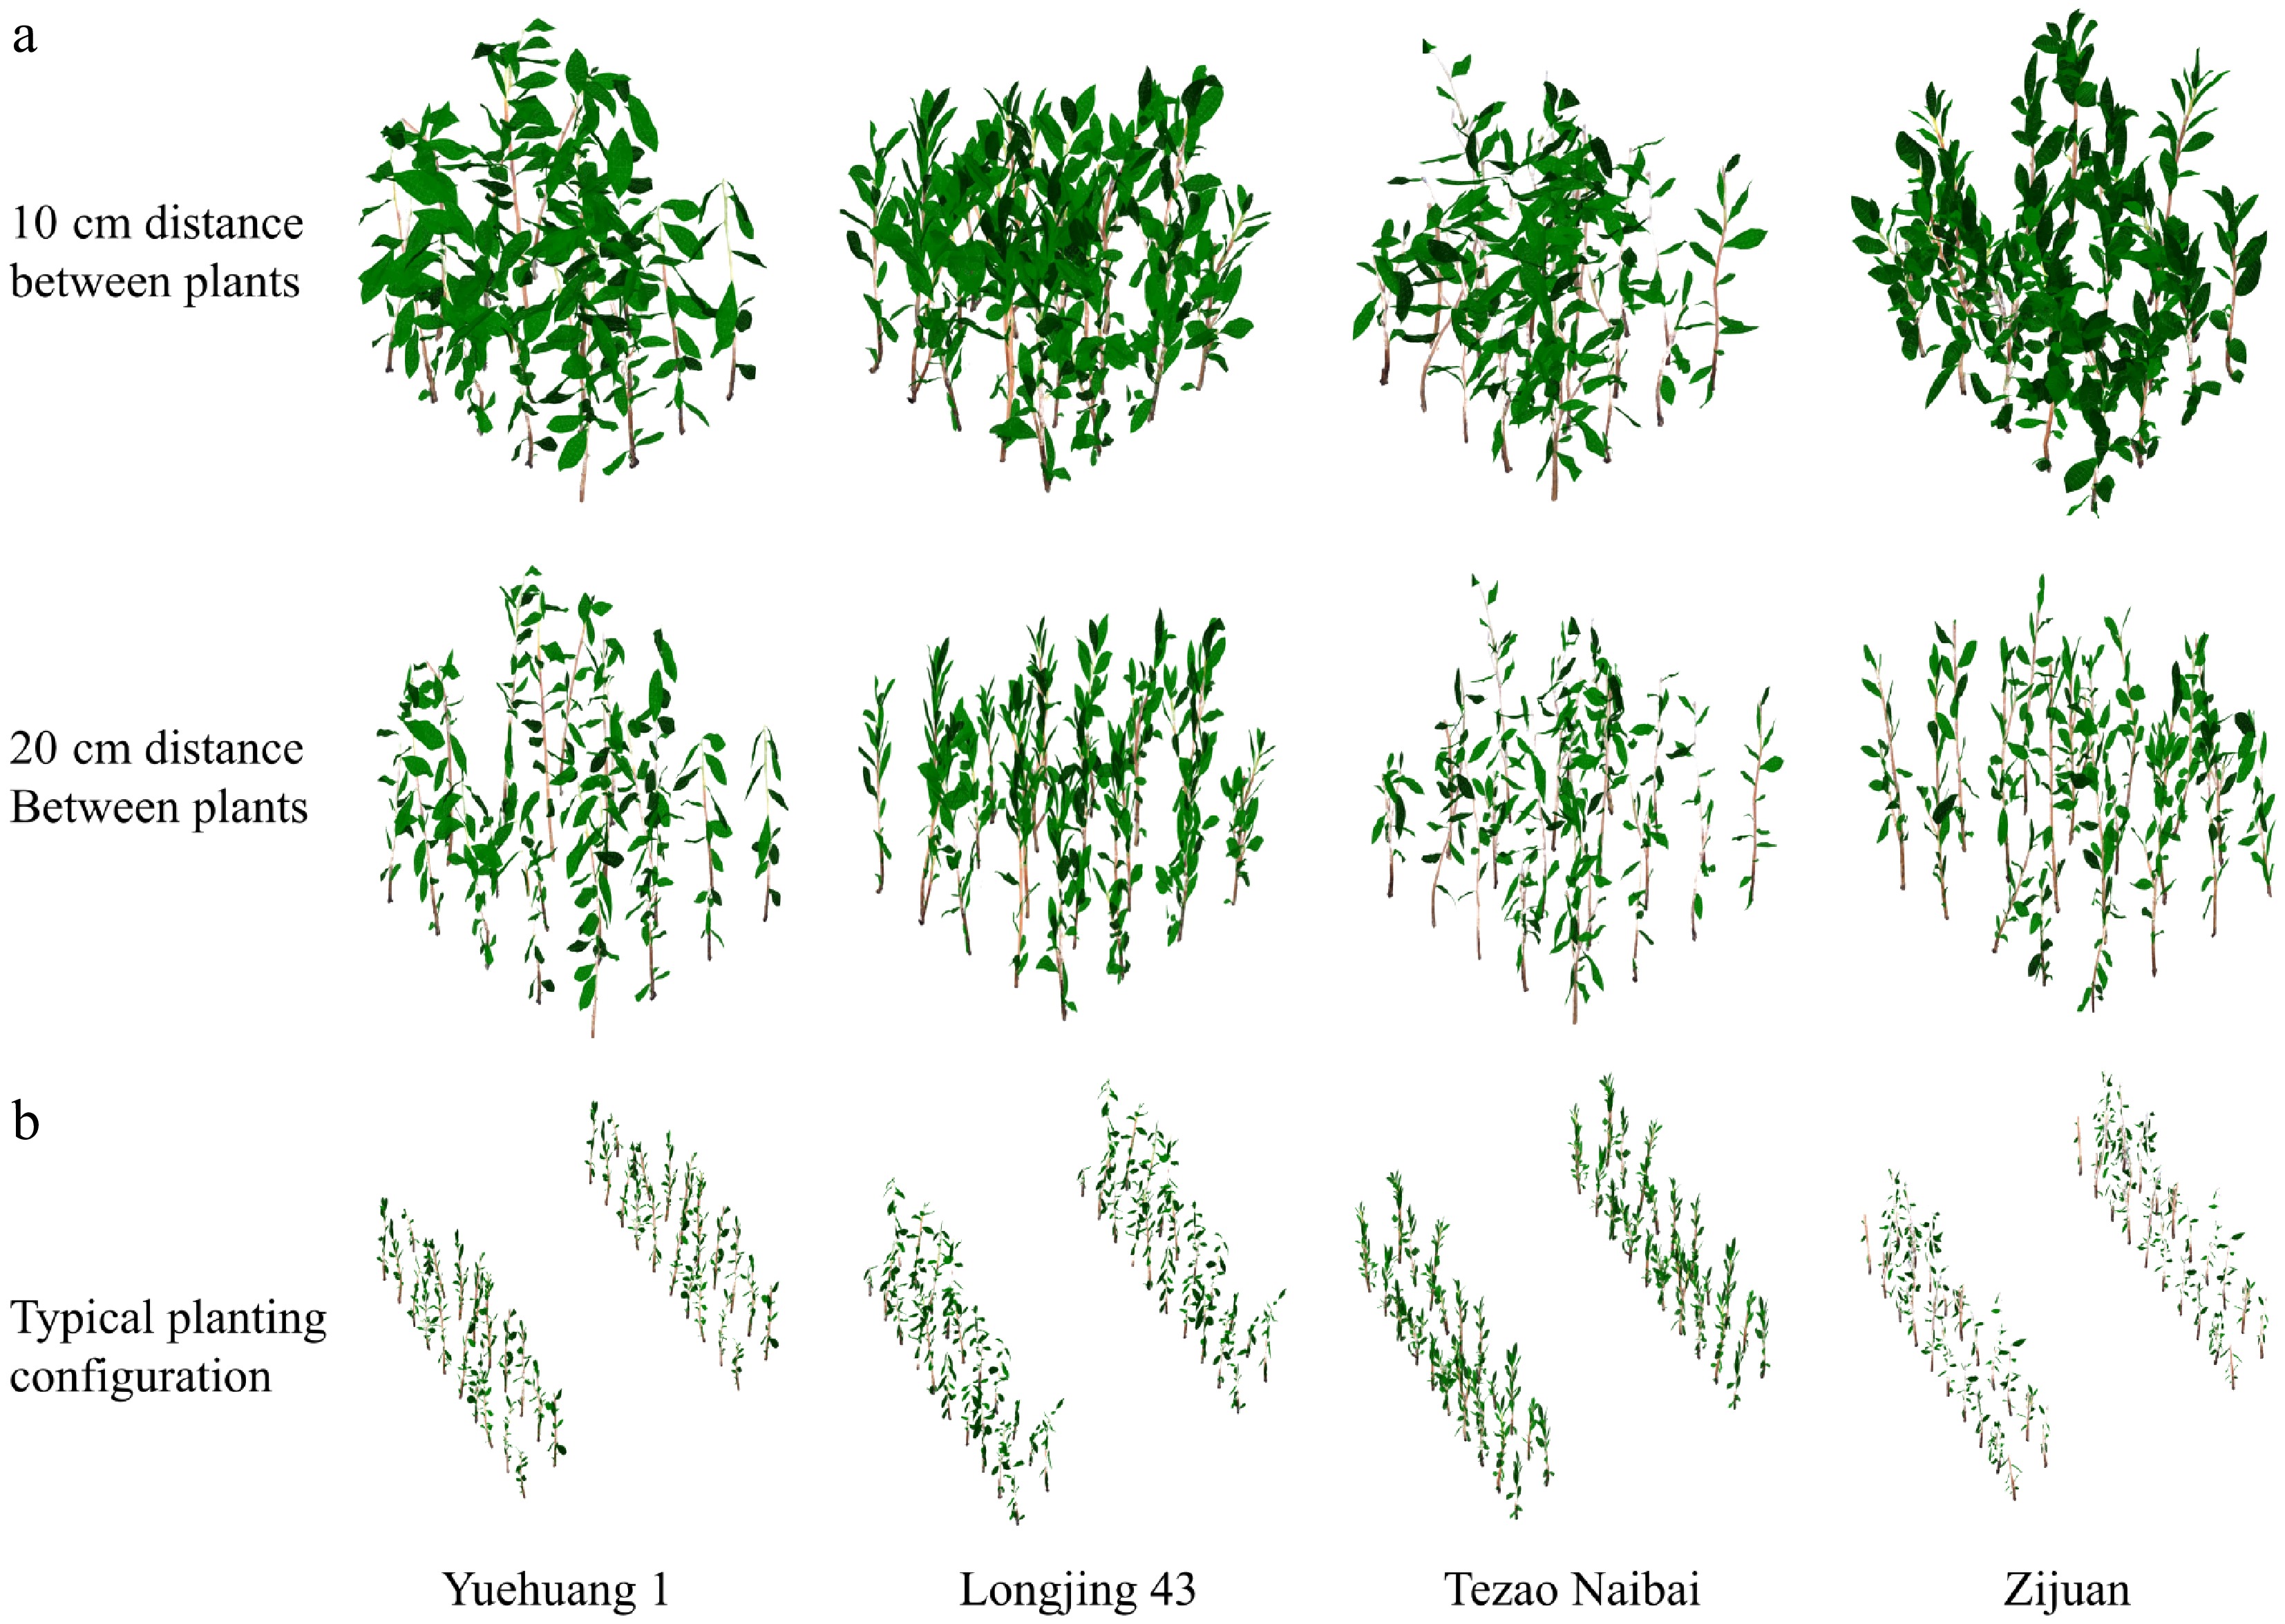
Figure 3.
Multi-scale modeling of the canopy photosynthesis characteristics of tea plant. (a) Schematic representations of canopy photosynthesis models for four tea plant cultivars ('Yuehuang 1', 'Longjing 43', 'Tezao Naibai', and 'Zijuan') are presented for two planting configurations: 10-cm inter-plant spacing (first row, left to right) and 20-cm inter-plant spacing (second row). Each row displays the 3D models in sequential columns corresponding to the listed cultivars. (b) Canopy photosynthesis models for the four tea plant cultivars under a typical planting configuration, depicting the spatial arrangement. Each paired row configuration features a wide inter-row spacing of 150 cm, with an inter-plant spacing of 30 cm between adjacent saplings within the paired rows.
FastTracer software[36] was utilized to conduct ray tracing on these 3D canopy models, simulating light distribution under different configurations. Canopy modeling facilitates the understanding of how planting density and arrangement influence light interception within the canopy, thereby impacting photosynthetic efficiency. This analysis is critical for optimizing planting configurations to maximize photosynthetic efficiency and plant growth.
Canopy photosynthesis
-
Based on the photosynthetic photon flux density (PPFD) values derived from the canopy model, the classical nonrectangular hyperbola leaf photosynthesis model[37] was utilized to compute the photosynthetic rate for each leaf mesh. The mathematical formulation of the model is as follows:
$ A = \frac{{\Phi *I + {P_{\max }} - \sqrt {{{(\Phi *I + {P_{\max }})}^2}} - 4*\theta *\Phi *I*{P_{\max }}}}{{2*\theta }} - {R_d} $ (10) In the model, A denotes the leaf photosynthetic rate (μmol CO2 m−2·s−1); I is the incident PPFD (μmol CO2 m−2·s−1); Pmax is the maximum leaf photosynthetic assimilation rate under light saturation (μmol CO2 m−2·s−1); Φ is the quantum yield of assimilation (μmol CO2 μmol photons−1); and θ is the convexity of the light response curve (dimensionless), describing the steepness of the transition in the curve; and Rd represents the rate of dark respiration (μmol CO2 m−2·s−1).
All parameters were determined from mature leaves during representative growing season conditions (clear sky, 33–35 °C; May 2016) using an LI-6400XT system (LI-COR Biosciences, USA). The fitted curve (Supplementary Fig. S3) illustrates the transition from light-limited to light-saturated photosynthesis.
Fitting the model yielded the following parameters: The quantum yield of assimilation (Φ) was determined to be 0.08696 mol CO2 mol photons–1), the maximum leaf photosynthetic assimilation rate under light saturation (Pmax) was 11.12 μmol CO2 m−2·s−1, the convexity of the light-response curve (θ) was 0.03926, and the dark respiration rate (Rd) was 3.06544 μmol CO2 m−2·s−1. The coefficient of determination (R2) for the regression was 0.9991, and it had a root mean square error (RMSE) of 0.1323. These metrics demonstrate excellent agreement between the model's predictions and the experimental data, validating the model's reliability for subsequent analysis and applications.
Statistical analysis
-
In this study, statistical analysis was conducted using Python scripts, with data processing performed using commonly used libraries such as NumPy, Pandas, and Scikit-learn. The performance of the ISBNet model was evaluated using multiple metrics, including average precision (AP), AP@0.25, and AP@0.50, to assess the segmentation effectiveness of the model on the point cloud data of tea plant. Additionally, precision (AR) and recall (RC-25, RC-50) metrics were used to comprehensively evaluate the model's performance.
After performing light ray tracing on the canopy photosynthesis model, we conducted linear regression analysis to explore the relationship between total canopy leaf area and PPFD. Pearson's correlation coefficient was used to evaluate the correlation between leaf area and light intensity. All statistical analyses were carried out using Python, with the results of the regression and correlation analysis providing a clear quantitative relationship between total canopy leaf area and PPFD.
-
To evaluate the predictive capabilities of the ISBNet model, a training dataset including 3D point clouds from 120 tea plant saplings and a validation dataset of point clouds from 30 independent saplings were utilized. Following training, the model was applied to unlabeled plant point cloud data for instance segmentation, enabling the identification of distinct plant organs (stems and leaves). Quantitative analysis revealed that the ISBNet model achieved accurate leaf segmentation when compared with manually annotated ground-truth point clouds (Fig. 4a). The voxel size was configured to 150 in the ISBNet model. Leaf-specific precision and recall metrics were calculated for individual plant, with both metrics exceeding 0.7 for all specimens and reaching maxima of 0.99. Small leaves and branches were identified as potential factors influencing segmentation performance. These results validate the effectiveness of the ISBNet model in plant point cloud segmentation tasks, providing a robust foundation for subsequent phenotypic feature extraction and plant physiological research.
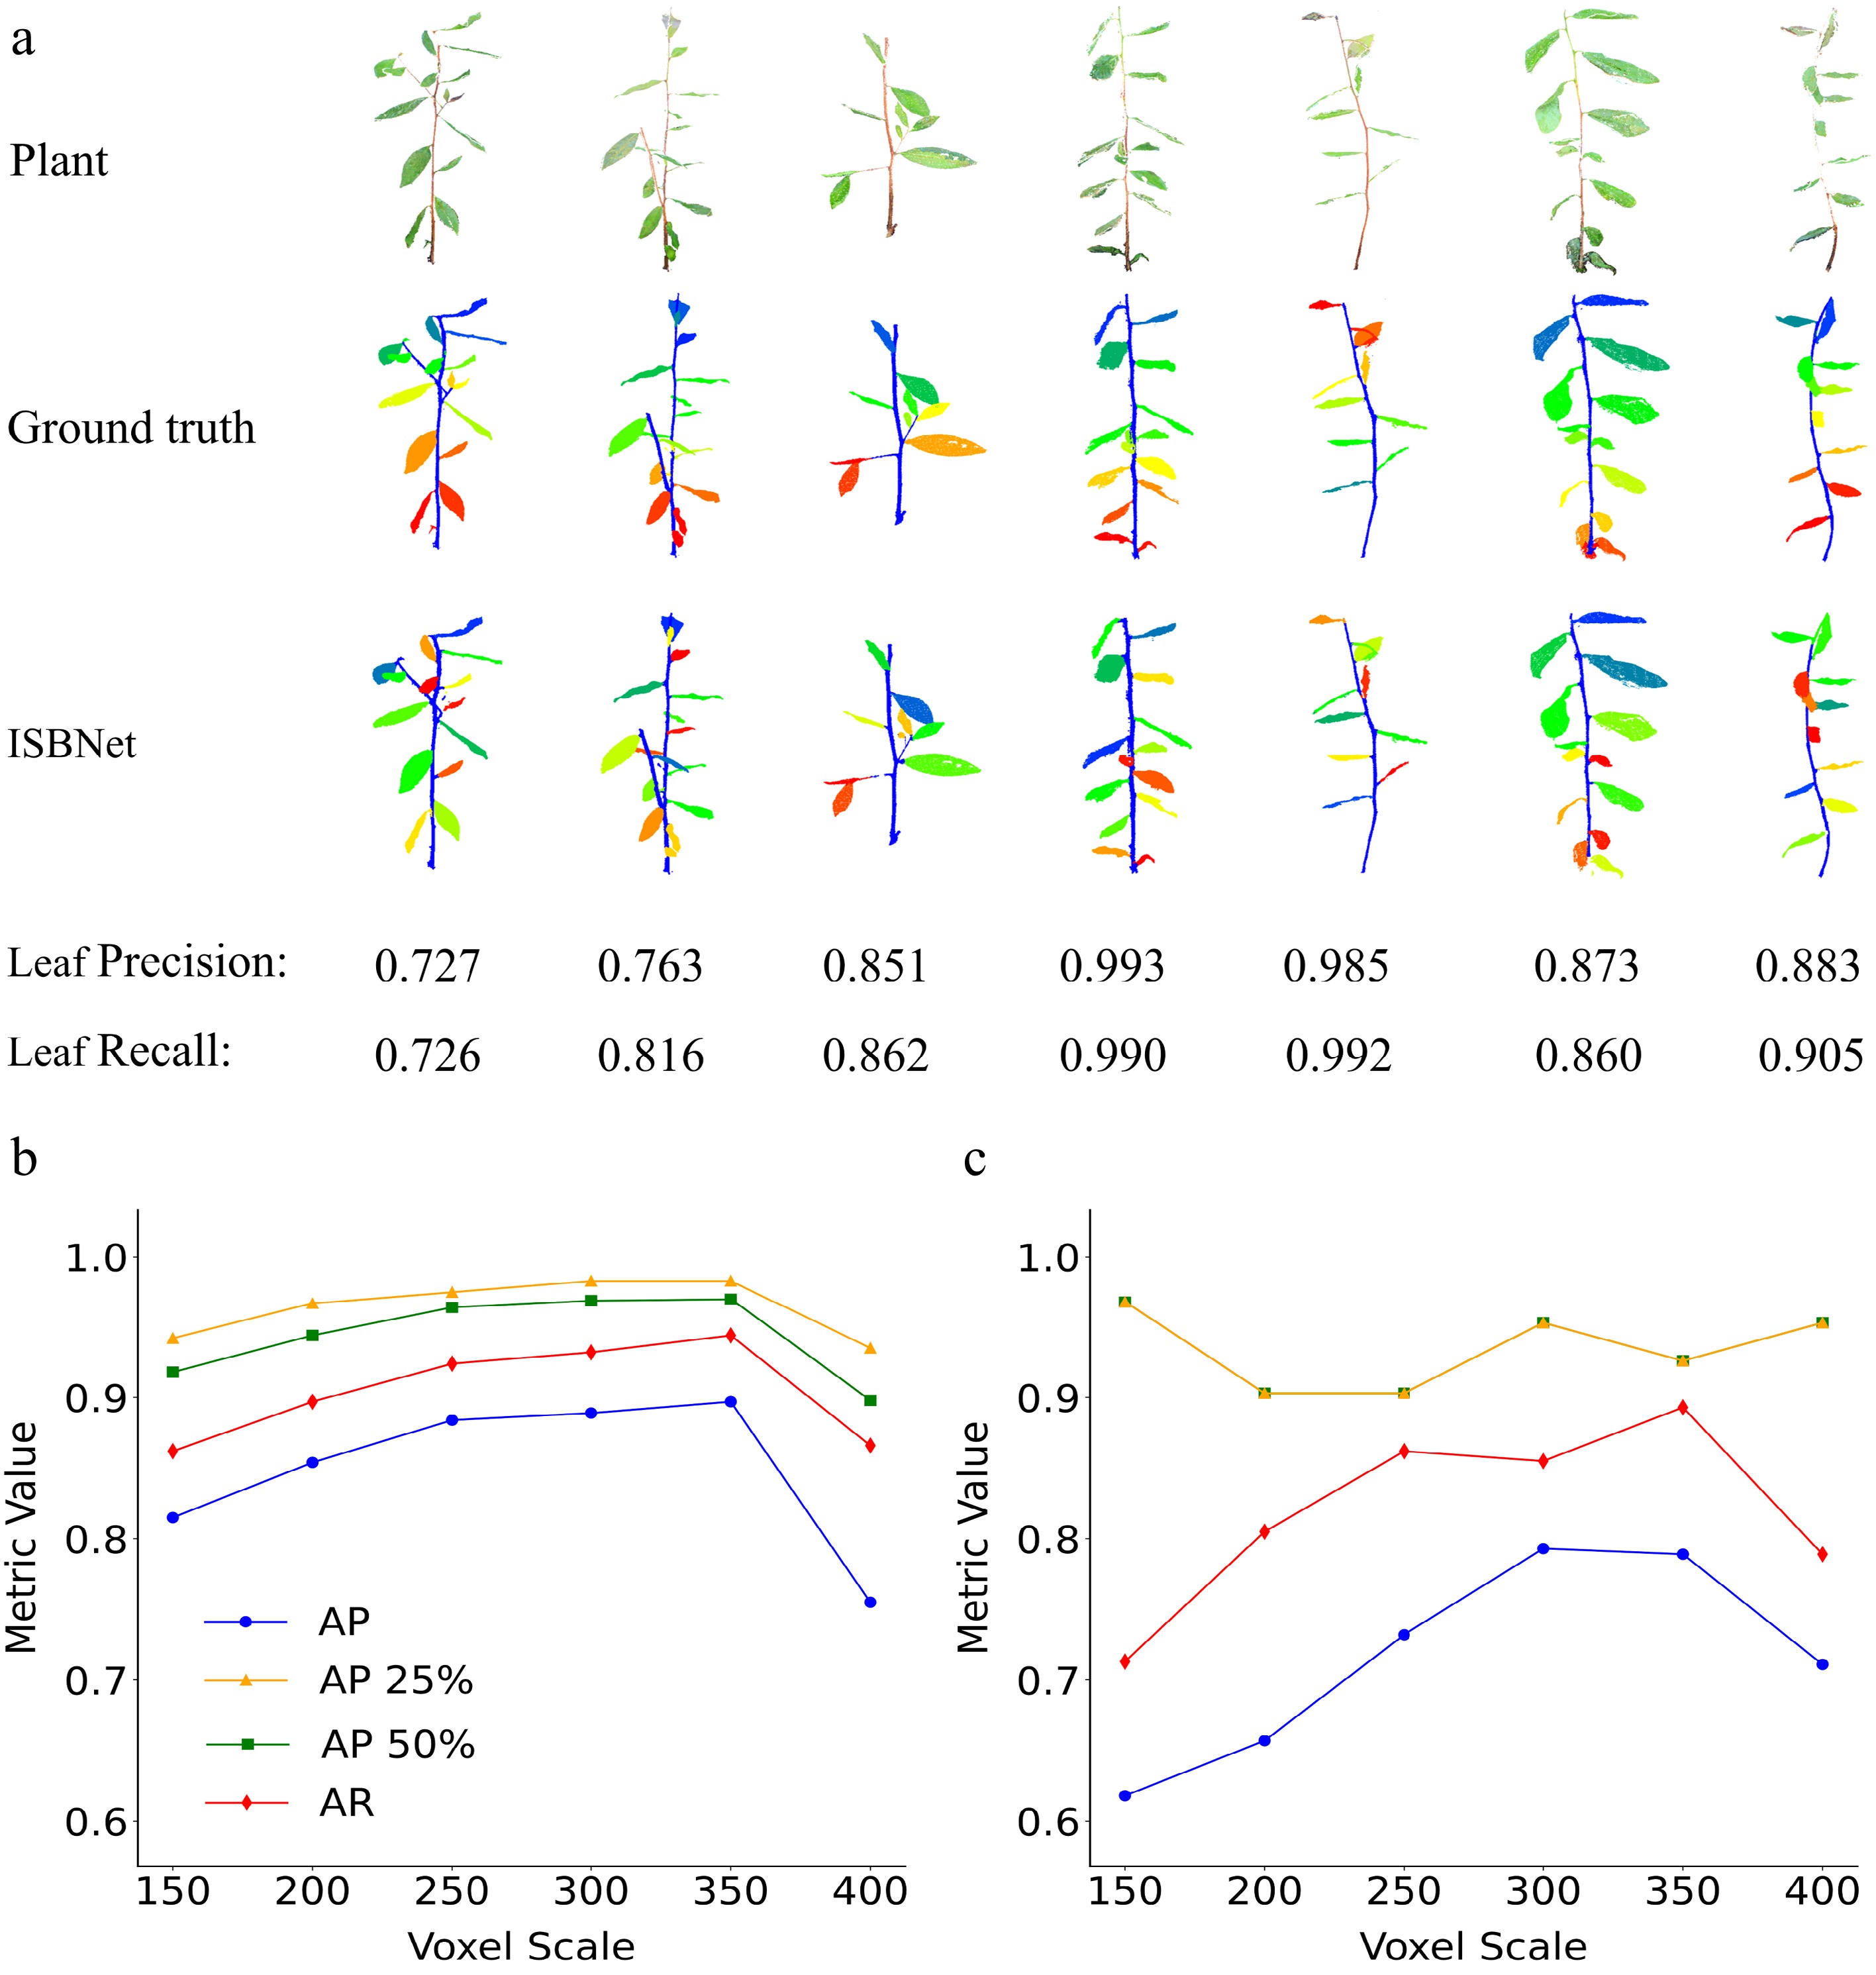
Figure 4.
Instance segmentation and performance evaluation of tea plant point clouds using ISBNet. (a) Schematic representation of the 3D point cloud segmentation workflow for tea plant saplings. Raw 3D point cloud data were acquired via multi-view stereo imaging (XYZ + RGB data). Ground-truth annotation: Expert-annotated labels were generated using CloudCompare v2.13, distinguishing stems (blue) and individual leaves (distinct colors) for supervised training. ISBNet Segmentation Output: Instance-aware semantic segmentation results, demonstrating precise organ-level separation with minimal boundary artifacts. This comparative visualization validates the model's capability to replicate the accuracy of manual annotation while enabling automated high-throughput phenotyping. Accuracy of (b) leaf segmentation across different voxel scale settings and (c) stem segmentation under varying voxel scales.
The valuation metrics used in this study to quantify the model's segmentation performance included the AP at various intersection over union (IoU) thresholds. Specifically, AP_50% and AP_25% denote the average precision calculated at IoU thresholds of 50% and 25%, respectively. Additionally, AP represents the mean precision computed across IoU thresholds ranging from 50% to 95% in 5% increments (Table 1). These metrics assess the model's capacity to detect instances with high spatial overlap. Furthermore, average recall (AR) and the area under the recall curve (RCA) were calculated at different IoU thresholds. AR_50% and AR_25% specifically refer to the area under the recall curve at IoU thresholds of 50% and 25%, respectively (Table 1). These metrics evaluate the model's ability to accurately detect instances and its robustness to instances with varying degrees of overlap.
Table 1. Segmentation performance of the ISBNet model trained under different voxel size configurations for plant organ detection.
Voxel
scalePlant
organAP AP_50% AP_25% AR RC_50% RC_25% 150 Leaf 0.815 0.918 0.942 0.862 0.930 0.954 Stem 0.618 0.968 0.968 0.713 1.000 1.000 200 Leaf 0.854 0.944 0.967 0.897 0.955 0.975 Stem 0.657 0.903 0.903 0.805 1.000 1.000 250 Leaf 0.884 0.964 0.975 0.924 0.973 0.983 Stem 0.732 0.903 0.903 0.862 1.000 1.000 300 Leaf 0.889 0.969 0.983 0.932 0.977 0.992 Stem 0.793 0.953 0.953 0.855 1.000 1.000 350 Leaf 0.897 0.970 0.983 0.944 0.978 0.990 Stem 0.789 0.926 0.926 0.893 1.000 1.000 400 Leaf 0.755 0.898 0.935 0.866 0.941 0.976 Stem 0.711 0.953 0.953 0.789 1.000 1.000 Evaluation metrics include average precision (AP) across all intersection over union (IoU) thresholds, AP at 50% and 25% IoU thresholds (AP_50%, AP_25%), average recall (AR), and recall curve area (RCA) at 50% and 25% IoU thresholds (RC_50%, RC_25%). This study investigated the influence of voxel-scale parameter adjustments on the performance of the ISBNet model in point cloud instance segmentation in tea plant. Precision and recall metrics were computed across voxel scales ranging from 150 to 400, with an optimal voxel scale of 350 identified (Table 1 and Fig. 4b, c). Given the inverse relationship between voxel scale and voxel size (i.e., voxel size = 1/voxel scale), larger voxel-scale values correspond to smaller voxel sizes, which are critical for capturing fine structural details. The modeling results show that increasing the voxel scale (and concomitantly decreasing the voxel size) enhances precision and recall in leaf instance segmentation. This improvement is attributed to the ability of smaller voxels to accurately resolve leaf edges and morphological details, particularly in cases involving complex leaf shapes or dense leaf arrangements. For stem segmentation tasks, higher voxel scales also yield superior results, indicating that reduced voxel sizes are equally important for preserving stems' geometric continuity and structural integrity. Regarding training stability, when voxel scales of 350 and 400 were employed, the model achieved peak accuracy within 50–150 training epochs but experienced abrupt performance degradation thereafter, with all metrics dropping to zero. This phenomenon is hypothesized to arise from overfitting to noise and fine-grained details in the training data at high voxel resolutions, resulting in compromised generalization capability. Additionally, smaller voxel sizes may exacerbate issues related to gradient instability (e.g., vanishing or exploding gradients) during training, which could be mitigated through optimizer parameter tuning or the implementation of gradient clipping techniques.
Performance of the PLMA
-
The meshing algorithm (PLMA) significantly enhances the efficiency of extracting plants' phenotypic information by simplifying complex 3D point clouds while preserving the critical morphological features. This capability is vital for downstream applications such as ray tracing, photosynthesis efficiency evaluation, and other plant phenomics studies.
A visual comparison of the leaf meshing process is presented in Fig. 5a, demonstrating the transformation from the original point cloud to the meshed model using the PLMA. The "Real-leaf" panel displays the raw 3D point cloud data, while "Alpha-shape", "Delaunay-2.5D", and "Ball-pivoting" illustrate the results from traditional meshing methods. In contrast, "PLMA-3", "PLMA-4", and "PLMA-5" represent the meshing outcomes generated by the PLMA with varying numbers of longitudinal axes (three, four, and five, respectively). As the number of longitudinal axes increases, the mesh model maintains the overall leaf morphology while improving the precision of geometric detail, offering flexibility for refined leaf shape modeling. To quantitatively evaluate computational efficiency, we compared processing times between the PLMA and traditional meshing methods using identical leaf point cloud data (See the detailed results in Supplementary Table S1). The PLMA achieved substantial reductions in mesh complexity with only 84–112 triangular facets compared with 1,337–19,495 facets for traditional methods, while maintaining reasonable processing times and morphological fidelity. An example of complete tea plant meshing is shown in Fig. 5b.
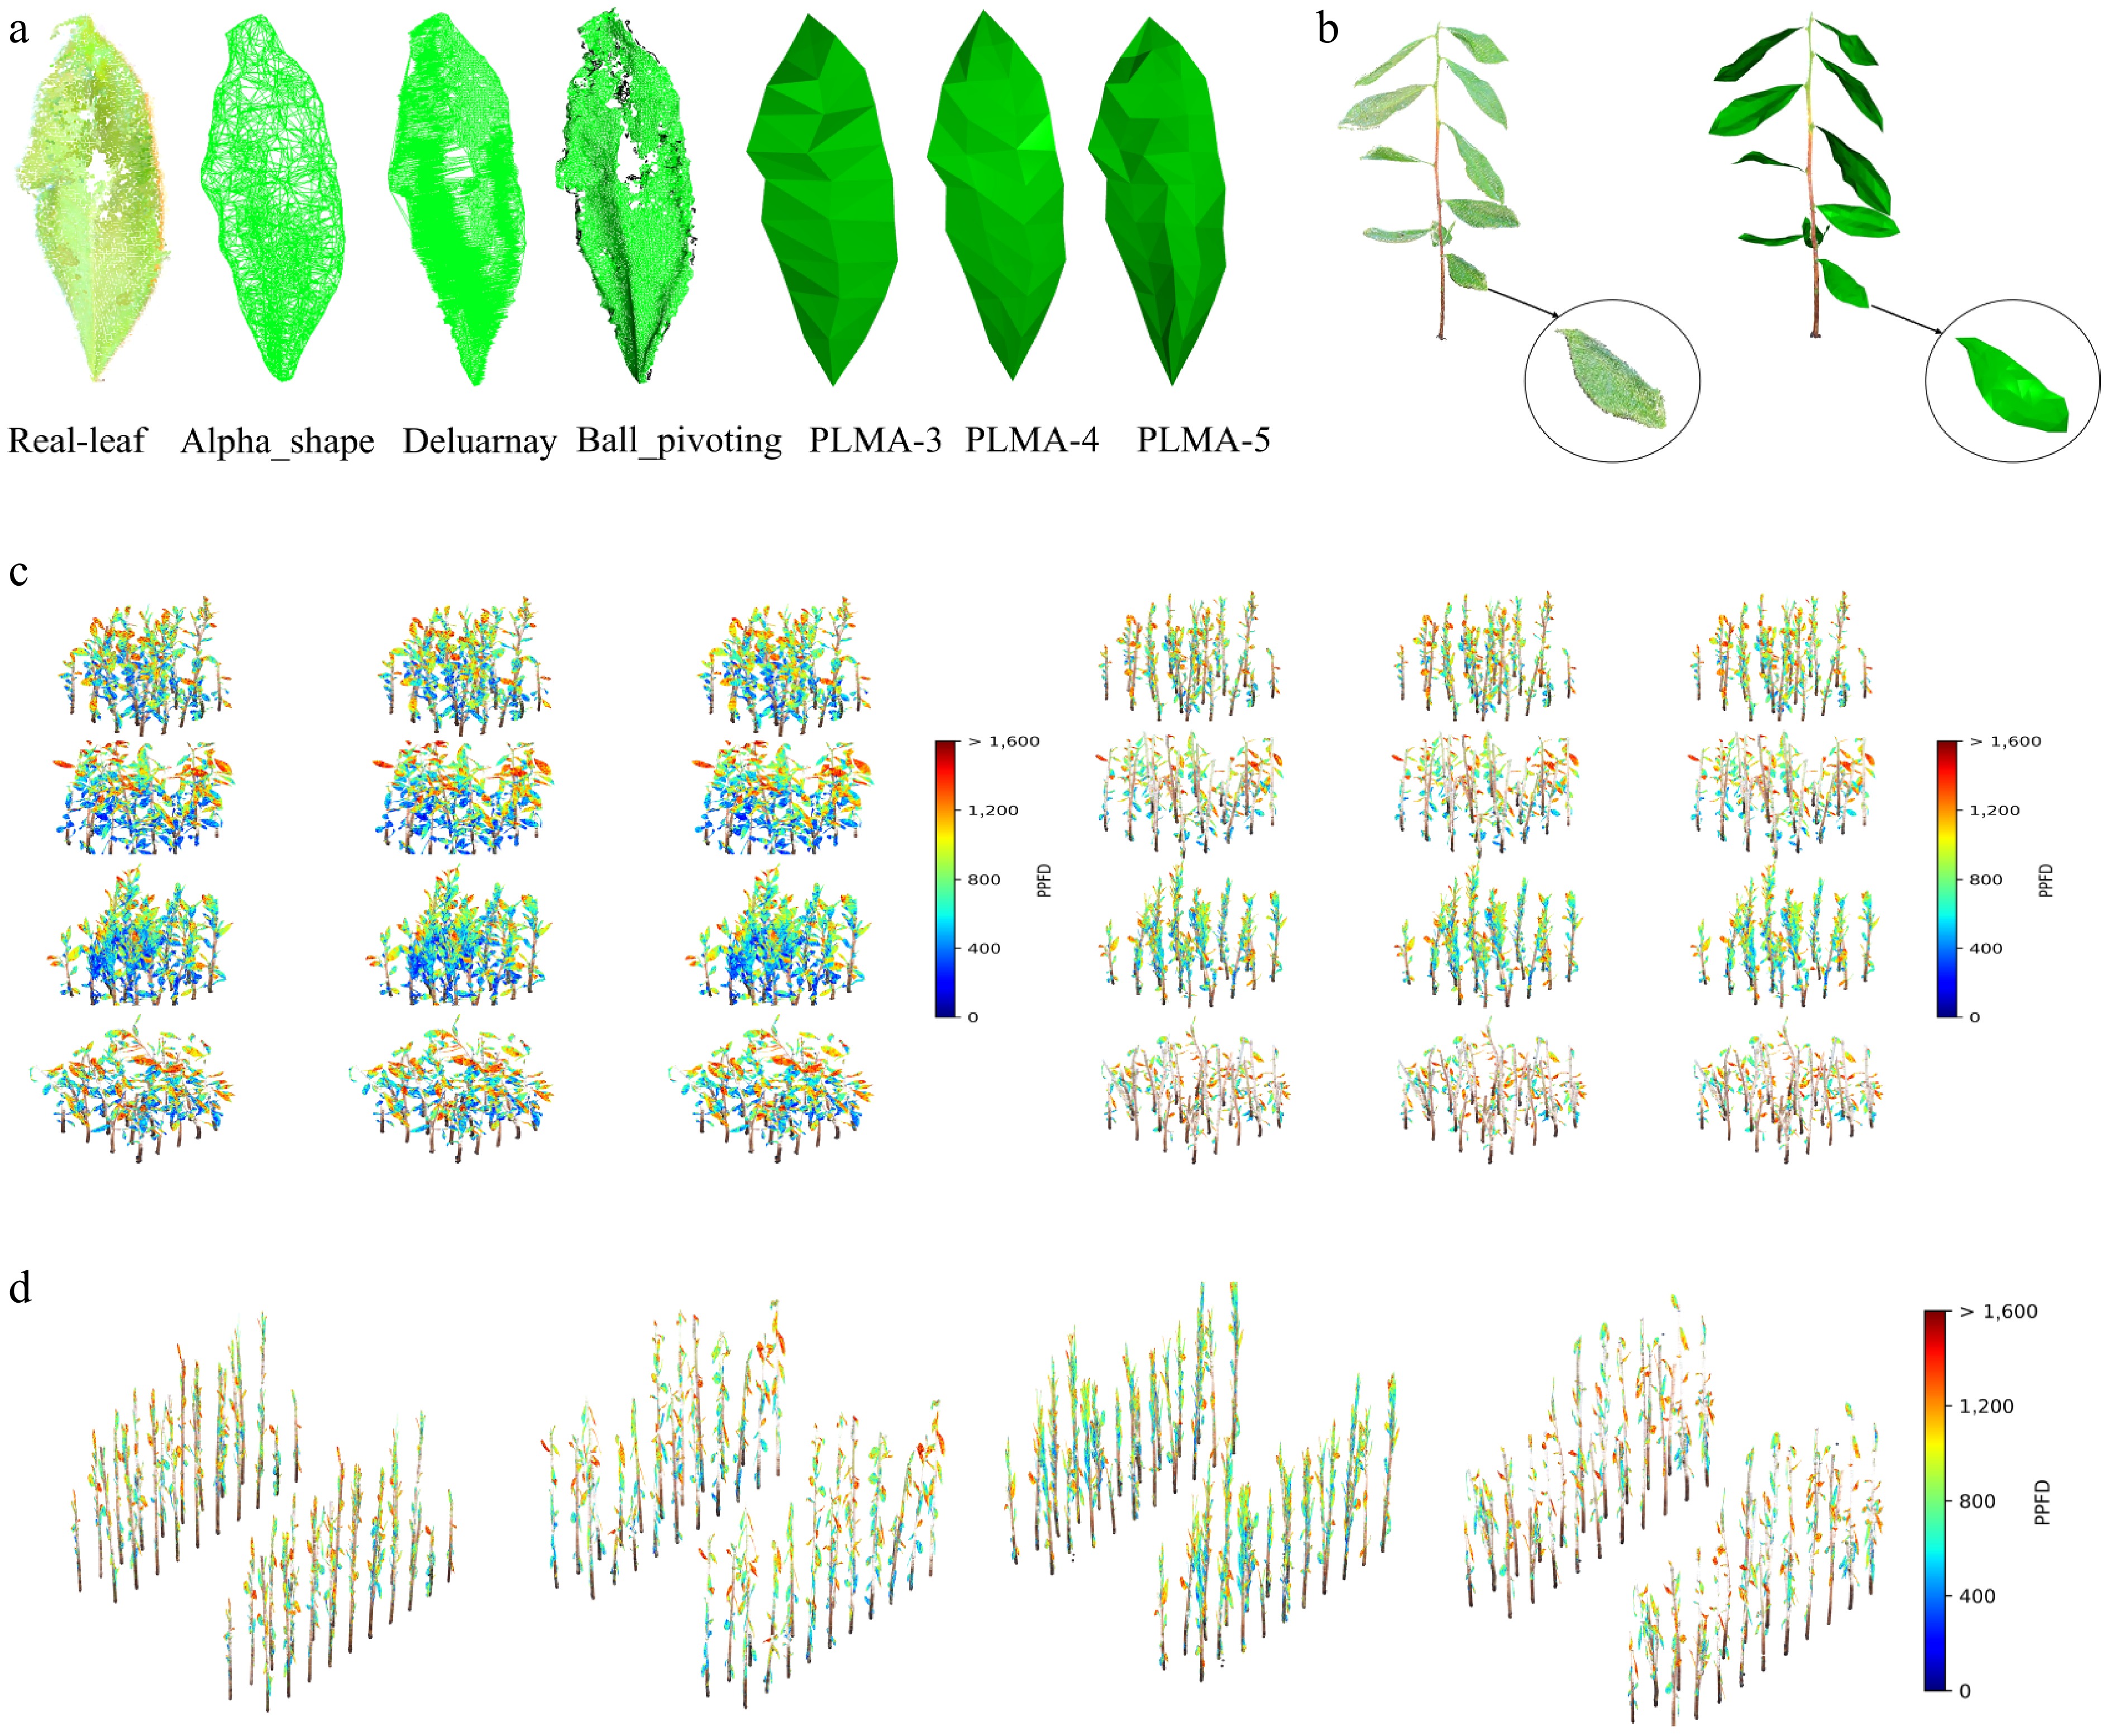
Figure 5.
(a) Comparison of meshing performance across conventional algorithms and the PLMA for tea plant leaves. Traditional methods: Alpha shape, Delaunay triangulation, and ball pivoting, which exhibit excessive triangulation and geometric distortions (e.g., cubic artifacts, edge discontinuities). The PLMA with 3, 4, and 5 keypoint columns. This comparative framework validates the PLMA's adaptability in optimizing the trade-off between geometric accuracy and computational efficiency for canopy photosynthesis modeling. (b) Visualization of the whole plant's point cloud and the meshing effects using the PLMA. (c) The simulated PPFD distributions under inter-plant spacings of 10 and 20 cm, using the canopy photosynthesis model. Each section illustrates the impact of these spacings on four different tea cultivars: 'Longjing 43', 'Tezao Naibai', 'Yuehuang 1', and 'Zijuan' (arranged from top to bottom). Within each section, columns from left to right correspond to models generated with different PLMA configurations: PLMA-5 (five longitudinal axes), PLMA-4 (four longitudinal axes), and PLMA-3 (three longitudinal axes). The color gradient in these sections represents the PPFD values (μmol photons m−2·s−1) absorbed by the canopy at 12:00 PM, demonstrating how spacing influences light absorption. (d) A typical planting configuration, showing the distribution of PPFD for the same cultivars, from left to right. This section highlights the light distribution patterns specific to each cultivar under standard planting arrangements, with the color gradient indicating the PPFD values absorbed by the canopy at 12:00 PM.
Plant architectural traits extracted by the model
-
This section highlights the results of the quantitative analysis of the phenotypic features of tea plant sapling leaves obtained through the application of meshed models. Detailed measurement data are summarized in Supplementary Table S2, including key metrics such as leaf area, leaf length, and leaf width. These results are derived from precise calculations of the corresponding geometric parameters within the meshed models. The data in Supplementary Table S2 show that the model can extract features from multiple leaves within a plant. The quantified phenotypic features serve as crucial indicators for assessing plant growth conditions and biological functions. These precise phenotypic data enable researchers to gain a deeper understanding of the canopy photosynthetic efficiency of tea plant saplings at specific growth stages and their responses to environmental changes. Additionally, these quantified results provide solid data support for the application of computer vision technology in the field of precision agriculture, enhancing the potential for targeted interventions and management strategies.
Canopy photosynthesis simulation for various planting patterns
-
In this study, we utilized the PLMA triangulation algorithm to construct a plant canopy model, performed canopy light simulation using the FastTracer ray tracing program, and calculated the canopy photosynthetic rate. FastTracer has been validated for accuracy in canopy light simulation studies, showing a strong correlation with field measurements in various crop systems[14,38−40]. This process allowed us to accurately capture phenotypic information closely related to photosynthesis. By employing this method, we successfully quantified the PPFD received by the plant canopy, which is a key indicator for assessing plants' photosynthetic capabilities and growth conditions. PPFD is a measure of the amount of light, in terms of photons, that falls on a given surface area per unit of time, which directly impacts the plant canopy's photosynthesis and growth. We specifically analyzed the canopy's PPFD values, including direct, diffuse, and scattered light, on Day 249 of 2015 in Songjiang District, Shanghai.
The canopy model of the four tea cultivars ('Longjing 43', 'Tezao Naibai', 'Yuehuang 1', and 'Zijuan') were constructed with plant spacings of 10 and 20 cm (Fig. 5c), and a typical planting configuration (Fig. 5d). The color in the model shows the simulated PPFD absorbed by the canopy at 12:00 PM. From the model, we can see clearly the impact of cultivar and plant spacing on the canopy light distribution. The effect of the meshing model's setting (e.g., PLMA-3, -4, and -5) on the light distribution was simulated with the model, and the results show that the canopy's light distribution was not significantly influenced by the meshing settings.
The effects of leaf meshing parameters on the calculation of canopy photosynthesis
-
Figure 6a–d presents the diurnal photosynthetic rate variations of four tea plant cultivars, namely 'Longjing 43' (LJ, Fig. 6a), 'Tezao Naibai' (NB, Fig. 6b), 'Yuehuang 1' (YH, Fig. 6c), and 'Zijuan' (ZJ, Fig. 6d), under two inter-plant spacing conditions (10 vs. 20 cm) using the PLMA-3, PLMA-4, and PLMA-5 configurations. At 10-cm spacing, all configurations displayed higher peak photosynthetic rates, attributed to the increased leaf area index (LAI) and improved light interception efficiency in dense planting systems. Conversely, photosynthetic rates at 20-cm spacing were significantly lower, likely because of the reduced leaf area density per unit of ground area, despite the increased light availability for individual plant. Diurnal canopy photosynthetic rates of four tea plant cultivars under the PLMA-5 meshing configuration are presented in Fig. 6e, based on calculations derived from the AQ curve. The cultivar YH exhibited the highest canopy photosynthetic activity, followed by NB, with ZJ and LJ demonstrating the lowest rates. It is important to note that these simulation results are specific to the samples analyzed in this study. These findings highlight the critical role of canopy structure in photosynthetic performance and emphasize the importance of optimizing inter-plant spacing for maximizing agricultural productivity.
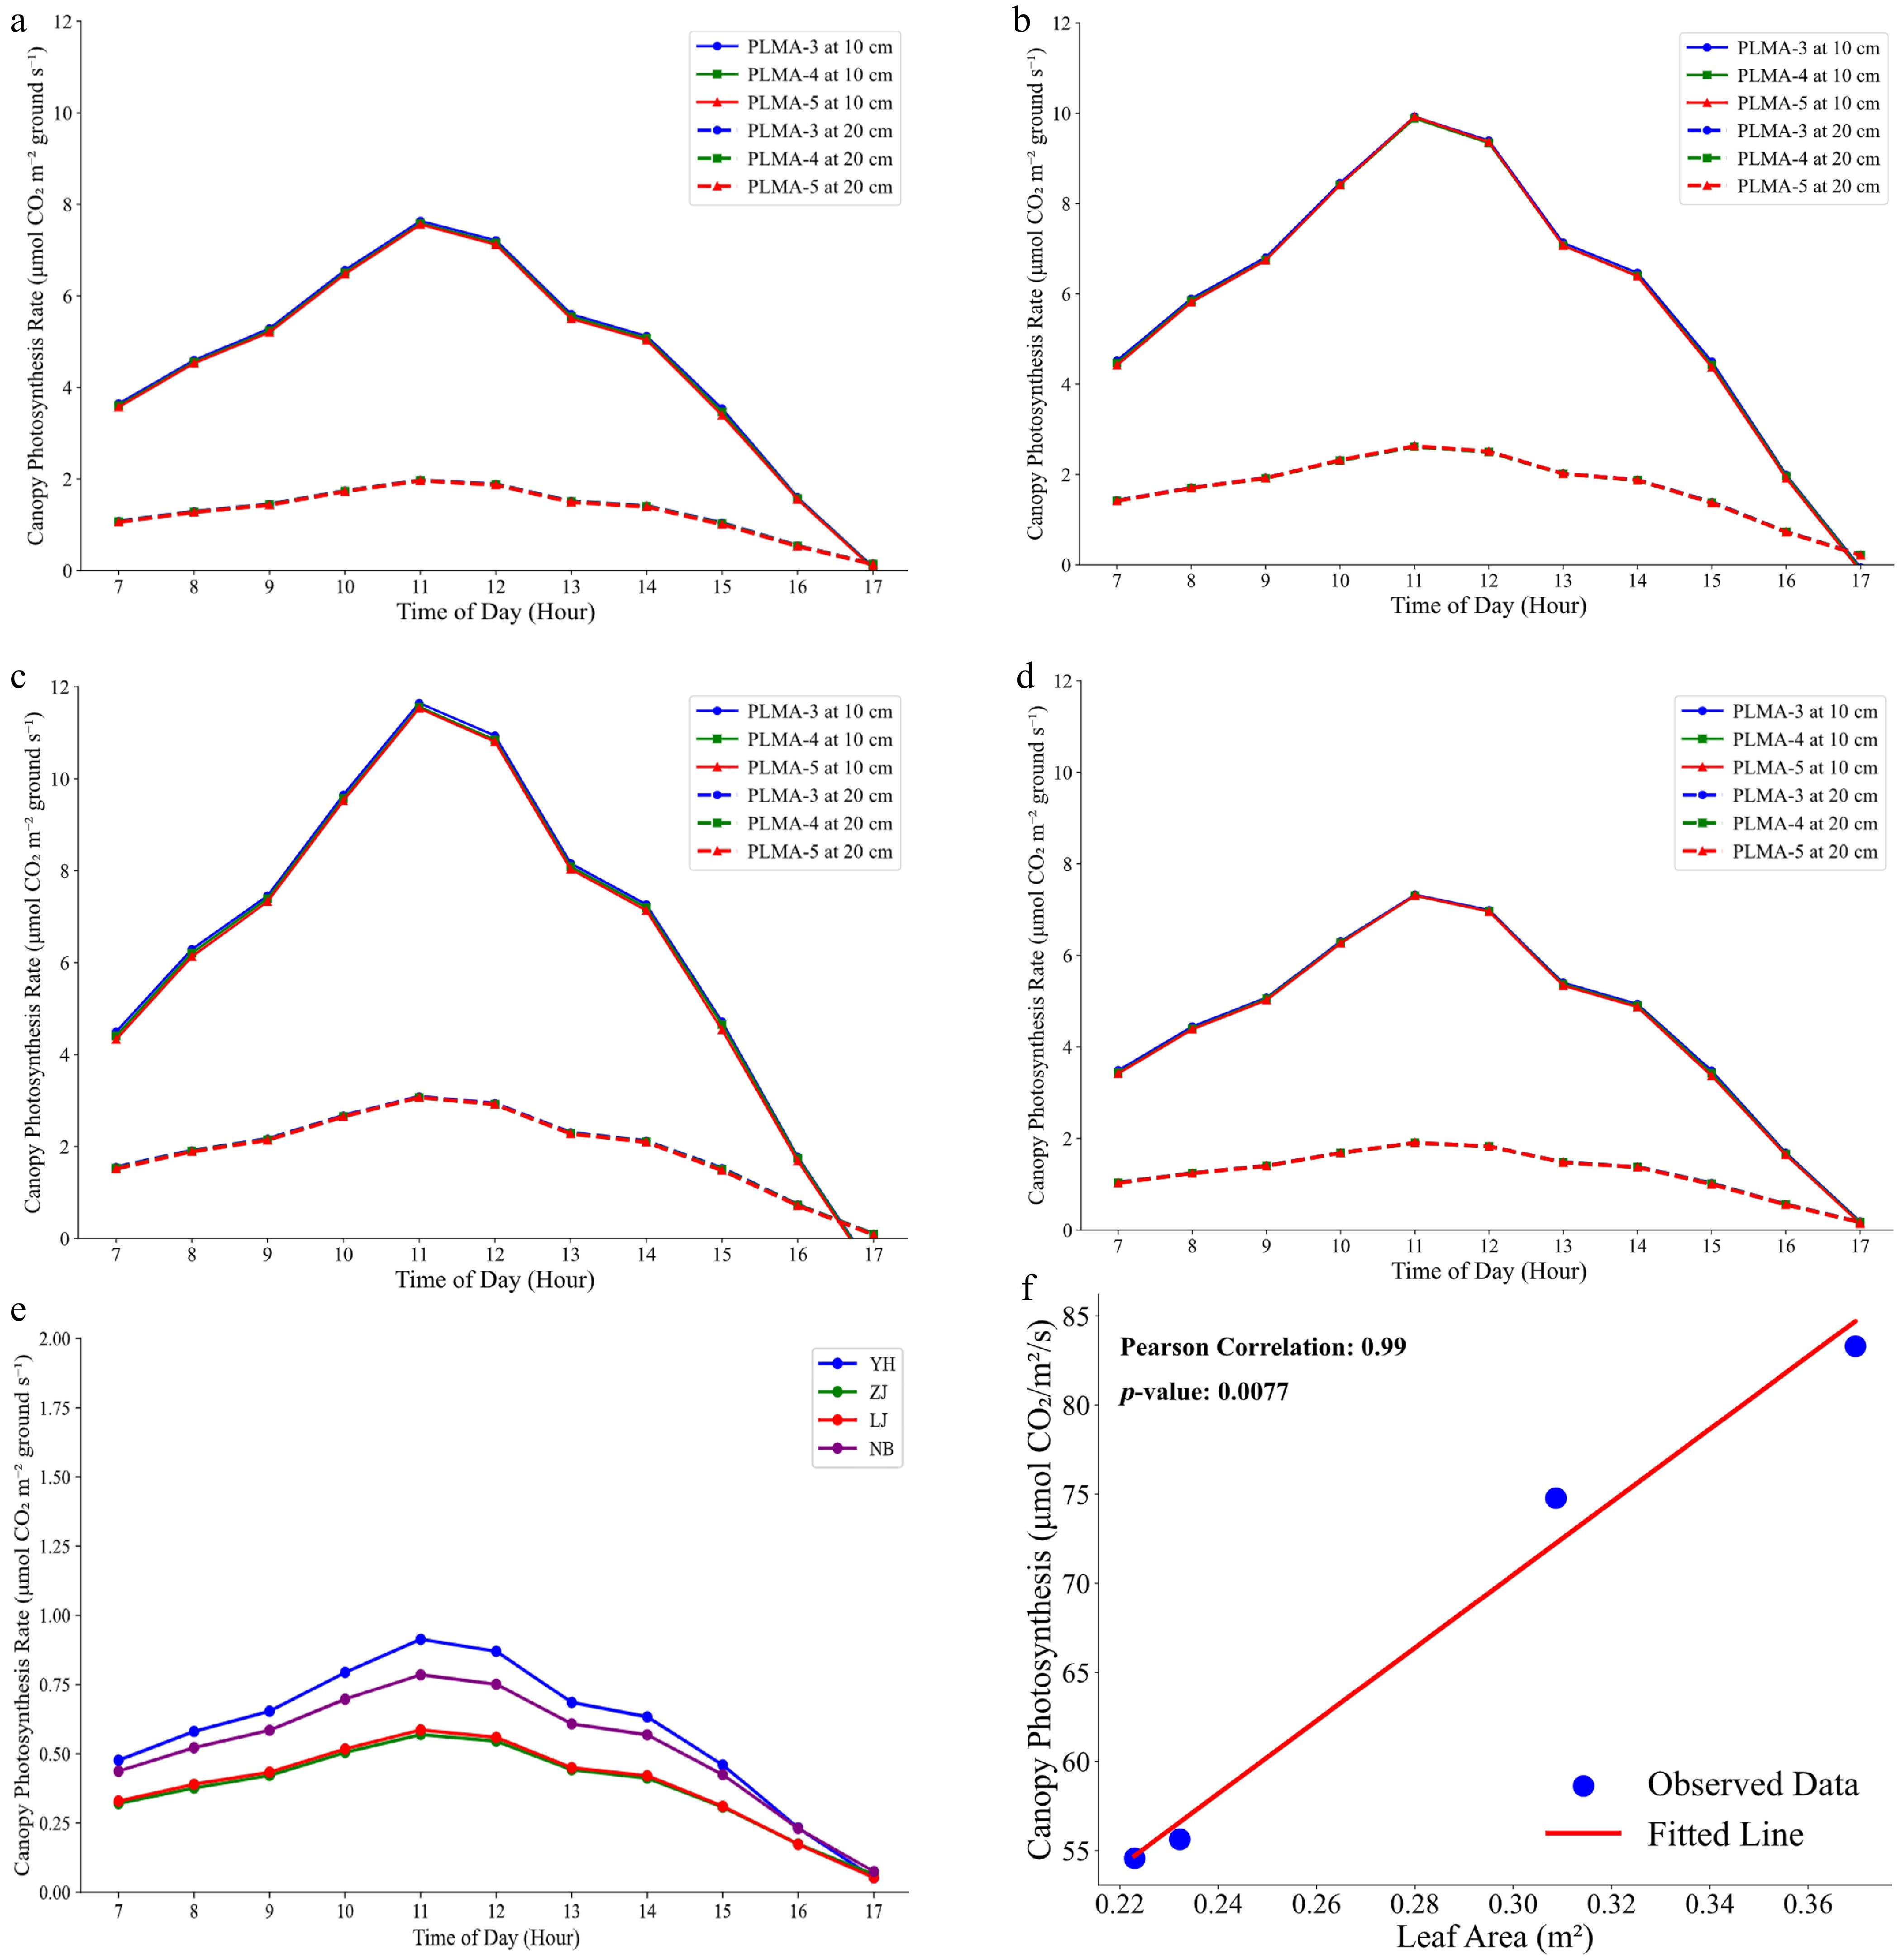
Figure 6.
(a)–(d) Diurnal variation of photosynthetic rate at a spacing of 10 and 20 cm using the PLMA-3 (three longitudinal axes), PLMA-4 (four longitudinal axes), and PLMA-5 (five longitudinal axes) configurations for four cultivars, namely (a) 'Longjing 43', (b) 'Tezao Naibai', (c) 'Yuehuang 1', and (d) 'Zijuan'. Different curves represent different PLMA configurations and different spacings. (e) The canopy's photosynthetic rate was lower with larger plant spacing when using the standard planting method of tea plant, illustrating the population photosynthetic efficiency of different varieties. (f) Correlation between the canopy's photosynthetic rate and total leaf area of the canopy. The Pearson correlation is 0.99, emphasizing the crucial role of leaf area in determining photosynthetic efficiency.
Comparison with traditional canopy photosynthesis models
-
Gu et al. compared zero-dimensional, one-dimensional, two-dimensional (2D), and 3D canopy photosynthesis models, revealing that only high-resolution 3D models could realistically reflect significant differences in light interception and photosynthetic capacity among different crop varieties while effectively reducing overestimation errors[8]. On the basis of this foundation, we compared our 3D voxel-based model with the traditional Big-Leaf and Sunlit-Shaded models to evaluate the modeling accuracy.
The model's performance under dense planting (10-cm spacing)
-
Figure 7a–d presents the diurnal variations of the canopy's photosynthetic rates for four tea cultivars under dense planting conditions (10-cm spacing) using the Big-Leaf model, Sunlit-Shaded model, and our 3D model. Daily integrated photosynthetic rates showed significant overestimation by the traditional models, with the Big-Leaf model overestimating daily canopy photosynthesis by 8.1%–11.3% and the Sunlit-Shaded model by 1.0%–2.1% compared with the 3D model. The Big-Leaf model's uniform light assumption ignores the exponential light attenuation and self-shading effects that are critical in dense planting systems. The Sunlit-Shaded model, while distinguishing between sunlit and shaded fractions, still fails to capture the fine-scale spatial heterogeneity in light microenvironments and the corresponding photosynthetic acclimation patterns.
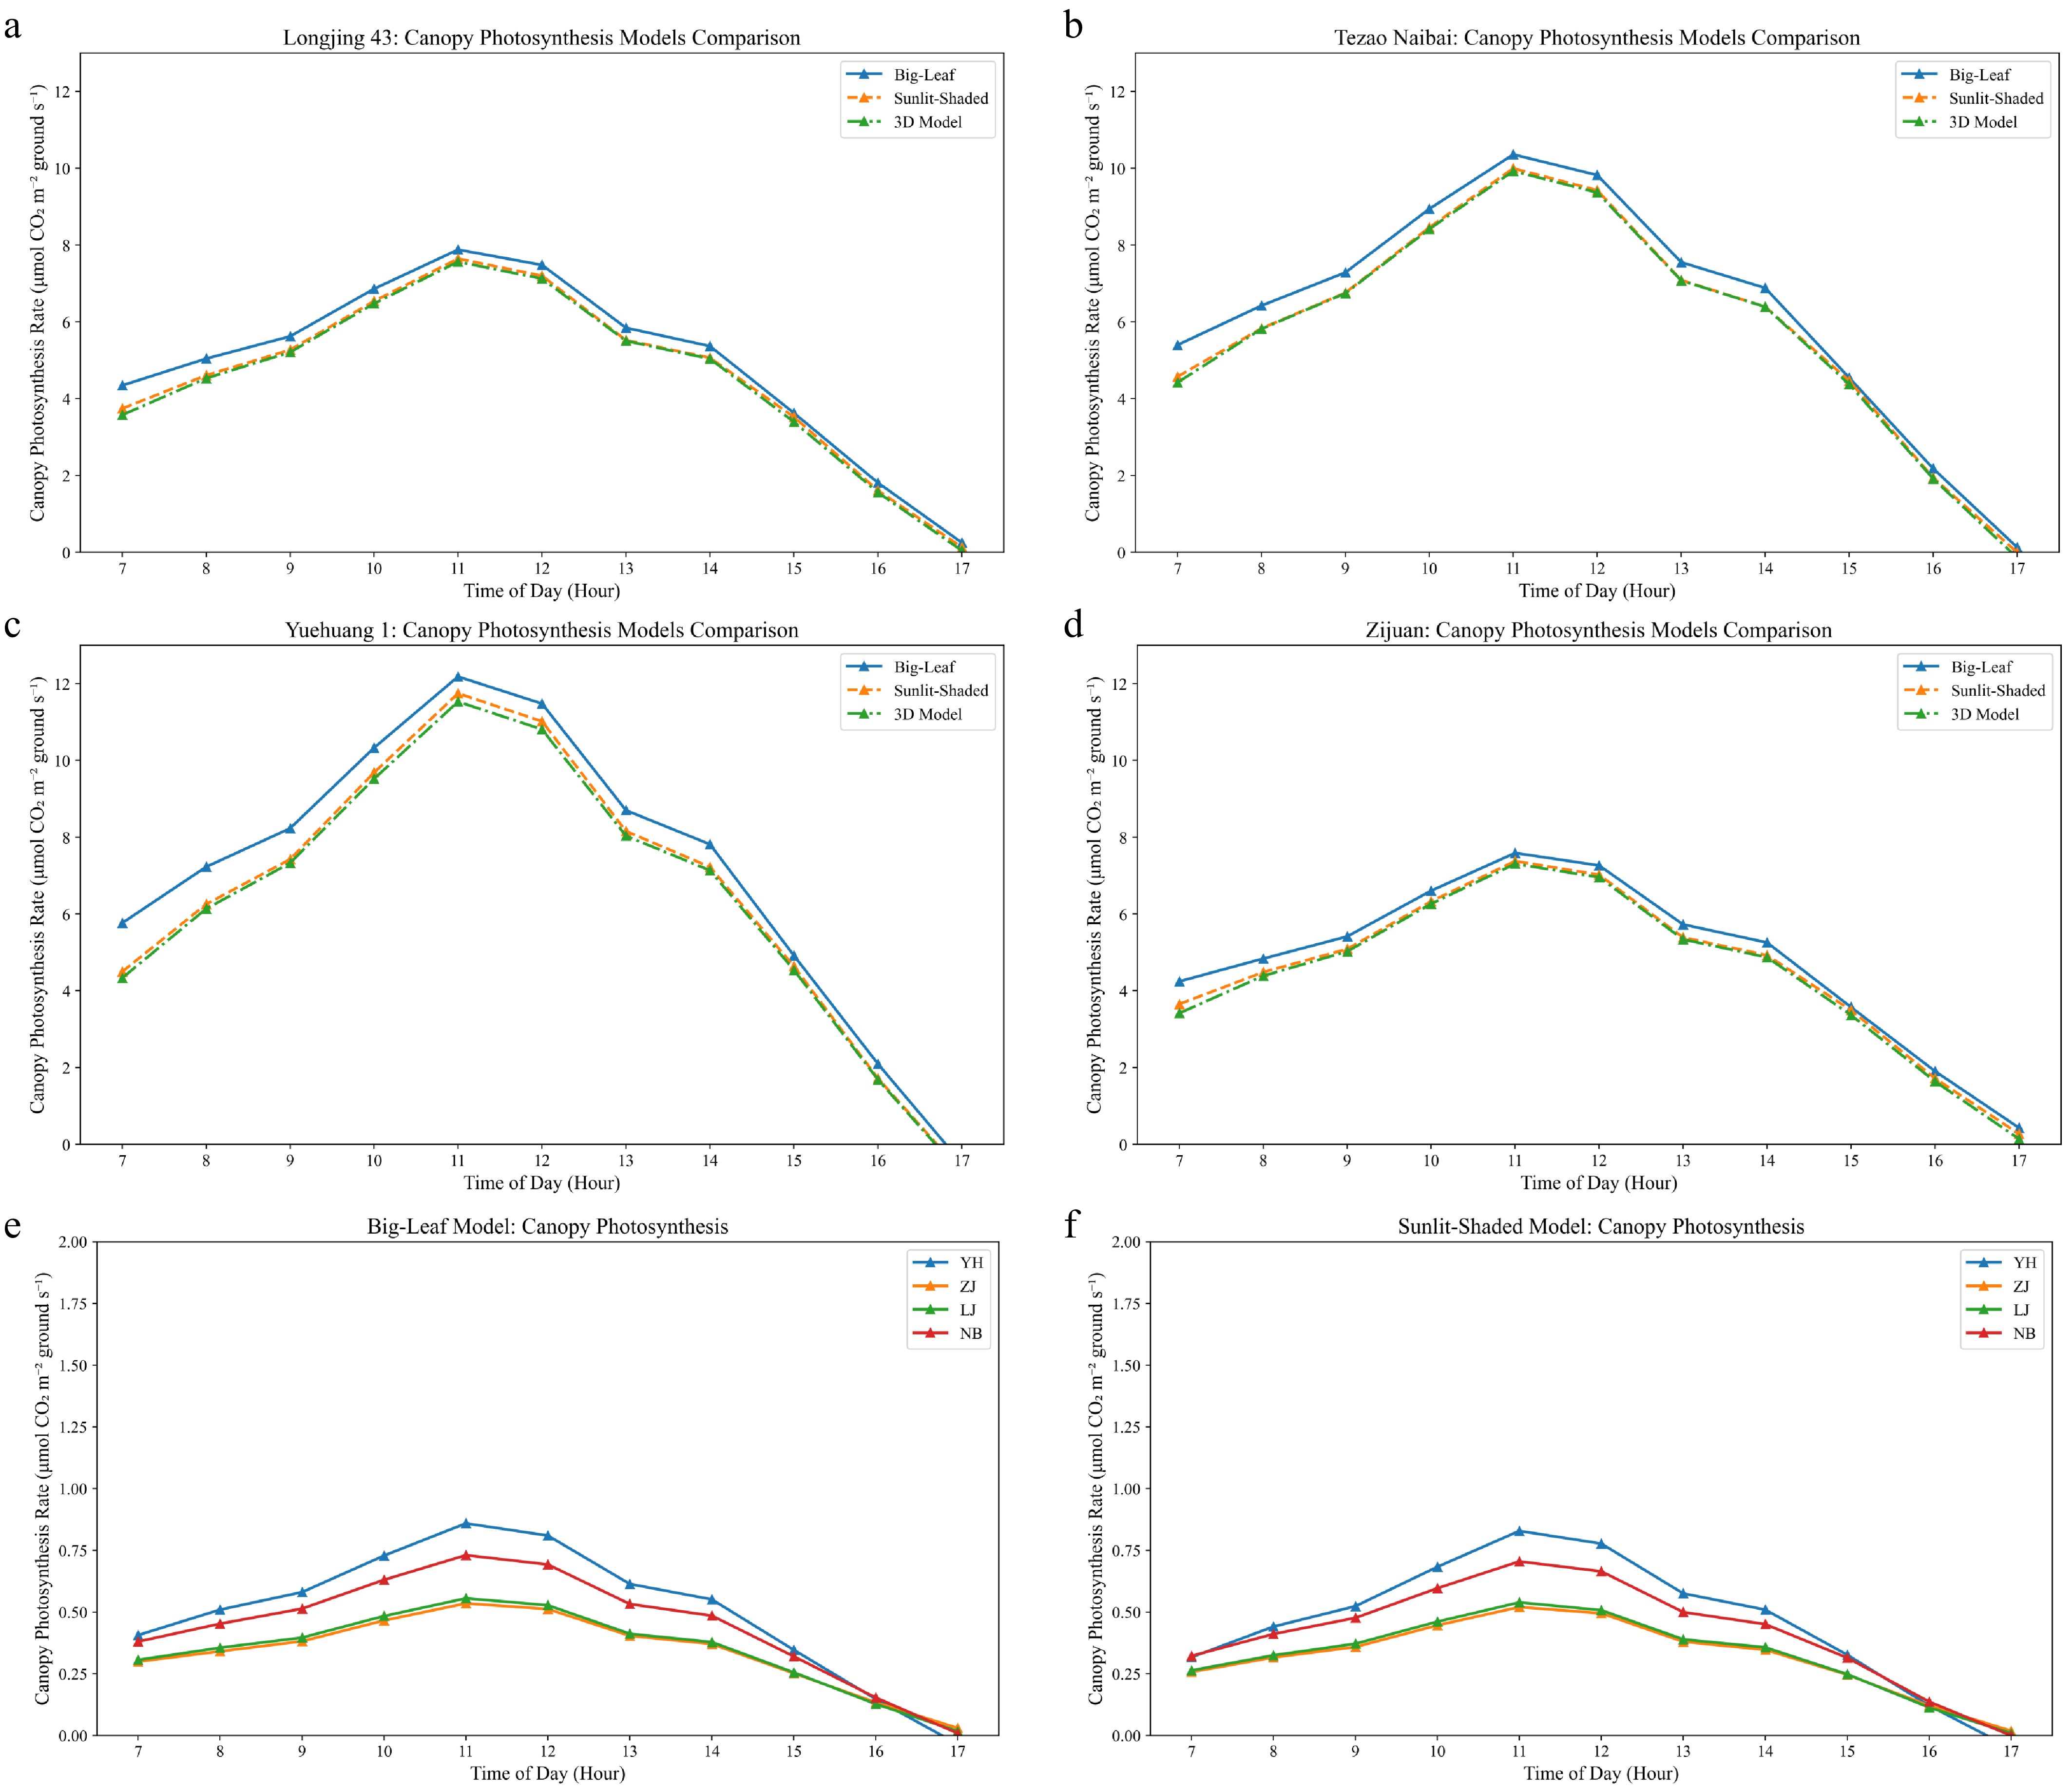
Figure 7.
Comparison of predicted canopy photosynthesis with the three modeling approaches. (a)–(d) Diurnal variations in the canopy's photosynthetic rates for four tea cultivars ('Longjing 43', 'Tezao Naibai', 'Yuehuang 1', and 'Zijuan') under dense planting conditions (10-cm spacing) using the Big-Leaf model (blue line), the Sunlit-Shaded model (orange line), and the 3D voxel-based model (green line). (e), (f) The canopy's photosynthetic performance under the standard planting configuration for (e) the Big-Leaf model and (f) the Sunlit-Shaded model, corresponding to the 3D model's results shown in Fig. 6e. All simulations were conducted using the nonrectangular hyperbola model for light response curves.
Model performance under the standard planting configuration
-
Figure 7e, f shows identical overestimation patterns under different planting densities (Big-Leaf, 8.1%–11.3%; Sunlit-Shaded, 1.0%–2.1%), confirming that the limitations of traditional models are fundamental rather than density-specific. The superior performance of the 3D model stems from its voxel-level light interception simulation, explicitly accounting for within-canopy shading patterns, edge effects, and photosynthetic acclimation gradients from top to bottom of the canpoy.
These results validate the finding that 3D modeling is essential for accurate predictions of canopy photosynthesis in structurally complex systems, where traditional approaches systematically overestimate productivity by failing to capture critical light–photosynthesis relationships.
Linear correlation between leaf area and canopy photosynthesis for tea saplings
-
Additionally, the simulation results highlighted the impact of inter-plant spacing on photosynthetic performance. At the 20-cm spacing, canopy photosynthetic rates were significantly lower compared with the 10-cm spacing, despite higher light availability per plant. This reduction is attributed to decreased leaf area density per unit of ground area, underscoring the trade-off between individual plants' light access and the canopy's collective light interception. According to the canopy meshing model using PLMA-5 at a 20-cm inter-plant spacing (Fig. 6f), a significant positive correlation was observed between the canopy's total daily photosynthetic rate and total leaf area across the four tea plant cultivars. The regression analysis revealed a strong linear relationship (Pearson's correlation = 0.99), indicating that increases in canopy leaf area directly enhance the overall photosynthetic activity.
These findings emphasize the critical role of the canopy's structural parameters—specifically leaf area and planting density—in regulating photosynthetic efficiency. The identified linear correlation provides a quantitative framework for optimizing planting configurations in precision agriculture, balancing leaf area expansion with light distribution to maximize crop productivity.
-
The canopy, defined as the total aboveground portion of a plant (including the leaves, stems, and reproductive structures), plays a central role in photosynthetic carbon assimilation[41]. Canopy photosynthesis models are powerful tools for quantifying canopy CO2 uptake rates (Ac), dissecting the impacts of architectural and biochemical traits on Ac and evaluating the effects of planting strategies and environmental conditions on biomass production and yield[38].
Traditional 3D canopy modeling approaches, which are primarily based on 2D image processing, are constrained by low throughput and limited capacity to resolve complex 3D structures, particularly in dense canopies like tea plant saplings, where self-shading obscures top-view imaging. Recent advances in plant phenomics have addressed these challenges through 3D point cloud technologies, including MVS, light detection and ranging (LiDAR), depth cameras, and structured light systems[42,43]. Among these technologies, Multi-View Stereo (MVS) offers distinct advantages for reconstructing the tea plant canopy due to its ability to capture high-resolution RGB imagery from multiple angles, enabling complete 3D reconstruction of both the upper and lower canopy layers[44]. This is critical because the middle and basal leaves contribute significantly to total canopy photosynthesis, despite receiving reduced irradiance[45−47].
In this study, the MVS-06 system was employed to generate dense 3D point clouds of tea plant saplings, ensuring comprehensive capture of the leaf and stem geometries (Fig. 1). The reconstructed point clouds were then processed using the ISBNet model (Fig. 2a) for organ segmentation and the PLMA (Fig. 2b) for leaf meshing, providing a foundation for subsequent ray tracing simulations. By quantifying the distribution of photosynthetically active radiation (PAR) within the canopy, this pipeline enabled an accurate estimation of radiation use efficiency (RUE), a key determinant of crop productivity. The 3D point cloud technologies, especially the MVS, provide a high-throughput method of building canopy photosynthesis models.
Advantages and challenges of using deep learning models for plant point cloud segmentation
-
After acquiring 3D point cloud data, accurate separation of individual leaves from stems is critical for modeling canopy photosynthesis, as photosynthetic properties vary significantly across canopy layers, and stems contribute negligible amounts of CO2 assimilation[48]. Traditional methods, such as skeleton extraction and region-growing algorithms, and parametric modeling using 3D templates[49], are heavily parameter-dependent and lack robustness for complex tea plant architectures.
This study employed the ISBNet model[32]—originally designed for large-scale urban point cloud segmentation—to achieve precise instance segmentation of tea plant organs. ISBNet demonstrates several key advantages over existing approaches: It performs both semantic and instance segmentation within a single framework[28], whereas previous methods combining multiple models for instance segmentation involve multi-step processing, which increases the complexity[31].
However, the dense foliage of tea plant presents unique challenges. Overlapping leaves often result in segmentation confusion, making it difficult to accurately distinguish between different leaves[50]. Since ISBNet divides point clouds into small voxel blocks for feature extraction, the voxel-scale parameter significantly impacts performance. Through experimentation, we determined the optimal voxel-scale to be 300–350, which effectively handles complex tea plant structures and overlapping leaves while producing accurate segmentation results (Table 1). This parameter requires a careful balance between capturing structural details and maintaining computational efficiency—a trade-off that is particularly critical across different crops and application scenarios.
Development of a new algorithm for plant leaf meshing: the PLMA
-
Meshing algorithms play a critical role in processing 3D point cloud data for plant canopy modeling. Traditional methods, such as Delaunay triangulation and ball pivoting, generate high-quality surface models but have prohibitive computational complexity for large-scale agricultural datasets combined with ray tracing simulations. The PLMA developed in this study aims to address these issues. Compared with traditional algorithms, the PLMA was designed specifically for plant leaves and can accurately capture the leaves' details and morphology, and particularly excels in handling complex or overlapping leaves (Figs 2b, c, and 5a, b). The PLMA significantly improves reduced unnecessary triangular meshes, showing excellent performance for canopy light simulations with the ray tracing algorithm (Fig. 5c, d, and Supplementary Table S1). It provided efficient support for photosynthetic analyses and facilitating subsequent phenotypic data extraction. Additionally, the algorithm offers high flexibility, allowing for adjustment of the model's precision according to different experimental needs, while maintaining strong robustness in cases of missing data.
Potential applications of the tea plant canopy model
-
While our FastTracer-based simulations provide valuable insights into cultivar-specific canopy light distribution patterns, direct field validation of the calculated photosynthesis rates would strengthen future applications. The developed tea plant canopy model can be applied to calculate diurnal radiation use efficiency, analyze the impacts of planting patterns on photosynthesis, and identify trait–performance relationships. Future work should include field validation studies to confirm the accuracy of photosynthesis predictions under different environmental conditions. This modeling pipeline holds potential for genetic analysis of key traits in tea breeding programs.
-
This study presents a novel framework for 3D canopy photosynthesis modeling in tea plant, integrating advanced technologies including the MVS-06 3D point cloud acquisition system, the deep learning-based ISBNet model, the newly developed PLMA leaf meshing algorithm, and the FastTracer ray tracing algorithm. The proposed pipeline establishes a complete workflow from image acquisition and 3D reconstruction to leaf segmentation, triangular meshing, canopy architecture modeling, light distribution simulation, and photosynthetic rate quantification. To the best of our knowledge, this represents the first comprehensive 3D canopy photosynthesis model specifically tailored to tea plant, offering a holistic approach to studying light interception and carbon assimilation in this economically important crop.
The authors gratefully acknowledge the support provided by Shanghai Polytechnic University (Shanghai, China), the Hunan Tea Research Institute (Changsha, China), MilletHill Biotech (Shanghai, China), the Center for Excellence in Molecular Plant Sciences, the Chinese Academy of Sciences (Shanghai, China), and Yuelushan Laboratory (Changsha, China). This work was supported by the Key Research and Development Plan of Hunan Province (Grant No. 2025JK2023). We also extend our thanks to the researchers and technical staff at these institutions for their valuable contributions to this work.
-
The authors confirm their contributions to the paper as follows: study conception and design: Huang H, Lu H, Song Q, Huang F, Li S; data collection: Lu H, Wang Y, Huang F, Li W, Lei Y; analysis and interpretation of results: Huang H, Song Q, Hang F, Li S; draft manuscript preparation: Huang H, Lu H, Wang Y, Song Q. All authors reviewed the results and approved the final version of the manuscript.
-
The data supporting the findings of this study are available from the corresponding author upon reasonable request.
-
The authors declare that they have no conflict of interest.
-
# Authors contributed equally: He Lu, Han Huang
- Supplementary Table S1 Computational efficiency comparison of PLMA algorithm with traditional meshing methods.
- Supplementary Table S2 Plant phenotypic information obtained from the meshing results of individual plants using the PLMA algorithm.
- Supplementary Fig. S1 3D point cloud reconstruction results of tea plants showing reconstruction fidelity and detail preservation.
- Supplementary Fig. S2 The schematic representations of the canopy photosynthesis model, including both point cloud and mesh configurations, are presented in top and front views. The left column depicts the 3D visualization of the point cloud model, while the right column presents the meshed model visualization, respectively.
- Supplementary Fig. S3 Photosynthetic light-response curve showing the relationship between leaf photosynthetic rate and PPFD, with model fit (red curve) and measured data (blue dots), demonstrating light saturation characteristics. The curve demonstrates the progressive increase in photosynthetic rate with rising PPFD, asymptotically approaching a plateau, which reflects the light saturation phenomenon in plant photosynthesis.
- Copyright: © 2026 by the author(s). Published by Maximum Academic Press, Fayetteville, GA. This article is an open access article distributed under Creative Commons Attribution License (CC BY 4.0), visit https://creativecommons.org/licenses/by/4.0/.
-
About this article
Cite this article
Lu H, Huang H, Wang Y, Song Q, Li W, et al. 2026. A novel three-dimensional canopy photosynthesis model for tea plant: integrating point cloud deep learning and ray tracing to optimize photosynthetic efficiency. Beverage Plant Research 6: e001 doi: 10.48130/bpr-0025-0031 

A novel three-dimensional canopy photosynthesis model for tea plant: integrating point cloud deep learning and ray tracing to optimize photosynthetic efficiency
- Received: 16 May 2025
- Revised: 27 July 2025
- Accepted: 25 August 2025
- Published online: 15 January 2026
Abstract: The tea plant (Camellia sinensis) is economically and nutritionally important because of its bioactive compounds. Photosynthesis directly affects tea's growth and productivity, requiring a detailed study of its relationship with cultivation outcomes. We developed a novel computational pipeline for constructing three-dimensional (3D) canopy photosynthesis models of tea plant, leveraging multi-view stereo 3D reconstruction. The ISBNet architecture was optimized for precise leaf–stem segmentation from point cloud data, achieving 0.897 average precision (AP) for leaves and 0.793 AP for stems. We then created a plant leaf morphology-adapted meshing algorithm optimized for plant leaf morphology, achieving an average mesh reduction of approximately 96% while maintaining morphological fidelity compared with conventional meshing methods. We generated multiple tea plant canopies representing distinct planting patterns, and used a ray tracing algorithm to simulate the spatiotemporal distribution of light within these structures. Canopy photosynthesis simulation revealed significant cultivar-specific differences, with 'Yuehuang 1' exhibiting the highest photosynthetic activity. Dense planting (10 cm spacing) significantly enhanced canopy photosynthetic rates compared with wider spacing (20 cm), and a strong linear correlation (r = 0.99) was identified between total leaf area and daily canopy photosynthetic rate across cultivars. This work establishes a methodological foundation for precision agriculture optimization in perennial crops, providing quantitative guidance for maximizing tea plantations' productivity through optimal cultivar selection and spatial configuration.
-
Key words:
- 3D phenotyping /
- Tea plant /
- Point cloud processing /
- Deep learning /
- Segmentation /
- Canopy photosynthesis modeling