-
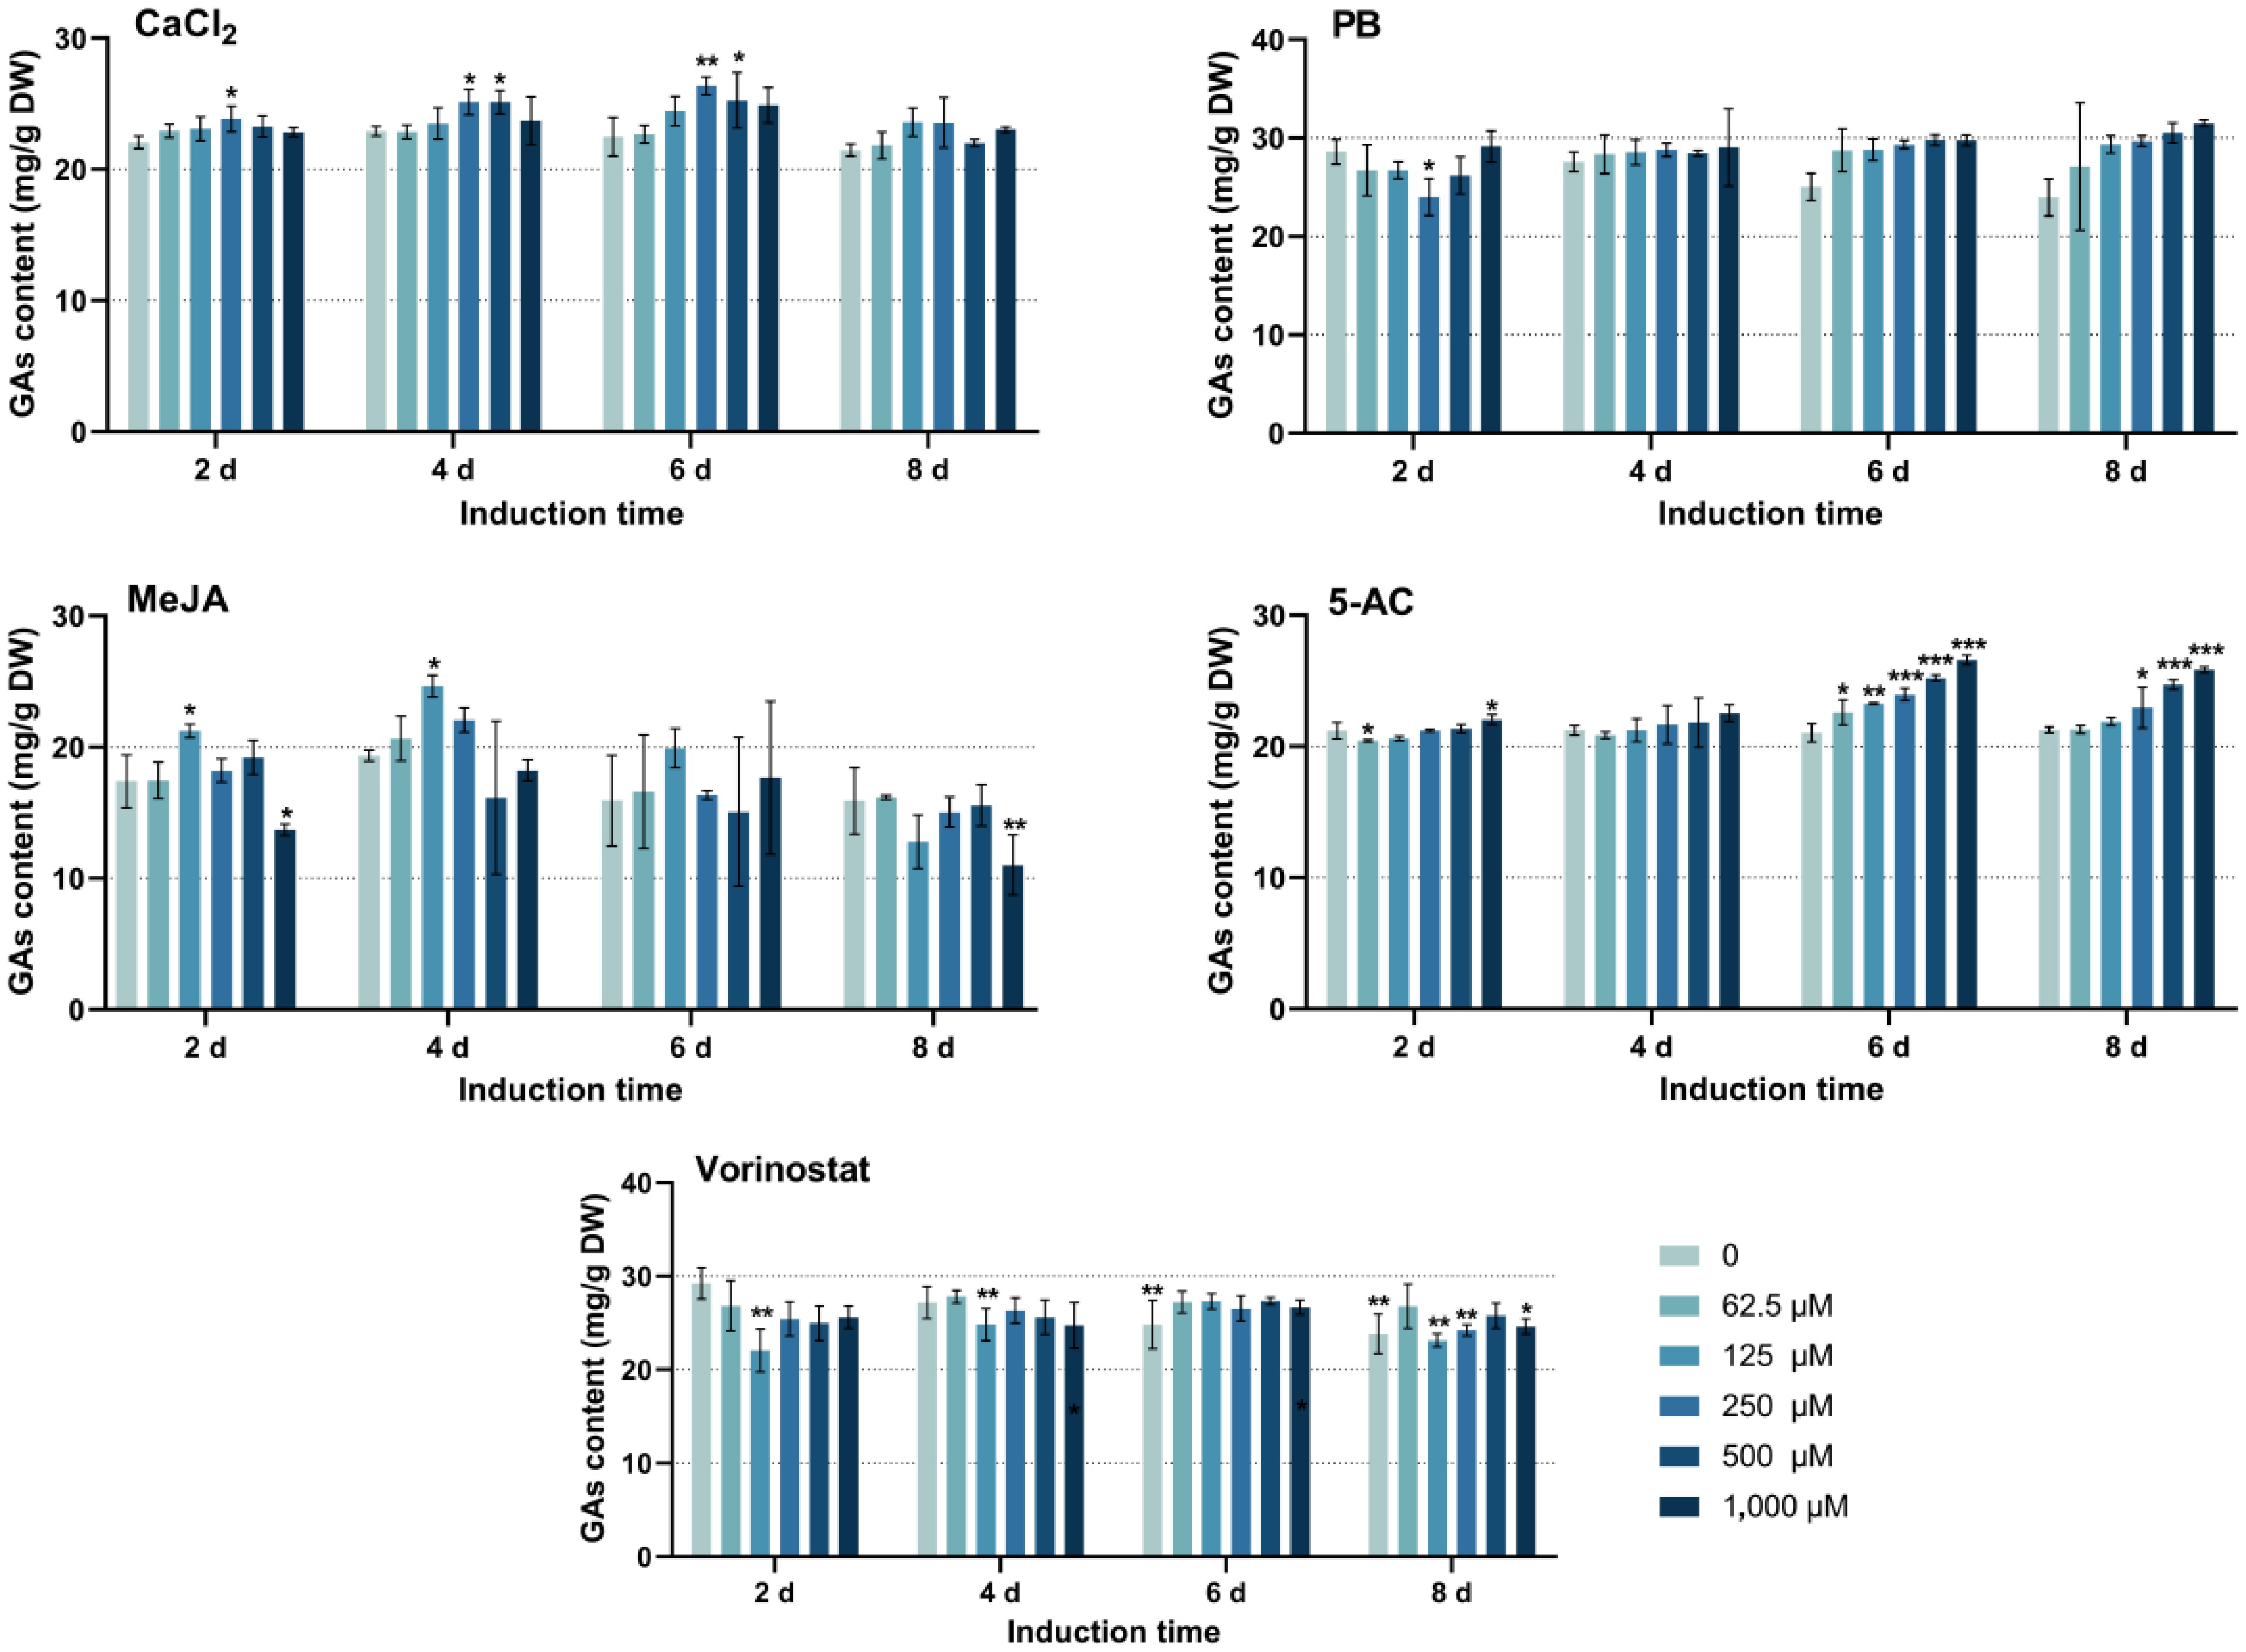
Figure 1.
The effect of single inducers on GA contents. PB, phenobarbital; MeJA, methyl jasmonate; 5-AC, 5-azacytidine. CaCl2 and 5-AC were dissolved in water, PB and vorinostat were dissolved in dimethyl sulfoxide, and MeJA was dissolved in ethanol. The difference between groups is considered to be significant at *p < 0.05, **p < 0.01, and ***p < 0.001.
-
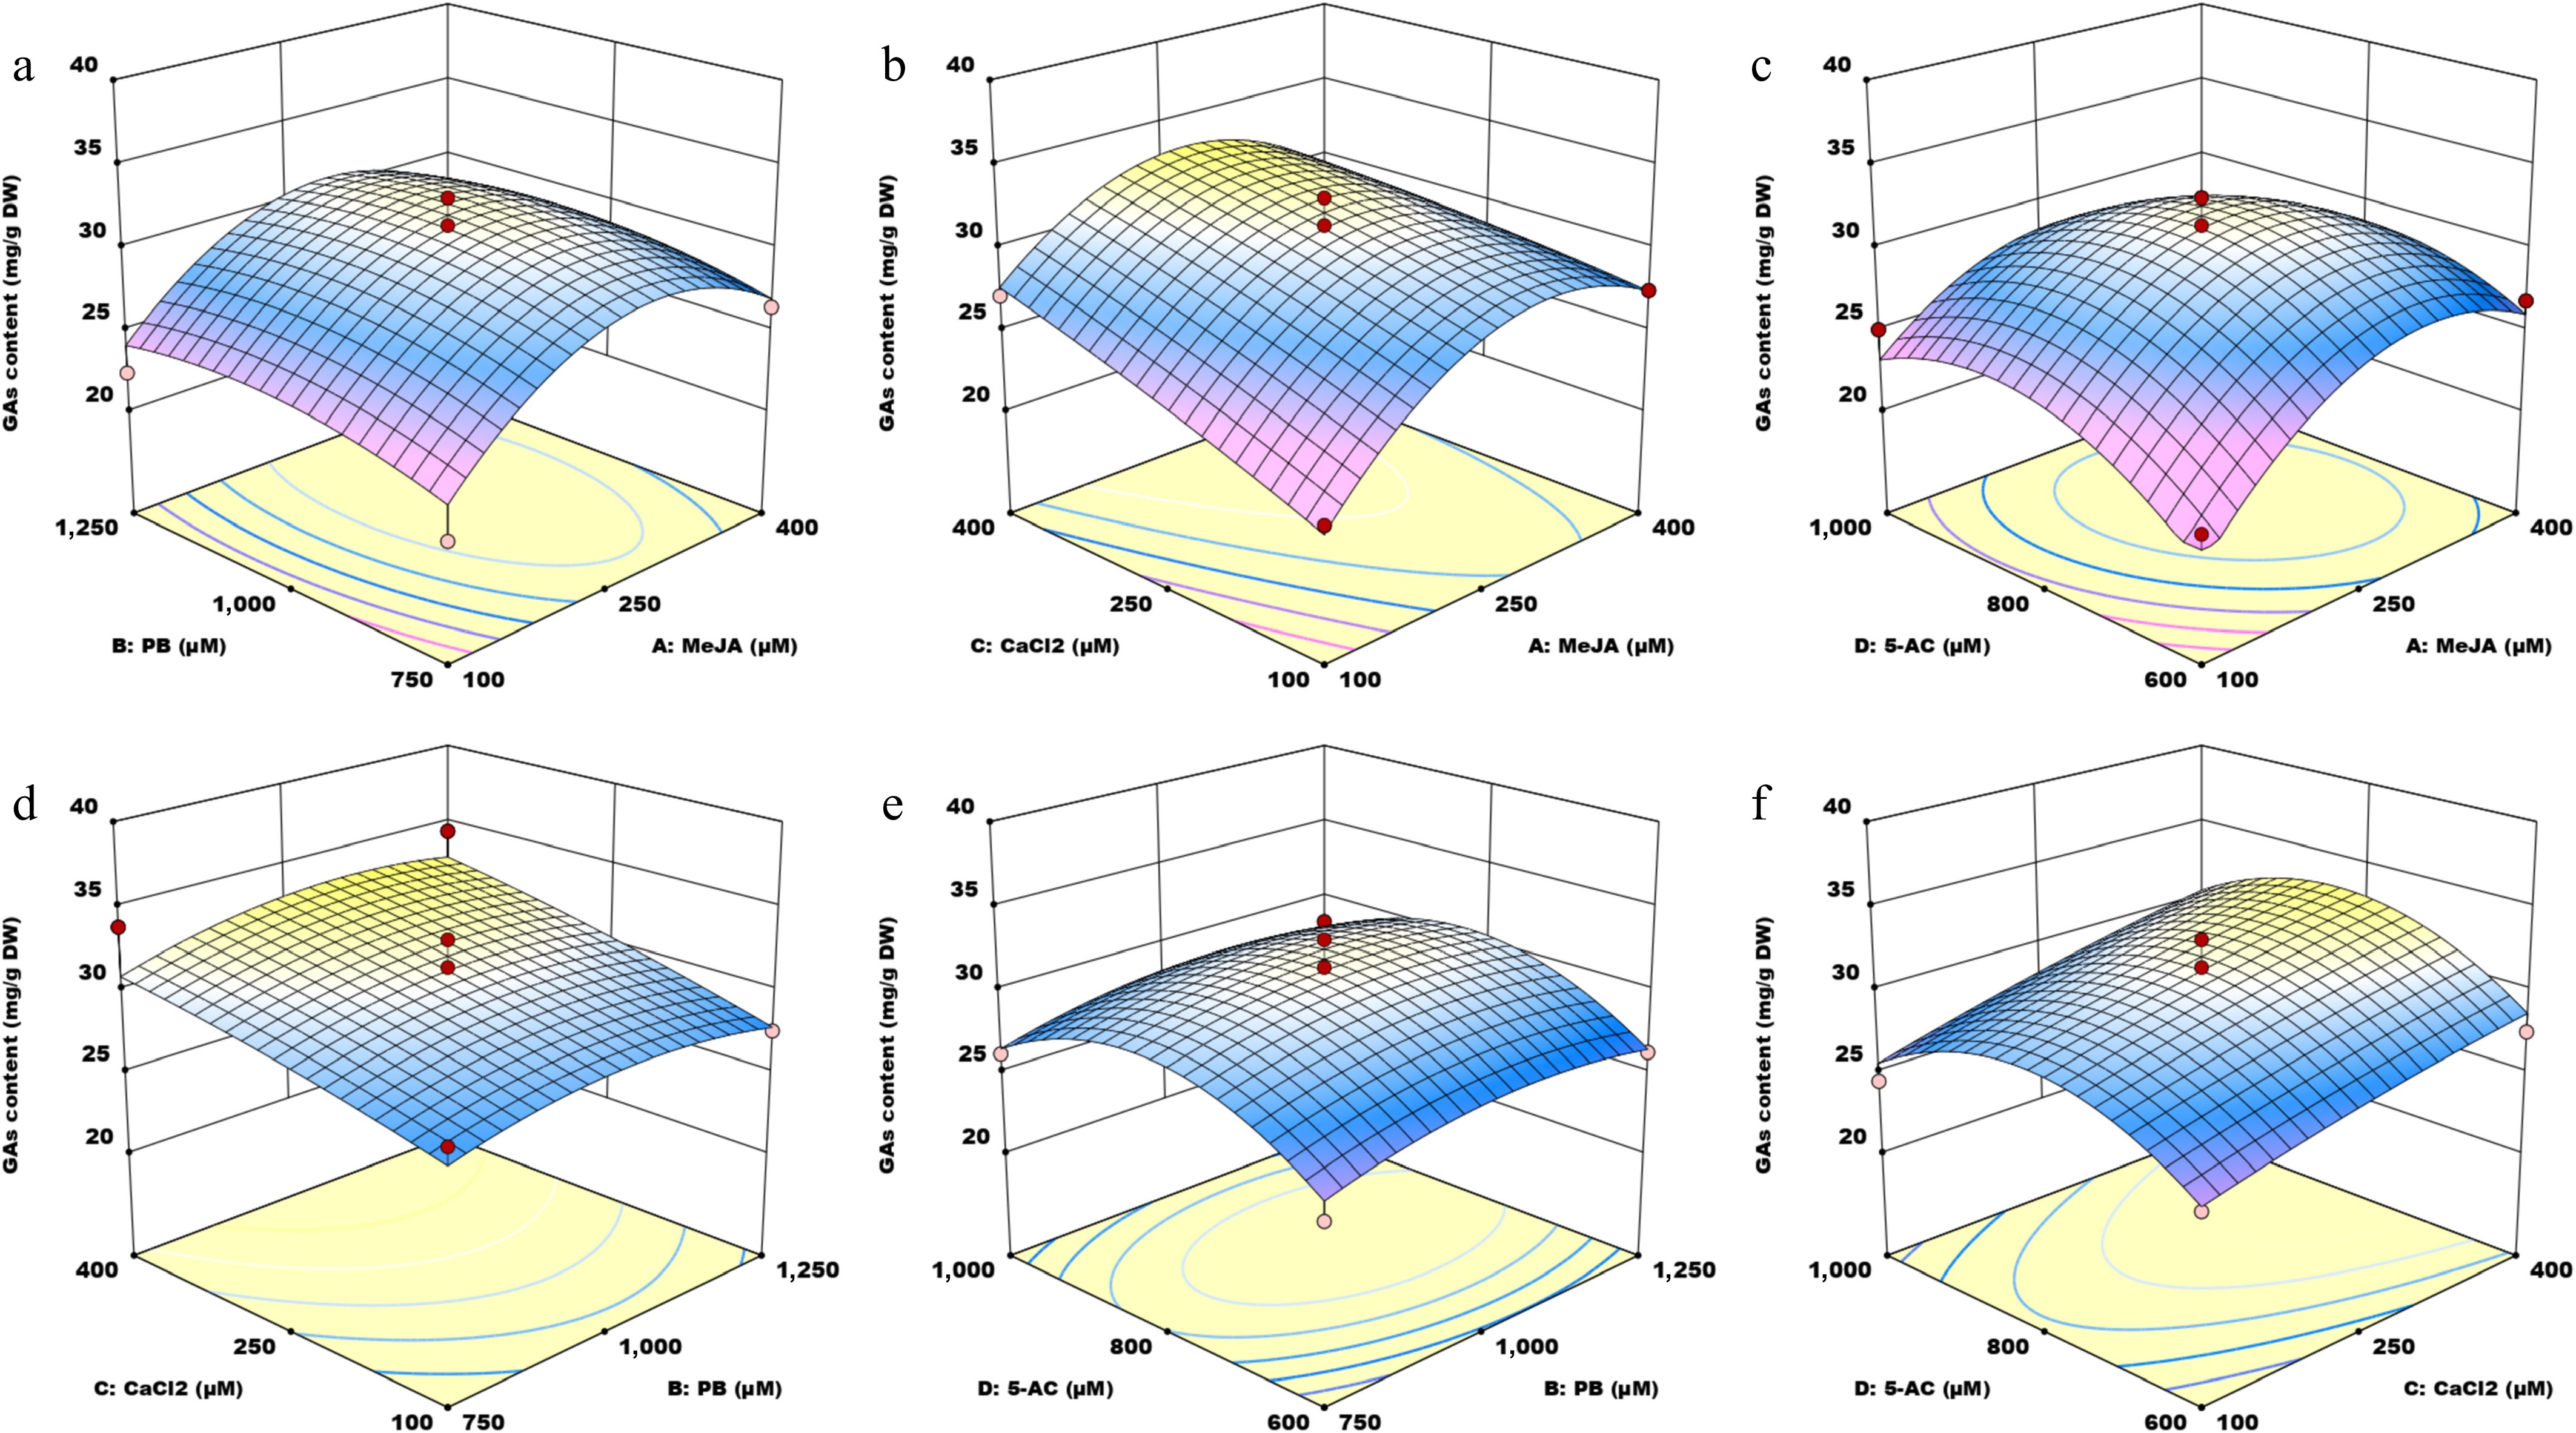
Figure 2.
Three-dimensional surface plots illustrating the interaction effects of four small molecules on GA content. MeJA, methyl jasmonate; PB, phenobarbital; 5-AC, 5-azacytidine. (a) Response surface graph showing the interaction between MeJA and PB. (b) Response surface graph showing the interaction between MeJA and CaCl2. (c) Response surface graph showing the interaction between MeJA and 5-AC. (d) Response surface graph showing the interaction between PB and CaCl2. (e) Response surface graph showing the interaction between PB and 5-AC. (f) Response surface graph showing the interaction between CaCl2 and 5-AC.
-
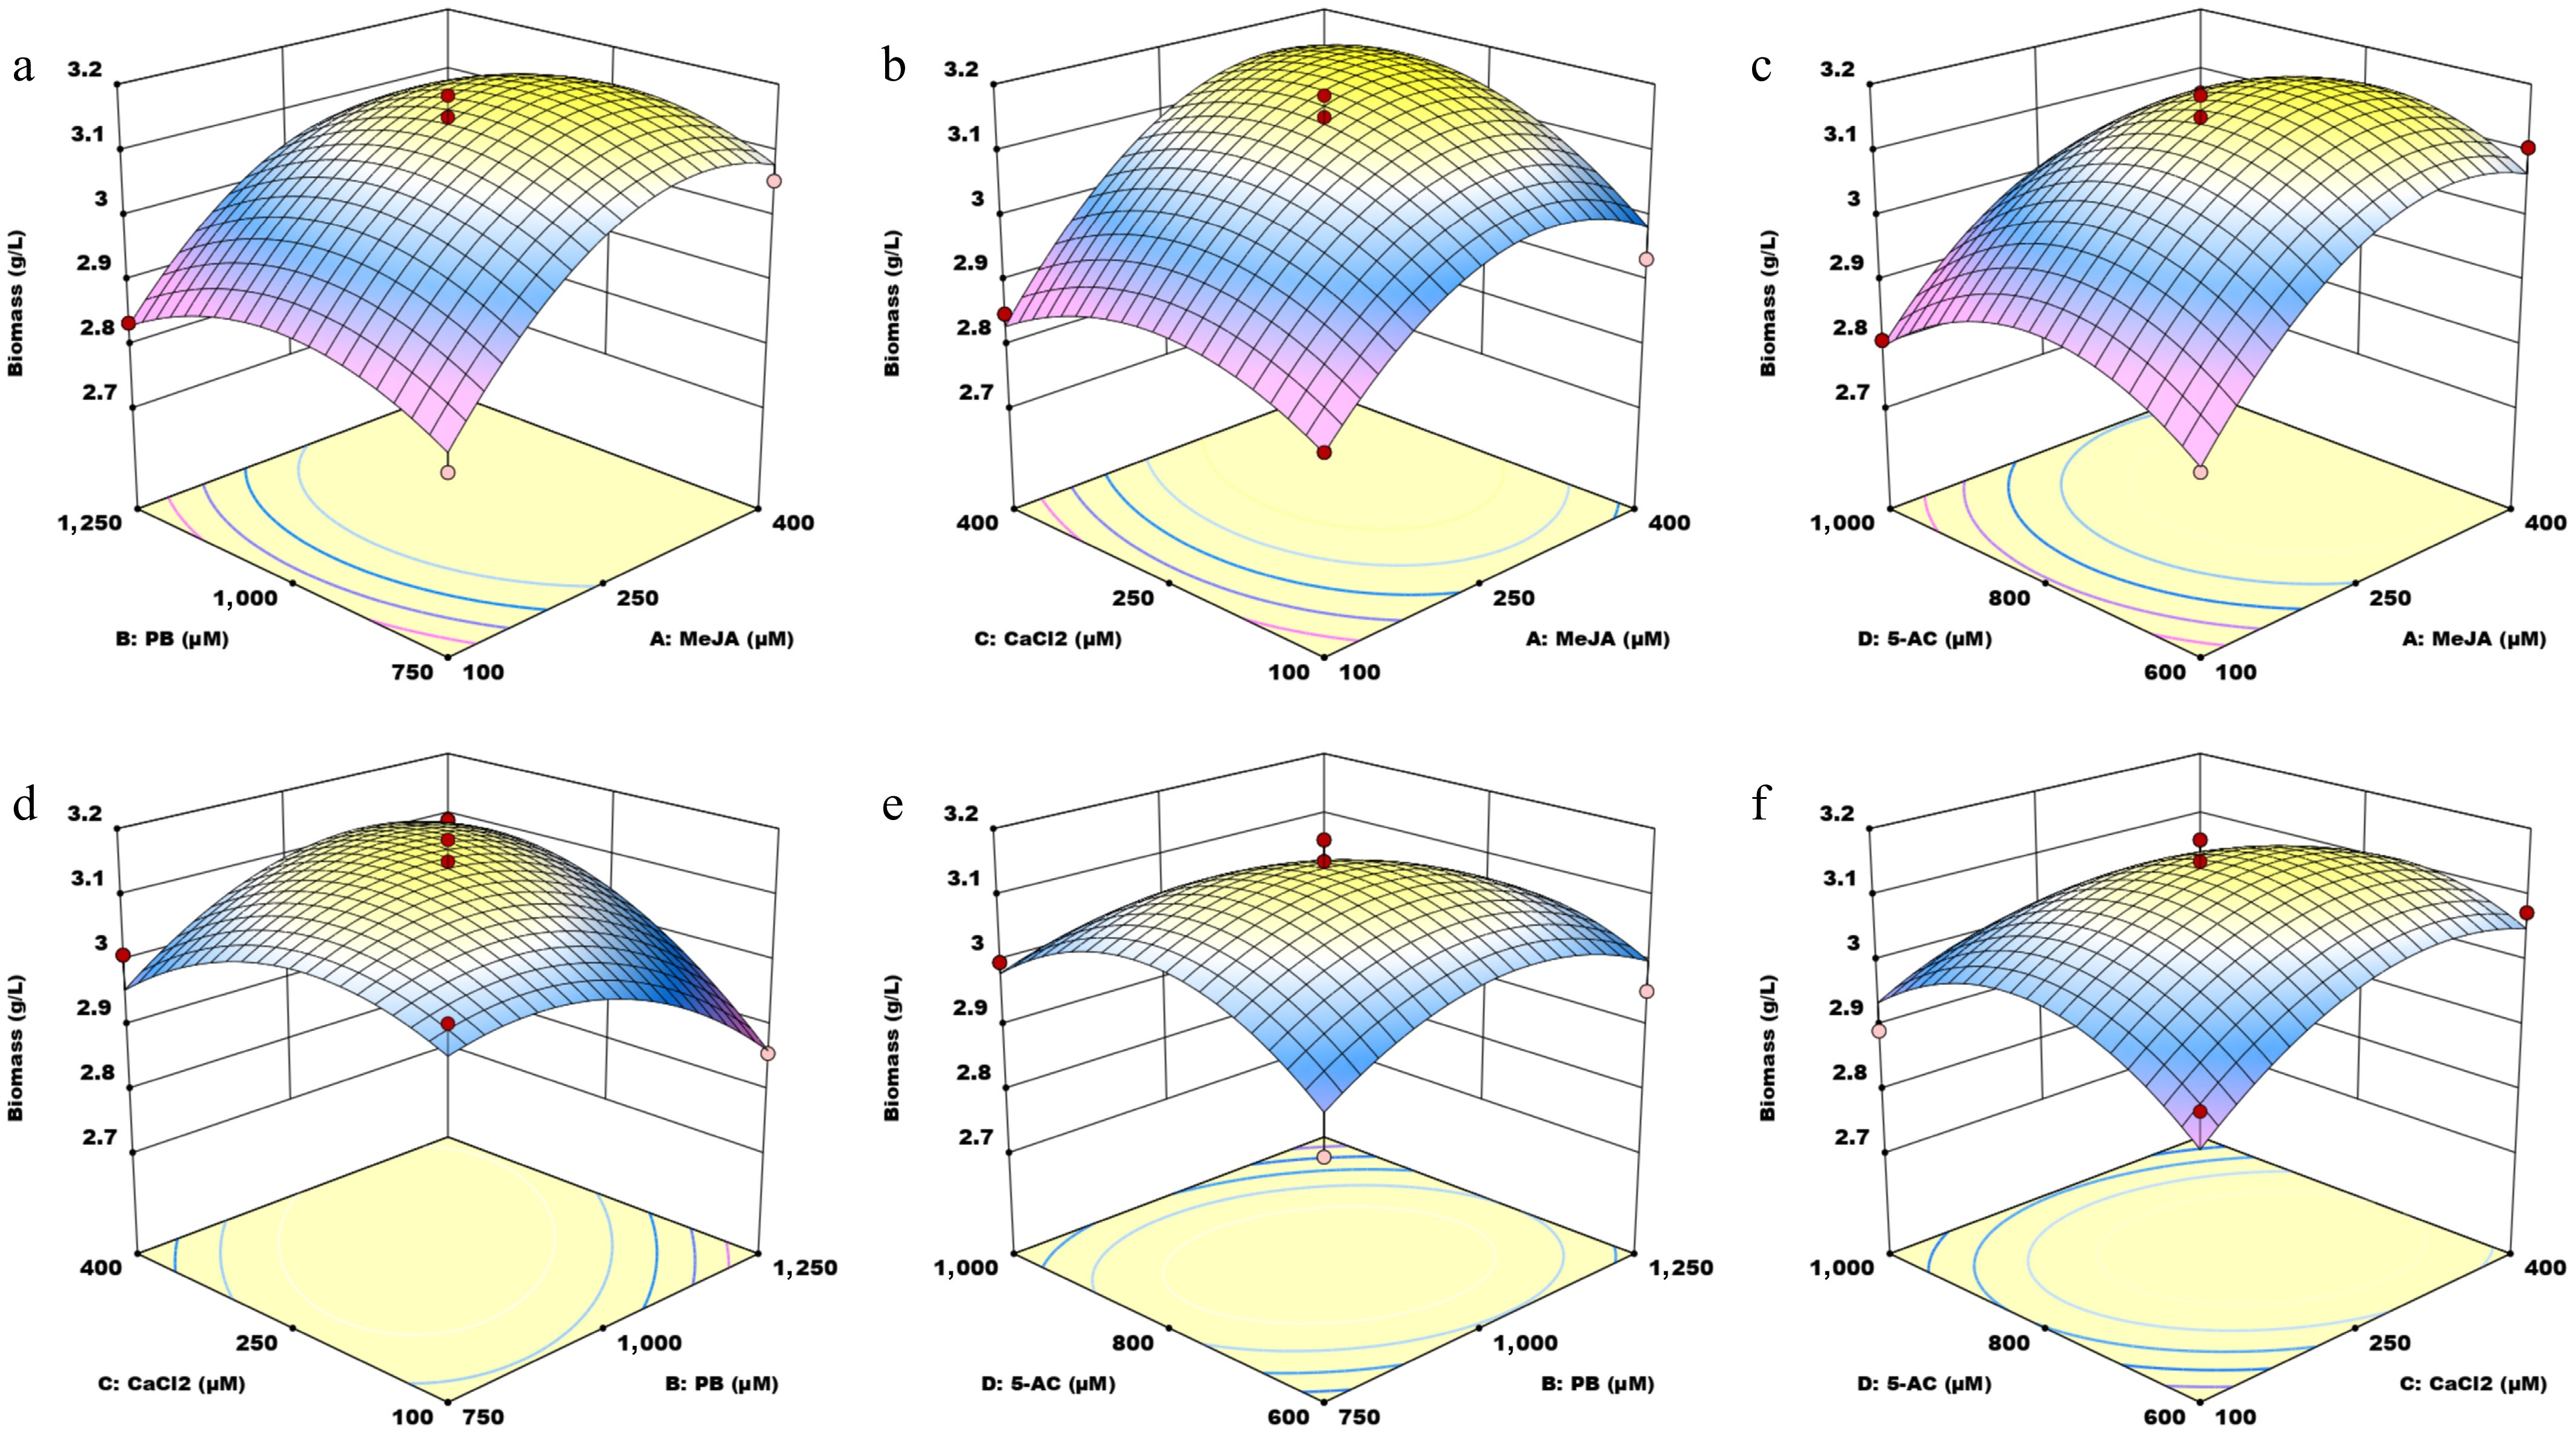
Figure 3.
Three-dimensional (3D) surface plots illustrating the interaction effects of four small molecules on biomass. MeJA, methyl jasmonate; PB, phenobarbital; 5-AC, 5-azacytidine. (a) Response surface graph showing the interaction between MeJA and PB. (b) Response surface graph showing the interaction between MeJA and CaCl2. (c) Response surface graph showing the interaction between MeJA and 5-AC. (d) Response surface graph showing the interaction between PB and CaCl2. (e) Response surface graph showing the interaction between PB and 5-AC. (f) Response surface graph showing the interaction between CaCl2 and 5-AC.
-
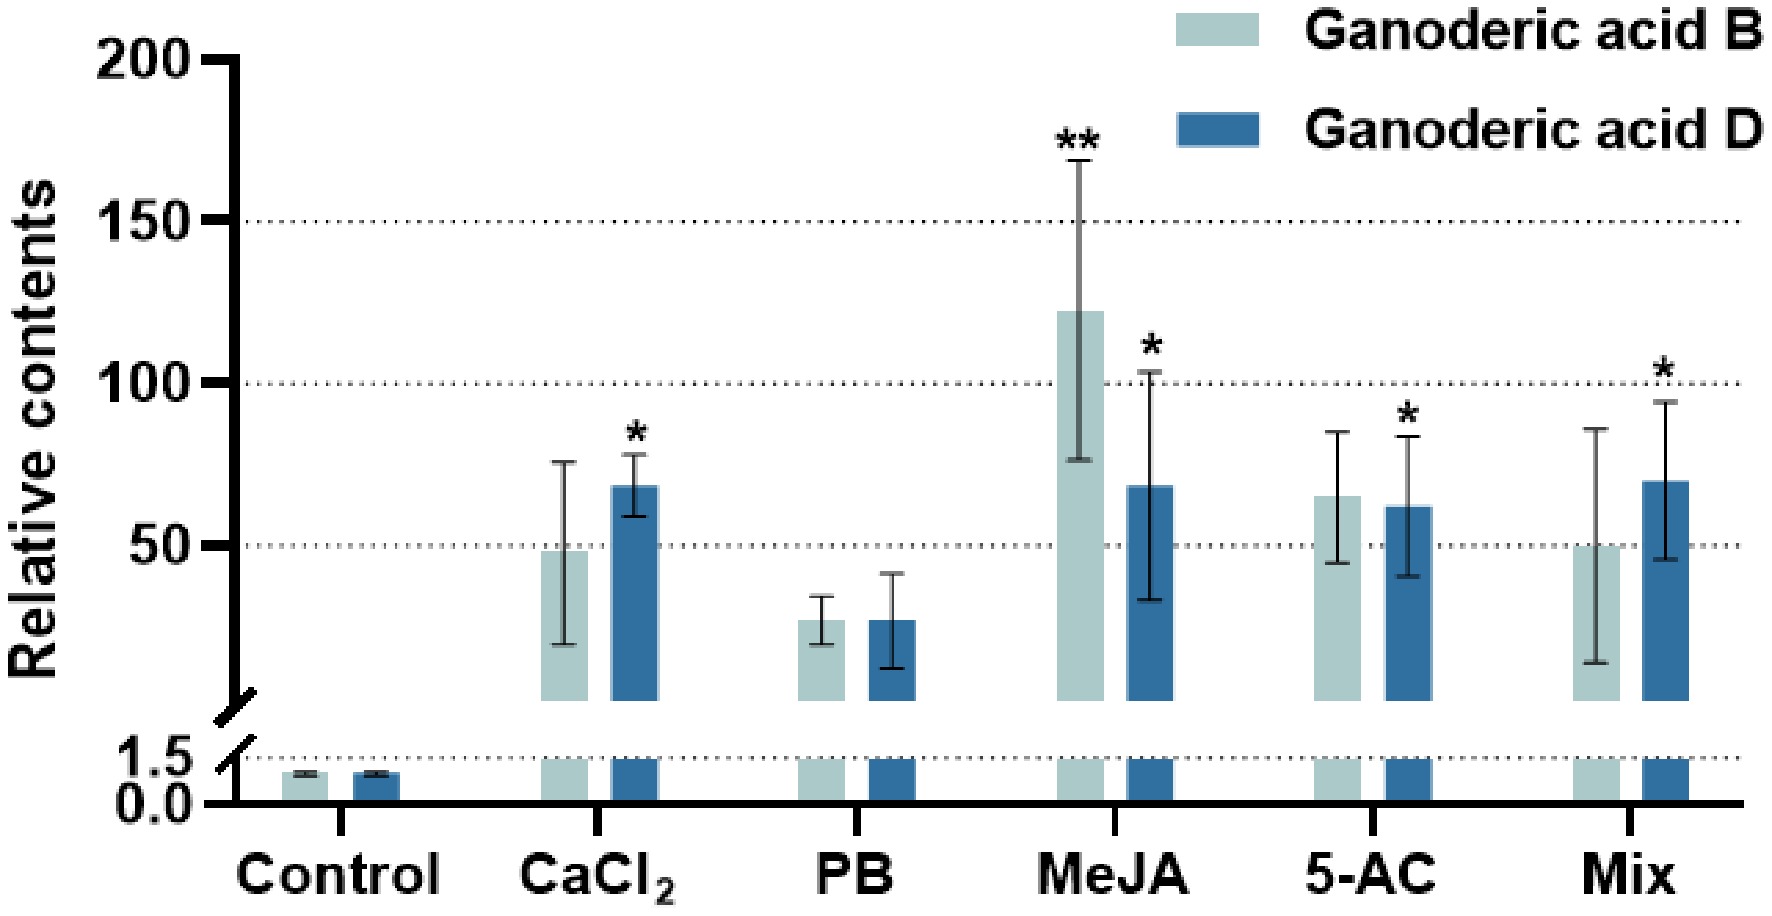
Figure 4.
GA monomer contents under the optimal treatment with different exogenous inducers. The relative content refers to the ratio of GA monomer content in each treatment group to the content of the solvent-induced group (dontrol). GA monomers refers to GA-B and GA-D. CaCl2, treatment with 250 μM CaCl2 for 6 days; PB, treatment with 1,000 μM phenobarbital for 8 days; MeJA, treatment with 125 μM methyl jasmonate for 4 days; 5-AC, treatment with 1,000 μM 5-azacytidine for 6 days; Mix, treatment with 400.00 μM CaCl2, 1,087.96 μM PB, 260.67 μM MeJA, and 823.04 μM 5-AC. CaCl2 and 5-AC were dissolved in water, PB was dissovled in dimethyl sulfoxide, and MeJA was dissolved in ethanol. Differences between groups are considered significant at * p < 0.05 and ** p < 0.01.
-
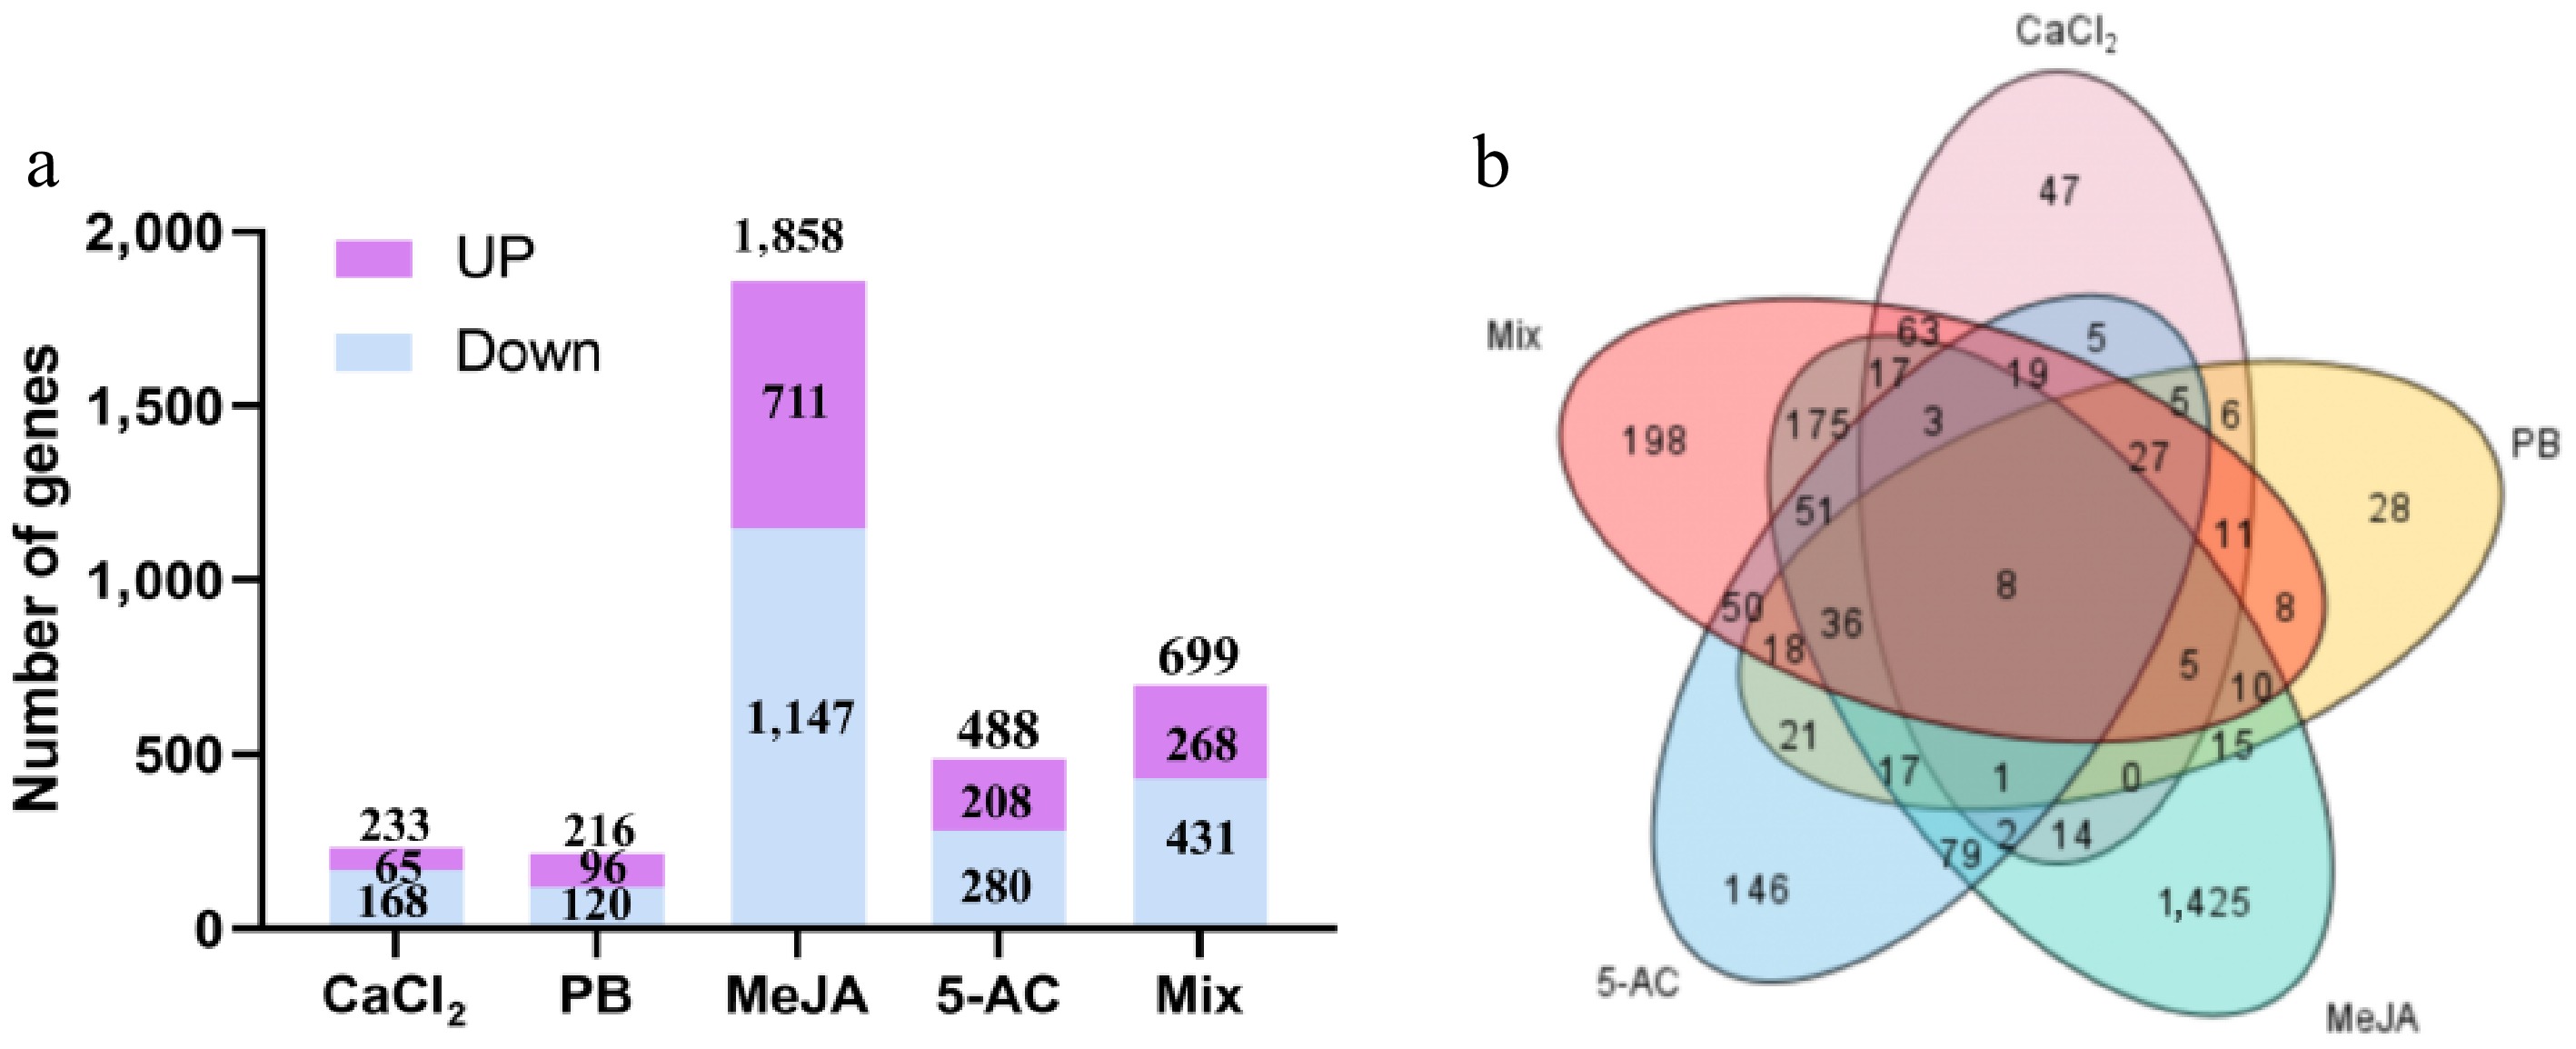
Figure 5.
DEGs from the transcriptome of different treatment groups. (a) The number of upregulated and downregulated genes from different treatment groups. (b) Distribution of DEGs in different treatment groups. MeJA, methyl jasmonate; PB, phenobarbital; 5-AC, 5-azacytidine. Mix, 400.00 μM CaCl2, 1,087.96 μM PB, 260.67 μM MeJA, and 823.04 μM 5-AC.
-
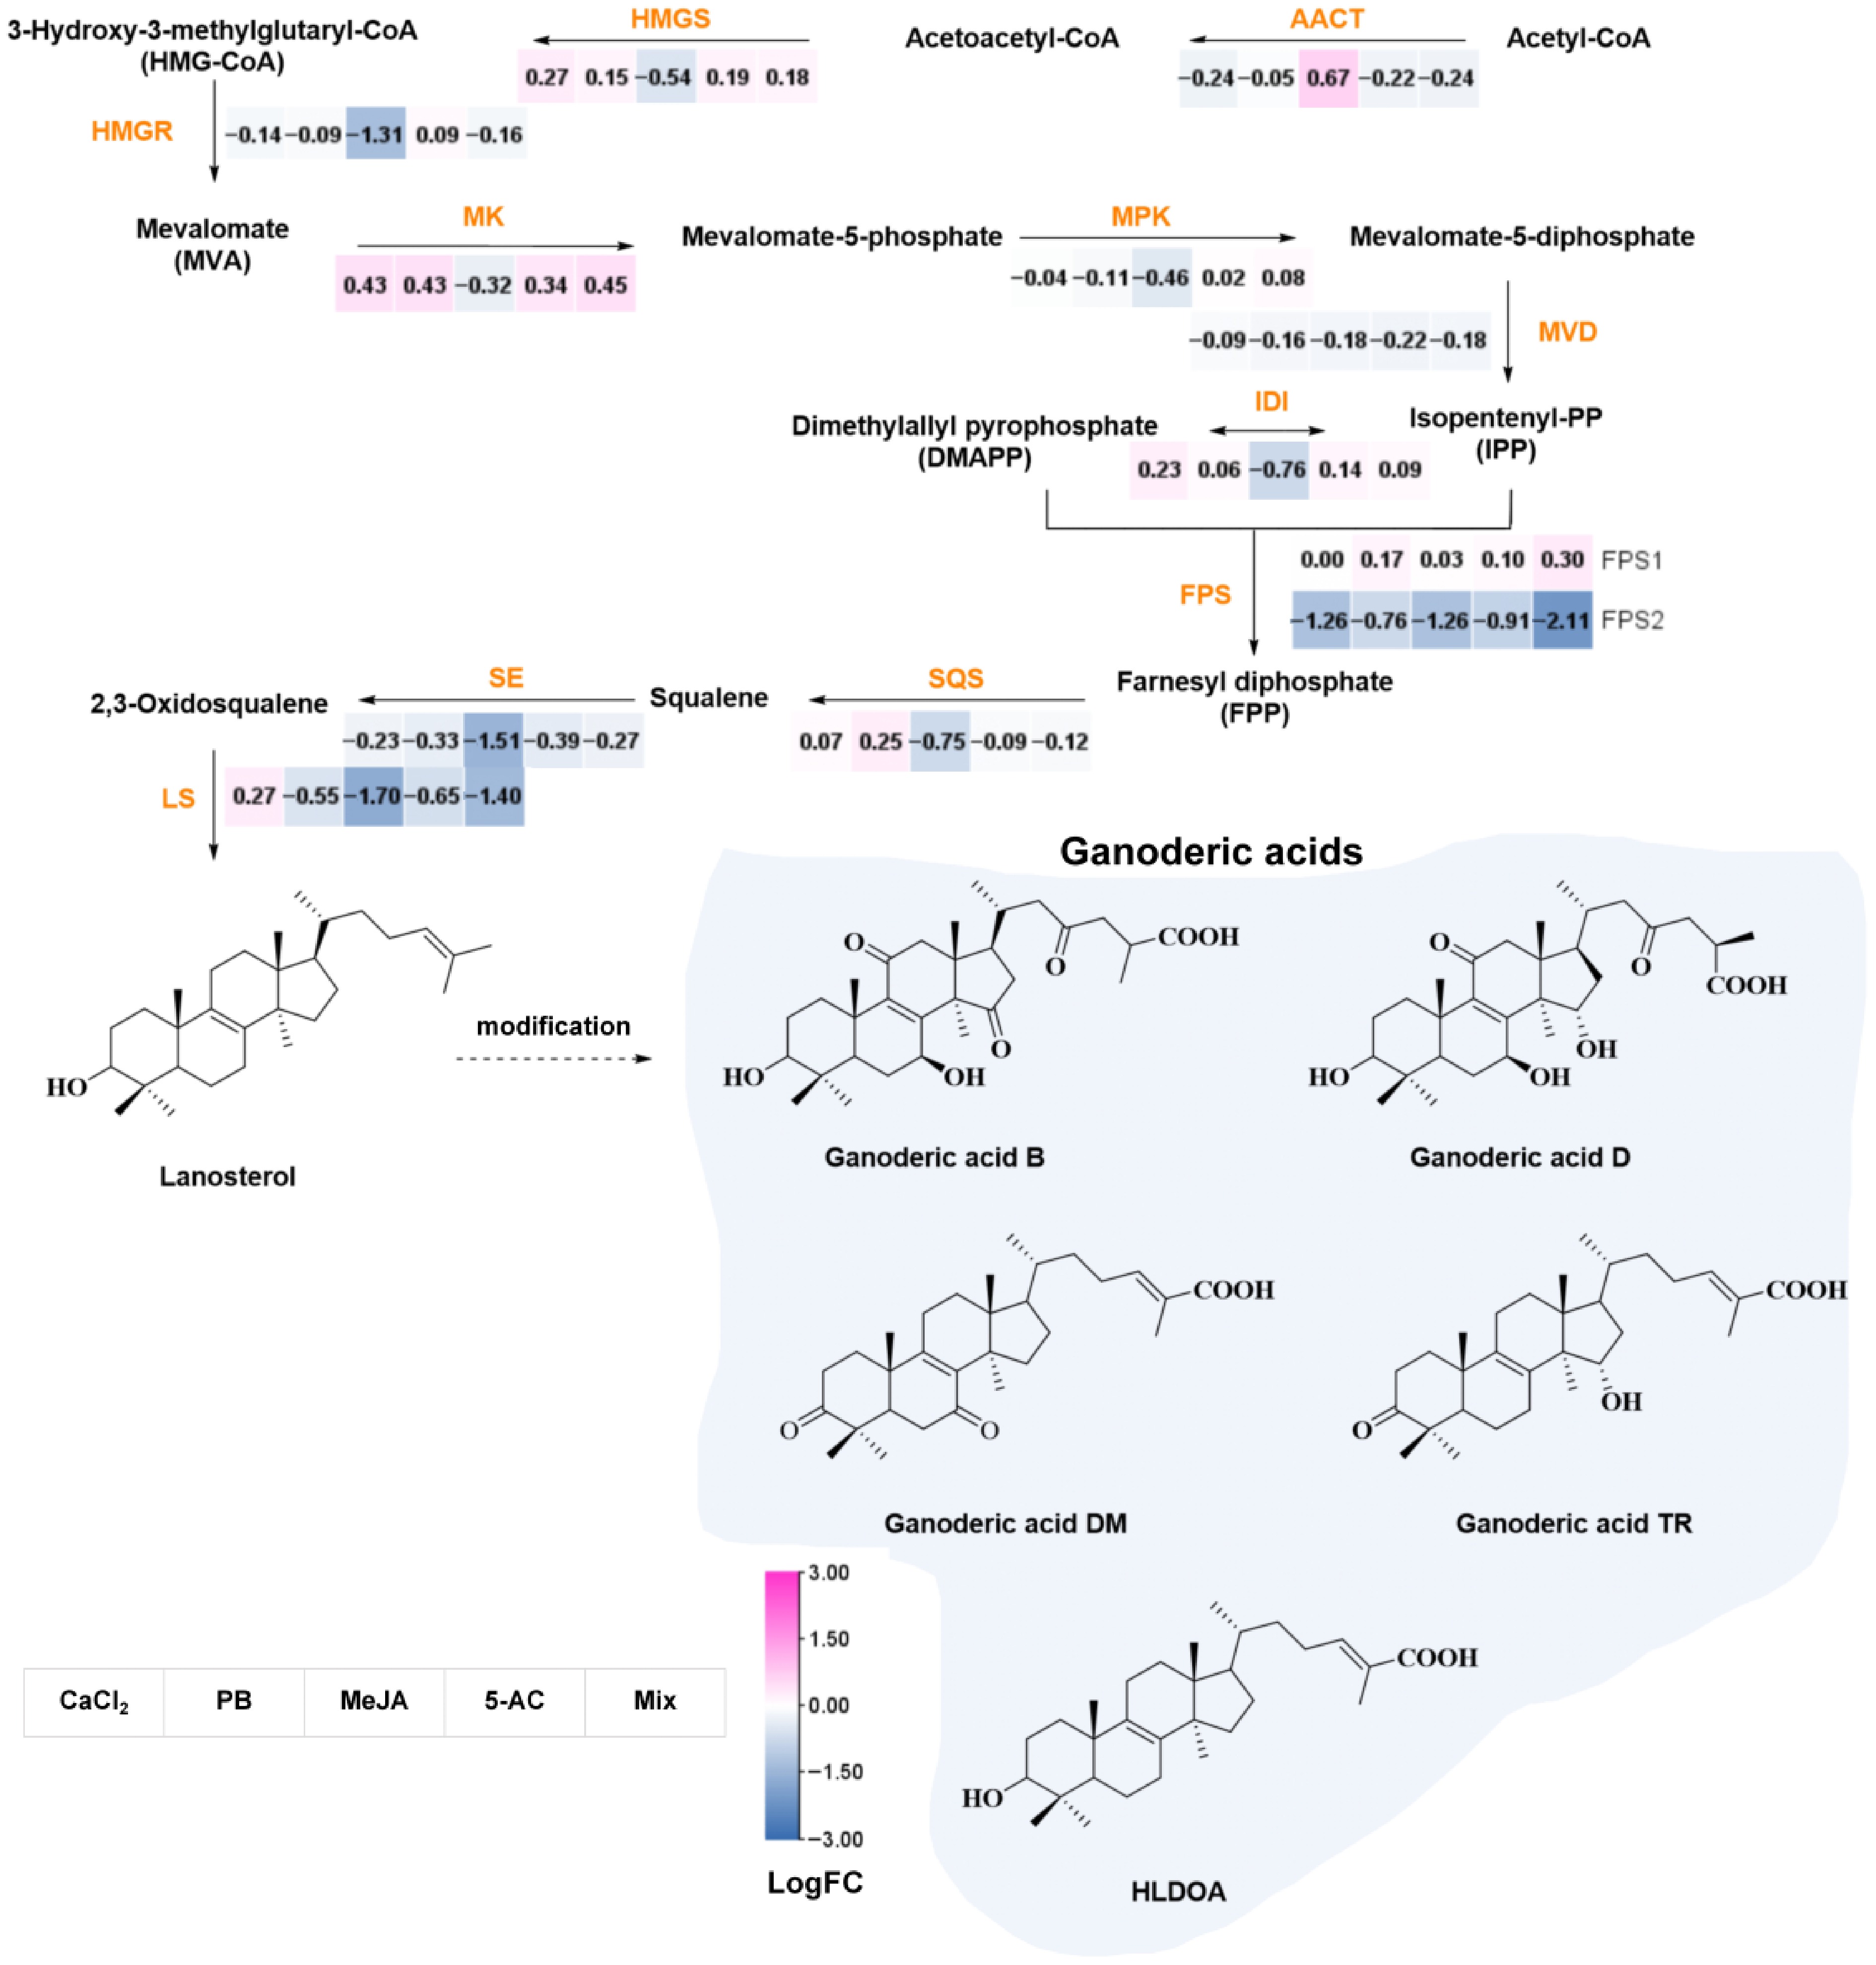
Figure 6.
The biosynthetic pathway of GAs and the expression profiles of reported biosynthetic genes. Key enzymes are colored in orange. Solid lines represent the confirmed synthetic pathway, and dashed lines represent the proposed synthetic pathway. The abbreviations are as follows: HLDOA, 3-hydroxy-lanosta-8,24-dien-26-oic acid; AACT, acetyl-CoA acetyltransferase; HMGS, HMG-CoA synthase; HMGR, HMG-CoA reductase; MK, MVA kinase; MPK, mevalonate-5-phosphate kinase; MVD, mevalonate-5-diphosphate decarboxylase; IDI, isopentenyldiphosphate isomerase; FPS, farnesyl phosphatesynthase; FPP, farnesyl pyrophosphate; GPP, geranyl diphosphate; SQS, squalene synthase; SE, squalene monooxygenase; LS, lanosterol synthase. MeJA, methyl jasmonate; PB, phenobarbital; 5-AC, 5-azacytidine; Mix, 400.00 μM CaCl2, 1,087.96 μM PB, 260.67 μM MeJA, and 823.04 μM 5-AC.
Figures
(6)
Tables
(0)