


-
Ganoderma lucidum (ling zhi) is a traditional macrofungus with significant medicinal and health benefits that is widely utilized in China. To date, over 160 different chemical compounds have been identified in G. lucidum, including polysaccharides, triterpenoids, peptides, alkaloids, nucleotides, sterols, and fatty acids[1−3]. Among these, ganoderic acids (GAs), a class of triterpenoids, are particularly notable for their diverse pharmacological effects including antibacterial, antioxidant, and analgesic effects; protection of the liver; elimination of inflammation; inhibition of tumor cell growth; and various androgenic activities[4−10]. Specific GAs exhibit unique bioactivities: GA-T and GA-Me significantly inhibit the growth and metastasis of lung cancer cells[11,12]. GA-A and GA-B have significant protease activity against human immunodeficiency virus (HIV)[13]. GA-C suppresses histamine release[14]. Additionally, GA-A, GA-F, and GA-DM possess anti-inflammatory properties[15]. Consequently, the content of GAs is widely regarded as a key indicator of the overall quality of G. lucidum.
The biosynthesis of GAs is regulated by various factors, and numerous studies have investigated the use of small-molecule additives to enhance the GA content. Xu et al. reported that supplementing the liquid medium with calcium ions could increase the total GA content, as well as the levels of individual GAs such as GA-Mk, GA-T, GA-S, and GA-Me by 3.7-, 2.6-, 4.5-, 3.2- and 3.8-fold, respectively[16]. Similarly, the addition of phenobarbital (PB), a typical Cytochrome P450 (CYP) inducer, to cultures of G. lucidum proved to be an effective strategy for boosting GA content, achieving 41.4 ± 0.6 mg/g dry weight (DW) and resulting in 28%–64% increases in GA-Mk, GA-T, GA-S, and GA-Me[17,18]. Exogenous addition of methyl jasmonate (MeJA) promotes the biosynthesis of GAs[19,20]. Lan used the DNA methylation inhibitor 5-azacytidine (5-AC) to improve the GA content, which reached 13.11 mg/g in the mycelium[21]. However, current research on enhancing GA biosynthesis has predominantly focused on the effects of individual inducers. Studies investigating the synergistic effects of multiple inducers remain limited, and the underlying molecular mechanisms, particularly a systematic analysis at the transcriptional level, are still lacking.
In the present paper, calcium chloride (CaCl2), PB, MeJA, and 5-AC were selected as exogenous inducers to enhance GA content. This study represents the first investigation into the synergistic effects of their combined use on GA biosynthesis. The optimal combination of these inducers was determined using Box–Behnken design (BBD) based on the response surface methodology (RSM). Genes related to GA biosynthesis were subsequently analyzed at the transcriptional level. We provide a practical strategy to improve the GA content and a solid theoretical foundation for regulatory mechanisms.
-
Haploid Ganoderma lucidum was obtained from Zhejiang Shouxiangu Pharmaceutical Co., Ltd., and kept in the laboratory.
Medium and fermentation conditions
-
Stock and liquid cultures were both maintained on potato dextrose agar (PDA) following a method reported elsewhere[22]. Spoor cultures were grown in 250-mL flasks containing 100 mL PDA and placed on a rotary shaker incubator at 100 rpm at 28 °C for 4 days. The fermentation experiments were performed in 250-mL flasks containing 100 mL of liquid nutrient medium (3.5% w/v glucose, 0.5% w/v tryptone, 0.25% w/v yeast extract, 0.05% w/v MgSO4·7H2O, 0.1% w/v KH2PO4, and 0.05% w/v Vitamin B1; initial pH of 5.5) at 100 rpm at 28 °C for 8 days after inoculation with 5% v/v of the spoor culture. CaCl2 (Yongda, Tianjin) and 5-AC (Aladdin, Shanghai) were dissolved in water, PB (deoxygenated phenobarbital, Primidone, Aladdin, Shanghai) and vorinostat (Aladdin, Shanghai) were dissolved in dimethyl sulfoxide, and MeJA (Aladdin, Shanghai) was dissolved in ethanol. Before addition to the medium, the dissolved reagents were sterilized by filtration through a 0.2-μm membrane.
Measurement of GAs
-
GA content was determined by reference to previous literature[22−24]. Briefly, compounds from dried and ground mycelia (50 mg) were soaked with 1 mL of 85% methanol (v/v) overnight and were subjected to three rounds of ultrasonic treatment for 90 min each (< 40 °C). After removing the mycelia by centrifugation, the supernatants were dried at 40 °C under a vacuum and then resuspended in 1 mL of 85% methanol for testing. After evaporation at 60 °C, 200 μL of the test sample solution was dried and further purified with 200 μL of vanillin–acetic acid (50 μg/mL) and 800 μL of perchloric acid. The mixture was shaken evenly and placed in a 70 °C water bath for 15 min, then an ice bath for 5 min. Finally, the GA was dissolved in 4 mL of ethyl acetate, and its absorbency was measured at 546 nm. After measuring the absorbency, the corresponding GA content was calculated via the standard curve of oleanolic acid.
Optimization of parameters using RSM and statistical analysis
-
A three-level–four-factor BBD was employed to optimize the parameters. Design Expert (Version 13.0, USA) software was used. The independent variables and their level of incorporation are given in Supplementary Table S1. The independent variables were coded as follows: CaCl2, A; MeJA concentration, B; PB, C; 5-AC concentration, D; here, A, B, C, and D are independent variables. The BBD design generated 29 factorial points (runs) as given in Supplementary Table S2. The response variable could be fitted into the general form of a quadratic polynomial model, where GA content and biomass are the response variables. The following quadratic equation based on the linear coefficients of independent variables was used to calculate the optimal point of the given model.
X = C0 + A * + B * + C * + D * + AB * + AC * + AD * + BC * + BD * + CD * + A2 * + B2 * + C2 *+ D2 *
The coefficients of polynomials were C0 as constant term; A, B, C, and D as linear effects; AB, AC, AD, BC, BD, and CD as quadratic effects; and A2, B2, C2, and D2 as interaction effects. The degree of fitness of the present design was measured by parameters like the coefficient of determination (R2), adjusted coefficient of determination (R2-adj), p-value, and lack of fit. Analysis of variance (ANOVA) was used to check the quadratic polynomial model. GA content and biomass were taken as actual values.
Transcriptional analysis
-
The mycelium samples were used for extracting total RNA, examing RNA quality, constructing the cDNA library, and sequencing on the Illumina NovaSeq 6000 platform by Hangzhou Kaitai Biotechnology Corporation (Hangzhou, China). The specific G. lucidum reference genome assembly used was from
https://doi.org/10.6084/m9.figshare.28279913.v2 . The raw data were filtered, and redundant sequences were removed using fastp software to yield 123.74 Gb of clean data. In the full-length transcriptome data, sequences with polymerase reads of < 50 bp and sequence quality < 20 were filtered out. Then the clean reads from Illumina sequencing were mapped into the nonredundant long-reads to calculate the fragments per kilobase per million (FPKM) values using stringtie. Specifically, FPKM = Total fragments/mapped fragments (millions) × Length (kb), where total fragments represents the number of fragments aligned to a transcript, mapped fragments (millions) is the total number of mapped fragments, and length (kb) denotes the transcript length. We took absolute log2 FPKM ≥ 1 and p < 0.05 as the thresholds to identify differentially expressed genes (DEGs) in edgeR. By utilizing Kyoto Encyclopedia of Genes and Genomes (KEGG) (www.genome.jp/kegg ), a pathway analysis was conducted to elucidate the essential pathways of the DEGs. The filtered full-length transcripts were functionally annotated using Gene Ontology (GO), KEGG, EuKaryotic Orthologous Groups (KOG), and Swiss-Prot.Statistical analysis
-
All the experiments were performed in three independent samples, and the data are presented as the mean ± standard deviation (SD). For multiple comparisons, a one-way ANOVA was performed using GraphPad Prism v8.0.1 (GraphPad Software, San Diego, CA, USA).
-
To investigate the effect of individual inducers on GA biosynthesis, the GA content was assayed in response to varying concentrations for different induction times as shown in Fig. 1. An increase in the CaCl2 concentration promoted accumulation of GAs in the mycelia, although concentrations above 250 μM inhibited this effect. Under 250 μM CaCl2, GA accumulation in the mycelium reached the maximum after 6 days of induction, achieving 26.35 ± 0.67 mg/g DW, but decreased after 8 days. Both the induction time and CaCl2 concentration affected the synthesis of GAs. The optimal induction condition was 6 days. In PB concentrations ranging from 125 to 1,000 μM, the content of GAs increased with the induction time. The optimal condition for PB treatment was induction at 1,000 μM for 8 days, reaching 31.53 ± 0.30 mg/g DW mycelium. For MeJA, the optimal induction time was 4 days, with increasing concentrations enhancing the synthesis of GAs up to 125 μM. In the MeJA treatment groups, 24.66 ± 0.82 mg/g DW was the highest GA content. Longer induction times and higher concentrations inhibited the accumulation of GAs. With regard to the inducer 5-AC, GA content increased with higher concentrations over 6–8 days of induction, with 1,000 μM 5-AC following 6 days of induction yielding the highest GA content, 26.61 ± 0.37 mg/g DW. Notably, vorinostat exerted varying degrees of inhibition on the accumulation of GAs. In the control group, where only the dimethyl sulfoxide solvent was used, GA content decreased as the induction time was extended. Among the five inducers tested, vorinostat was the least effective in promoting GA biosynthesis, whereas the other four inducers enhanced the accumulation of GAs. Accordingly, these four inducers can be recommended as additives to increase the content of GAs.
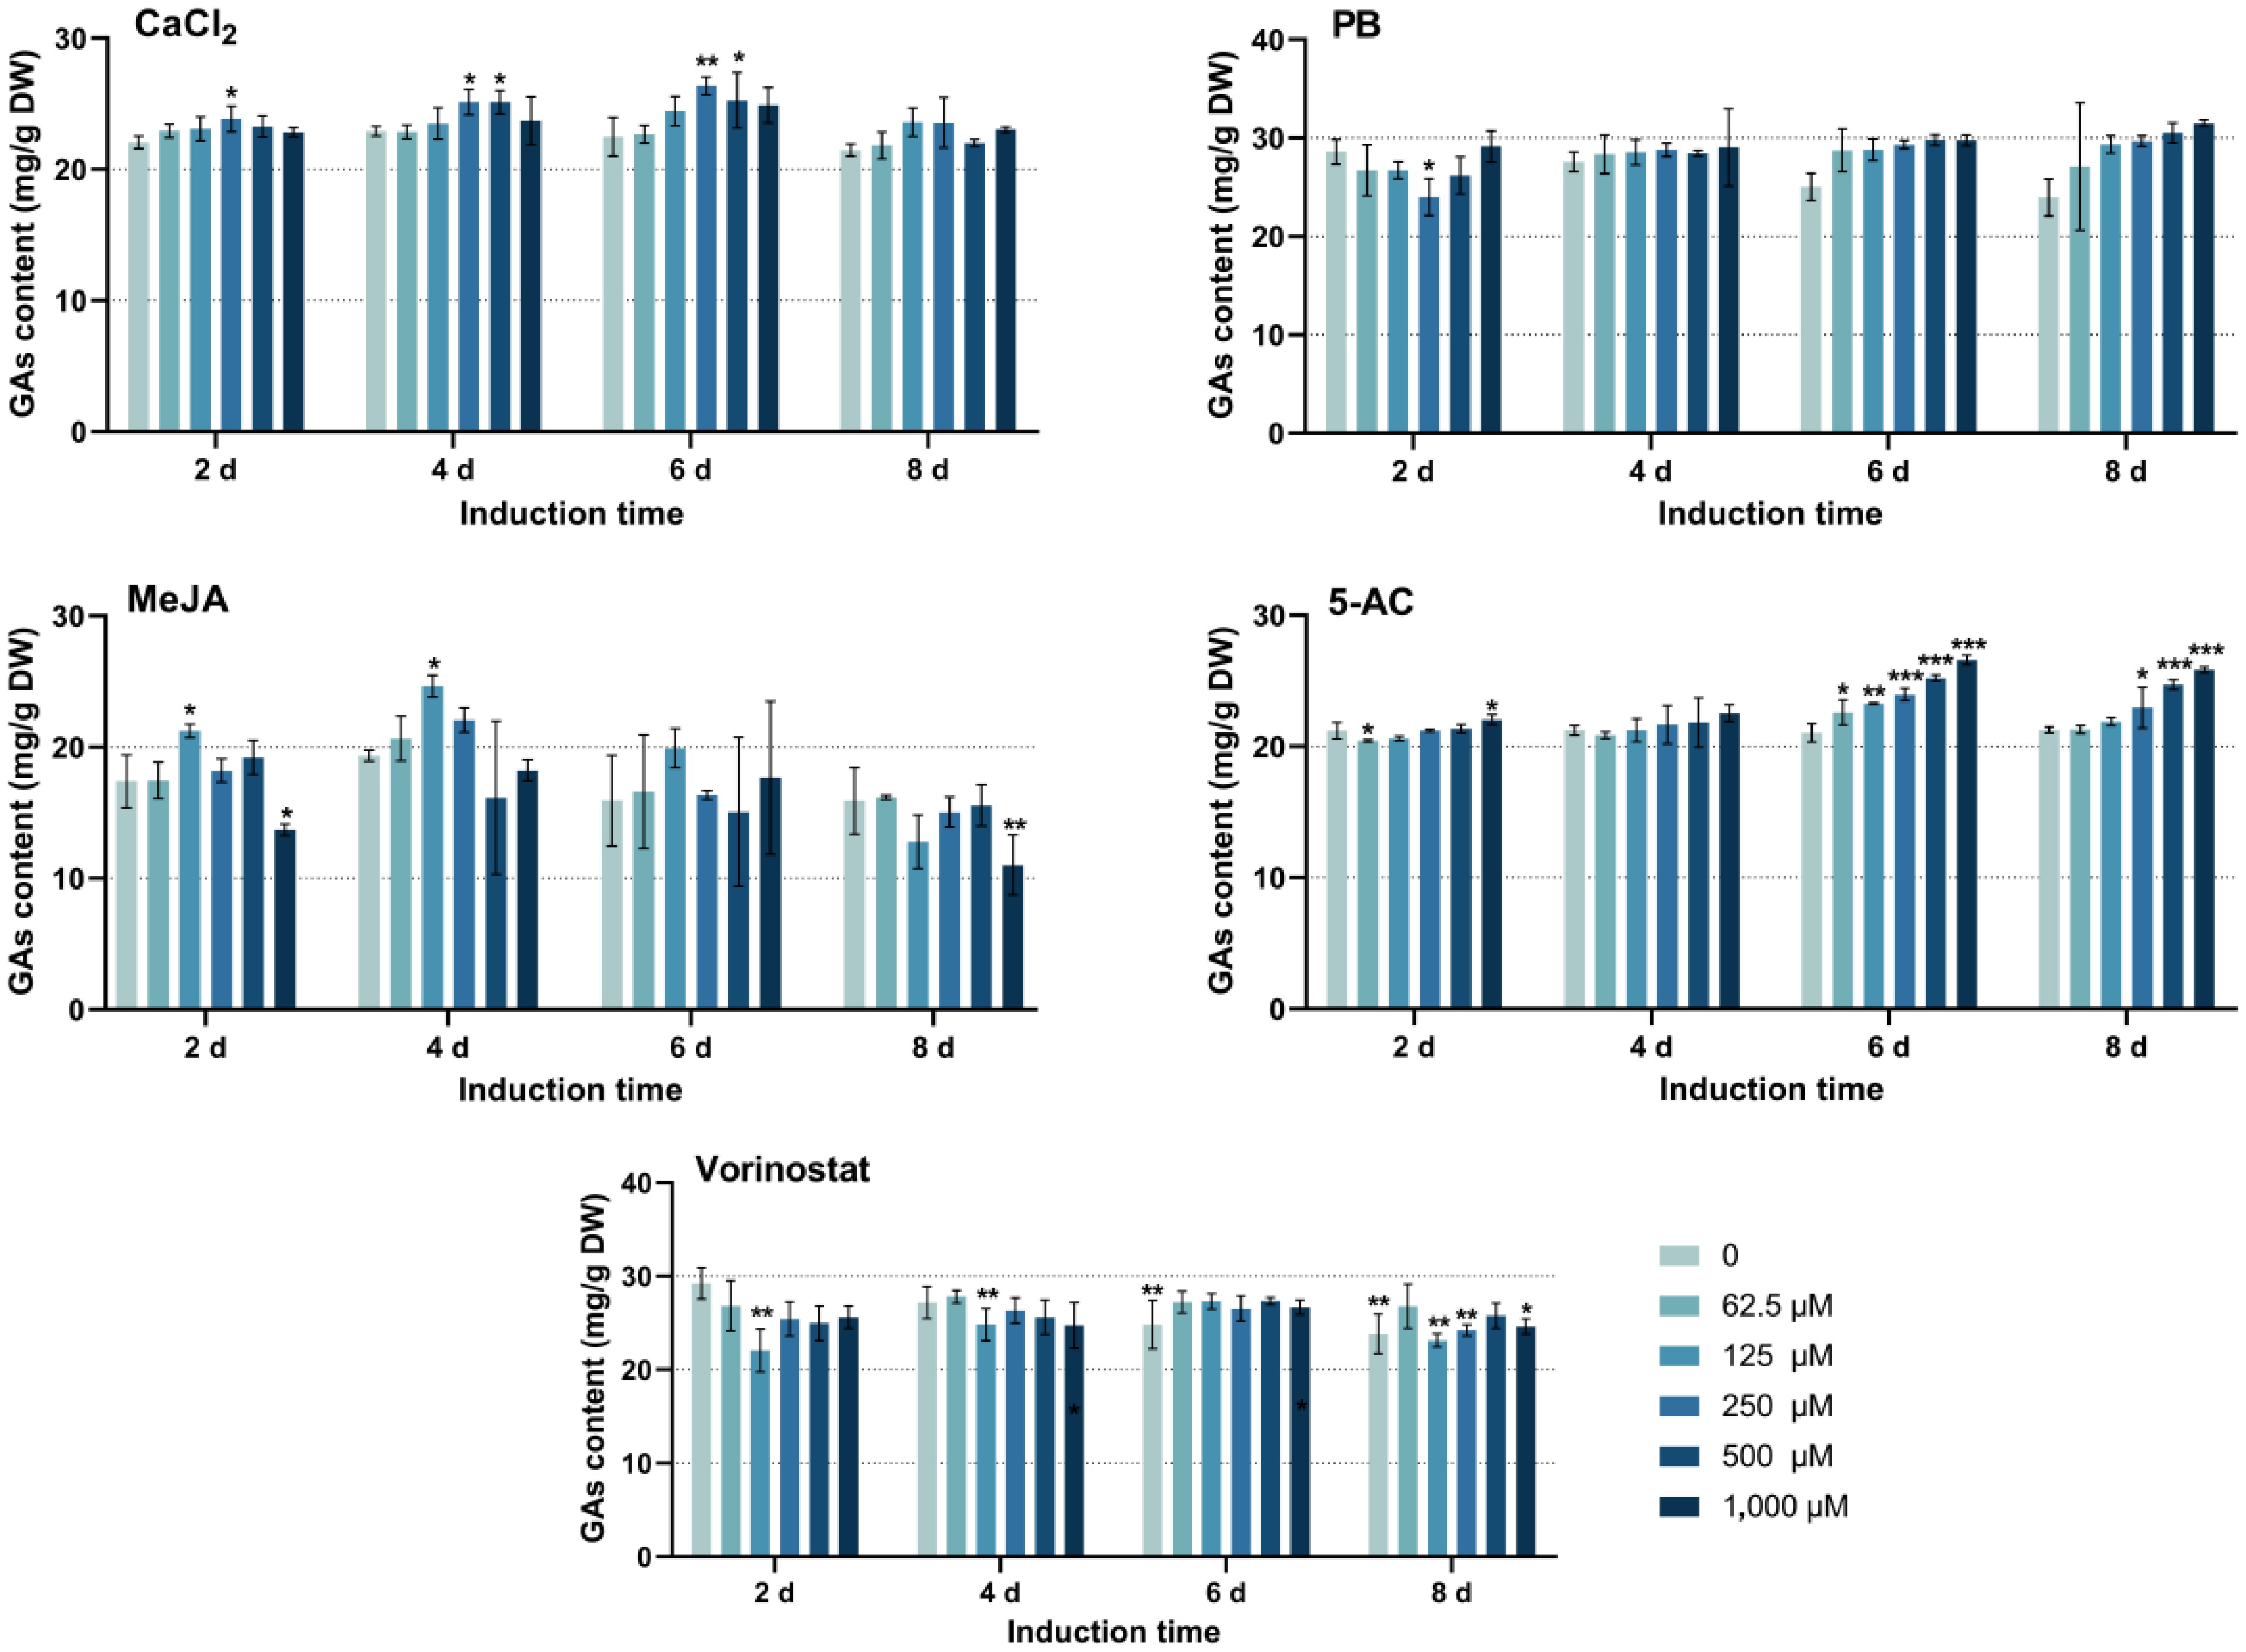
Figure 1.
The effect of single inducers on GA contents. PB, phenobarbital; MeJA, methyl jasmonate; 5-AC, 5-azacytidine. CaCl2 and 5-AC were dissolved in water, PB and vorinostat were dissolved in dimethyl sulfoxide, and MeJA was dissolved in ethanol. The difference between groups is considered to be significant at *p < 0.05, **p < 0.01, and ***p < 0.001.
Multiple inducers for enhancing GA contents based on BBD-RSM
-
A single application of CaCl2, PB, MeJA, or 5-AC can enhance the content of GAs in G. lucidum mycelia. However, the effect of multiple inducers on GA content remains to be elucidated. RSM is a comprehensive application of experimental design, mathematical statistical analysis, and an optimization strategy. BBD, a widely used method in response surface optimization, was developed by Box and Behnken in 1960 and is effective for designing and analyzing multi-factor, three-level experiments[25]. In this study, we selected these four inducers for combined application and investigated their interactions on mycelial growth and GA metabolism. In previous experiments with single inducers, the optimal induction time was obtained, namely 6 days for CaCl2, 4 days for MeJA, 8 days for PB, and 6 days for 5-AC. Through the single-factor test in RSM, we identified the optimal concentration range for subsequent experiments (Supplementary Fig. S1). In the combined induction experiment, the optimal concentration ranges were 100–400 μM for MeJA, 750–1,250 μM for PB, 100–400 μM for CaCl2, and 600–1,000 μM for 5-AC. We designed the experiments with four factors, each at three levels, resulting in 29 runs (Supplementary Tables S1 and S2) to determine the best combination for GA synthesis. The effects of these 29 combinations on the response variables, GA content and biomass, are summarized in Supplementary Table S2.
The main effect plots revealed a nonlinear relationship between the predictors and the response variables. To estimate the regression coefficients via multiple regression analyses, the second-order polynomial models for GA content and biomass were fitted. ANOVA was performed to assess the significance and fit of the models. The sums of squares, degrees of freedom, mean squares, p-values, and F-values obtained from the ANOVA are presented in Supplementary Tables S3 and S4. Equations (1) and (2) represent the quadratic regression models derived via the BBD. These models aim to optimize the variables for maximum GA content and biomass and to examine how GA content and biomass behave as functions of the four parameters. As shown in Supplementary Tables S3 and S4, double models were highly significant (p < 0.01), suggesting their reliability and adequacy. Moreovr, both p-values for the lack of fit were greater than 0.05, indicating that the lack of fit was not significant relative to pure error, confirming the validity of both models. The F-values also support the reliability of the mathematical models for GA content and biomass as response factors. The independent variable with the highest F-value contributes most significantly to the proposed model[26]. Considering the F-values (18.11 and 62.52), CaCl2 and MeJA were identified as the most influential variables affecting GA content and biomass, respectively, whereas PB had a minimal impact on both.
$\begin{split}{\rm { GAs\, content}}\, =\,& 31.2202 \,+\, 2.06577\, A \,+\, 0.637576\, B \,+\,2.18135\, C \,+\\& 0.647738 \,D \,-\, 0.13526 \,AB\, - \,1.20593\, AC \,-\, 1.43836 \,AD \,+\\& 0.274335 \,BC\, -\, 0.0133375\, BD \,+\, 0.266715 \,CD\,-\\& \,4.56611 \,A^2\, -\, 1.28265 \,B^2 \,-\,0.334856\, C^2 \,-\, 3.51544 \,D^2\end{split}$ (1) $\begin{split}{\rm{Biomass}}\, =\,& 3.14087 \,+\, 0.115417\, A \,- \,0.00933333 \,B\, +\, 0.0379167 \,C \,- \\&\,0.0189446 \,D \,-\, 0.0085 \,AB \,+ \,0.0386667 \,AC\, -\, 0.0120835\, AD\, +\\&\, 0.0730835 \,BC\, - \,0.03475 \,BD\, - \,0.0376667\, CD \,- \,0.1156 \,A^2 \,-\\& \,0.0786414\, B^2\, - \,0.0796 \,C^2\, -\, 0.105308 \,D^2\end{split}$ (2) The three-dimensional (3D) surface plots (Figs. 2, 3) and two-dimensional (2D) contour plots (Supplementary Figs. S2 and S3) were generated to examine the interactions between pairs of small molecules and their effects on GA content and biomass. For each graph, two factors were held constant at a medium level while the influence of the other two variables was assessed. Regarding GA content, the 3D and 2D plots showed interactions between MeJA and PB (Fig. 2a and Supplementary Fig. S2a), MeJA and CaCl2 (Fig. 2b and Supplementary Fig. S2b), MeJA and 5-AC (Fig. 2c and Supplementary Fig. S2c), PB and CaCl2 (Fig. 2d and Supplementary Fig. S2d), PB and 5-AC (Fig. 2e and Supplementary Fig. S2e), and CaCl2 and 5-AC (Fig. 2f and Supplementary Fig. S2f). These plots revealed that GA content varied as the parameter values increased. The surfaces in Fig. 2b, c are steep, and the interaction contours are dense along the MeJA axis, indicating strong interactions between MeJA and CaCl2, and between MeJA and 5-AC. In terms of mycelium biomass, the 3D and 2D plots depict the interactions between MeJA and PB (Fig. 3a and Supplementary Fig. S3a), MeJA and CaCl2 (Fig. 3b and Supplementary Fig. S3b), MeJA and 5-AC (Fig. 3c and Supplementary Fig. S3c), PB and CaCl2 (Fig. 3d and Supplementary Fig. S3d), PB and 5-AC (Fig. 3e and Supplementary Fig. S3e), and CaCl2 and 5-AC (Fig. 3f and Supplementary Fig. S3f). The p-value for the interaction term BC was 0.0119 (p < 0.05), indicating a significant effect of the interaction between PB and CaCl2 on biomass. The steep slope in Fig. 3b demonstrates that the interaction between MeJA and CaCl2 had a more substantial impact on biomass.
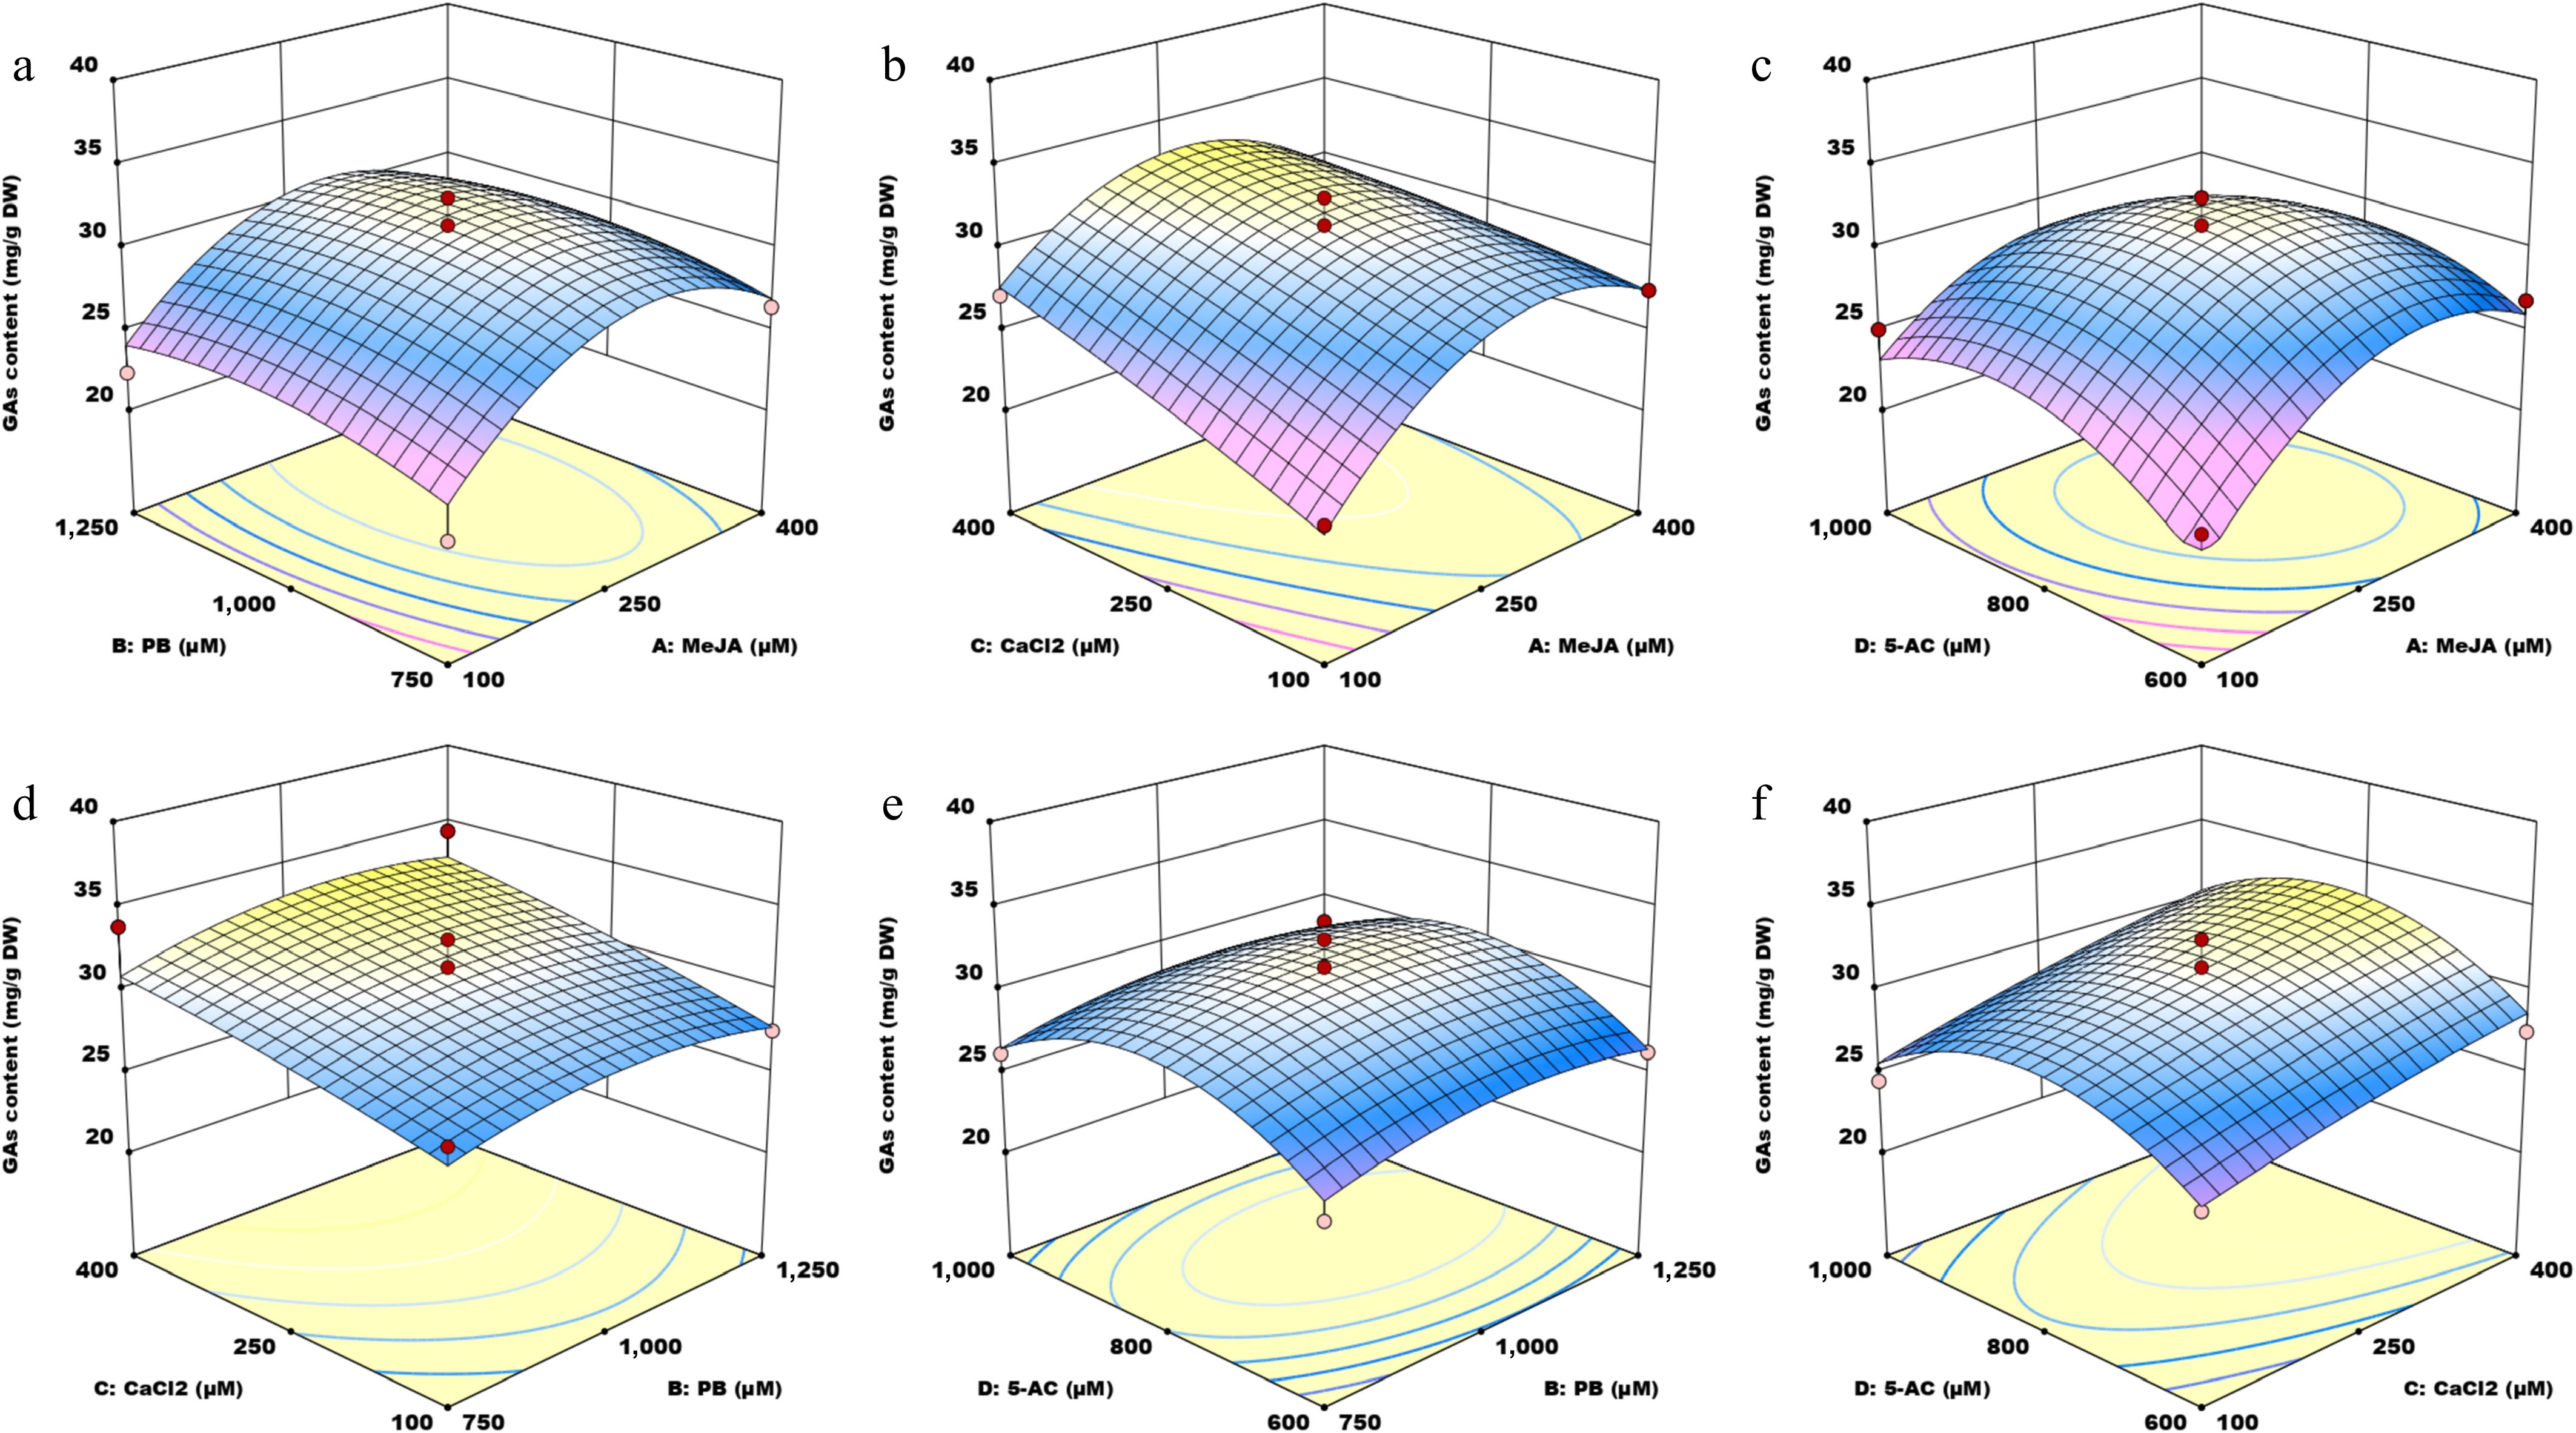
Figure 2.
Three-dimensional surface plots illustrating the interaction effects of four small molecules on GA content. MeJA, methyl jasmonate; PB, phenobarbital; 5-AC, 5-azacytidine. (a) Response surface graph showing the interaction between MeJA and PB. (b) Response surface graph showing the interaction between MeJA and CaCl2. (c) Response surface graph showing the interaction between MeJA and 5-AC. (d) Response surface graph showing the interaction between PB and CaCl2. (e) Response surface graph showing the interaction between PB and 5-AC. (f) Response surface graph showing the interaction between CaCl2 and 5-AC.
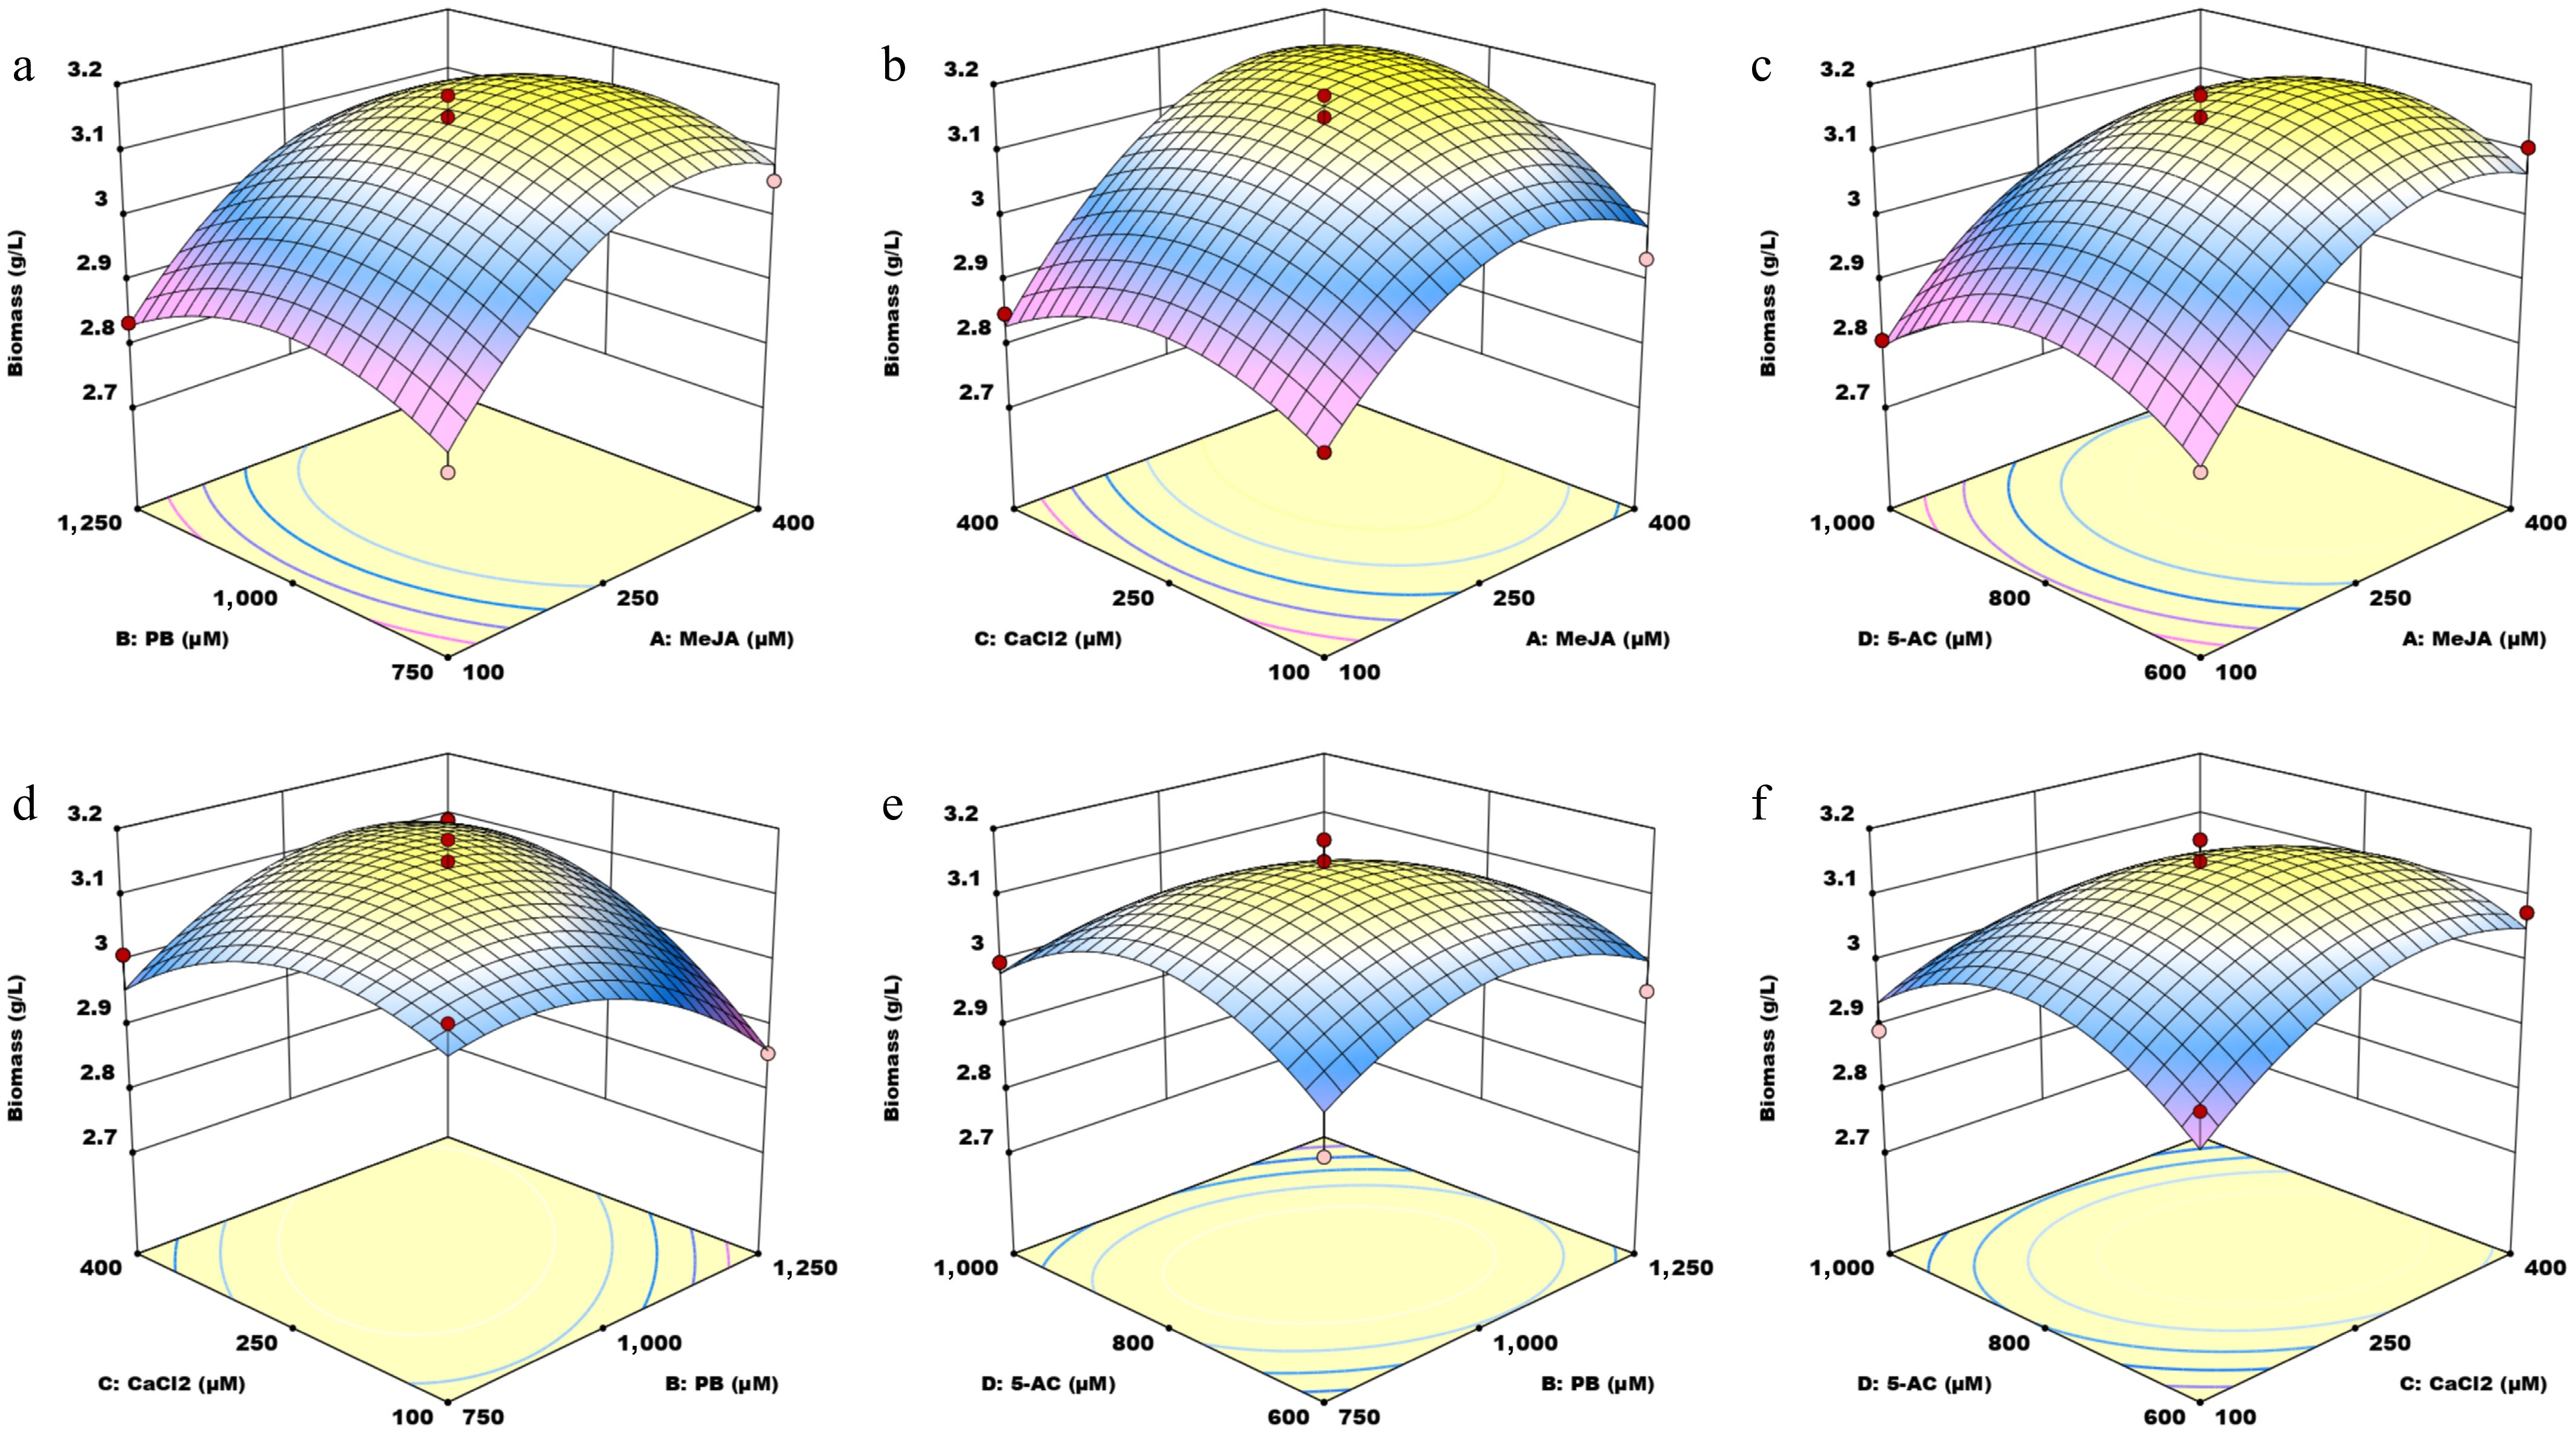
Figure 3.
Three-dimensional (3D) surface plots illustrating the interaction effects of four small molecules on biomass. MeJA, methyl jasmonate; PB, phenobarbital; 5-AC, 5-azacytidine. (a) Response surface graph showing the interaction between MeJA and PB. (b) Response surface graph showing the interaction between MeJA and CaCl2. (c) Response surface graph showing the interaction between MeJA and 5-AC. (d) Response surface graph showing the interaction between PB and CaCl2. (e) Response surface graph showing the interaction between PB and 5-AC. (f) Response surface graph showing the interaction between CaCl2 and 5-AC.
According to the predictions made by Design Expert, the optimal concentrations for the inducers were found to be 400.00 μM CaCl2, 1,087.96 μM PB, 260.67 μM MeJA, and 823.04 μM 5-AC (known as the Mix treatment). The experimentally measured GA content, obtained from three replicates was 31.94 mg/g DW, which closely matched the predicted value of 33.31 mg/g DW. Compared with the control group (21.63 mg/g DW), the content of GAs under the Mix treatment increased by 47.67%. Additionally, the maximum predicted mycelial biomass was 3.17 g/L, achieved with concentrations of 361.19 μM CaCl2, 1074.51 μM PB, 303.59 μM MeJA, and 775.85 μM 5-AC. The experimentally measured maximum biomass was 3.14 g/L, which closely aligned with the predicted value. These results indicate that the determined optimal values are suitable for use in further experimental studies.
Exogenous inducers improve the content of GA monomers
-
The first part of the study examined the effect of inducers on the total content of GA, but their impact on the accumulation of individual GA monomers was unclear. To address this, we used liquid chromatography–mass spectrometry (LC-MS) to detect GA-B and GA-D in G. lucidum mycelia from different treatment groups. As shown in Fig. 4, the content of GA-B and GA-D increased to varying extents across the treatment groups. Since the relative content was defined as the ratio of the compound's content in the treatment group to that in the control group, and because the absolute contents of GA-B and GA-D differed, a direct comparison of their relative contents was not possible. The MeJA treatment significantly promoted the synthesis of both GA-B and GA-D, with their contents increasing 121.50-fold and 67.27-fold, respectively, compared with the untreated group. The Mix treatment (400.00 μM CaCl2, 1,087.96 μM PB, 260.67 μM MeJA, and 823.04 μM 5-AC) was greatly beneficial for the synthesis of GA-D, which increased 68.94-fold relative to the control group. This was followed by CaCl2, MeJA, and 5-AC. These results demonstrate that adding exogenous inducers to the liquid culture medium is an effective strategy for enhancing the content of GA monomers.
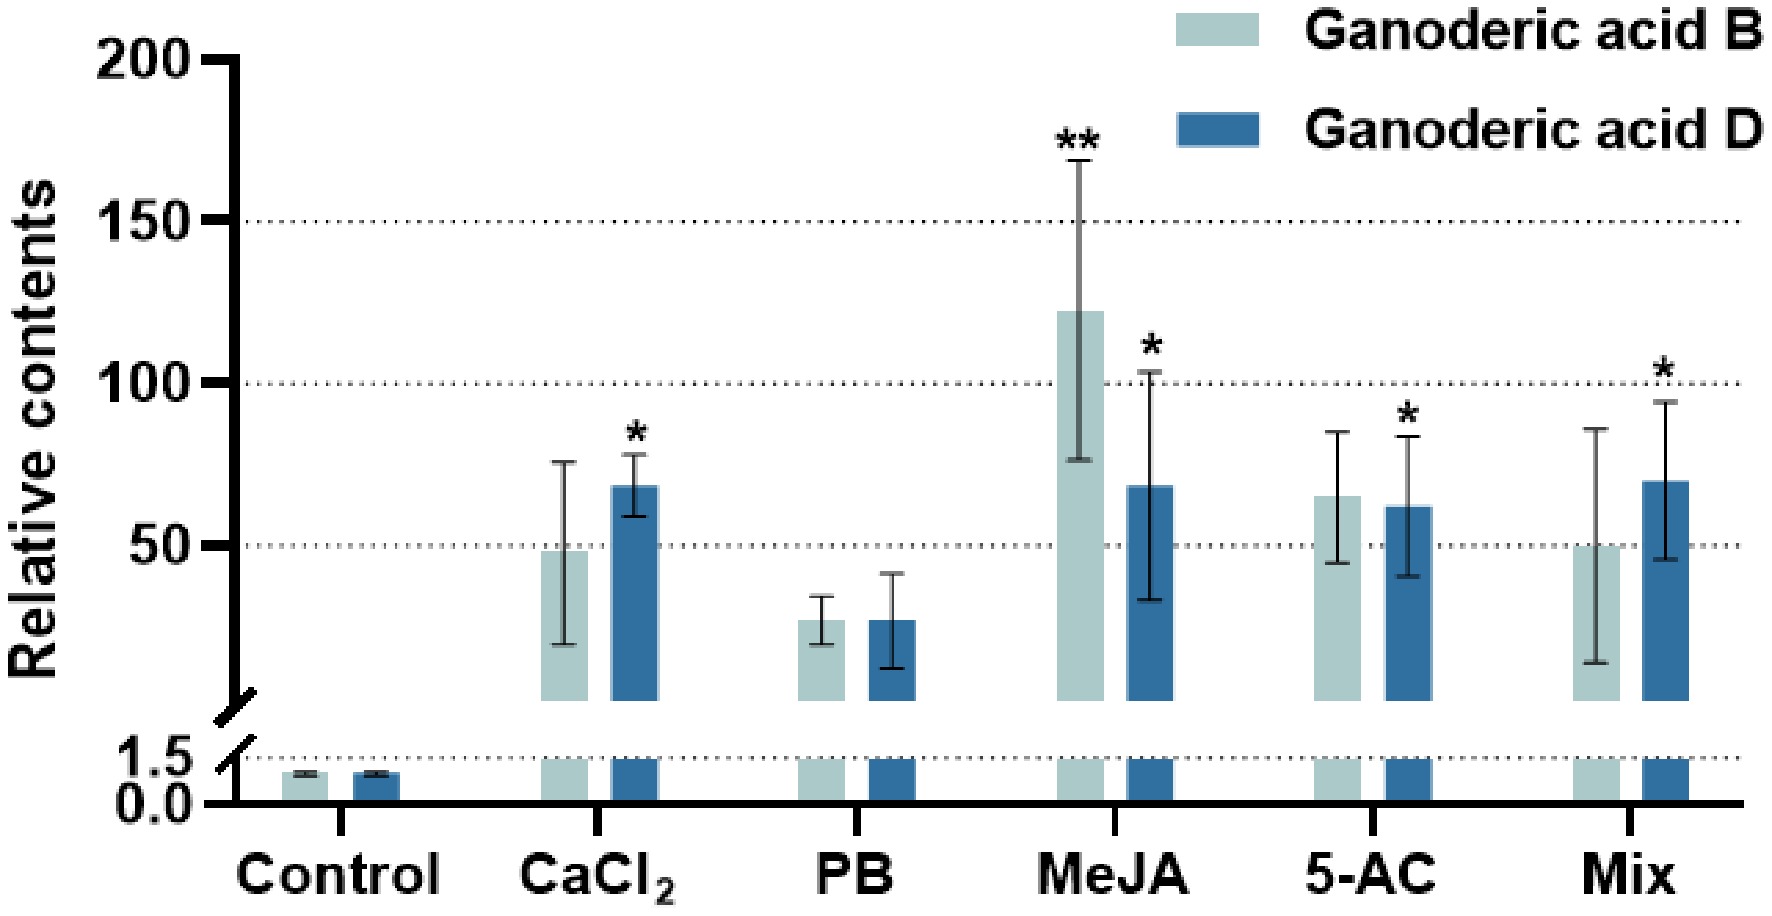
Figure 4.
GA monomer contents under the optimal treatment with different exogenous inducers. The relative content refers to the ratio of GA monomer content in each treatment group to the content of the solvent-induced group (dontrol). GA monomers refers to GA-B and GA-D. CaCl2, treatment with 250 μM CaCl2 for 6 days; PB, treatment with 1,000 μM phenobarbital for 8 days; MeJA, treatment with 125 μM methyl jasmonate for 4 days; 5-AC, treatment with 1,000 μM 5-azacytidine for 6 days; Mix, treatment with 400.00 μM CaCl2, 1,087.96 μM PB, 260.67 μM MeJA, and 823.04 μM 5-AC. CaCl2 and 5-AC were dissolved in water, PB was dissovled in dimethyl sulfoxide, and MeJA was dissolved in ethanol. Differences between groups are considered significant at * p < 0.05 and ** p < 0.01.
In G. lucidum, although various types of GAs are present, their total content remains low. Further investigation is required into whether the content of other monomers changed dynamically, even though the increase in one monomer was substantial. The exogenous inducers can regulate the synthesis and metabolism of GAs; however, the molecular mechanism underlying this regulation remains unexplained. Different inducers exert distinct effects, and the regulation of gene expression by these inducers will be a key focus of future research on the accumulation of GAs.
Transcriptomic analysis of G. lucidum mycelia treated with different inducers
-
To further elucidate the molecular mechanism by which the inducers mentioned above affect GA biosynthesis, we obtained RNA-seq data from five treatment groups and one control group. Compared with the control group, a total of 699 differentially expressed genes (DEGs) were identified in the Mix treatment group, 233 in the CaCl2 treatment group, 216 in the PB treatment group, 1,858 in the MeJA treatment group, and 488 in the 5-AC treatment group (Fig. 5 and Supplementary Fig. S4). Among them, the CaCl2 treatment group contained 168 downregulated genes and 65 upregulated genes, the PB group had 120 downregulated genes and 96 upregulated genes, the MeJA group included 1,147 downregulated genes and 711 upregulated genes, the 5-AC group had 280 downregulated genes and 208 upregulated genes, and the Mix group exhibited 431 downregulated genes and 268 upregulated genes. Venn diagrams revealed eight common genes, namely two upregulated genes (GLB05G001910 and GLB07G000320) and six downregulated genes (GLB04G001663, GLB03G000748, GLB11G000356, GLB02G000911, GLB02G000942, and GLB07G000939), among the five treatment groups (Fig. 5, Supplementary Figs. S5, S6 and Supplementary Table S10). These common genes are likely involved in regulating the accumulation of GAs in response to exogenous inducers. The 40 DEGs, including the 20 genes with the most significantly increased or decreased expression levels, are listed in Supplementary Tables S5–S9 for each treatment group.
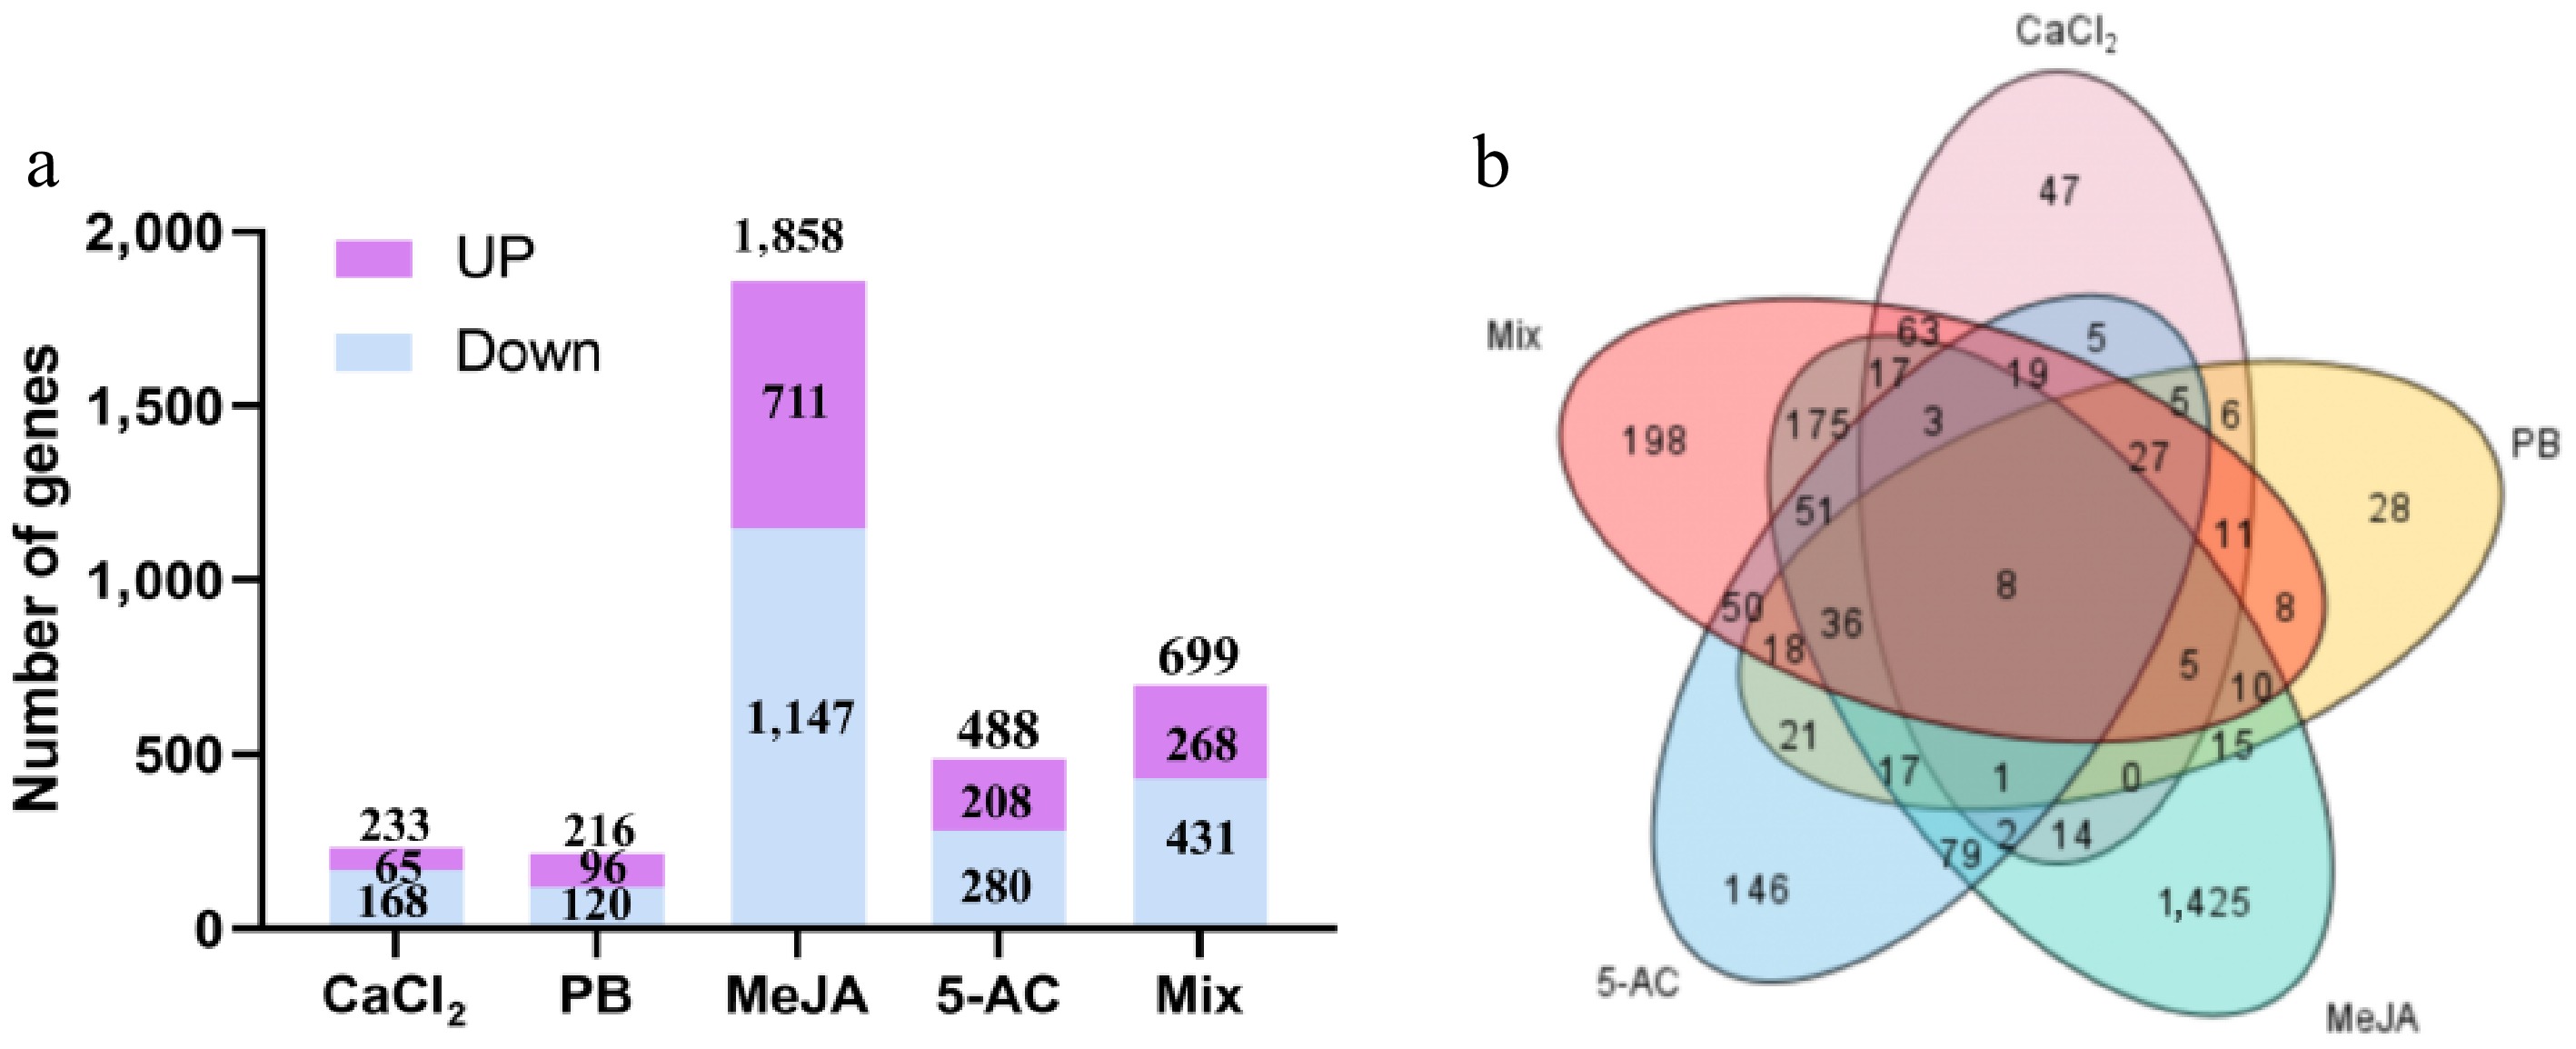
Figure 5.
DEGs from the transcriptome of different treatment groups. (a) The number of upregulated and downregulated genes from different treatment groups. (b) Distribution of DEGs in different treatment groups. MeJA, methyl jasmonate; PB, phenobarbital; 5-AC, 5-azacytidine. Mix, 400.00 μM CaCl2, 1,087.96 μM PB, 260.67 μM MeJA, and 823.04 μM 5-AC.
Calcium ions act as potent inducers that enhance secondary metabolite accumulation in fungi, including the biosynthesis of specific triterpenoids. Transcriptomic analysis of calcium ion-treated samples revealed DEGs which were functionally categorized via GO enrichment into three domains: Biological processes (BPs), cellular components (CCs), and molecular functions (MFs). Supplementary Fig. S7 shows the top 10 significantly enriched GO terms in each category. The top 10 BP terms involved the amino sugar metabolic process, amino sugar biosynthetic process, uridine diphosphate (UDP)-N-acetylglucosamine biosynthetic process, UDP-N-acetylglucosamine metabolic process, and nucleotide-sugar biosynthetic process. The CC terms included the sulfite reductase complex nicotinamide adenine dinucleotide phosphate (NADPH), endoplasmic reticulum membrane complex (EMC) complex, mitotic spindle astral microtubule end, etc. The MF terms consisted of DNA-binding transcription factor activity, DNA-binding transcription activator activity, UDP-N-acetylglucosamine diphosphorylase activity, glucosamine 6-phosphate N-acetyltransferase activity, glutamate decarboxylase activity, hydroxymethylglutaryl-CoA synthase activity, and so on. Supplementary Fig. S8 highlights the 20 most enriched KEGG pathways, notably phenylalanine metabolism (ko00360), chloroalkane degradation (ko00625), beta-alanine metabolism (ko00410), mitogen-activated protein kinase (MAPK) signaling (ko04011), Cytochrome P450 (CYP)-mediated oxidation (ko00199), and protein phosphatase-associated pathways (ko01009). Within the ko01009 pathway, one upregulated gene (GLB05G000589) and two downregulated genes (GLB04G000207 and GLB13G000326) were implicated in activating calcium signaling through regulating phosphorylase. Calcium-responsive genes associated with GA accumulation included GLB05G000372, GLB11G000092, GLB08G000663, and GLB04G000297 (MAPK signaling pathway); GLB03G000748 and GLB07G000070 (CYP activity); and GLB05G000372, GLB08G000446, and GLB04G000155 (transcription factor regulation). Six upregulated genes and four downregulated genes were annotated by GO or KEGG, as shown in Supplementary Table S5.
Concerning transcriptomic profiling of PB-treated samples, the GO and KEGG enrichment terms are shown in Supplementary Figs. S9 and S10, respectively. BP terms predominantly included antibiotic, ethanol, primary alcohol, and acetaldehyde catabolic processes. Among CC terms, the sulfite reductase complex (NADPH) exhibited the highest enrichment significance. NADPH was the most significantly enriched CC term. The MF terms were primarily associated with enzymatic activities. There were 10 DEGs enriched in peptidases and inhibitors (ko01002), and 5 DEGs enriched in the metabolism of xenobiotics by CYP (ko00980). As detailed in Supplementary Table S6, two upregulated and six downregulated DEGs were functionally annotated with GO/KEGG. Notably, seven DEGs (GLB09G000229, GLB12G000142, GLB10G000469, GLB13G000787, GLB10G000648, GLB03G000748, and GLB10G000202) were annotated as CYP genes. Of these, GLB03G000748 and GLB10G000202 were downregulated, whereas the remaining five exhibited significant upregulation.
Transcriptomic analysis across all five treatment groups revealed that the MeJA treatment group exhibited the highest number of DEGs. After GO enrichment analysis, the first five subcategories appeared in the BP category: Cytoplasmic translation, ribosome biogenesis, translation, peptide biosynthetic process and amide biosynthetic process; however, in the CC category, cytosolic ribosome, ribosome, preribosome, cytosolic large ribosomal subunit, and ribosomal subunit were the top five subcategories. For the MF category, the top five subcategories were structural constituent of ribosome, structural molecule activity, RNA binding, nucleic acid binding, and rRNA binding (Supplementary Fig. S11). In the KEGG analysis of the DEGs, ribosome, ribosome biogenesis, DNA replication, DNA replication proteins, and ribosome biogenesis in eukaryotes were the most significantly enriched (Supplementary Fig. S12). Seven DEGs (GLB03G000525, GLB01G000227, GLB11G000214, GLB10G000682, GLB11G000517, GLB10G000402, and GLB05G001546) were enriched in the steroid biosynthesis pathway (ko00100). GLB11G000517 and GLB10G000402 were enriched in the sesquiterpenoid and triterpenoid biosynthesis pathways (ko00909). Moreover, 7 DEGs (GLB09G000254, GLB06G000630, GLB01G000489, GLB02G000067, GLB05G001546, GLB07G000710, and GLB03G000748) were annotated in the CYP pathway (ko00199), and 17 DEGs were annotated in the transcription factors pathway (ko03000).
Transcriptomic analysis of the 5-AC treatment group identified 89 DEGs, with their functional annotations through GO enrichment analysis. The five most significantly enriched BP subcategories included the carboxylic acid metabolic process, oxoacid metabolic process, organic acid metabolic process, cellular amino acid metabolic process, and small molecule metabolic process. For the CC category, the extracellular region, cell surface, yeast-form cell wall and fungal-type cell wall were the top four enriched subcategories. Sulfite transmembrane transporter activity exhibited the highest enrichment significance in the MF category (Supplementary Fig. S13). In KEGG pathway analysis of DEGs, the five most enriched pathways were valine, leucine and isoleucine biosynthesis (ko00290); amino acid-related enzymes (ko01007); lysosome (ko04142); pantothenate and CoA biosynthesis (ko00770); and peptidases and inhibitors (ko01002) (Supplementary Fig. S14).
Transcriptomic profiling of the Mix treatment group identified 699 DEGs, including 102 and 158 genes annotated through GO and KEGG enrichment analysis, respectively. The GO enrichment analysis showed that the top 10 most significantly enriched subcategories of BP belonged to metabolic processes and biosynthetic processes. In the CC category, the extracellular region, sulfite reductase complex (NADPH), and endoplasmic reticulum were the top three subcategories. The three most significantly enriched subcategories of MF were guanosine diphosphate (GDP)-fucose transmembrane transporter activity, UDP-N-acetylglucosamine transmembrane transporter activity, and UDP-xylose transmembrane transporter activity (Supplementary Fig. S15). Additionally, Supplementary Fig. S16 presents the 20 most significantly enriched KEGG pathways for the DEGs. In the KEGG pathway analysis, 5 of the top 10 most significantly enriched pathways belonged to metabolism and biosynthesis, namely pyruvate metabolism (ko00620), glutathione metabolism (ko00480), steroid biosynthesis (ko00100), indole alkaloid biosynthesis (ko00901) and tropane, piperidine and pyridine alkaloid biosynthesis (ko00960) (Supplementary Fig. S16). Notably, five DEGs (GLB05G001249, GLB11G000214, GLB11G000517, GLB03G000525, and GLB05G000707) were enriched in the steroid biosynthesis pathway. Among these, four downregulated DEGs (GLB05G001249, GLB11G000214, GLB11G000517, and GLB03G000525) may redirect metabolic flux toward triterpene acid accumulation by suppressing competitive steroid biosynthesis.
The biosynthetic pathway of GAs is typically considered to be achieved through the mevalonate (MVA) pathway (Fig. 6). Acetyl Coenzyme A (Acetyl-CoA) serves as the initial substrate, undergoing sequential enzymatic transformations to generate key intermediates[27]. Acetyl-CoA acetyltransferase (AACT) catalyzes the synthesis of acetoacetyl-CoA by transferring the acetyl group from one acetyl-CoA to another, marking the first enzymatic step in the MVA pathway[28]. Subsequently, 3-hydroxy-3-methylglutaryl-CoA synthase (HMGS) facilitates the adenosine triphosphate (ATP)-dependent conversion of acetoacetyl-CoA and acetyl-CoA to 3-hydroxy-3-methylglutaryl-CoA (HMG-CoA), which is then reduced to mevalonate by 3-hydroxy-3-methylglutaryl-CoA reductase (HMGR)[29,30] Isotopic labeling studies by Shiao et al. proved that triterpenes in G. lucidum were synthesized via the MVA pathway[31]. MVA undergoes sequential phosphorylation to produce mevalonate-5-phosphate and mevalonate-5-diphosphate, followed by decarboxylation to generate isopentenyl pyrophosphate (IPP)[32]. IPP is then isomerized to dimethylallyl pyrophosphate (DMAPP) and further transformed into the active precursor, geranyl diphosphate (GPP), which can be catalyzed to form monoterpenes. Two IPP molecules and one DMAPP molecule undergo a head-to-tail condensation reaction, leading to farnesyl pyrophosphate (FPP) via farnesyl phosphate synthase (FPS)[33]. Squalene synthase (SQS) condenses two FPP molecules to squalene, which is then oxidized to 2,3-oxidosqualene[34]. Lanosterol, a key intermediate in triterpenoid biosynthesis, is produced through the cyclization of 2,3-oxidosqualene by lanosterol synthase (LS)[35]. The triterpenoid ring undergoes a series of complex modifications, such as oxidation, hydroxylation, and glycosylation, and finally forms a variety of GAs. CYPs play a critical role in catalyzing the conversion of lanosterol into different GA monomers[36]. Despite these advancements, many specific steps in the conversion of lanosterol to GAs remain unclear, necessitating further research. The heatmap in Fig. 6 illustrates the expression levels of GA biosynthesis genes across the five experimental treatment groups. In the Mix treatment group, MVA genes encoding HMGS, MK, MPK, IDI, and FPS1 exhibited higher expression levels compared with the control group. Similarly, CaCl2 treatment induced the upregulation of HMGS, MK, isopentenyl diphosphate isomerase (IDI), SQS, and LS. HMGS, MK, IDI, FPS1, and SQS were upregulated in the PB treatment group. HMGS, HMGR, MK, MPK, IDI, and FPS1 were upregulated in 5-AC treatment group. However, MeJA treatment universally suppressed MVA pathway genes' transcription, aside from AACT and FPS1, with all annotated genes (HMGS, HMGR, MK, MPK, MVD, IDI, FPS2, SQS, SE, and LS) showing consistent downregulation.
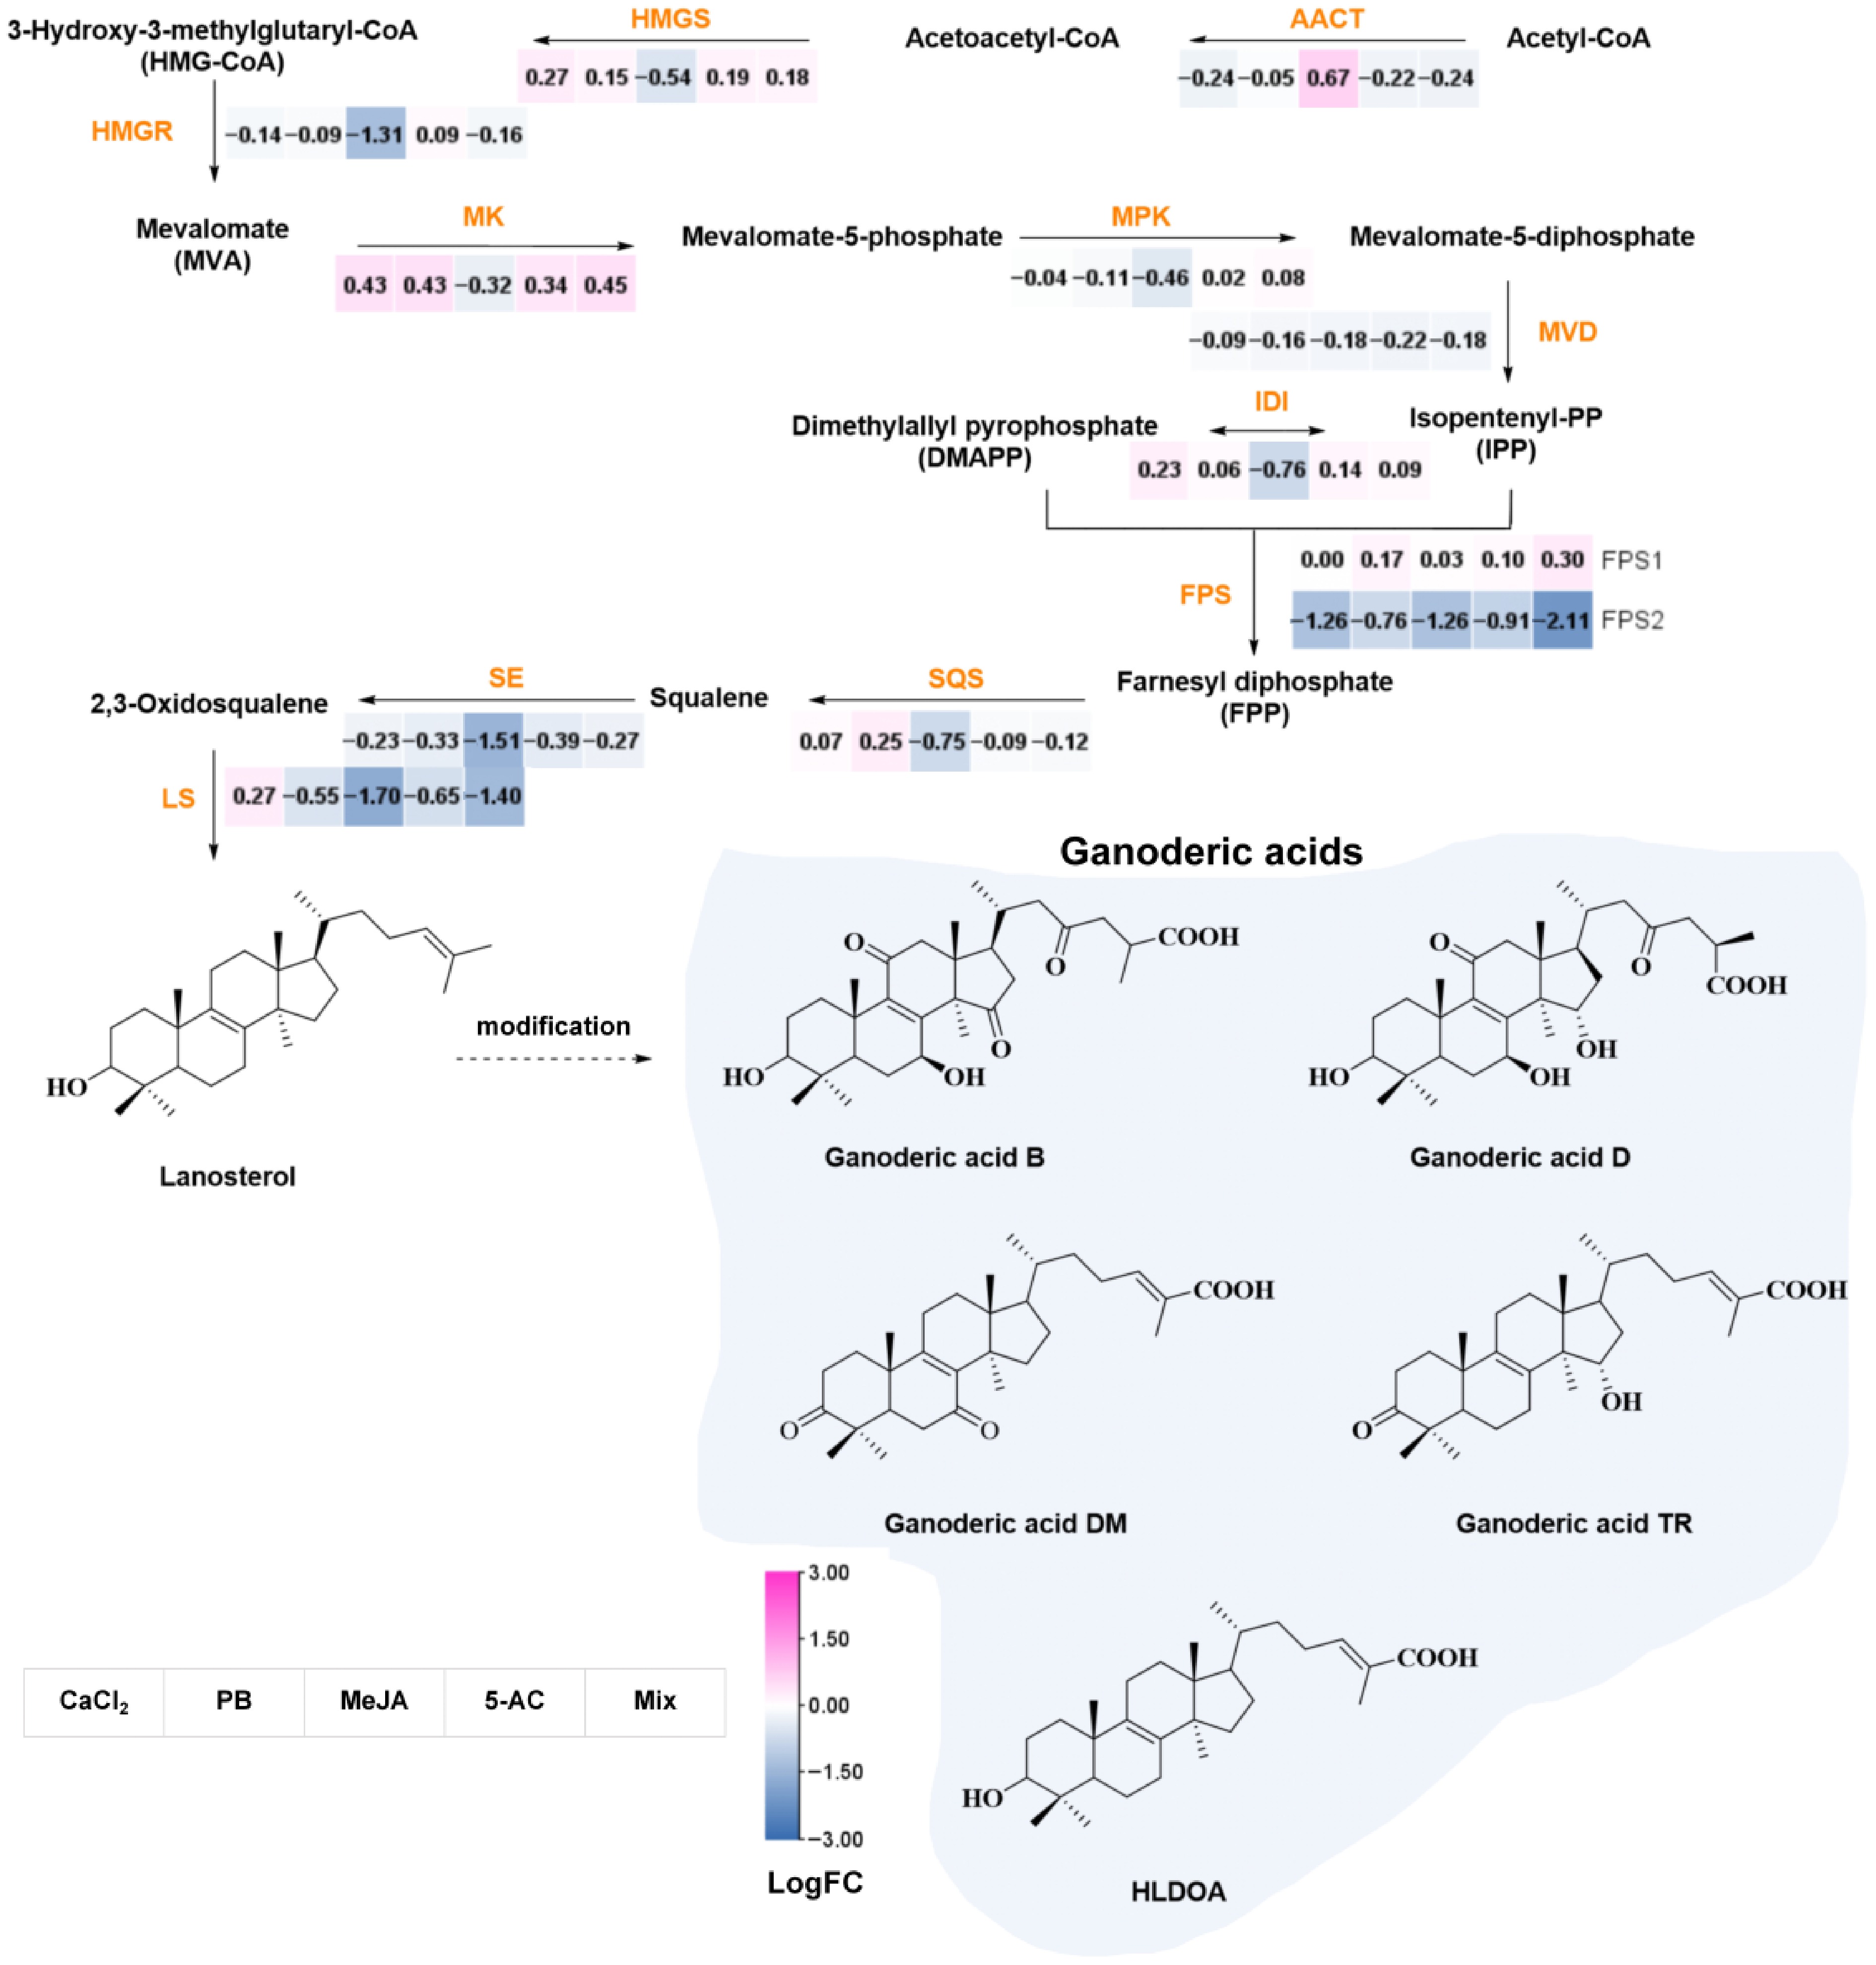
Figure 6.
The biosynthetic pathway of GAs and the expression profiles of reported biosynthetic genes. Key enzymes are colored in orange. Solid lines represent the confirmed synthetic pathway, and dashed lines represent the proposed synthetic pathway. The abbreviations are as follows: HLDOA, 3-hydroxy-lanosta-8,24-dien-26-oic acid; AACT, acetyl-CoA acetyltransferase; HMGS, HMG-CoA synthase; HMGR, HMG-CoA reductase; MK, MVA kinase; MPK, mevalonate-5-phosphate kinase; MVD, mevalonate-5-diphosphate decarboxylase; IDI, isopentenyldiphosphate isomerase; FPS, farnesyl phosphatesynthase; FPP, farnesyl pyrophosphate; GPP, geranyl diphosphate; SQS, squalene synthase; SE, squalene monooxygenase; LS, lanosterol synthase. MeJA, methyl jasmonate; PB, phenobarbital; 5-AC, 5-azacytidine; Mix, 400.00 μM CaCl2, 1,087.96 μM PB, 260.67 μM MeJA, and 823.04 μM 5-AC.
Various CYPs convert lanosterol, a key intermediate, into GAs with different structures and functions. For example, CYP5150L8 is considered to be the first enzyme from lanosterol to GAs that catalyzes the formation of 3-hydroxy-lanosta-8,24-dien-26-oic acid (HLDOA) through three sequential oxidation steps at the C26 position of the lanosterol skeleton[37]. HLDOA can subsequently be converted to GA-Jb by GL21117 and 3,28-dihydroxy-lanosta-8,24-dien-26-oic acid (DHLDO) by CYP5139G1[38,39]. Yang et al. cloned the gene CYP512U6 in G. lucidum and found that CYP512U6 could hydroxylate GA-DM and GA-TR at the C23 position C23, producing hainanic acid A and GA-Jc, respectively[40]. Recently, a multifunctional cytochrome CYP512A13 has been reported to directly catalyze the conversion of the carbon–carbon conjugated double bond on the lanone skeleton to an enone[41]. To further investigate the genes involved in GA biosynthesis, transcriptomic analysis identified a total of 75 CYP DEGs across the five treatment groups. The CaCl2, PB, MeJA, 5-AC, and Mix treatment groups harbored 4, 7, 69, 10, and 36 CYP DEGs, respectively. Strikingly, GLB03G000748 emerged as the sole common downregulated CYP gene in all five groups, suggesting its potential role in redirecting metabolic flux toward GA biosynthesis by suppressing competing branch pathways. In the PB treatment group, there were seven DEGs annotated as CYP genes, with two downregulated genes and five upregulated genes. These five genes are potentially involved in GA synthesis. The transcriptome data provided valuable insights into the molecular regulation of GA biosynthesis and have advanced our understanding of the underlying synthetic mechanisms.
-
G. lucidum has become an ideal model organism for research because of its small genome, mature transformation system and rapid growth. Species identification, molecular design breeding, and metabolic engineering are utilized to achieve high-yield GAs[42]. Exogenous inducers play a potent role in regulating the complex biosynthesis and accumulation of GAs. In this study, we investigated the effect of five inducers, MeJA, PB, CaCl2, 5-AC, and vorinosta, on the accumulation of GAs. The results showed that vorinostat exerted varying degrees of inhibition on the accumulation of GAs. Thus, the remaining four inducers were used to determine the optimal multi-inducer concentrations via BBD combined with RSM to enhance the GA content. It was unexpected that the GA content of the Mix treatment group was only approximately 0.4 mg/g DW higher than the content of the PB treatment group. In liquid fermentation systems, exogenous inducers are known to play a significant yet limited role in enhancing GA biosynthesis. Notably, both the inducer concentration and induction time exerted differential regulatory effects on the accumulation of GAs for single inducers. However, the molecular regulatory mechanism of inducers remains poorly understood. The application of omics technology provides strong technical support for the rapid development of basic and applied research into G. lucidum. Since 2012, with the publication of the genome sequence (G. lucidum CGMCC 5.26)[43], research into the synthesis pathways and regulation of important substances in G. lucidum has gradually entered a rapid novel period. Du et al. assembled the telomere to telomere (T2T) genomes of two haploid G. lucidum strains and identified the first G. lucidum single-cell transcriptome atlas, elucidating the spatiotemporal specificity of GA biosynthesis and the annotation of a novel CYP (GlCYP512A3)[44]. Targeted metabolomic and transcriptomic analysis of different growth stages of G. lucidum, including the primordia, the mature fruiting body, and the post-spore fruiting bodies, showed that six transcription factors (TFs) and two CYPs were significantly associated with four triterpenoid components[45]. In our case, transcriptomic analysis of five treatment groups identified 75 CYP DEGs, 36 of which were from the Mix group. In the Mix group, 32 upregulated CYP DEGs may be involved in the synthesis of GA-B and GA-D. A total of 699 DEGs from the Mix group provides valuable information for investigating the regulation of GA biosynthesis by inducers.
-
In conclusion, we screened four inducers in a one-factor experiment, identifying those that effectively enhanced the GA content. Using BBD combined with RSM, we determined the optimal multi-inducer concentrations: 260.67 μM MeJA, 1,087.96 μM PB, 400.00 μM CaCl2 and 823.04 μM 5-AC. Under the optimal conditions, the resulting GA content increased by 47.67%. To explore the regulatory mechanisms underlying the accumulation of GAs, we sequenced the transcriptomes of the four individual inducer treatment groups and the optimal combination group. Several candidate genes, particularly those showing common up- or downregulation patterns, warrant further investigation. This study offers an effective approach for enhancing the accumulation of secondary metabolites, and the transcriptomic data provide valuable insights for further studies on the regulatory mechanisms involved.
This research was supported by the Joint Fund of the Zhejiang Provincial Natural Science Foundation of China (Grant No. HZSZ24H280007 and No. LHZSZ24H280003), the Major Science and Technology Projects of Breeding New Varieties of Agriculture in Zhejiang Province (No. 2021C02073-5), and the Project of Central Government Guiding the Development of Local Science and Technology (No. 2024ZY01009).
-
The authors confirm their contributions to the paper as follows: study conception and design: Xue Z, Li Z; data collection: Guo Y, Guo X; analysis and interpretation of results: Guo Y, Xu S, Guo X; draft manuscript preparation: Guo Y; transcriptome sequencing and data analysis: Xu J, Li Z, Wang Y. All authors reviewed the results and approved the final version of the manuscript.
-
The data used to support the findings of this study are available from the corresponding author upon request.
-
Although the authors Xu J, Li ZY, Wang Y, and Li Z are employees of ShouXianGu Pharmaceutical Co., Ltd, the work presented in this article is independent academic research unrelated to the company's commercial interests. The authors declare no financial or other contractual agreements between the company and the authors or their institution that could influence the design, results, or reporting of this study.
-
# Authors contributed equally: Yanhong Guo, Shuhao Xu, Xue Guo
- Supplementary Table S1 Independent variables in RSM–BBD.
- Supplementary Table S2 Experimental values of GAs content and biomass on RSM-BBD.
- Supplementary Table S3 Regression model ANOVA for GAs content.
- Supplementary Table S4 Regression model ANOVA for biomass.
- Supplementary Table S5 40 DEGs of calcium chloride treatment group.
- Supplementary Table S6 40 DEGs of PB treatment group.
- Supplementary Table S7 40 DEGs of MeJA treatment group.
- Supplementary Table S8 40 DEGs of 5-AC treatment group.
- Supplementary Table S9 40 DEGs of Mix treatment group.
- Supplementary Table S10 Common DEGs in 5 treatment groups.
- Supplementary Fig. S1 Effect of CaCl2, PB, MeJA and 5-AC at various concentrations on GAs content based on RSM.
- Supplementary Fig. S2 2D contour plots representing the effect of interaction of four small molecules on GAs content.
- Supplementary Fig. S3 2D contour plots representing the effect of interaction of four small molecules on biomass.
- Supplementary Fig. S4 Volcano plots of differential expression of five treatment groups.
- Supplementary Fig. S5 Up-regulated DEGs in transcripts of different treatment groups.
- Supplementary Fig. S6 Down-regulated DEGs in transcripts of different treatment groups.
- Supplementary Fig. S7 GO enrichment analysis of the DEGs from CaCl2 treatment group.
- Supplementary Fig. S8 KEGG enrichment analysis of DEGs from CaCl2 treatment group.
- Supplementary Fig. S9 GO enrichment analysis of the DEGs from PB treatment group.
- Supplementary Fig. S10 KEGG enrichment analysis of DEGs from PB treatment group.
- Supplementary Fig. S11 GO enrichment analysis of the DEGs from MeJA treatment group.
- Supplementary Fig. S12 KEGG enrichment analysis of DEGs from MeJA treatment group.
- Supplementary Fig. S13 GO enrichment analysis of the DEGs from 5-AC treatment group.
- Supplementary Fig. S14 KEGG enrichment analysis of DEGs from 5-AC treatment group.
- Supplementary Fig. S15 GO enrichment analysis of the DEGs from Mix treatment group.
- Supplementary Fig. S16 KEGG enrichment analysis of DEGs from Mix treatment group.
- Copyright: © 2026 by the author(s). Published by Maximum Academic Press, Fayetteville, GA. This article is an open access article distributed under Creative Commons Attribution License (CC BY 4.0), visit https://creativecommons.org/licenses/by/4.0/.
-
About this article
Cite this article
Guo Y, Xu S, Guo X, Xu J, Li Z, et al. 2026. Synergistic effects of exogenous inducers on ganoderic acid accumulation in Ganoderma lucidum: optimization and transcriptomic analysis. Medicinal Plant Biology 5: e001 doi: 10.48130/mpb-0025-0039 

Synergistic effects of exogenous inducers on ganoderic acid accumulation in Ganoderma lucidum: optimization and transcriptomic analysis
- Received: 01 September 2025
- Revised: 02 October 2025
- Accepted: 23 October 2025
- Published online: 16 January 2026
Abstract: Ganoderic acids (GAs) are bioactive compounds in Ganoderma lucidum that have various pharmacological properties. Their biosynthesis is influenced by environmental factors and elicitors, but the synergistic effects of multiple inducers on GA accumulation are not well understood. This study examined the effects of calcium chloride (CaCl2), phenobarbital (PB), methyl jasmonate (MeJA), and 5-azacytidine (5-AC) as exogenous inducers. The results showed GA contents of 26.35 ± 0.67, 31.53 ± 0.30, 24.66 ± 0.82, and 26.61 ± 0.37 mg/g dry weight (DW), respectively. Using Box–Behnken design (BBD) based on the response surface methodology (RSM), the optimal combination of inducers was determined to be 400.00 μM CaCl2, 1,087.96 μM PB, 260.67 μM MeJA, and 823.04 μM 5-AC (the Mix treatment), which led to a GA content of 31.94 mg/g DW, a 47.67% increase compared with the untreated control. Under 125 μM MeJA and the Mix treatment, the contents of GA-B and GA-D increased by 121.50- and 68.94-fold, respectively. Transcriptomic analysis revealed 233, 216, 1858, 488, and 699 differentially expressed genes (DEGs) in the five treatment groups. Among them, 5, 5, 2, 6, and 5 upregulated mevalonic acid (MVA) pathway genes and 4, 7, 69, 10, and 36 Cytochrome P450 (CYP) DEGs were identified, including a common downregulated CYP gene, GLB03G000748, suggesting its role in negative regulation of GA biosynthesis. This study not only demonstrates an effective combined induction strategy for the enhanced production of GAs by G. lucidum but also, through transcriptomic analysis, provides crucial molecular insights into the regulatory mechanisms of GA biosynthesis.
-
Key words:
- Ganoderma lucidum /
- Ganoderic acids /
- Exogenous inducers /
- Response surface methodology /
- Transcriptome