-
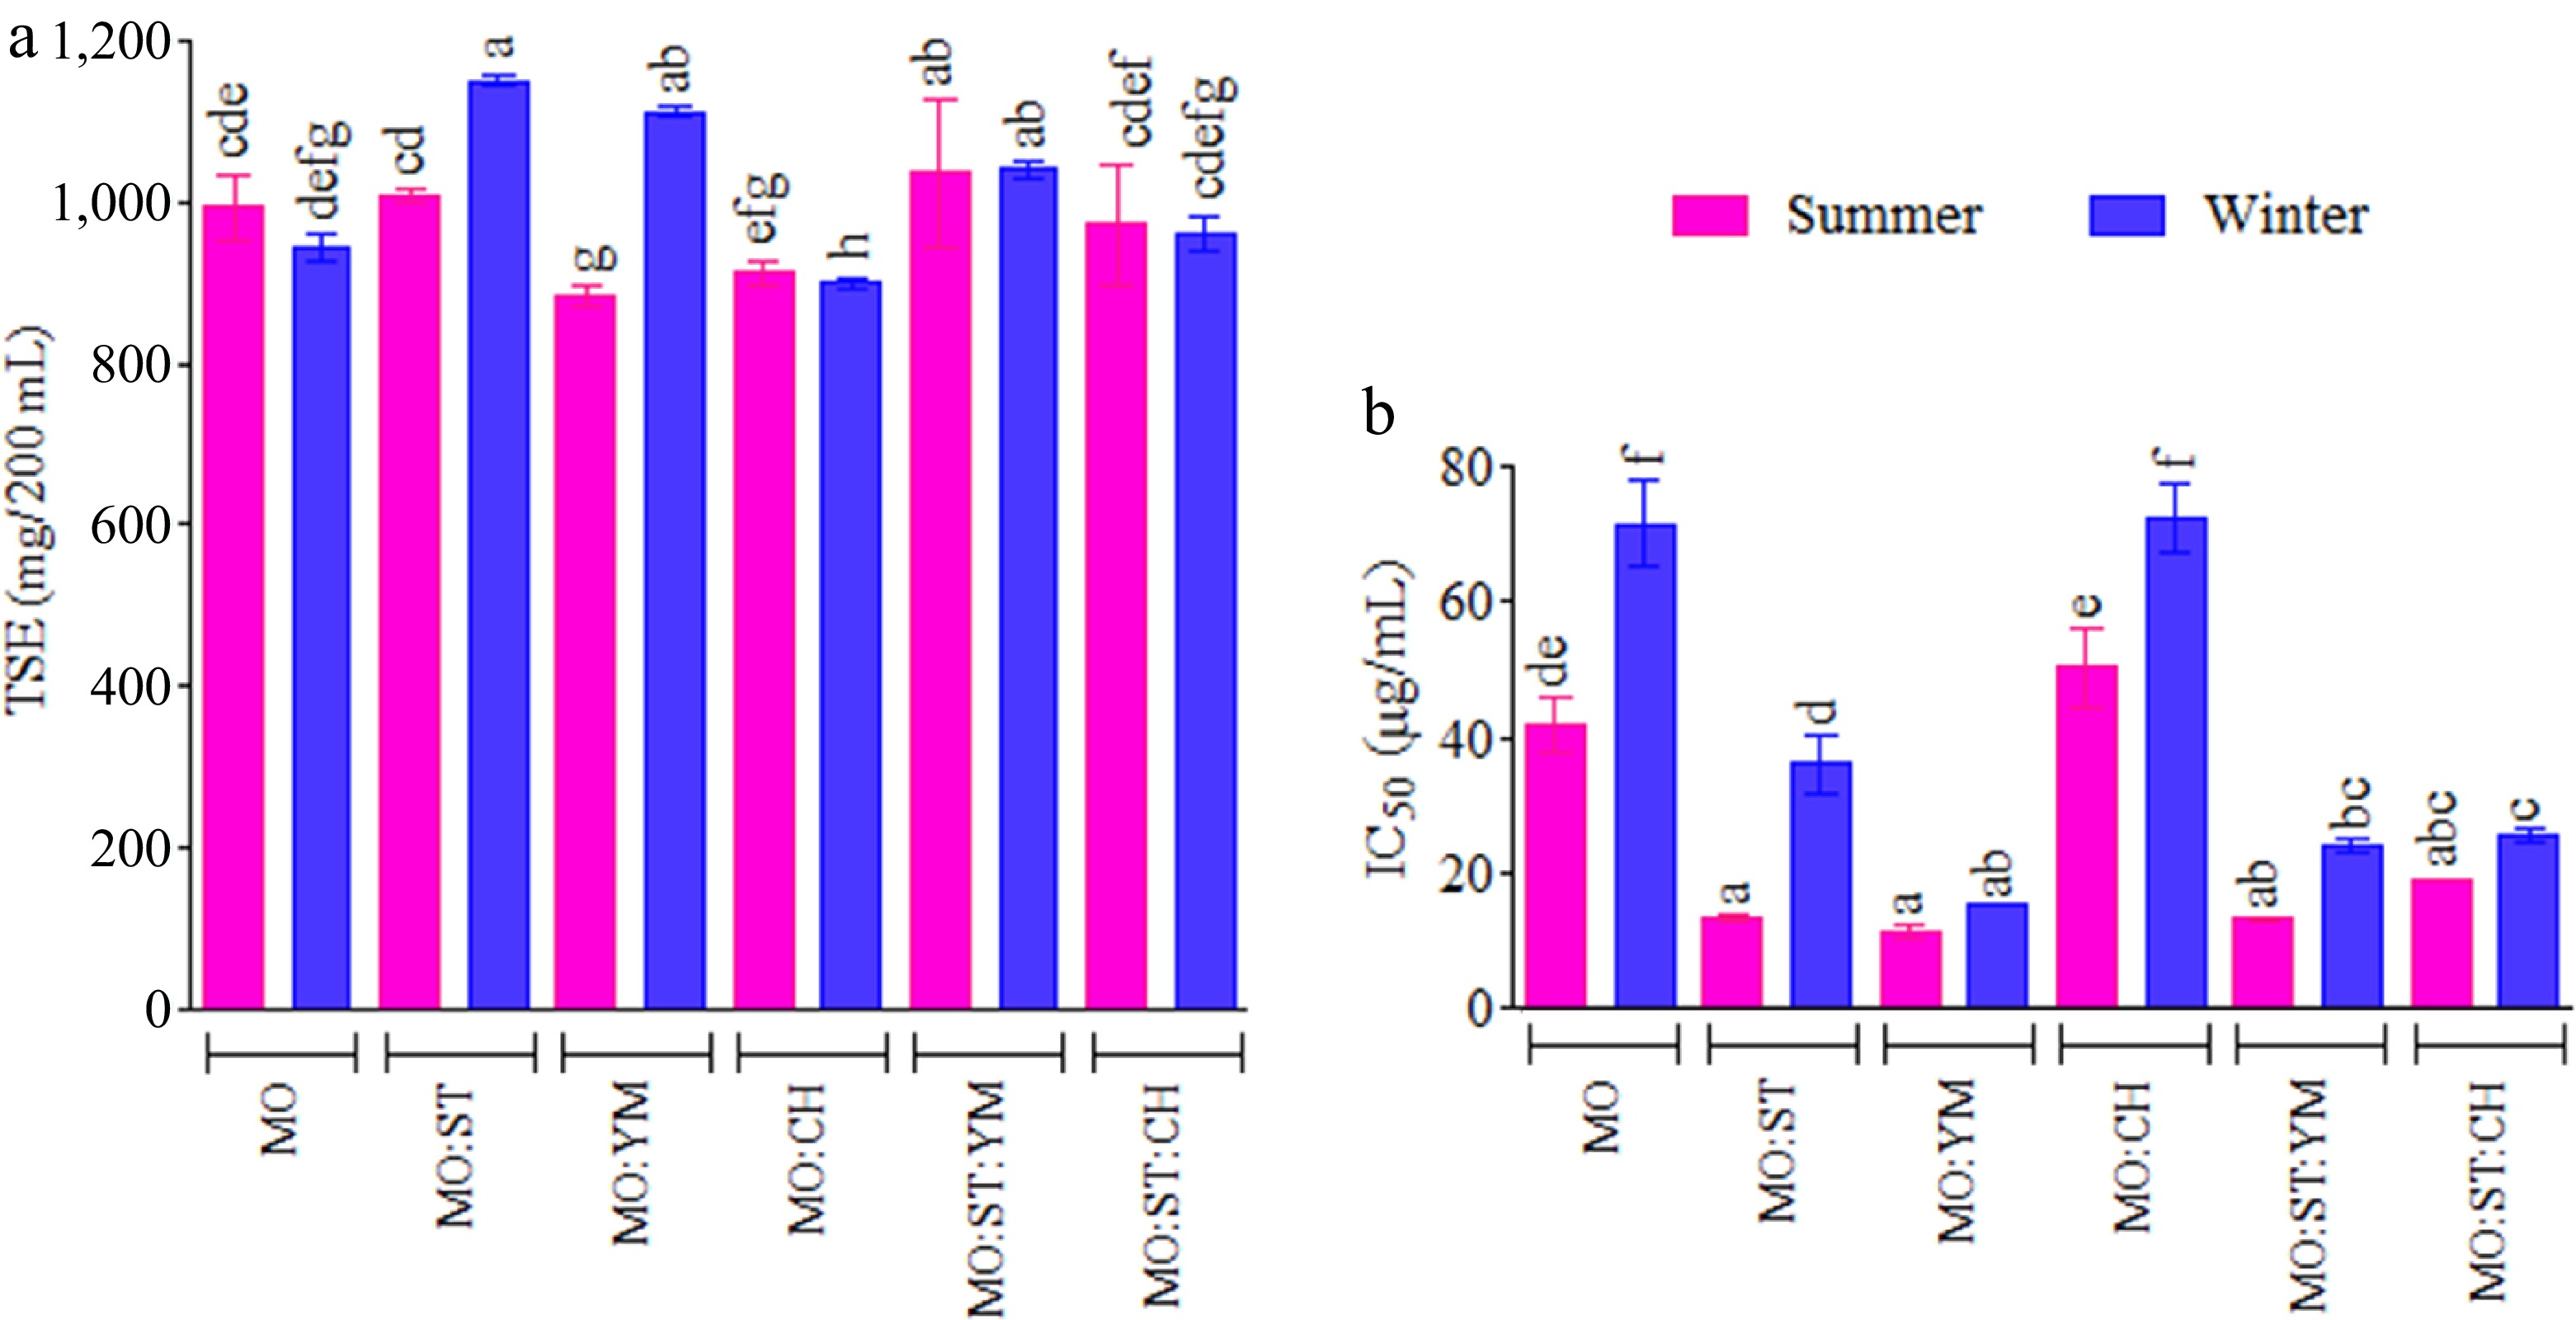
Figure 1.
(a) Total solids extracted (TSE), and (b) scavenging activity (IC50) against DPPH• radical of infusions as a function of the harvest season and the MO blend. Infusions with different letters on top indicate statistically significant differences for the Tukey test (95% CL)
-
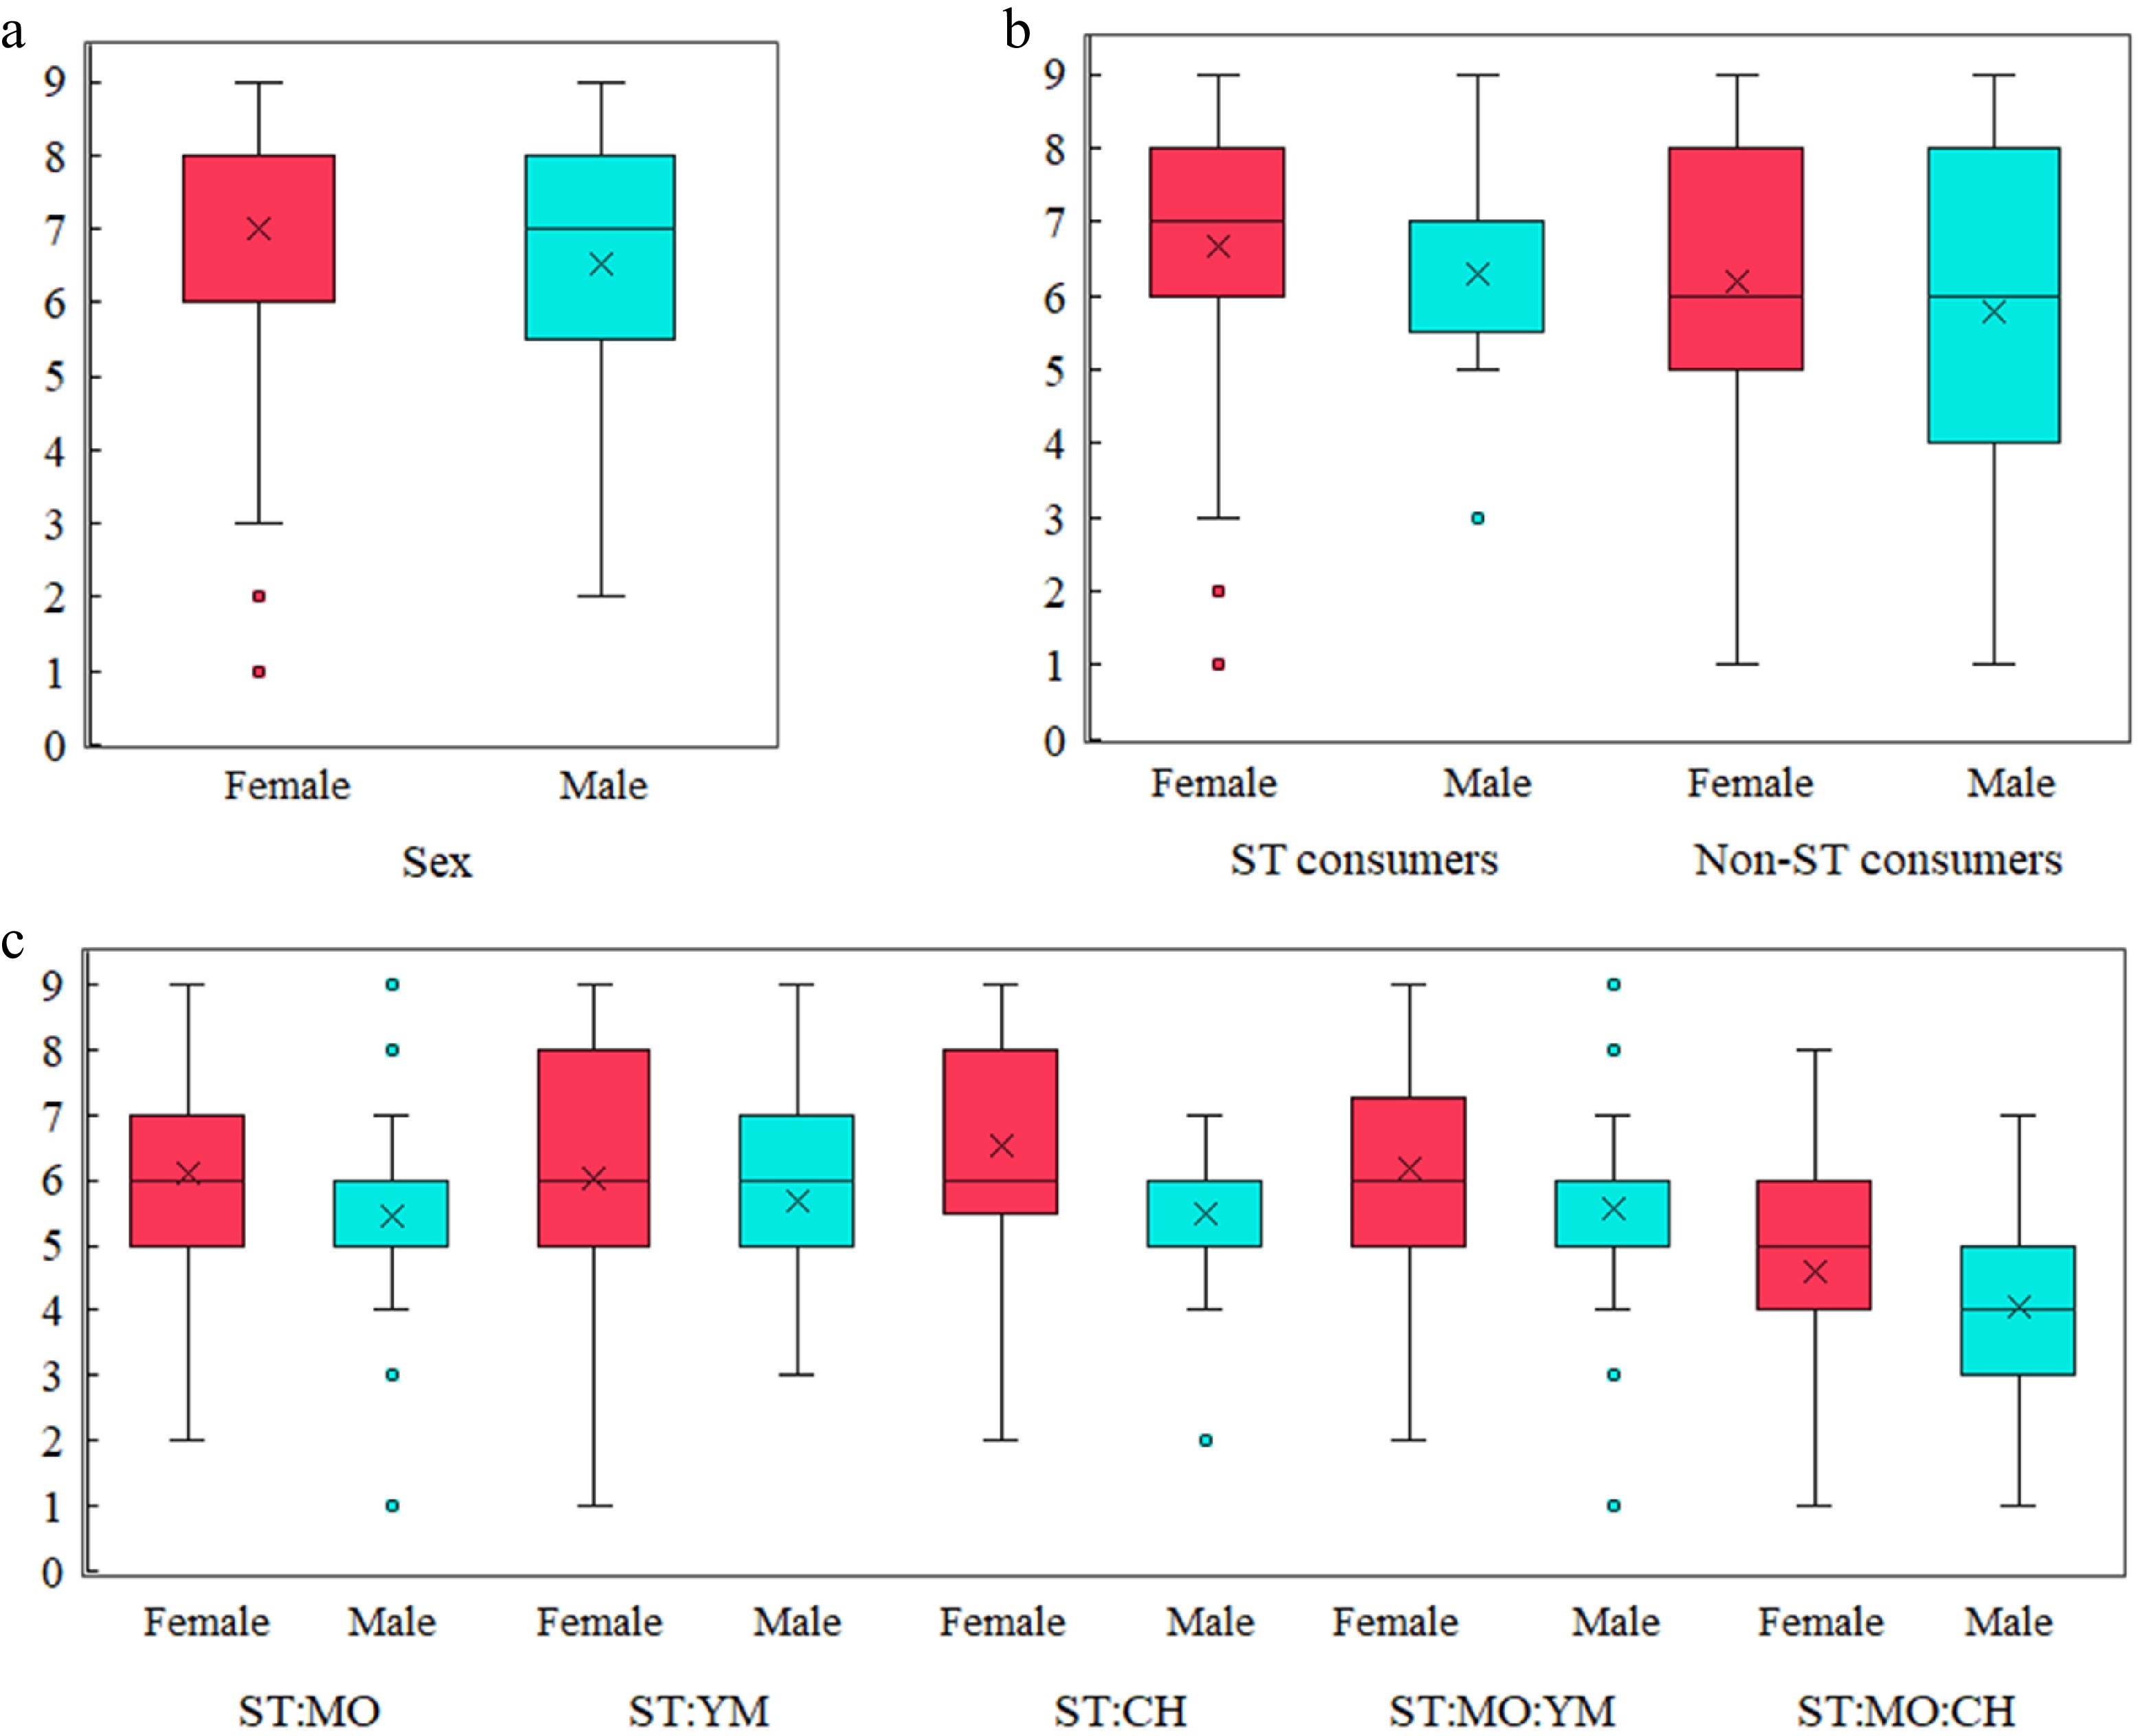
Figure 2.
Sensory evaluation scores of stevia-based herbal infusions. (a) Flavor quality scores by sex. (b) Sweetness quality scores by sex and stevia consumption habits. (c) Sweetness intensity scores across different infusion blends and sex.
-
Infusion PC, gallic acid equivalent (GAE) TC, gallic acid equivalent (GAE) FC, quercetin equivalent (QE) mg/g DE mg/200 mL mg/g DE mg/200 mL mg/g DE mg/200 mL ST 118.6 ± 11.9a 179.6 ± 15.7a 39.6 ± 0.4a 55.3 ± 5.9a 37.9 ± 1.5b 52.9 ± 5.3a MO 73.6 ± 2.3ef 83.6 ± 5.7ef 32.1 ± 3.9ef 34.3 ± 6.3bcde 29.1 ± 1.2c 30.9 ± 2.8d YM 112.7 ± 7.1a 106.1 ± 5.7cd 48.6 ± 7.0 a 44.2 ± 7.4ab 43.6 ± 0.6a 39.6 ± 1.8bc CH 67.0 ± 0.5fg 64.6 ± 0.7g 28.2 ± 3.8fg 24.8 ± 3.1efg 18.1 ± 0.4d 15.9 ± 0.1f ST : MO 89.7 ± 1.6bc 104.9 ± 0.7d 29.8 ± 2.1bc 32.4 ± 2.4bcde 36.7 ± 0.7b 39.8 ± 0.3bc ST : YM 113.3 ± 2.8a 127.8 ± 6.5b 21.0 ± 2.0a 22.3 ± 2.6fg 38.2 ± 0.5a 40.6 ± 2.4bc ST : CH 82.7 ± 0.7cd 96.3 ± 2.6cd 24.9 ± 1.4cd 26.6 ± 1.6defg 43.2 ± 0.9b 46.1 ± 2.4ab YM : CH 96.0 ± 3.2b 95.3 ± 4.5def 32.7 ± 0.3b 30.4 ± 0.4defg 30.1 ± 0.7c 28.0 ± 0.8de MO : YM 80.0 ± 0.9de 78.4 ± 1.3fg 21.6 ± 0.2de 20.1 ± 0.3g 32.2 ± 1.7c 29.9 ± 1.0d MO : CH 58.6 ± 3.4g 62.8 ± 5.0g 20.3 ± 2.1e 20.5 ± 1.6g 21.6 ± 0.3d 21.3 ± 0.8ef MO : ST : YM 111.4 ± 3.5a 130.6 ± 3.2b 34.1 ± 0.9a 37.6 ± 0.6bcd 37.9 ± 2.6b 41.8 ± 3.8c MO : ST : CH 113.7 ± 0.6a 130.1 ± 4.7bc 40.7 ± 1.0a 42.4 ± 2.1bc 33.0 ± 0.6b 34.8 ± 1.6bc p value* < 0.00001 < 0.00001 < 0.00001 < 0.00001 < 0.00001 < 0.00001 * Mean value ± SD (three assays); a–f, means with different superscripts in columns are significantly different (for CL = 95%). Table 2.
Total phenolic content (PC), tannin content (TC), and flavonoids (FC) of blend and individual infusions.
-
Sample IC50 (µg/mL) FIC of a mixture Effect Infusion without MO ST 13.2 ± 0.2 − − YM 10.3 ± 0.1 − − CH 42.8 ± 0.8 − − ST : CH 16.1 ± 0.6 0.79 Synergistic ST : YM 8.1 ± 0.4 0.70 Synergistic YM : CH 14.2 ± 0.2 0.86 Synergistic Infusions with summer harvest MO MO 41.9 ± 1.6 − − MO : ST 13.3 ± 0.3 0.66 Synergistic MO : YM 11.4 ± 0.4 0.69 Synergistic MO : CH 49.9 ± 0.1 1.18 Antagonist MO : ST : YM 13.3 ± 0.3 0.87 Synergistic MO : ST : CH 19.1 ± 0.3 0.78 Synergistic Infusions with winter harvest MO MO 71.3 ± 2.6 − − MO : ST 36.1 ± 1.8 1.62 Antagonist MO : YM 15.4 ± 0.0 0.85 Synergistic MO : CH 78.9 ± 3.5 1.47 Antagonist MO : ST : YM 23.9 ± 0.8 1.48 Antagonist MO : ST : CH 25.6 ± 1.5 0.96 Additive * Mean value ± SD (assays in triplicate). Table 1.
In vitro DPPH• scavenging activity and interaction effect (FIC values) in the infusions.
-
Infusion Concentration (mg/200 mL) Stv RbA RbC SG ST 115.1 ± 10.5a 236.2 ± 21.6a 27.2 ± 2.5a 378.4 ± 34.7a ST : MO 62.7 ± 6.1bc 131.8 ± 12.9b 23.0 ± 2.3cd 217.6 ± 21.3bc ST : CH 50.2 ± 5.3b 90.9 ± 14.0bc 13.9 ± 2.0b 155.0 ± 15.8b ST : YM 64.4 ± 3.3bcd 132.1 ± 3.3bc 12.9 ± 0.3c 209.4 ± 5.2bc ST : MO : YM 32.4 ± 1.7cd 77.8 ± 4.0cd 5.3 ± 0.3d 126.5 ± 6.5cd ST : MO : CH 30.7 ± 1.1d 61.1 ± 3.2d 7.1 ± 0.2cd 108.8 ± 3.3d p value (CL = 95%) < 0.000001 < 0.000001 < 0.000001 < 0.000001 Values are expressed as mean ± standard deviation of three assays. Superscripts (a–d) represent statistically significant differences. Table 3.
Concentration of the main SG in infusions containing ST.
Figures
(2)
Tables
(3)