


-
The region known as the 'Triple Frontier' includes northeastern Argentina, southern Brazil, and southeastern Paraguay. It has a long-standing tradition of herbal infusion consumption, dating back to Jesuit times and the colonial period in the Americas[1,2]. Today, a wide variety of herbal infusion products are available in the region. While different formulations are believed to exert specific effects, most infusions are consumed for their stimulating, sedative, or digestive properties, or simply as part of local cultural practices.
The term yerba mate compuesta (composite yerba mate) refers to blends made from yerba mate combined with other plant materials[3,4]. Yerba mate té (YM) is prepared from heat-treated leaves of Ilex paraguariensis Saint Hilaire. It is one of the most widely consumed infusions in South America. YM contains bioactive alkaloids and phenolic compounds that support physiological functions. These compounds may also help protect against illnesses, including lifestyle-related diseases[4,5]. Blended YM products often include manzanilla flowers and moringa leaves, among others. However, the health benefits of YM infusions may be reduced when consumed with added sucrose. For this reason, stevia (ST) is often included in yerba mate compuesta either as a natural sweetener or to enhance its nutraceutical properties.
The Mercosur Technical Regulation governs the use of plants as food in Argentina, Brazil, Paraguay, Bolivia, Uruguay, Venezuela, and other associated South American countries. In 2012, it approved the use of Stevia rebaudiana Bertoni (stevia) as a natural sweetener. Like YM, ST originates from the Triple Frontier. The sweet taste of ST leaves derives from its steviol glycosides (SG), primarily stevioside (Stv), rebaudioside A (RbA), and rebaudioside C (RbC). SG had previously been approved in 2011 as a sweetening additive[3]. Over the past decade, the use of ST to sweeten herbal infusions has increased significantly in the region[6]. In addition to its sweet SG, ST contains bioactive phenolic compounds that may contribute health benefits to ST-based blends[7].
Matricaria chamomilla L. (syn. Chamomilla recutita), commonly known as manzanilla or German chamomile (CH), is native to Western Asia. Today, in Latin America, CH is widely consumed on its own, as part of yerba mate compuesta, or blended with other aromatic and medicinal herbs[3,8]. In folk medicine, CH is widely employed to treat a range of conditions, including infections and neuropsychiatric, respiratory, gastrointestinal, and liver disorders[9]. CH flower infusions are traditionally used as sedatives, antispasmodics, antiseptics, and antiemetics.
Moringa oleifera Lam. (moringa) was incorporated into the Mercosur Technical Regulation for use in infusions in 2016[3]. The moringa tree is widely cultivated in tropical and subtropical regions; however, its commercial cultivation in South America is relatively recent. Moringa is considered a rich source of readily available soluble carbohydrates and provides a desirable nutritional profile, including vitamins, minerals, amino acids, and fatty acids[10,11]. In addition, moringa leaves contain bioactive alkaloids and phenolic compounds. For moringa leaves (MO), the maximum recommended intake is 5 g per person per day[3].
The herbal materials used in blends are rich in phytochemicals and exhibit distinct bioactive properties and cultural relevance[12,13]. Combining herbs in a blend is also thought to enhance taste, aroma, and nutraceutical value[14−16]. Although many studies have examined the biological effects and sensory properties of herbal extracts, few have focused on stevia (ST) blends intended for infusion[1,17−19]. This study aimed to assess the impact of incorporating ST on the recovery of steviol glycosides (SG) and antioxidant compounds, as well as on the sensory acceptability of blended infusions sweetened with ST. MO blends from summer and winter harvests were used in a preliminary screening. A Simplex Centroid Design was used to develop formulations for infusions. The phytochemical composition of the resulting infusions was analyzed, with emphasis on phenolic compounds with antioxidant activity and SG as sweeteners. Sensory acceptability was evaluated by herbal infusion consumers, who rated aroma, taste, sweetness quality, and sweetness intensity in the ST based blends.
-
The solvents and reagents were purchased from various suppliers: DPPH• (2,2-diphenyl-1-picrylhydrazyl), GA (gallic acid), AlCl3, quercetin, and resveratrol were from Sigma–Aldrich (St. Louis, MO, USA). Folin–Ciocalteu reagent, PVPP (Poly[vinylpolypyrrolidone]), and potassium acetate were from Anedra (Tigre, Argentina). Ethanol and methanol were from Cicarelli (Reagents S.A., San Lorenzo, Argentina).
Solvents for high-performance liquid chromatography (acetic acid, acetonitrile, ethanol, and water) were from Merck (Darmstadt, Germany). Crystals of Stv (99.5% purity), RbA (99.9% purity), and RbC (99.9% purity) were obtained in-house (Project 16Q1204-IDP) from preparative column chromatography and successive recrystallizations[6]. The crystals were checked against the SG standard solution from Sigma–Aldrich USP (Steinheim, Germany). The water used for the infusions was purified using an ultrafiltration system (Romi100-Hidrolit, Buenos Aires, Argentina). Other chemicals were analytical grade.
Plant materials
-
Representative plant samples were obtained from local and regional producers. ST (500 g) was from Andersson S.A. (Leandro N. Alem, Argentina). YM (1,000 g) was purchased from La Cachuera (Posadas, Argentina). CH (200 g) was Productos Naturales Fátima (Fachinal, Argentina). Moringa Vida (Posadas, Argentina) provided 300–500 g of winter harvest MO and summer harvest MO. Plant samples separated from the twigs were ground in a grinding mill. YM, MO, and ST were then passed through a 20-mesh sieve. The samples were stored in the dark (at −20 °C) until use. The moisture content was determined by drying the samples (1–2 g) at 102 ± 2 °C to constant weight. Humidity ranged from 3.7% (YM) to 8.9% (CH).
Preparation of infusions
-
Herbal infusions for analytical purposes were prepared following a previously described procedure[1]: 2.0 g of the mixture were boiled with 200 mL of water for 5 min. The infusions were prepared following a Simplex Centroid Design Formulation.
The single-ingredient infusions studied were: ST, MO, YM, and CM. The two-component blends used in the infusions were: ST : MO, ST : YM, ST : MZ, MO : YM, MO : CH, and YM : CH. Each blend was prepared by mixing 1.0 g of each component. Three-component blends were also investigated: MO : ST : YM and MO : ST : CH, prepared by mixing 0.667 g of each component.
To investigate the effect of the MO harvest season on the recovery of bioactive phytochemicals, infusion blends were prepared using MO harvested in winter and summer.
Infusions were prepared in triplicate, quickly filtered, stored in the dark at 4 °C, and analyzed within 24 h. Total solids extracted (TSE) were measured by drying 10 mL of infusion at 102 ± 2 °C to constant weight on a tared steel plate. Results were expressed as mg TSE/infusion (i.e., mg TSE per 200 mL of infusion) and used for analytical purposes.
Infusions for sensory assays were prepared as described below.
HPLC quantification of steviol glycosides
-
The quantification of SG in ST leaves and herbal infusions was performed using high-performance liquid chromatography with a diode array detector (HPLC-DAD), applying the external standard method[6]. Analyses were carried out on a Prominence LC-20A chromatograph (Shimadzu Corporation, Kyoto, Japan). Stock solutions of the standard compounds (Stv, RbA, and RbC) were prepared in ethanol:water (70:30, w/w) at concentrations ranging from 0.15 to 1.2 g/L to establish the calibration curves. The operating conditions were as follows: an Agilent Zorbax NH2 column (25.0 cm × 0.46 cm; 5 µm particle size; Waters, Milford, MA, USA) was used; the UV detector was set at 210 nm; the mobile phase consisted of acetonitrile:water (80:20, v/v), with a pH of 5; and the analysis was performed at room temperature.
To determine SG content in ST leaves, extracts were prepared using an ethanol : water mixture (70:30, w/w), heated at 70 °C for 40 min, followed by sonication for 5 min. The resulting extracts were filtered using laboratory filter paper and prepared for HPLC analysis.
To analyze SG in ST-containing infusions, one volume of infusion was mixed with an equal volume of ethanol, centrifuged for 5 min, and the supernatant was used for analysis. Representative HPLC chromatograms of these infusions are shown in Supplementary Fig. S1.
Infusions' antioxidant properties
-
Convenient dilutions of infusions (2,000–15.6 µg/mL) were used for the screening of the in vitro antioxidant activity by using the DPPH• (1,1-Diphenyl-2-picrylhydrazyl) radical method[1]; 1,000 µL of a 0.3 mM DPPH• methanol solution was added to 50 µL solution of extract and allowed to react in the dark at room temperature for 30 min. The absorbance of the resulting mixture was measured at 515 nm and converted to percentage antioxidant activity (AA%), using the formula:
$ \mathrm{AA\text{%}=\left(\frac{Abs_{control}-Abs_{sample}}{Abs_{control}}\right)\times100\text{%}} $ (1) where, Abs = absorbance. Methanol (1,000 µL) with DPPH• solutions (50 µL) was used as a control. Resveratrol (final concentrations 95.2–2.5 µg/mL) was used as a positive control.
The IC50 values (μg/mL) are the concentration of extract that reduced 50% of the free-radical concentration. The IC50 values were calculated by regression from the percentages of inhibition. The assay was carried out in triplicate for each infusion and for resveratrol.
Bioactivity of infusion mixtures
-
Apparent fractional inhibitory concentrations (FIC indices) were calculated to evaluate the activities of mixtures, following the method described by Celaya et al.[13]:
$ \mathrm{\mathrm{FIC_{S T}=\dfrac{IC_{50}\; of\; S T\; in\; a\; blend}{IC_{50}\; of\; S T\; individually}}} $ (2) $ \mathrm{FIC_{Y M}=\dfrac{IC_{50}\; of\; Y M\; in\; a\; blend}{IC_{50}\; of\; Y M\; individually}} $ (3) $ \mathrm{FIC_{CH}=\dfrac{IC_{50}\; of\; CH\; in\; a\; blend}{IC_{50}\; of\; CH\; individually}} $ (4) $ \mathrm{FIC_{MO}=\frac{IC_{50}\; of\; MO\; in\; a\; blend}{IC_{50}\; of\; MO\; individually}} $ (5) Here, IC50 values in blends were calculated based on the proportion of each plant material in the blend for an infusion. The data from binary blends in the infusions were transformed into the FIC of a mixture as follows:
$ \mathrm{FIC_{S T:Y M}=FIC_{S T}+FIC_{Y M}} $ (6) $ \mathrm{FIC_{S T:CH}=FIC_{S T}+FIC_{CH}} $ (7) $ \mathrm{FIC_{S T:MO}=FIC_{S T}+FIC_{MO}} $ (8) $ \mathrm{FIC_{Y M:CH}=FIC_{Y M}+FIC_{CH}} $ (9) $ \mathrm{FIC_{MO:YM}=FIC_{MO}+FIC_{YM}} $ (10) $ \mathrm{FIC_{MO:CH}=FIC_{MO}+FIC_{CH}\mathrm{ }} $ (11) Data from ternary ST blends in the infusions were transformed into an FIC mixture as follows:
$ \mathrm{FIC_{MO:ST:YM}=FIC_{MO}+FIC_{ST}+FIC_{YM}} $ (12) $ \mathrm{FIC_{MO:ST:CH}=FIC_{MO}+FIC_{ST}+FIC_{CH}} $ (13) The calculation provides apparent FIC values based on the proportion of each plant material in the infusion blend to estimate synergy, additivity, or antagonism in the infusion of a blend.
Phenolic content of the infusions
-
Total phenolic compounds (PC) were assessed by using the Folin–Ciocaulteau reagent[20]. Each infusion was diluted to 2 mg/mL (2 mg of TSE per mL). Reaction mixtures were prepared by mixing 25 µL of infusion with Folin–Ciocalteu reagent (25 µL) and 950 µL of NaHCO3 (0.15%). Mixtures were incubated in the dark at room temperature for 60 min. Absorbance was measured at 750 nm by using a spectrophotometer UV-VIS PROVE (Shimadzu Corporation, Kyoto, Japan). Analyses were carried out in triplicate, and the results were calculated from a calibration curve of gallic acid standard solutions. The obtained PC values were expressed as mg of gallic acid equivalent per gram of dry extract (mg GAE/g DE), and as mg of gallic acid equivalent per 200 mL of infusion (mg GAE/200 mL).
Tannin content in the infusions
-
Tannin content (TC) was analyzed following the procedure described by Cruz et al.[20]. Ten gram of polyvinyl pyrrolidone (PVPP) were mixed with 100 mL of deionized water; 500 µL of this binder solution was added to 1,000 µL of PC reaction mixture. Test tubes were vortexed for 2 min and kept at 4 °C for 15 min. Test tubes were centrifuged at 2,000 rpm (112 G-force) for 5 min, and then the supernatant was finally collected. Absorbance was measured at 750 nm. Non-tannin compounds in the supernatant were calculated according to the Folin–Ciocaulteau method. The amount of TC was calculated by subtracting the amount of non-tannins from the amount of PC.
Flavonoid contents
-
The total flavonoid contents (FC) of the infusions (at 2.0 mg/mL) were determined by the aluminium chloride colorimetric method[20]. For the calibration curve, stock solutions of quercetin in methanol (initial concentration 250 µg/mL) in a dilution series were prepared. For the assay, 200 µL of extract was pipetted out in a test tube to which was added 400 µL of methanol, 40 µL of 5% AlCl3, 20 µL of 1 M potassium acetate aqueous solution, and 440 µL of distilled water. Mixtures were incubated in the dark at room temperature for 30 min. Absorbance was measured at 415 nm. Analyses were carried out in triplicate, and the results were calculated from a calibration curve of quercetin standard solutions. The obtained FC values were expressed as mg of quercetin equivalent/g dry extract (mg QE/g DE), and as mg of quercetin equivalent per 200 mL of infusion (mg QE/200 mL).
Sensory evaluation of infusions
-
Sensory evaluation of ST-blend infusions was conducted at ambient temperature in various locations throughout the city of Posadas, Argentina. The evaluation took place at the following venues: the 5th and 7th Kermés Científica (National Science Week), the 5th Feria Nacional de Emprendedores Verdes, the 4th Simposio Municipal de Investigación, Extensión y Desarrollo Local, and the School of Exact, Chemical, and Life Sciences at the National University of Misiones.
Infusion preparation
-
Unlike other studies comparing infusion and decoction[21,22], preliminary trials showed no differences in TSE, PC, IC50, or SG. These results were consistent for infusion prepared with 5-minute extraction times. Therefore, all ST-containing infusions used for sensory evaluation were prepared following the same proportion scheme as those used for analytical purposes: 10.00 g for single-component infusions; 5.00 g of each herb for two-component blends; and 3.333 g of each herb for three-component blends, resulting in a total of 10.00 g of herbal material per liter in all cases.
Participants' characteristics
-
A total of 350 participants who consumed herbal infusions at least two to three times per month completed the study. All participants reported being regular consumers of YM infusions. Infusion samples were evaluated using a sensory evaluation form. Participants were categorized into three age groups: 12–18 years (9.0%), 18–50 years (82.0%), and over 50 years (9.0%). The sample comprised 60.3% female and 39.7% male participants. Regarding sweetening habits, the majority reported consuming sugar (44.9%), while a smaller proportion used sweeteners (9.2%). Many participants reported using both sugar and sweeteners (39.6%), and a minority (6.6%) consumed neither. Lastly, 42.9% reported consuming ST.
Sensory analysis
-
Samples (40–50 mL) were served in 120 mL EPS thermal cups. The infusion samples were served at approximately 50–55 °C at the time of tasting. For each assessed herbal tea blend, 70–73 regular consumers have participated. Before starting the evaluation, consumers were given verbal instructions about the tasting testing procedure and the sensory evaluation form[23]. Consumers were asked to rate aroma, flavor, and sweetness quality on a structured hedonic scale of nine points, ranging from 'dislike extremely' to 'like extremely'. An additional quantification of sweetness intensity was included with a quantitative scale of nine points from 'it is not sweet' (1) to 'it's too sweet' (9). Additionally, consumers completed a survey about their consumption of ST, SG, and other sweeteners. They also provided information on sex, age group, and infusion consumption habits.
Experimental design and data analysis
-
Statistical analyses were performed using RStudio, version 4.4.0 (The R Foundation for Statistical Computing). The mixture design results were analyzed by using Statgraphics Centurion XVIII software (Manugistics, Rockville, MD, USA, trial version).
All phytochemical and biological data were quantified in triplicate. The data are expressed as the mean ± standard deviation. The statistical differences of the data were determined by applying analysis of variance (ANOVA) to estimate any statistically significant difference at a confidence level of 95% (p < 0.05). The post-hoc Tukey test was used to determine possible homogeneous groups. Results obtained with PC (mg/infusion), TC (mg/infusion), FC (mg/infusion), SG (mg/infusion), and antioxidant activity (IC50, µg/mL) were correlated with Pearson's correlation coefficient, using RStudio (Supplementary Table S1).
The effects of infusion mixtures containing different amounts of plant materials were analyzed following a mixture design (a Simplex Centroid Design Formulation), by running seven experiments with two replicates of each experimental design: MO + ST + YM and MO + ST + CH.
Established models were used to find the optimal mixture compositions with desirable responses (i.e., maximum PC content and lowest IC50) by using the 'Response Optimizer' software (evaluated with Statgraphics Centurion XVIII statistical package) (Supplementary Fig. S2).
Only ST-containing infusions were sensorially characterized. Affective tests were conducted to evaluate aroma and flavor quality, sweetness quality, and sweetness intensity. Despite the high dispersion of the scores assigned to the sensory attributes, the results obtained showed a normal distribution. This was confirmed with the Shapiro-Wilk test and Q-Q plots[23]. For this reason, the experimental scores given to the samples in the sensory analysis were subjected to a three-way ANOVA and post-hoc Tukey test to assess statistically significant differences between the mean values (at p < 0.05, CL 95%). The factors included in the three-way ANOVA were: blend in the infusion, sex of evaluators (Female, Male, Other), and ST consumption (ST consumers, non-ST consumers).
-
Considering that MO cultivation is relatively recent in northeastern Argentina, preliminarily, the influence of the harvest season was investigated on TSE (total solids content extracted), and DPPH• scavenging activity (IC50) in MO infusions. Two MO samples were studied: summer harvest MO and winter harvest MO. The results are presented in Fig. 1a, b. As can be seen, the recovery of total solids TSE in the infusions shows high variability and a marked effect of the blend and the harvest season of the plant material (Fig. 1a). The same was observed in the scavenging activity of the assessed infusions (Fig. 1b).
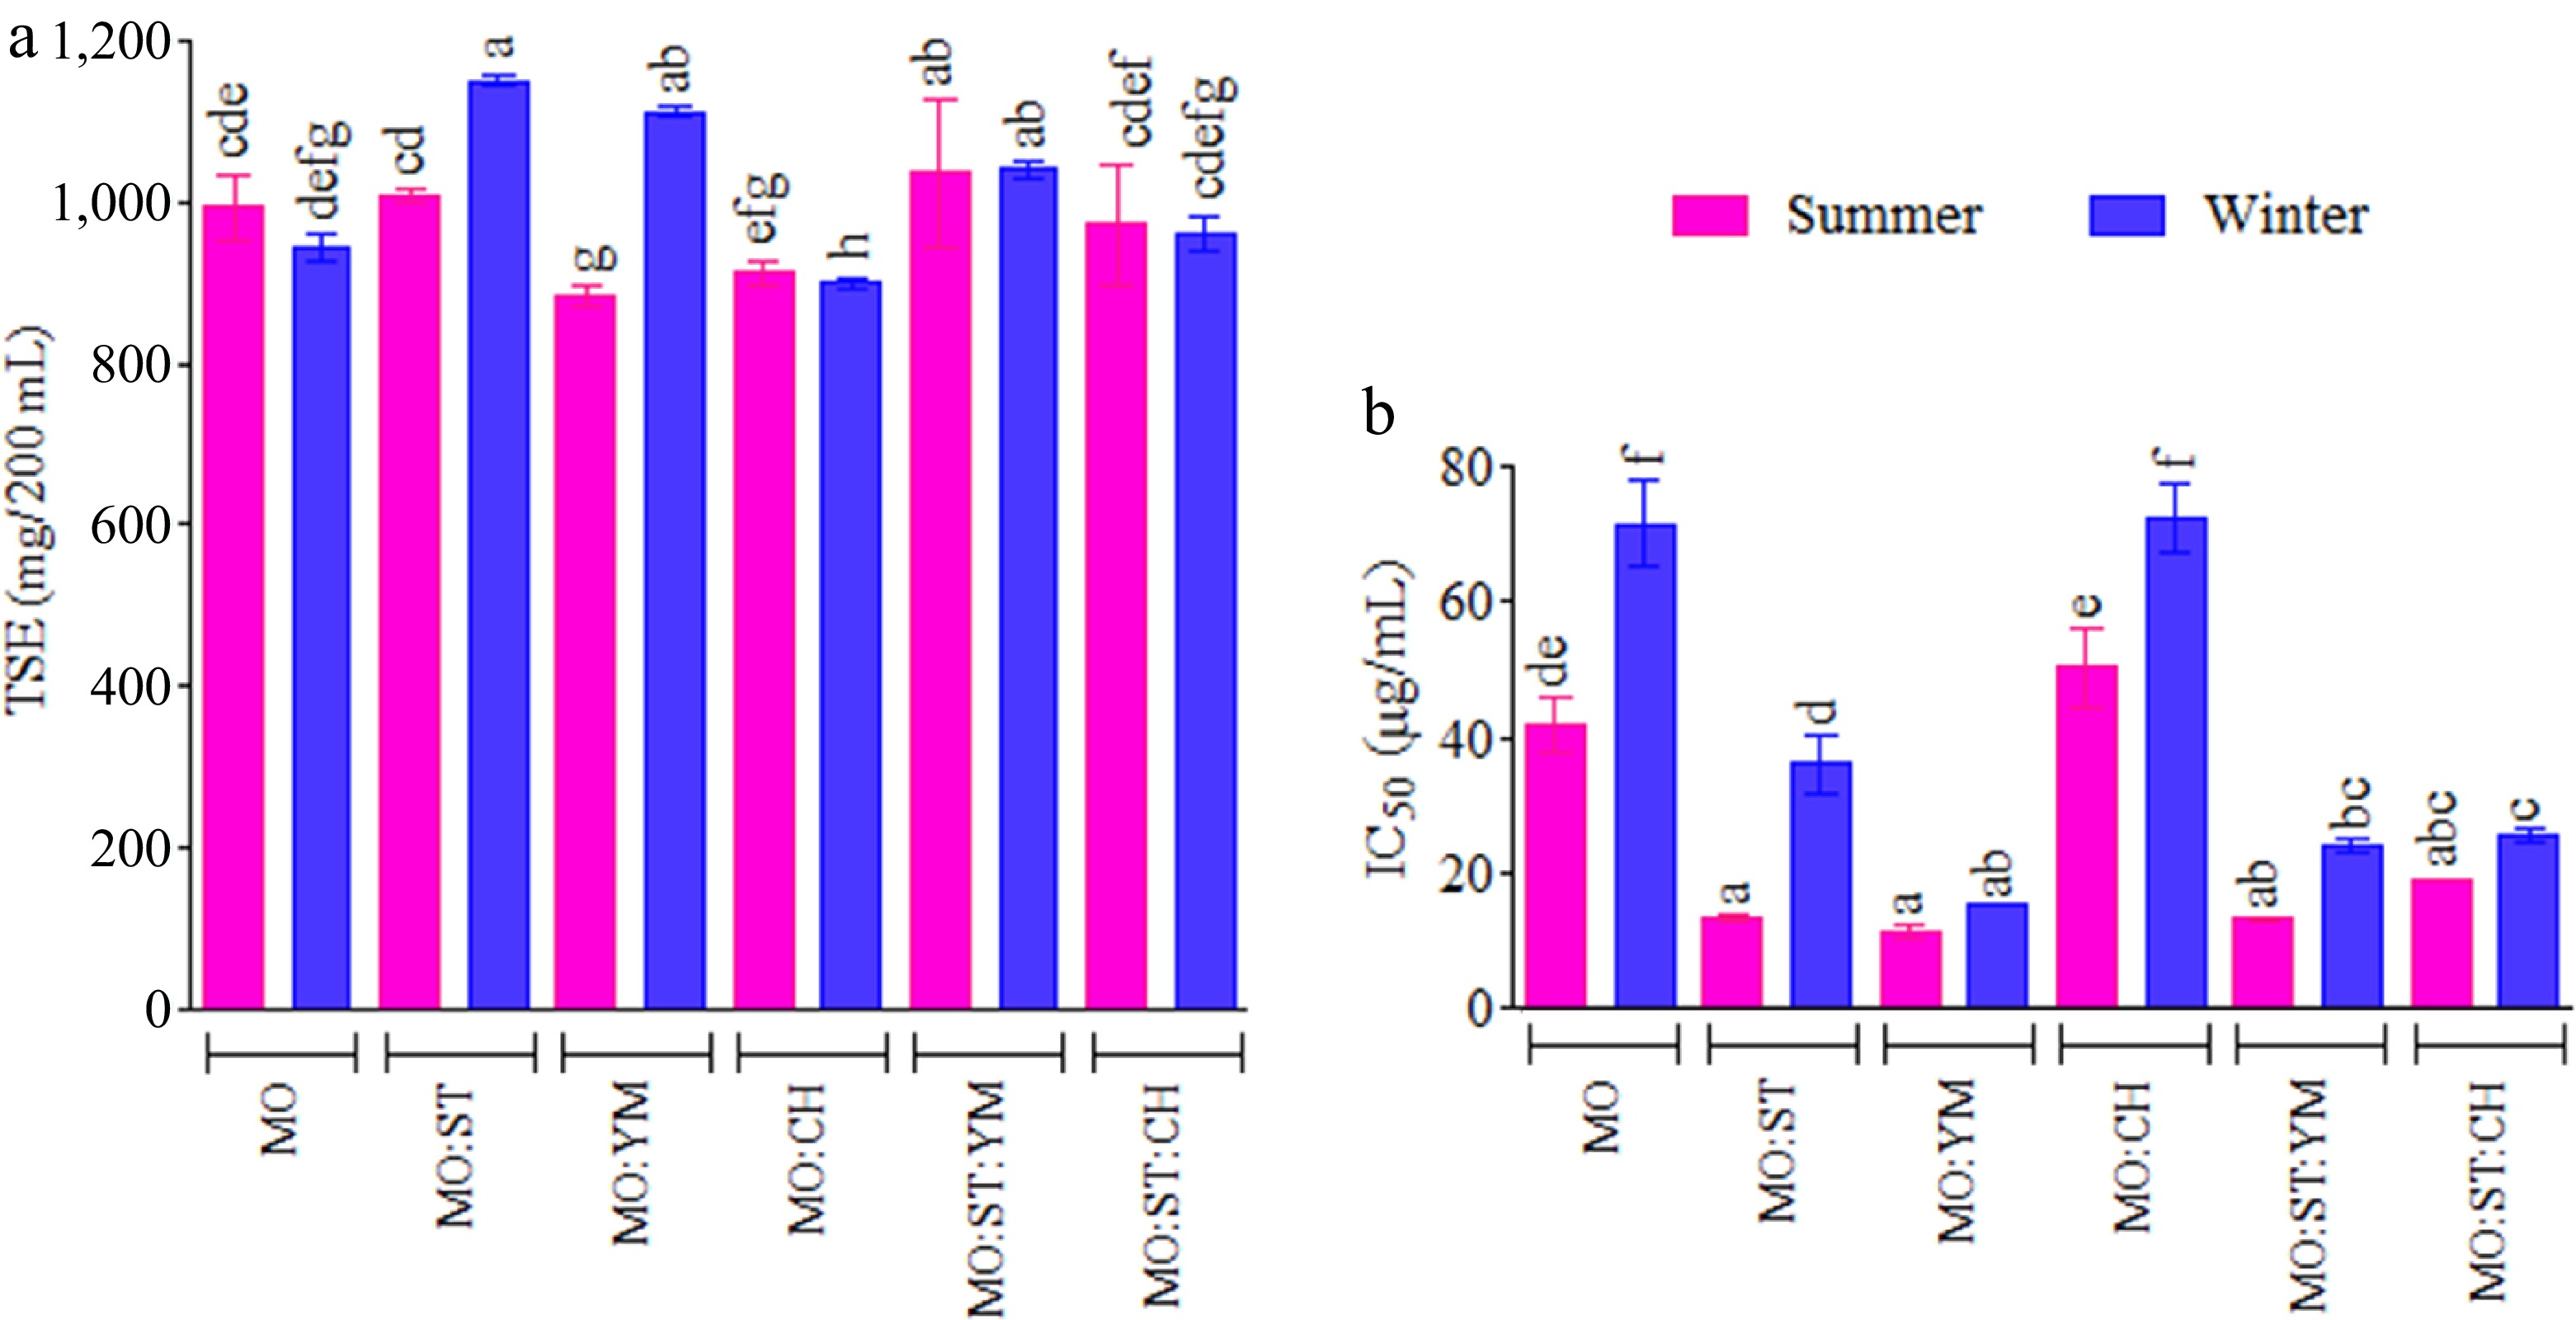
Figure 1.
(a) Total solids extracted (TSE), and (b) scavenging activity (IC50) against DPPH• radical of infusions as a function of the harvest season and the MO blend. Infusions with different letters on top indicate statistically significant differences for the Tukey test (95% CL)
Previously, Celaya et al.[1] found that TSE increased proportionally with ST content in the infusion. Here, TSE varied from 882.7 to 1150.0 mg/infusion, from summer-harvested MO : YM to winter-harvested MO : ST, respectively. The data were statistically analyzed using a two-way ANOVA (with a 95% confidence level, CL). Statistical influences were observed for harvest season (p < 0.0001), blend (p < 0.0001), and the interaction harvest season × blend (p < 0.0001). ST and YM showed TSE values within the same ranges observed in previous research[1].
Regarding the antioxidant activity (Fig. 1b), statistical influences were observed for harvest season (p < 0.0001), blend (p < 0.0001), and the interaction between factors (harvest season × blend, p < 0.0001). All infusions tested possessed promising antioxidant action as antiradical beverages, IC50 < 100 µg/mL (Table 1). IC50 values ranged from 8.1 µg/mL (ST : YM) to 78.9 µg/mL (MO : CH). Resveratrol used as a control shows an IC50 of 12.4 ± 2.5 µg/mL. Summer was identified as the most suitable time for harvesting MO with relatively higher antiradical activity. This finding aligns with the previous evaluation of the harvest season but contrasts with the results reported by Shih et al. who investigated the antioxidant activity of MO harvested in winter and summer in Taiwan[24,25].
Table 2. Total phenolic content (PC), tannin content (TC), and flavonoids (FC) of blend and individual infusions.
Infusion PC, gallic acid equivalent (GAE) TC, gallic acid equivalent (GAE) FC, quercetin equivalent (QE) mg/g DE mg/200 mL mg/g DE mg/200 mL mg/g DE mg/200 mL ST 118.6 ± 11.9a 179.6 ± 15.7a 39.6 ± 0.4a 55.3 ± 5.9a 37.9 ± 1.5b 52.9 ± 5.3a MO 73.6 ± 2.3ef 83.6 ± 5.7ef 32.1 ± 3.9ef 34.3 ± 6.3bcde 29.1 ± 1.2c 30.9 ± 2.8d YM 112.7 ± 7.1a 106.1 ± 5.7cd 48.6 ± 7.0 a 44.2 ± 7.4ab 43.6 ± 0.6a 39.6 ± 1.8bc CH 67.0 ± 0.5fg 64.6 ± 0.7g 28.2 ± 3.8fg 24.8 ± 3.1efg 18.1 ± 0.4d 15.9 ± 0.1f ST : MO 89.7 ± 1.6bc 104.9 ± 0.7d 29.8 ± 2.1bc 32.4 ± 2.4bcde 36.7 ± 0.7b 39.8 ± 0.3bc ST : YM 113.3 ± 2.8a 127.8 ± 6.5b 21.0 ± 2.0a 22.3 ± 2.6fg 38.2 ± 0.5a 40.6 ± 2.4bc ST : CH 82.7 ± 0.7cd 96.3 ± 2.6cd 24.9 ± 1.4cd 26.6 ± 1.6defg 43.2 ± 0.9b 46.1 ± 2.4ab YM : CH 96.0 ± 3.2b 95.3 ± 4.5def 32.7 ± 0.3b 30.4 ± 0.4defg 30.1 ± 0.7c 28.0 ± 0.8de MO : YM 80.0 ± 0.9de 78.4 ± 1.3fg 21.6 ± 0.2de 20.1 ± 0.3g 32.2 ± 1.7c 29.9 ± 1.0d MO : CH 58.6 ± 3.4g 62.8 ± 5.0g 20.3 ± 2.1e 20.5 ± 1.6g 21.6 ± 0.3d 21.3 ± 0.8ef MO : ST : YM 111.4 ± 3.5a 130.6 ± 3.2b 34.1 ± 0.9a 37.6 ± 0.6bcd 37.9 ± 2.6b 41.8 ± 3.8c MO : ST : CH 113.7 ± 0.6a 130.1 ± 4.7bc 40.7 ± 1.0a 42.4 ± 2.1bc 33.0 ± 0.6b 34.8 ± 1.6bc p value* < 0.00001 < 0.00001 < 0.00001 < 0.00001 < 0.00001 < 0.00001 * Mean value ± SD (three assays); a–f, means with different superscripts in columns are significantly different (for CL = 95%). Additionally, the IC50 values of MO infusions from northeastern Argentina were more active compared to those reported by Shih et al., who obtained IC50 values of 378 and 200 µg/mL for methanolic extracts of summer and winter-harvested MO. The differences in results support the observation that aqueous extracts from plant materials generally exhibit higher antioxidant activity compared to methanol or ethanol extracts[20,26].
Interactions between phytochemicals can be classified as synergistic, additive, indifferent, or antagonistic[13]. In blended infusions, interactions between the components can be challenging to establish due to limited knowledge of their behavior during infusion preparation[1]. Apparent FIC indices, calculated from IC50 data, were used to assess interactions between components in a blended infusion. The FIC values are presented in Table 1. A blend in an infusion was considered synergistic when FIC < 0.90, additive or indifferent for 0.90 < FIC < 1.10, and antagonistic for FIC > 1.10.
Table 1. In vitro DPPH• scavenging activity and interaction effect (FIC values) in the infusions.
Sample IC50 (µg/mL) FIC of a mixture Effect Infusion without MO ST 13.2 ± 0.2 − − YM 10.3 ± 0.1 − − CH 42.8 ± 0.8 − − ST : CH 16.1 ± 0.6 0.79 Synergistic ST : YM 8.1 ± 0.4 0.70 Synergistic YM : CH 14.2 ± 0.2 0.86 Synergistic Infusions with summer harvest MO MO 41.9 ± 1.6 − − MO : ST 13.3 ± 0.3 0.66 Synergistic MO : YM 11.4 ± 0.4 0.69 Synergistic MO : CH 49.9 ± 0.1 1.18 Antagonist MO : ST : YM 13.3 ± 0.3 0.87 Synergistic MO : ST : CH 19.1 ± 0.3 0.78 Synergistic Infusions with winter harvest MO MO 71.3 ± 2.6 − − MO : ST 36.1 ± 1.8 1.62 Antagonist MO : YM 15.4 ± 0.0 0.85 Synergistic MO : CH 78.9 ± 3.5 1.47 Antagonist MO : ST : YM 23.9 ± 0.8 1.48 Antagonist MO : ST : CH 25.6 ± 1.5 0.96 Additive * Mean value ± SD (assays in triplicate). Based on the FIC values (Table 1), blends containing MO harvested in summer, YM, and ST exhibited a synergistic effect on antioxidant activity. The infusion MO : ST and MO : YM showed the best performance as antioxidants in vitro; FIC were 0.66 and 0.69. The results differ from those previously obtained for ST : YM infusions with a scavenging activity, IC50 = 26.2 µg/mL[1].
Phenolic compounds, tannins, and flavonoid contents in the infusions
-
The phenolic compound (PC) contents, determined using the Folin–Ciocalteu method, are presented in Table 2. The tested infusions exhibited substantial variability, with PC values ranging from 58.6 to 118.6 mg GAE/g for MO : CH and ST, respectively. These values are consistent with those previously reported for YM and ST infusions prepared from similar plant materials (i.e., different cultivars or varieties) and from the same geographical region[1]. Previously, ST : YM infusion (1:1) showed lower PC content (61.6 mg GAE/g), and reduced scavenging activity (IC50 = 26.2 µg/mL).
PC levels observed here are in agreement with those reported for MO, CH, and YM infusions[16,25,27].
In contrast, for ST and ST : CH (1:1) infusions, PC ranged from 17.5–21.0 mg and 6.1–6.3 mg GAE/g (dry material), differing from previously reported values[19].
TC results, shown in Table 2, indicate considerable variability among the tested infusions. TC values ranged from 20.3 to 48.6 mg GAE/g. Most blends showed reduced TC compared to individual herbs (Table 2). The lowest values were found in MO : CH and MO : YM infusions, while the highest was observed in the YM infusion.
ST : CH and ST : YM mixtures also showed unexpectedly low TC, suggesting possible antagonism during infusion. Overall, these findings are consistent with previous reports[1,28]. Notably, the MO : ST : CH infusion had a higher tannin content than the other blends.
Flavonoid compounds were also evaluated in both single-plant and blended infusions. Flavonoid content (FC) varied widely, ranging from 18.1 mg QE/g in CH to 43.6 mg QE/g in YM (Table 2).
Steviol glycosides assessed in the stevia infusions
-
The ST leaves used in this study contained the following steviol glycosides (SG) in dry weight (%): RbA = 10.6 ± 1.1; Stv = 5.6 ± 0.6; and RbC = 1.1 ± 0.1, with a total SG content of 18.4% ± 1.7%. This SG profile is typical of stevia crops cultivated in Northeastern Argentina and harvested at the early flowering stage. SG concentrations in ST infusions were quantified and are presented in Table 3. The results are consistent with those previously reported[7]. In addition, the increase in SG content with higher proportions of ST in the blends followed the expected behavior.
Table 3. Concentration of the main SG in infusions containing ST.
Infusion Concentration (mg/200 mL) Stv RbA RbC SG ST 115.1 ± 10.5a 236.2 ± 21.6a 27.2 ± 2.5a 378.4 ± 34.7a ST : MO 62.7 ± 6.1bc 131.8 ± 12.9b 23.0 ± 2.3cd 217.6 ± 21.3bc ST : CH 50.2 ± 5.3b 90.9 ± 14.0bc 13.9 ± 2.0b 155.0 ± 15.8b ST : YM 64.4 ± 3.3bcd 132.1 ± 3.3bc 12.9 ± 0.3c 209.4 ± 5.2bc ST : MO : YM 32.4 ± 1.7cd 77.8 ± 4.0cd 5.3 ± 0.3d 126.5 ± 6.5cd ST : MO : CH 30.7 ± 1.1d 61.1 ± 3.2d 7.1 ± 0.2cd 108.8 ± 3.3d p value (CL = 95%) < 0.000001 < 0.000001 < 0.000001 < 0.000001 Values are expressed as mean ± standard deviation of three assays. Superscripts (a–d) represent statistically significant differences. Sensory acceptability of the infusions' sweetness with stevia
-
Consumers of herbal infusions evaluated the aroma, flavor, and sweetness quality of ST-containing infusions. These descriptors were rated using a structured 9-point hedonic scale. Differences between the mean and median values were observed for the sensory descriptors. Mean aroma scores ranged from 6.6 to 6.9. No statistically significant differences were found for aroma ratings (p > 0.05). However, significant differences were observed in flavor, sweetness quality, and sweetness intensity (Fig. 2a–c). Mean flavor scores ranged from 6.5 to 7.2. Flavor ratings (Fig. 2a) showed significant differences only based on the sex of the consumers (p = 0.0193).
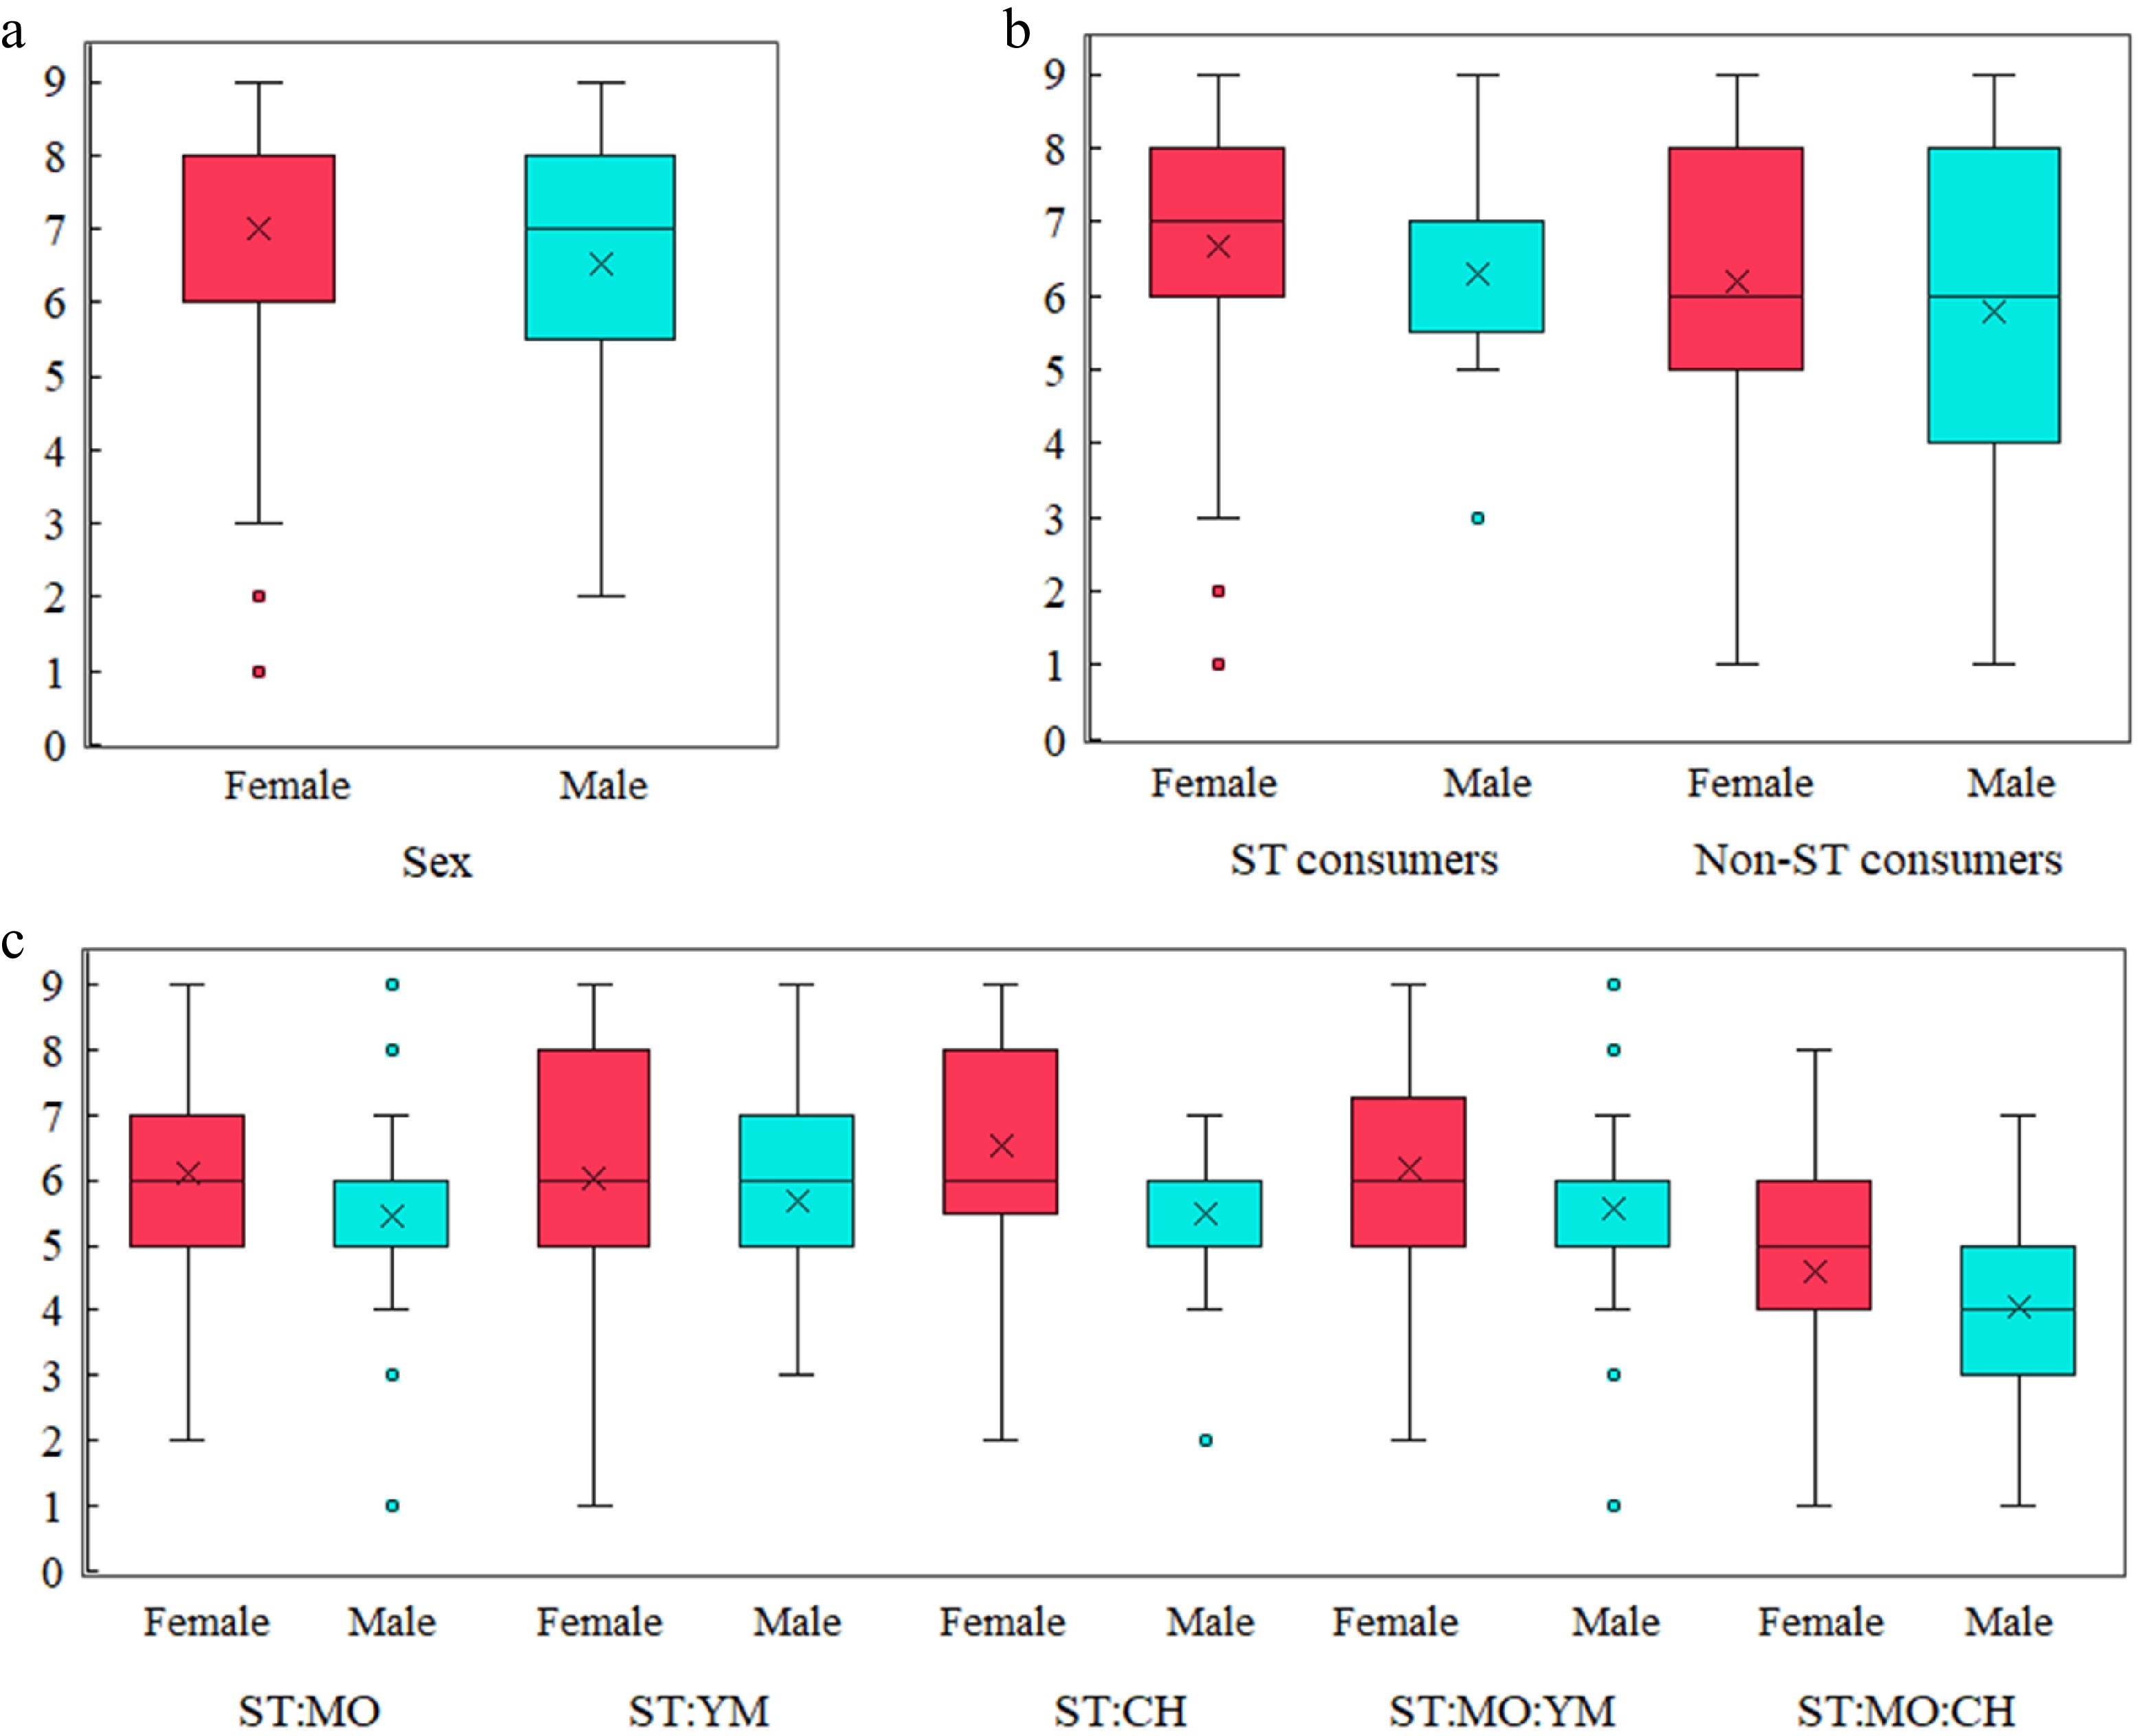
Figure 2.
Sensory evaluation scores of stevia-based herbal infusions. (a) Flavor quality scores by sex. (b) Sweetness quality scores by sex and stevia consumption habits. (c) Sweetness intensity scores across different infusion blends and sex.
More pronounced differences were found in sweetness quality and sweetness intensity. Mean scores ranged from 6.0 to 6.7 for sweetness quality. These scores (Fig. 2b) differed based on sex (p = 0.0280) and between regular ST consumers and non-consumers (p = 0.0329). Participants evaluated sweetness intensity using a 9-point quantitative scale, with ratings between 4.4 and 6.1. Sweetness intensity (Fig. 2c) was strongly influenced by the blend composition (p < 0.0001) and sex (p = 0.0006).
In all cases, no statistically significant interactions were found between the analyzed factors (blend, sex, and ST consumption; p > 0.05; 95% CL). These findings are consistent with previous studies that reported differences in sensory perception between male and female participants, without interaction effects with other variables in acceptability trials of foods containing SG[29]. Here, the scores given to the infusions seem to be more influenced by complex interactions between components than by consumers' familiarity with any component or the proportion of ST in the blend (Fig. 2b, c). Moreover, an ST concentration between 0.667 and 1.0 g per infusion was considered acceptable by consumers. Interestingly, the ST : MO : CH blend, which showed the most distinct sweetness intensity, has a tannin concentration that exceeds that of its individual components (Table 2).
Desirable conditions for high phytochemical values
-
According to previous studies, a strong correlation has been reported between SG and PC levels in ST infusions [7]. In the present study, the blended infusions showed distinct patterns in TSE and PC content. A different relationship was also observed between IC50 values and PC content in the blended infusions (Table 3, Fig. 1, Supplementary Fig. S2).
Supplementary Fig. S2 presents graphical representations of the variations in antiradical activity, IC50, and phenolic compound values (PC) assessed in the blend infusions (Supplemental Fig. S2c, S2d). These representations were derived from the analysis of MO + ST + YM and MO + ST + CH blend data, following the Simplex Centroid Design. The black rhombuses represent the predicted optimal condition for each mixture.
The IC50 values and the phytochemical concentrations (SG, PC, TC, FC, TSE) were analyzed to explore potential correlations between antioxidant activity and the phytochemical groups. Pearson correlation coefficients are listed in Supplementary Table S1. Positive values indicate a direct correlation[30]. Lower IC50 values indicate stronger antioxidant activity. Therefore, the negative correlations with SG, PC, TC, FC, and TSE suggest that higher concentrations of these compounds are associated with increased antioxidant potential. In general, increases in SG and RbA were associated with proportional increases in PC or FC content (r > 0.80). A strong correlation was also found between PC, FC, and TSE (r > 0.75). Furthermore, flavonoid content (FC) showed a negative correlation with IC50 (r = –0.69), suggesting that flavonoids present in the blend infusions contribute significantly to the overall antioxidant capacity.
-
The findings of the present study highlight that there is no universal pattern describing the behavior of blended plant materials in infusions. This variability may be attributed to several factors, including agro-ecological and climatic conditions, cultivation practices, genotype, ecotype, harvest time, post-harvest treatments, and the extraction method employed during infusion preparation[1,7,24].
ST and YM showed TSE values within ranges previously reported[1]. SG results are consistent with earlier findings. The recovery of SG in infusions generally exceeds 90% of the original sweetener content in ST leaves[1,7], and a proportional increase in SG content was observed with increasing ST content and TSE levels in the infusions. It is worth noting that infusions containing MO exhibited notably high TSE values. These results are in line with the traditional use of MO as a food source in developing countries[10].
The DPPH• method can evaluate the ability of bioactive extracts to neutralize oxidative damage by scavenging free radicals[31]. The DPPH• scavenging capacity is a good indicator of the biological potential of plant extracts. An IC50 value below 100 µg/mL is considered indicative of high DPPH• radical scavenging activity[13]. According to the results obtained, all individual and blended infusions proved to be valuable sources of bioactive phenolic compounds. Additionally, several blends showed IC50 values comparable to those of resveratrol, which was used as a control. Furthermore, the origin of the plant material significantly affects the biological behavior of the blends. Three blended infusions with MO harvested in winter displayed antagonistic biological activity (apparent FIC ˃ 1.1). MO:CH infusions, from both winter and summer, showed antagonistic action.
Looking at the variability in the phytochemical data, it can be seen that there is no general rule describing the behavior of blended plant materials in the infusion (Tables 1 & 2). This reinforces the notion that multiple factors influence phenolic compound recovery and their associated antioxidant activity. The complexity of phytochemical profiles in blended infusions is influenced not only by the quantity of compounds present but also by their structural characteristics and interactions. Therefore, further phytochemical investigations and the identification of bioactive molecule interactions are needed to better understand how these interactions contribute to the observed biological activities.
In herbal extracts, phenolic compounds (PC) are a chemically diverse group that includes flavonoids, phenolic acids, and tannins[13]. Tannins are polyphenolic compounds with high antioxidant potential, contributing to astringency, taste, and color in herbal beverages[32]. The tannin levels observed in the present study are consistent with previous research on herbal blends[1]. Tannins and other complex polyphenols can strongly affect the sensory acceptability of blended infusions. The variability in TC determined here highlights the complexity of interactions between components during infusion preparation.
Flavonoids are widespread polyphenolic compounds found in plant-based beverages and are known for their antioxidant and astringent properties[19]. The species analyzed in this study are valuable sources of flavonoids with proven antioxidant activity and nutraceutical potential. Key compounds include quercetin, apigenin, kaempferol, and their glycosylated derivatives, previously reported in MO, CH, and ST[11,33,34]. Additionally, quercetin and its glycosylated forms have also been identified in YM[12]. YM and MO were found to be particularly rich in chlorogenic acid and its derivatives, which, although not quantified in the present study, are well known for their health-promoting effects. In addition, YM and MO are recognized to contain bioactive alkaloids such as caffeine, theobromine, and gentiatibetine, which may contribute to their physiological effects.
In a previous study, Tavarini et al. found a correlation between antioxidant activity and both PC and FC in ST extracts[35]. In contrast, the same study reported a low correlation between antioxidant activity and the content of Stv and RbA. In the present study, similar variability in PC levels was observed alongside wide variations in TC and FC across both single-plant and blended infusions (Table 2). However, this behavior was not reflected in the correlation analysis results. Additionally, considering the correlation analysis of phytochemical groups, an increase in PC content does not necessarily lead to stronger antiradical activity. On the other hand, FC showed a strong correlation with antioxidant activity, suggesting that the flavonoids present in blended infusions contribute effectively to the overall antioxidant potential.
The findings support existing evidence that higher phenolic compound (PC) levels do not always result in enhanced antioxidant activity[13,20]. Moreover, from a nutritional and physiological perspective, in vitro assay results do not necessarily correlate with the biological effects observed in vivo[13]. Therefore, further studies are needed to evaluate the bioavailability and in vivo biological activity of ST blend infusions under conditions that reflect real-life consumption.
Herbal infusions are chemically complex, containing variable amounts of phenolic and volatile compounds, carbohydrates, alkaloids, proteins, minerals, trace elements, and other partially identified constituents[1,7,12,15,36,37]. This complexity is reflected in the sensory perception of the blended infusions. Furthermore, ST and its SG can influence the overall sensory acceptability of the infusion. In this sense, the evaluation of hedonic scores for the infusions can help guide manufacturers in developing beverages more likely to be accepted by the market[32].
In herbal preparations, astringency is typically associated with tannins and alkaloids. Both bitterness and astringency may be linked to flavonoids and phenolic acids. Tannins in the blends can interact in different ways with sugars, acids, and other compounds, thereby influencing flavor perception and contributing to differences in sensory ratings[32,36]. Sensory differences in aroma, flavor, and sweetness acceptability reflect the chemical diversity of the formulations (Fig. 2).
Sweetness may be primarily attributed to SG and some amino acids. Interactions between SG and chemical constituents, and between amino acids and chemical constituents, can modulate the sweetness perception[38]. As a result, sweetness intensity can vary considerably among participants. Moreover, perceived sweetness intensity differed from previous theoretical estimations of the sweetening power of ST in infusions[7].
In the sensory evaluation forms, 12.3% of male panelists reported regular consumption of ST or its SG. In contrast, 30.6% of female panelists reported regular use of these sweeteners. Among the evaluated variables, only the sex of the participants significantly influenced flavor scores (Fig. 2a). However, sweetness quality scores differed between regular ST consumers and non-consumers (Fig. 2b). Relative sweetness intensity also varied across participants (Fig. 2c), possibly due to the complexity of the herbal blends used in the infusions. The reasons behind these differences are not entirely clear. It is well documented that women are more likely to consume herbal preparations, often sweetened with low-calorie sweeteners. In contrast, men tend to prefer traditional mate tea, typically consumed without blend or sweeteners[39].
-
This study explored the potential of blended herbal infusions commonly consumed in South America as sources of phenolic compounds and natural sweeteners, alongside their sensory acceptability. Summer was identified as the optimal harvest season for MO leaves. Overall, the blended infusions proved to be valuable sources of bioactive compounds with high antioxidant capacity. They also showed strong sensory acceptability. Differences in sensory perception were mainly associated with consumer sex and ST consumption habits. The results suggest that the biological potential of blended infusions is influenced by various factors, such as the combination of plant materials and their relative proportions. Future studies should clarify the nature of synergistic interactions among plant species in the blends. Their potential applications in food, pharmaceutical, and nutraceutical products should also be explored.
This work was partially supported by the National Council for Scientific and Technological Research (Grant PIBAA 2872021-0101087 and UNaM FCEQyN-16Q1204-IDP to L Celaya). MC Tannuri is a student in the Master's program in Food Technology, at Misiones National University. P Giordano is a doctoral fellow of CONICET (National Council for Scientific and Technological Research). The authors are grateful to Dario J Ferreyra for his support and collaboration.
-
The authors confirm their contributions to the paper as follows: study conception and design: Celaya LS; data collection: Tannuri MC, Giordano P, Berent CB, Corvalan-Garcete C; analysis and interpretation of results: Tannuri MC, Martina PF, Celaya LS; draft manuscript preparation: Martina PF, Celaya LS. All authors reviewed and approved the final version of the manuscript.
-
The datasets generated or analyzed during the current study are available from the corresponding authors on reasonable request.
-
The authors declare that they have no conflict of interest.
- Supplementary Table S1 Pearson correlation coefficients between TSE (mg/infusion), SG (mg/infusion), PC (mg GAE/infusion), TC (mg GAE/infusion), FC (mg QE/infusion), and IC50 (μg/mL).
- Supplementary Fig. S1 HPLC-DAD chromatogram (detection at 210 nm); (a) ST, (b) ST:MO, (c) ST:MO:YM; 5 μL of diluted infusion (1/1) were injected.
- Supplementary Fig. S2 Contour plots for the antioxidant activity (IC50) of blend infusions (a, b); for the recovery of PC infusions.
- Copyright: © 2026 by the author(s). Published by Maximum Academic Press, Fayetteville, GA. This article is an open access article distributed under Creative Commons Attribution License (CC BY 4.0), visit https://creativecommons.org/licenses/by/4.0/.
-
About this article
Cite this article
Tannuri MC, Giordano P, Berent CB, Corvalan-Garcete C, Martina PF, et al. 2026. Phytochemical characterization and sensory acceptability of sweet herbal tea blend I: moringa, yerba mate, and chamomile. Beverage Plant Research 6: e003 doi: 10.48130/bpr-0025-0033 

Phytochemical characterization and sensory acceptability of sweet herbal tea blend I: moringa, yerba mate, and chamomile
- Received: 01 June 2025
- Revised: 04 August 2025
- Accepted: 04 September 2025
- Published online: 30 January 2026
Abstract: This study aimed to investigate sweet herbal tea blends commonly consumed in South American countries, focusing on sensory acceptability, sweetening properties, and phenolic compounds with antioxidant potential. The infusion blends studied included stevia (ST), yerba mate (YM), manzanilla (CH), and moringa (MO), in various combinations and proportions. MO from summer and winter harvests was used. Radical scavenging activity ranged from 10.3 to 42.8 µg/mL, from ST : YM to MO : CH infusions. Infusions prepared with summer-harvested MO showed significantly higher antioxidant activity (p < 0.001). Most blends exhibited synergistic effects on in vitro radical scavenging activity, although MO : YM and MO : ST : YM showed antagonistic interactions. Total phenolic content varied from 58.6 to 118.6 mg GAE/g DE, from MO : CH to ST. The content of steviol glycoside sweeteners increased proportionally with the amount of ST in the blends. In general, the recovery of sweeteners and antioxidant compounds followed distinct patterns, but a strong correlation was found between total flavonoids (as quercetin equivalents) and radical scavenging activity. Sensory evaluation showed that the proportion of ST (1:1 vs 1:3) had little effect on acceptability, aroma, or perceived sweetness. Hedonic scale scores ranged from 6.5–7.0 for flavor, 6.0–6.4 for sweetness quality, and 4.4–6.1 for sweetness intensity, evaluated on an unstructured scale; MO : ST : CH had the lowest sweetness score. Sensory perception varied mainly by sex and ST consumption habits. An ST concentration of 0.67–1.0 g per infusion was considered acceptable. These findings suggest that sweet herbal tea blends may offer a healthy, naturally sweet alternative to traditional herbal infusions.
-
Key words:
- Sensory acceptability /
- Herbal blend /
- Sweetness perception /
- Stevia rebaudiana /
- Phytochemical behavior