-
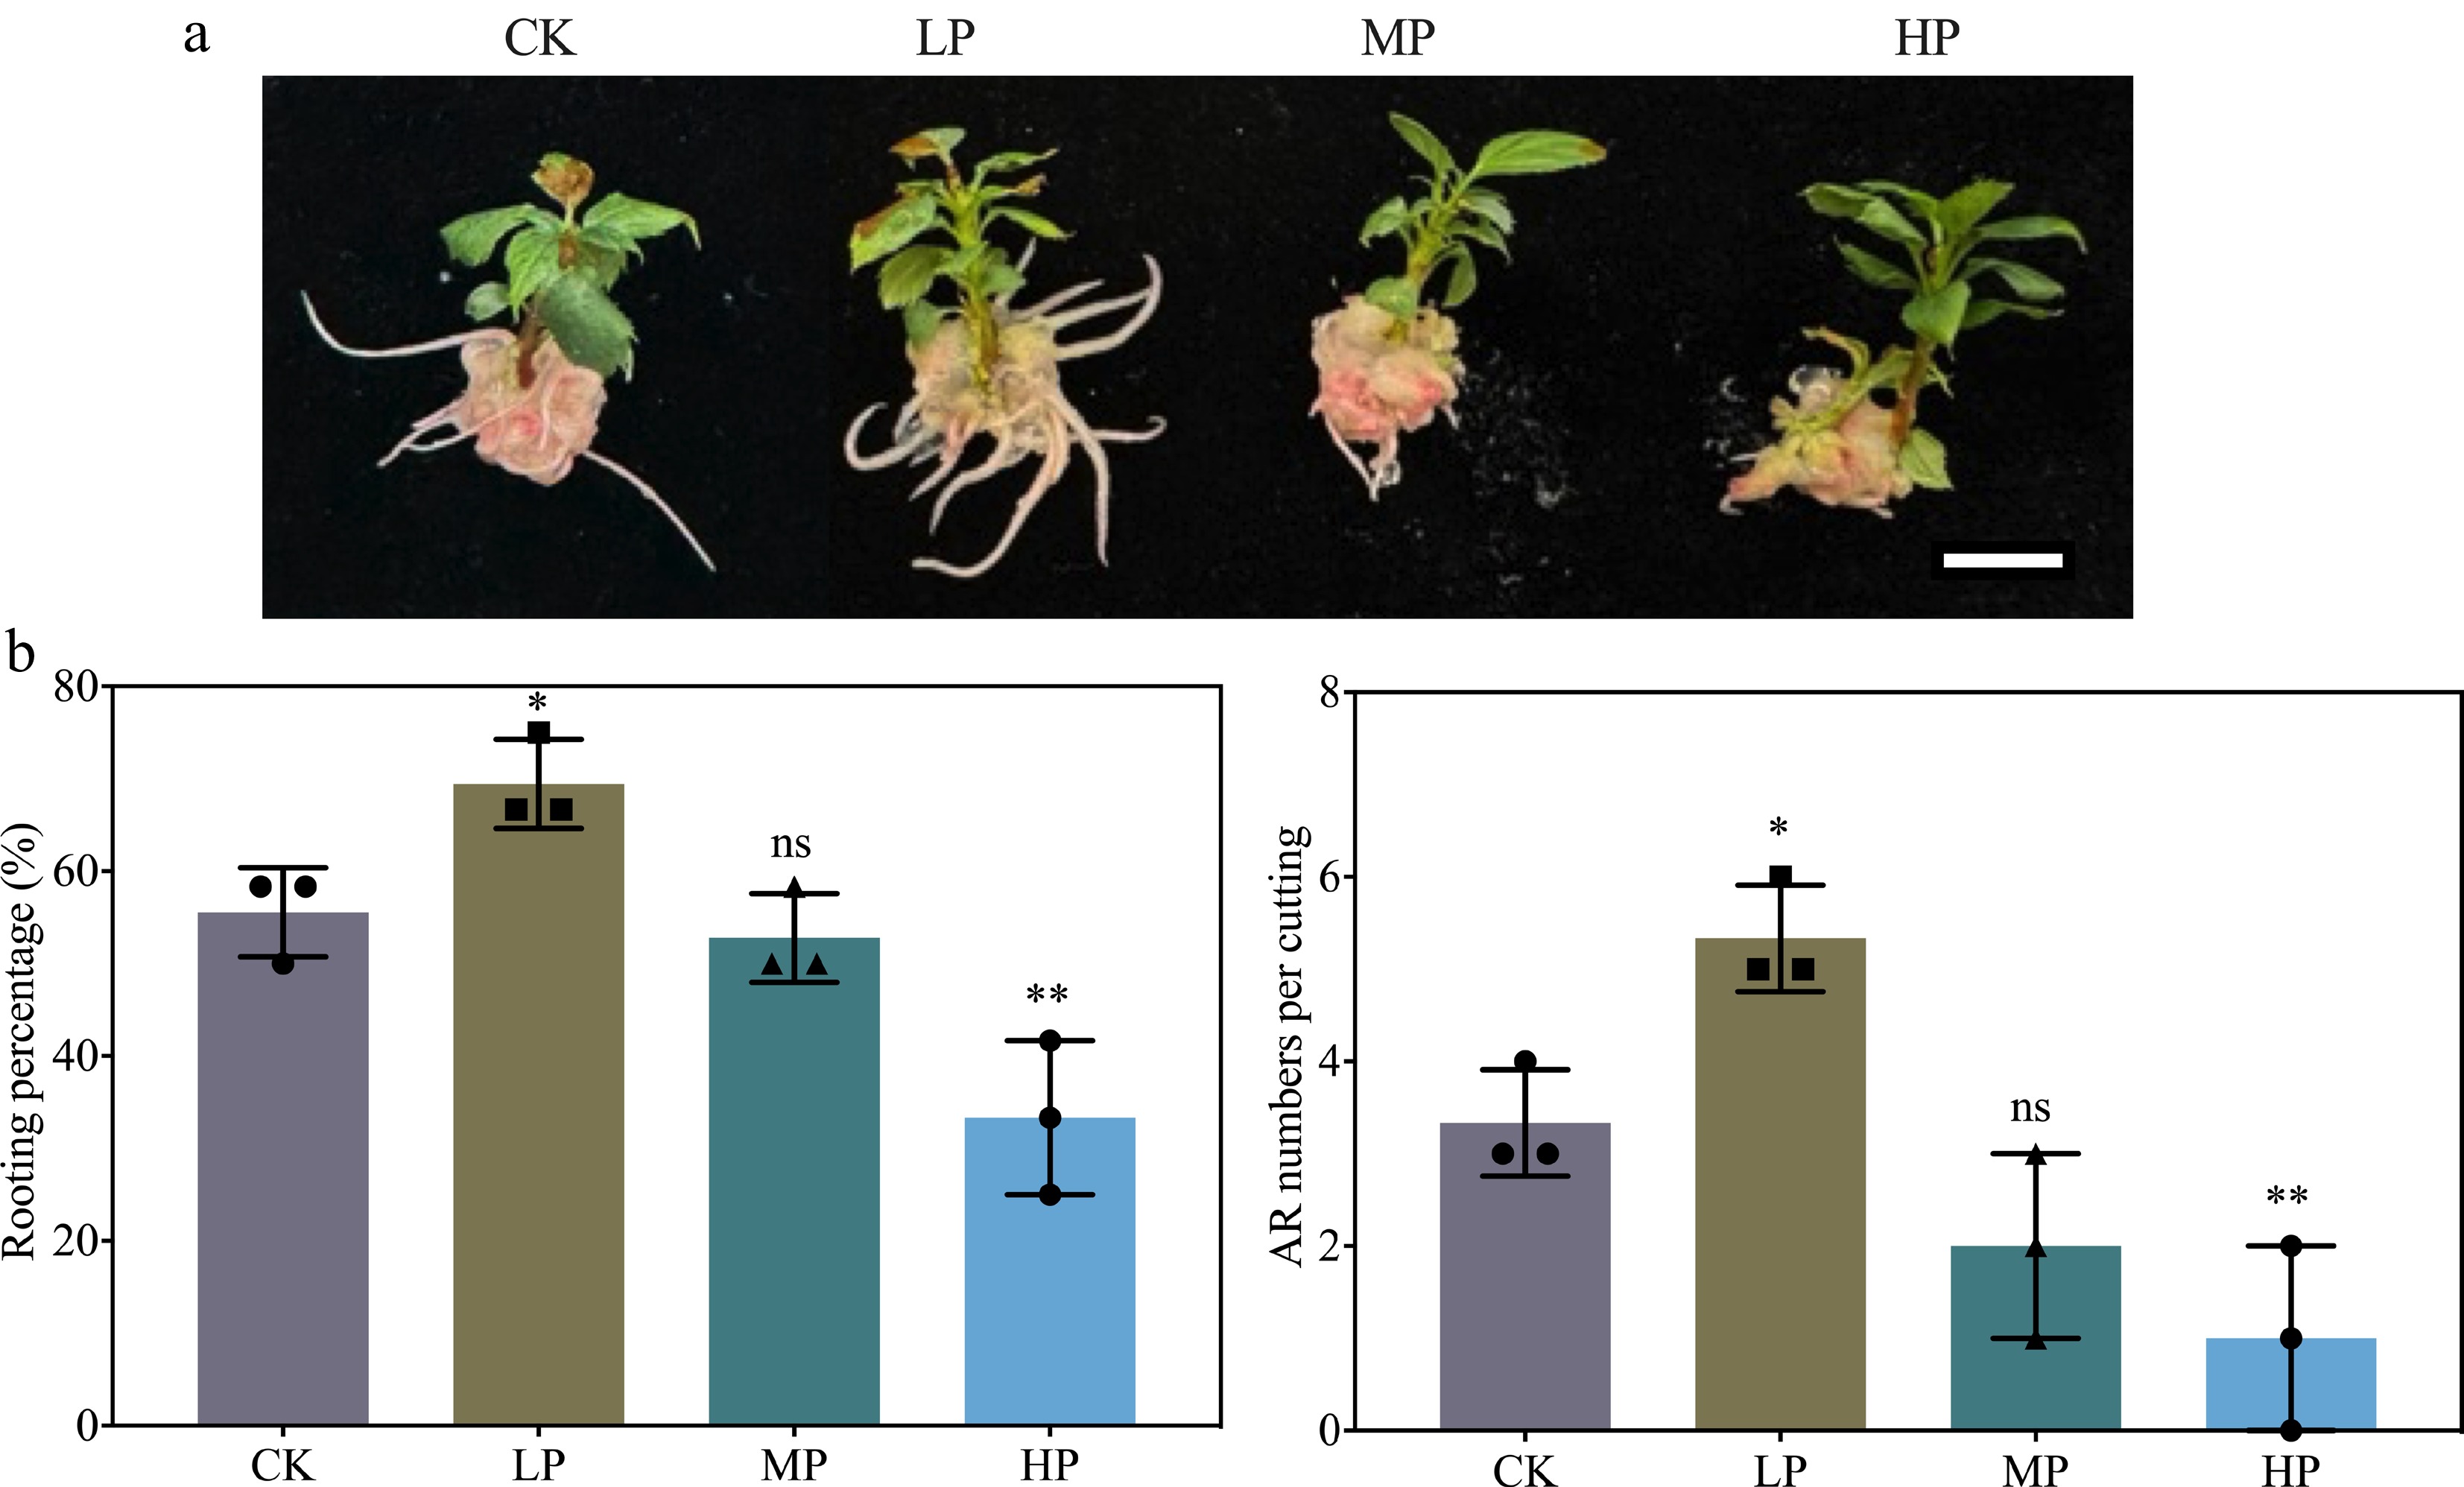
Figure 1.
Effect of graded phosphorus (P) concentrations on adventitious root (AR) formation in K2 apple rootstock stem cuttings. Stem cuttings were grown on half-strength MS medium with the basal P level (CK, 0.04 g/L) or supplemented with 0.08 g/L (Low P, LP; total P 0.12 g/L), 0.16 g/L (Medium P, MP; total P 0.20 g/L), or 0.32 g/L (High P, HP; total P 0.36 g/L) KH2PO4. Although the LP treatment contained more P than CK, it is termed 'Low P' relative to MP and HP in this dose–response design. Scale bar = 1 cm. AR morphological parameters, including rooting percentage and AR numbers per cutting, were measured after 30 d of treatment. Error bars indicate mean ± SD from three biological replicates. Different asterisks denote significance levels: ns, p > 0.05; * p < 0.05; ** p < 0.01.
-
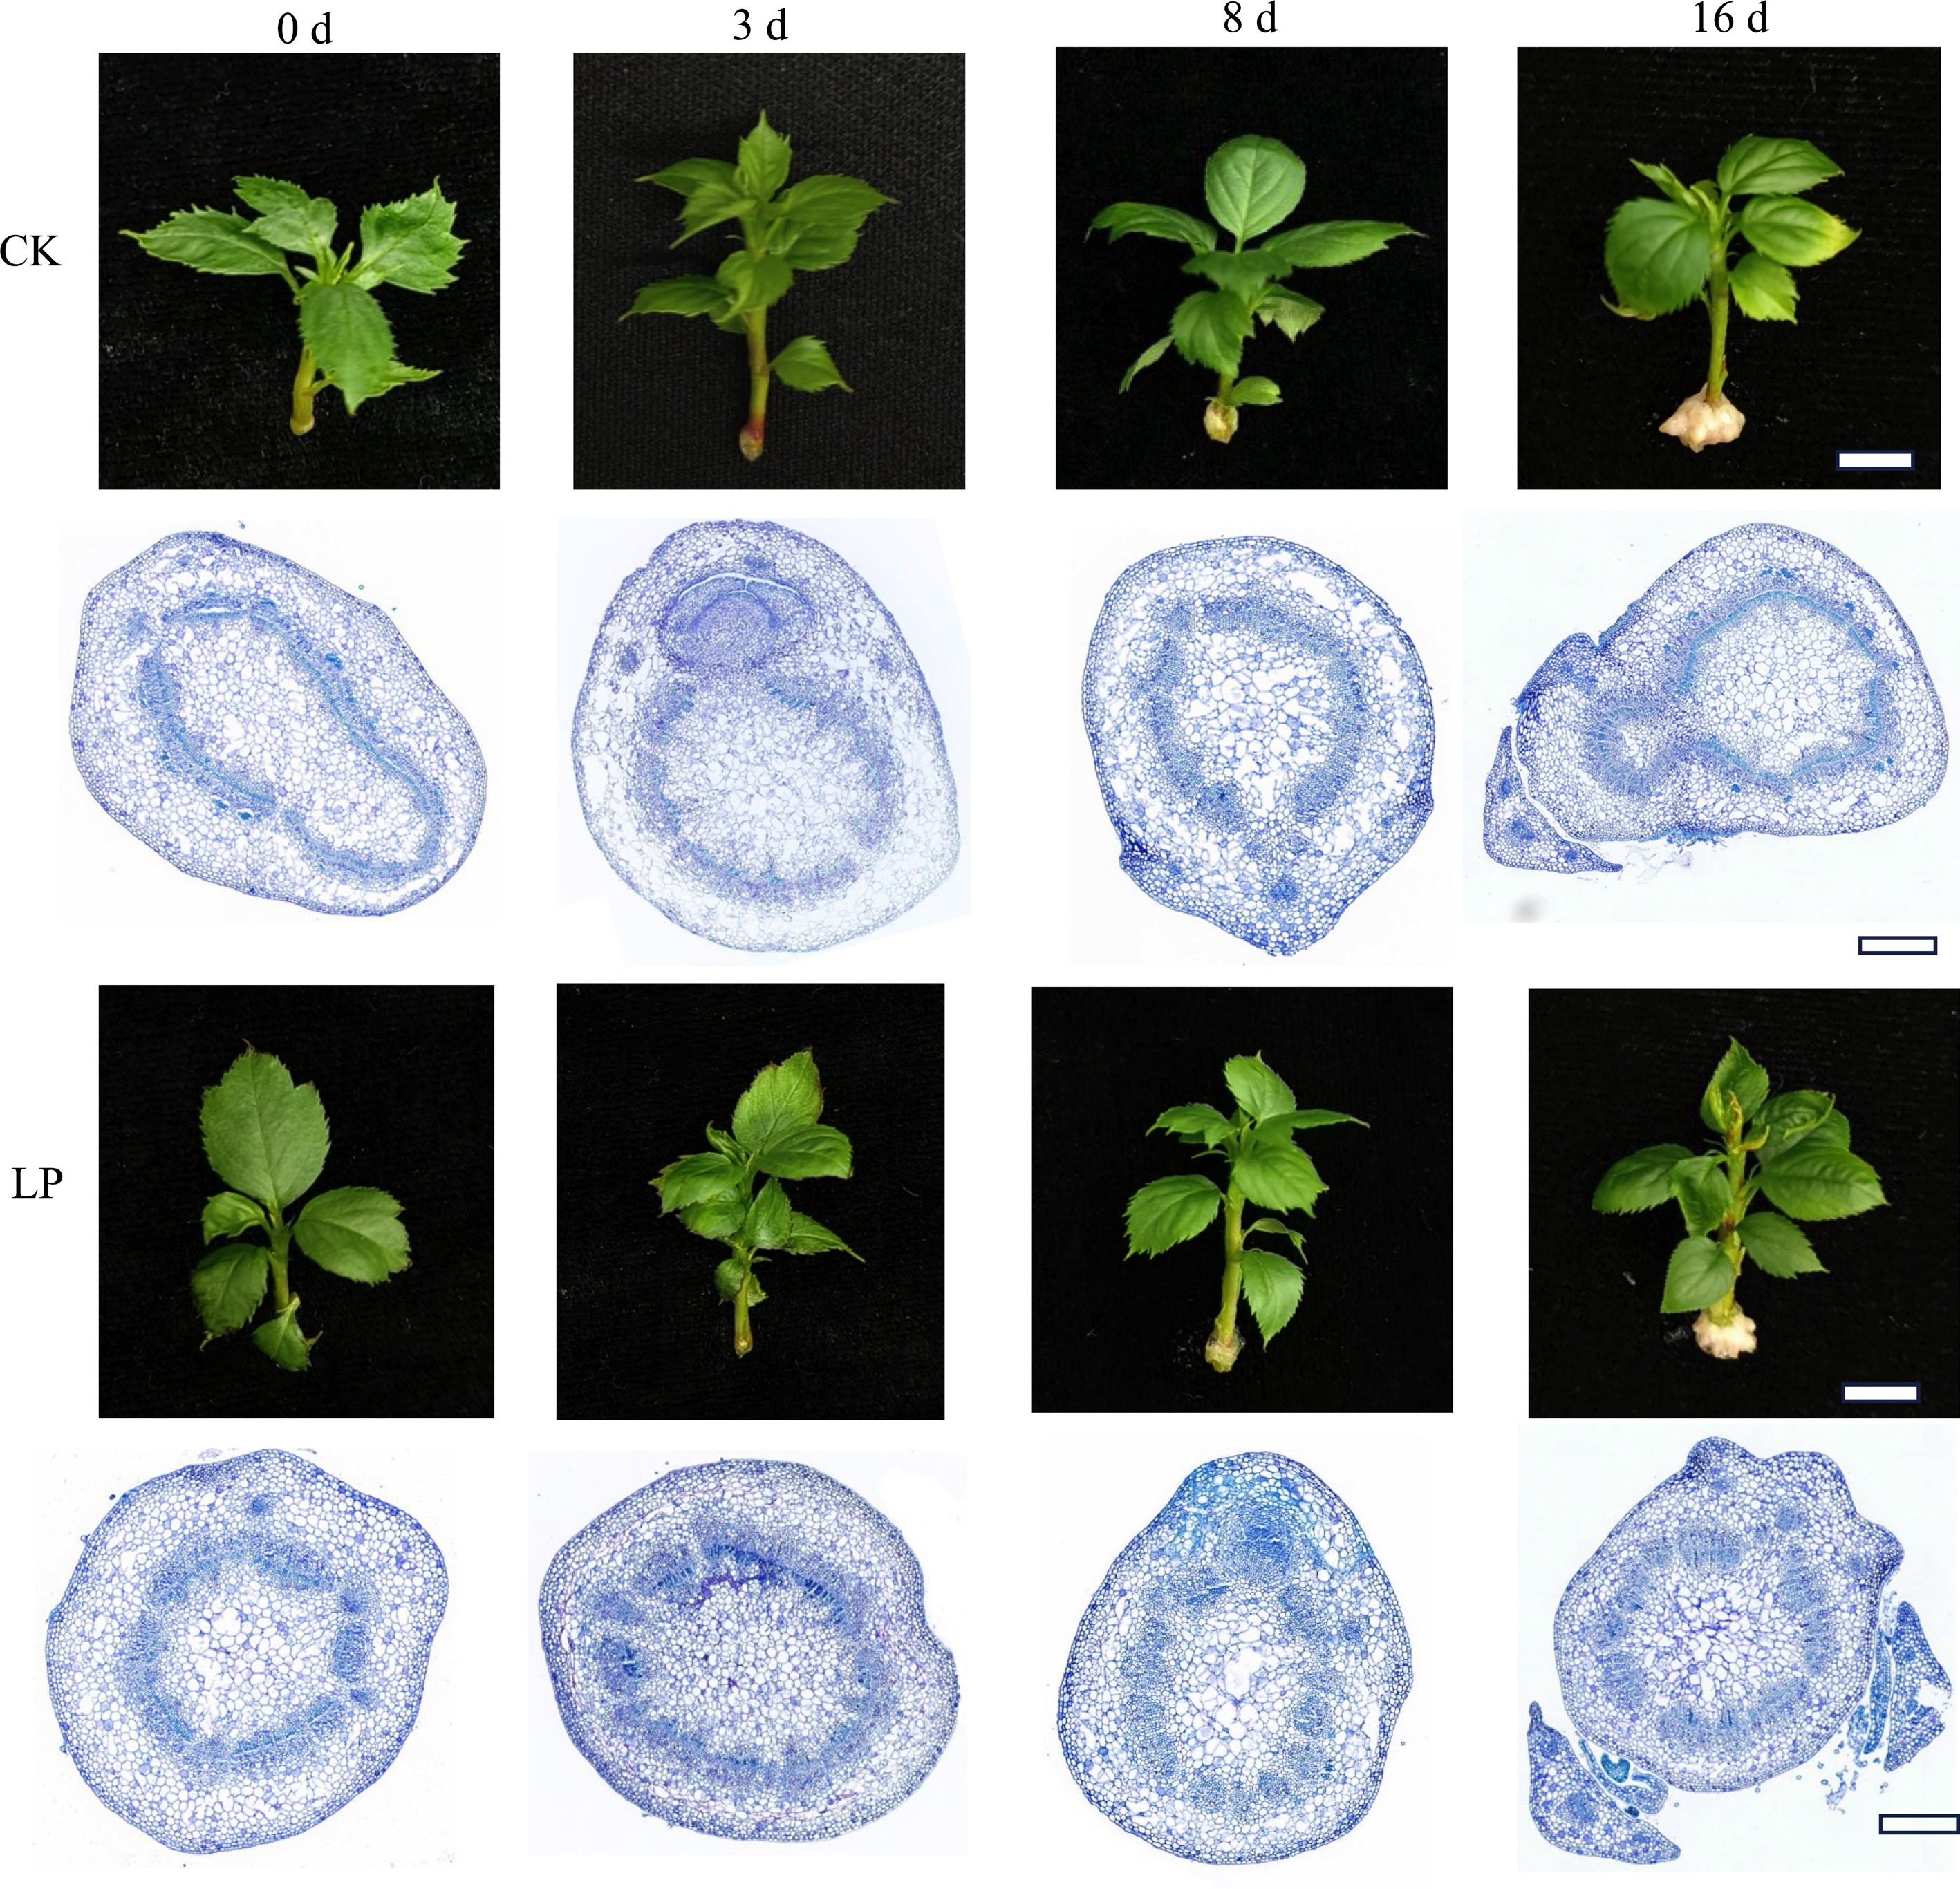
Figure 2.
Morphological and anatomical observations of adventitious root (AR) formation in K2 apple rootstock stem cuttings at different time points (0, 3, 8, and 16 d). Cuttings were grown on half-strength MS medium with the basal P level (CK, 0.04 g/L) or supplemented with 0.08 g/L KH2PO4 (Low P, LP; total P 0.12 g/L). Scale bars: 1 cm for morphological images and 500 μm for microscopic images.
-
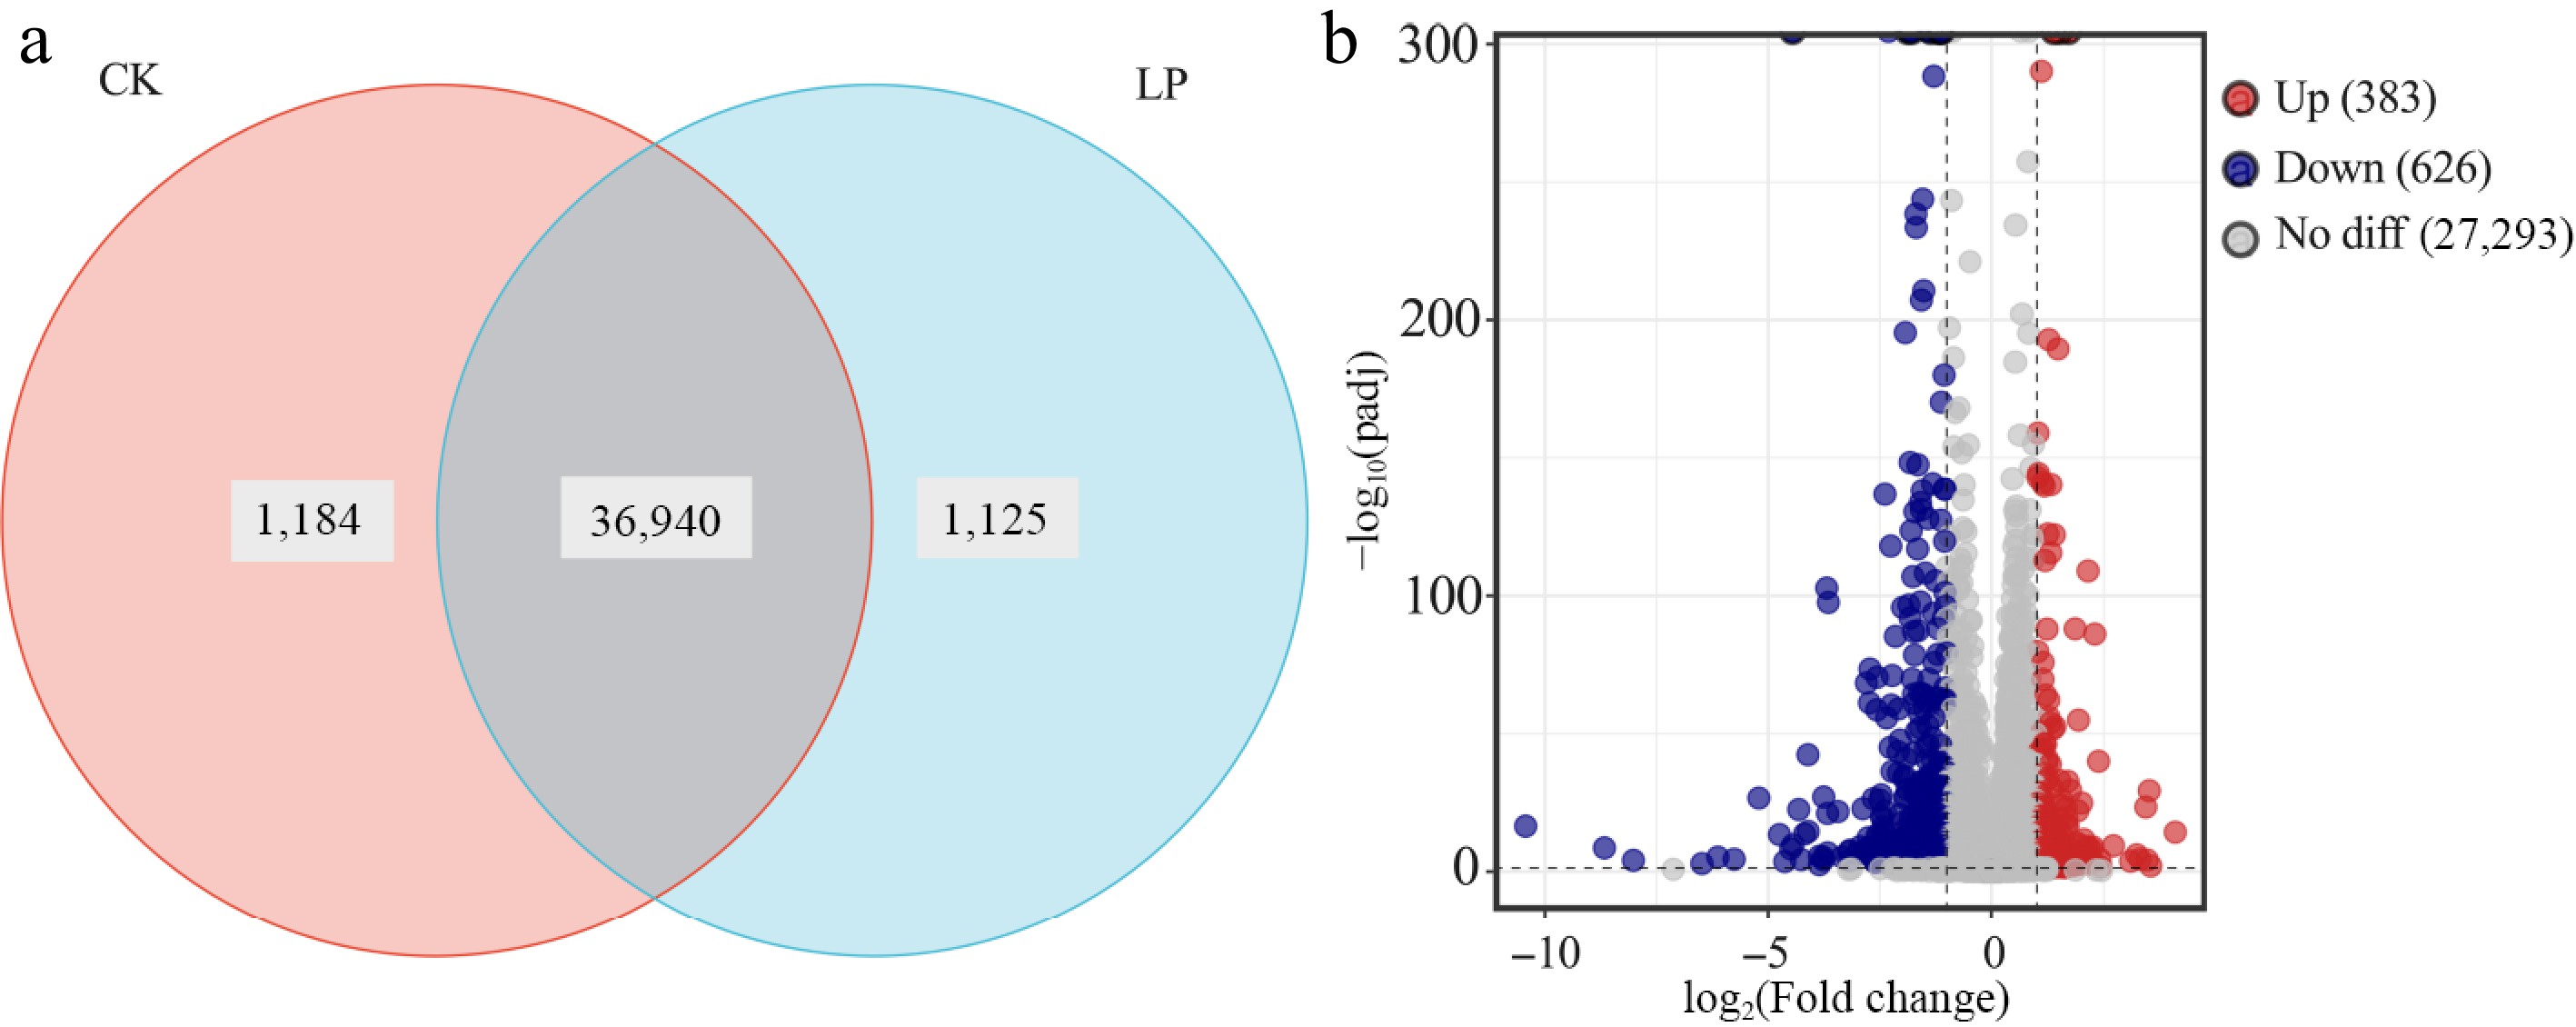
Figure 3.
Transcriptomic analysis of K2 apple rootstock stem cuttings on the 3rd day of adventitious root (AR) formation under low-phosphorus (LP, 0.08 g/L; total P 0.12 g/L) treatment compared with the control (CK, basal P level of standard MS medium, 0.04 g/L). (a) Venn diagram showing unique and shared genes between CK and LP-treated groups. (b) Volcano plot of differentially expressed genes (DEGs), with each dot representing a specific DEG: red dots indicate upregulated genes, blue dots indicate downregulated genes, and gray dots indicate non-significant genes.
-
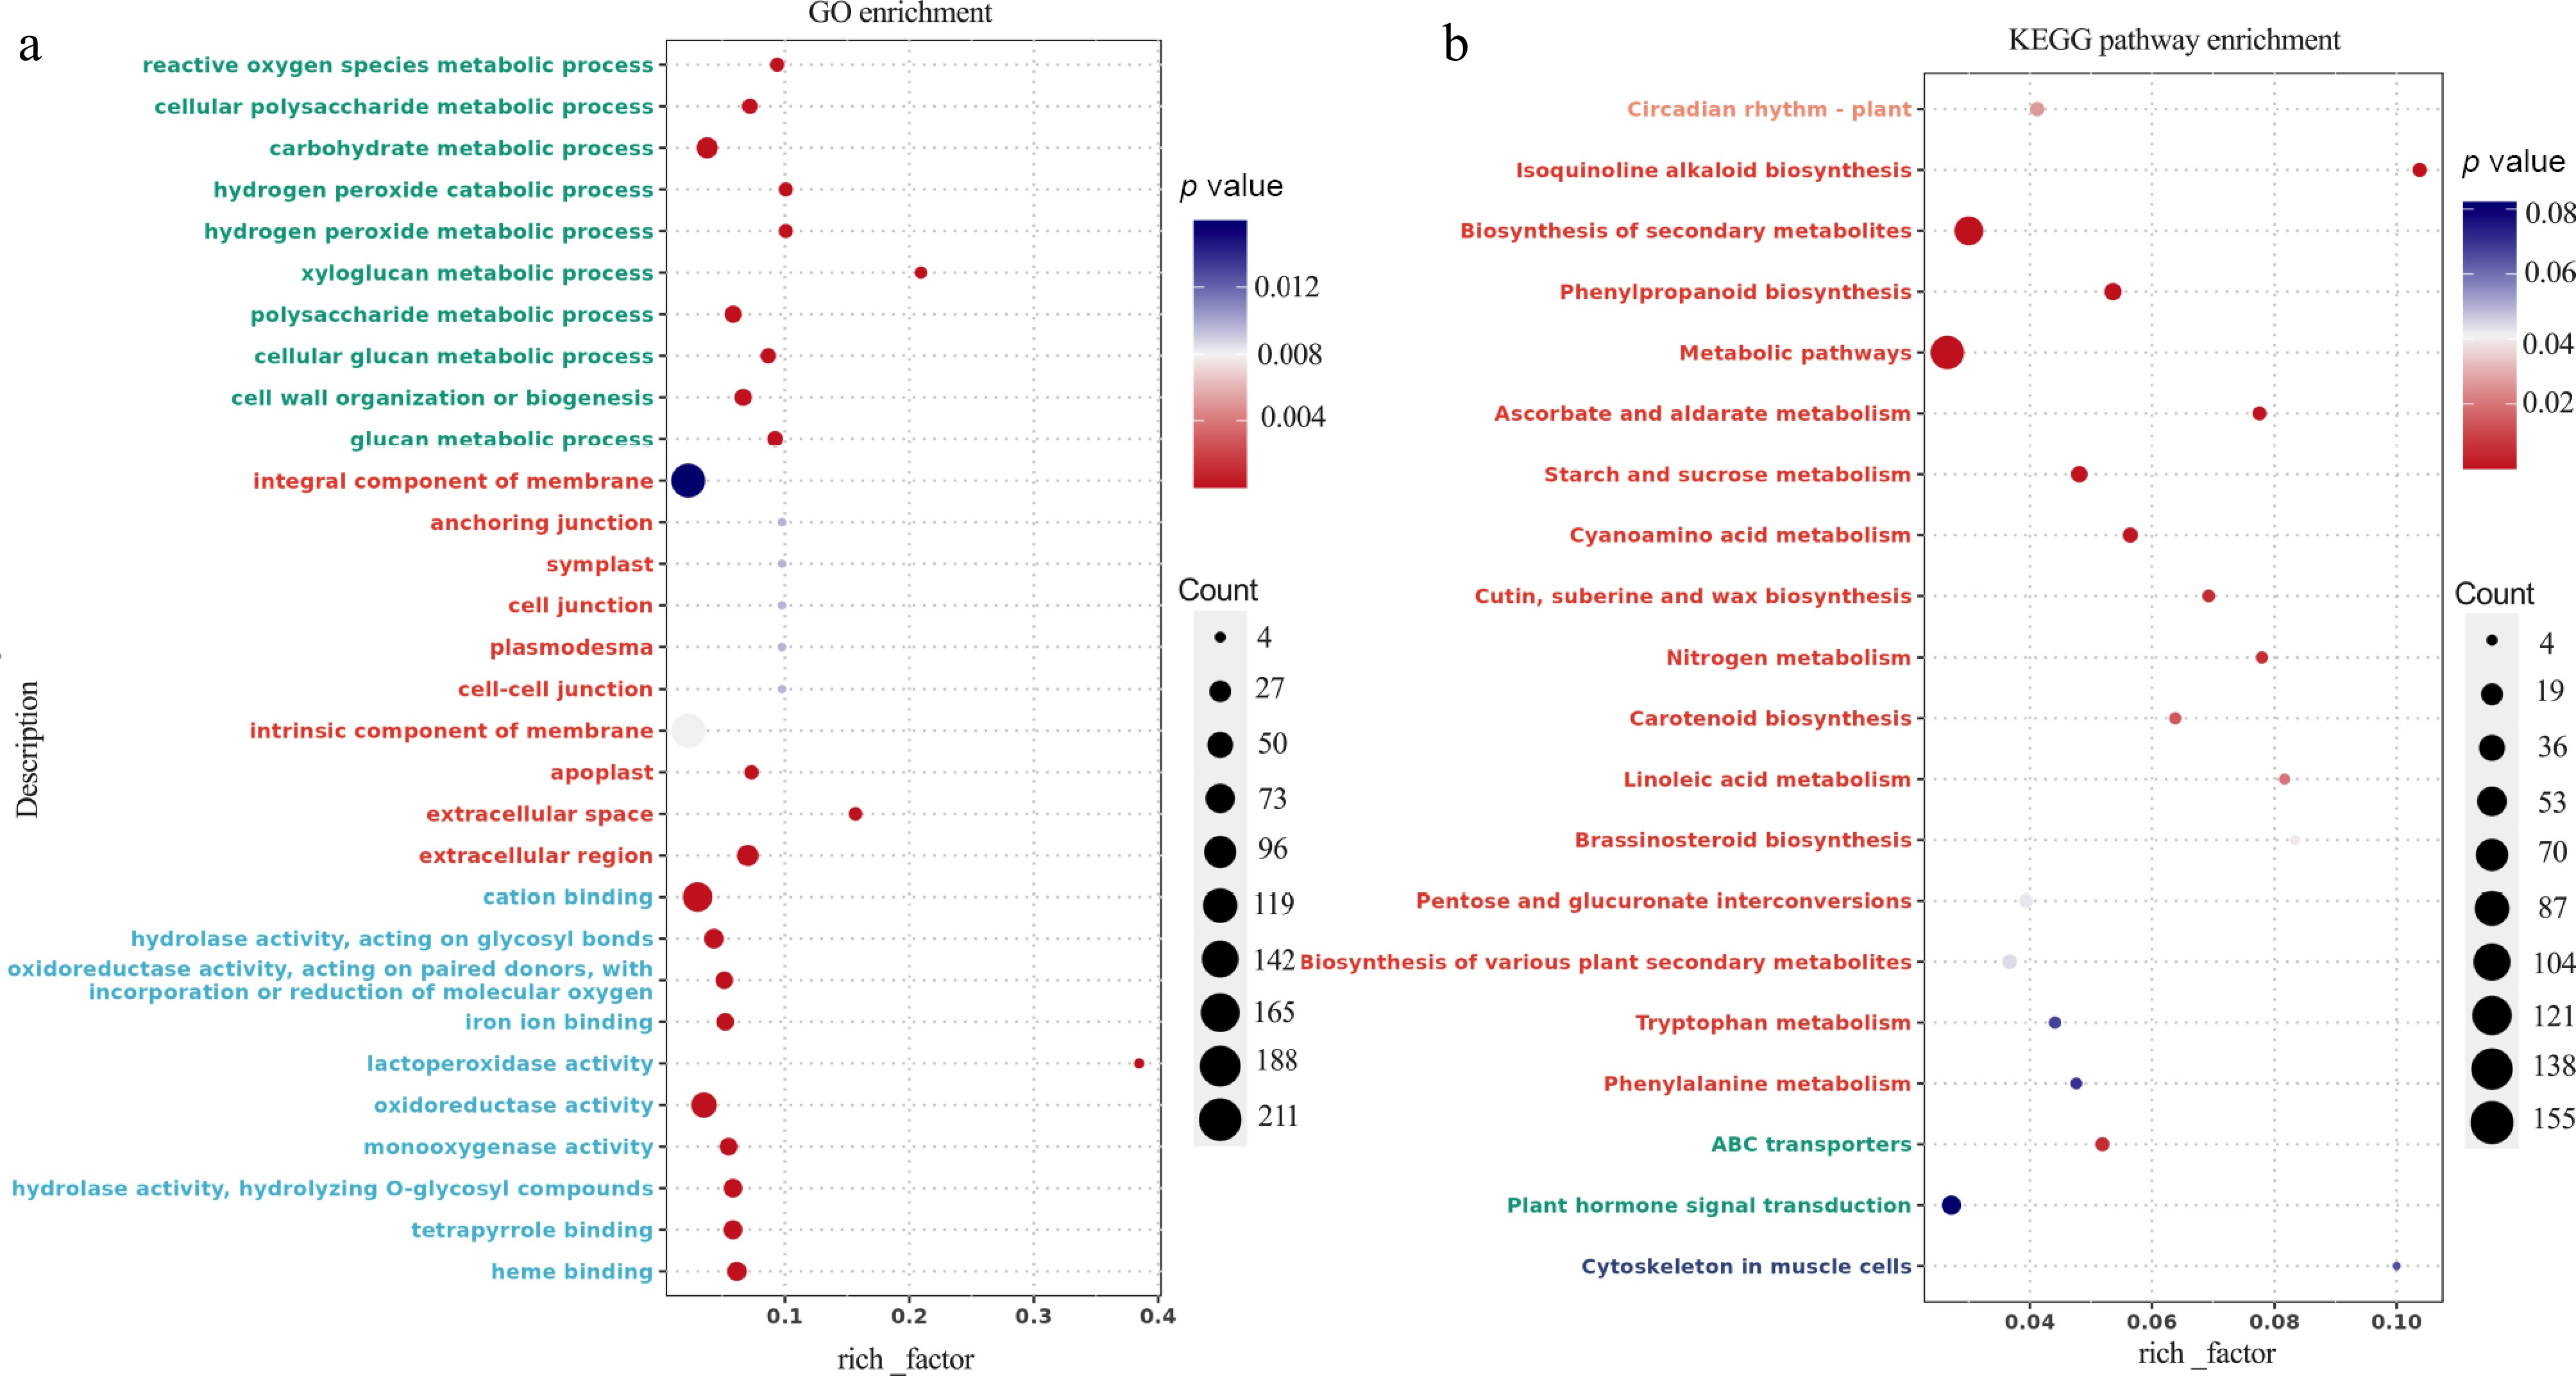
Figure 4.
Transcriptomic analysis of K2 apple rootstock stem cuttings on the 3rd day of adventitious root (AR) formation under low-phosphorus (LP, 0.08 g/L; total P 0.12 g/L) treatment compared with the control (CK, basal P level of standard MS medium, 0.04 g/L). (a) Gene Ontology (GO) enrichment analysis of differentially expressed genes (DEGs). (b) Kyoto Encyclopedia of Genes and Genomes (KEGG) pathway analysis of DEGs. The vertical axis shows the pathway names and GO terms, the horizontal axis represents the rich factor, the size of each point indicates the number of DEGs, and the color of the points corresponds to the p-value.
-
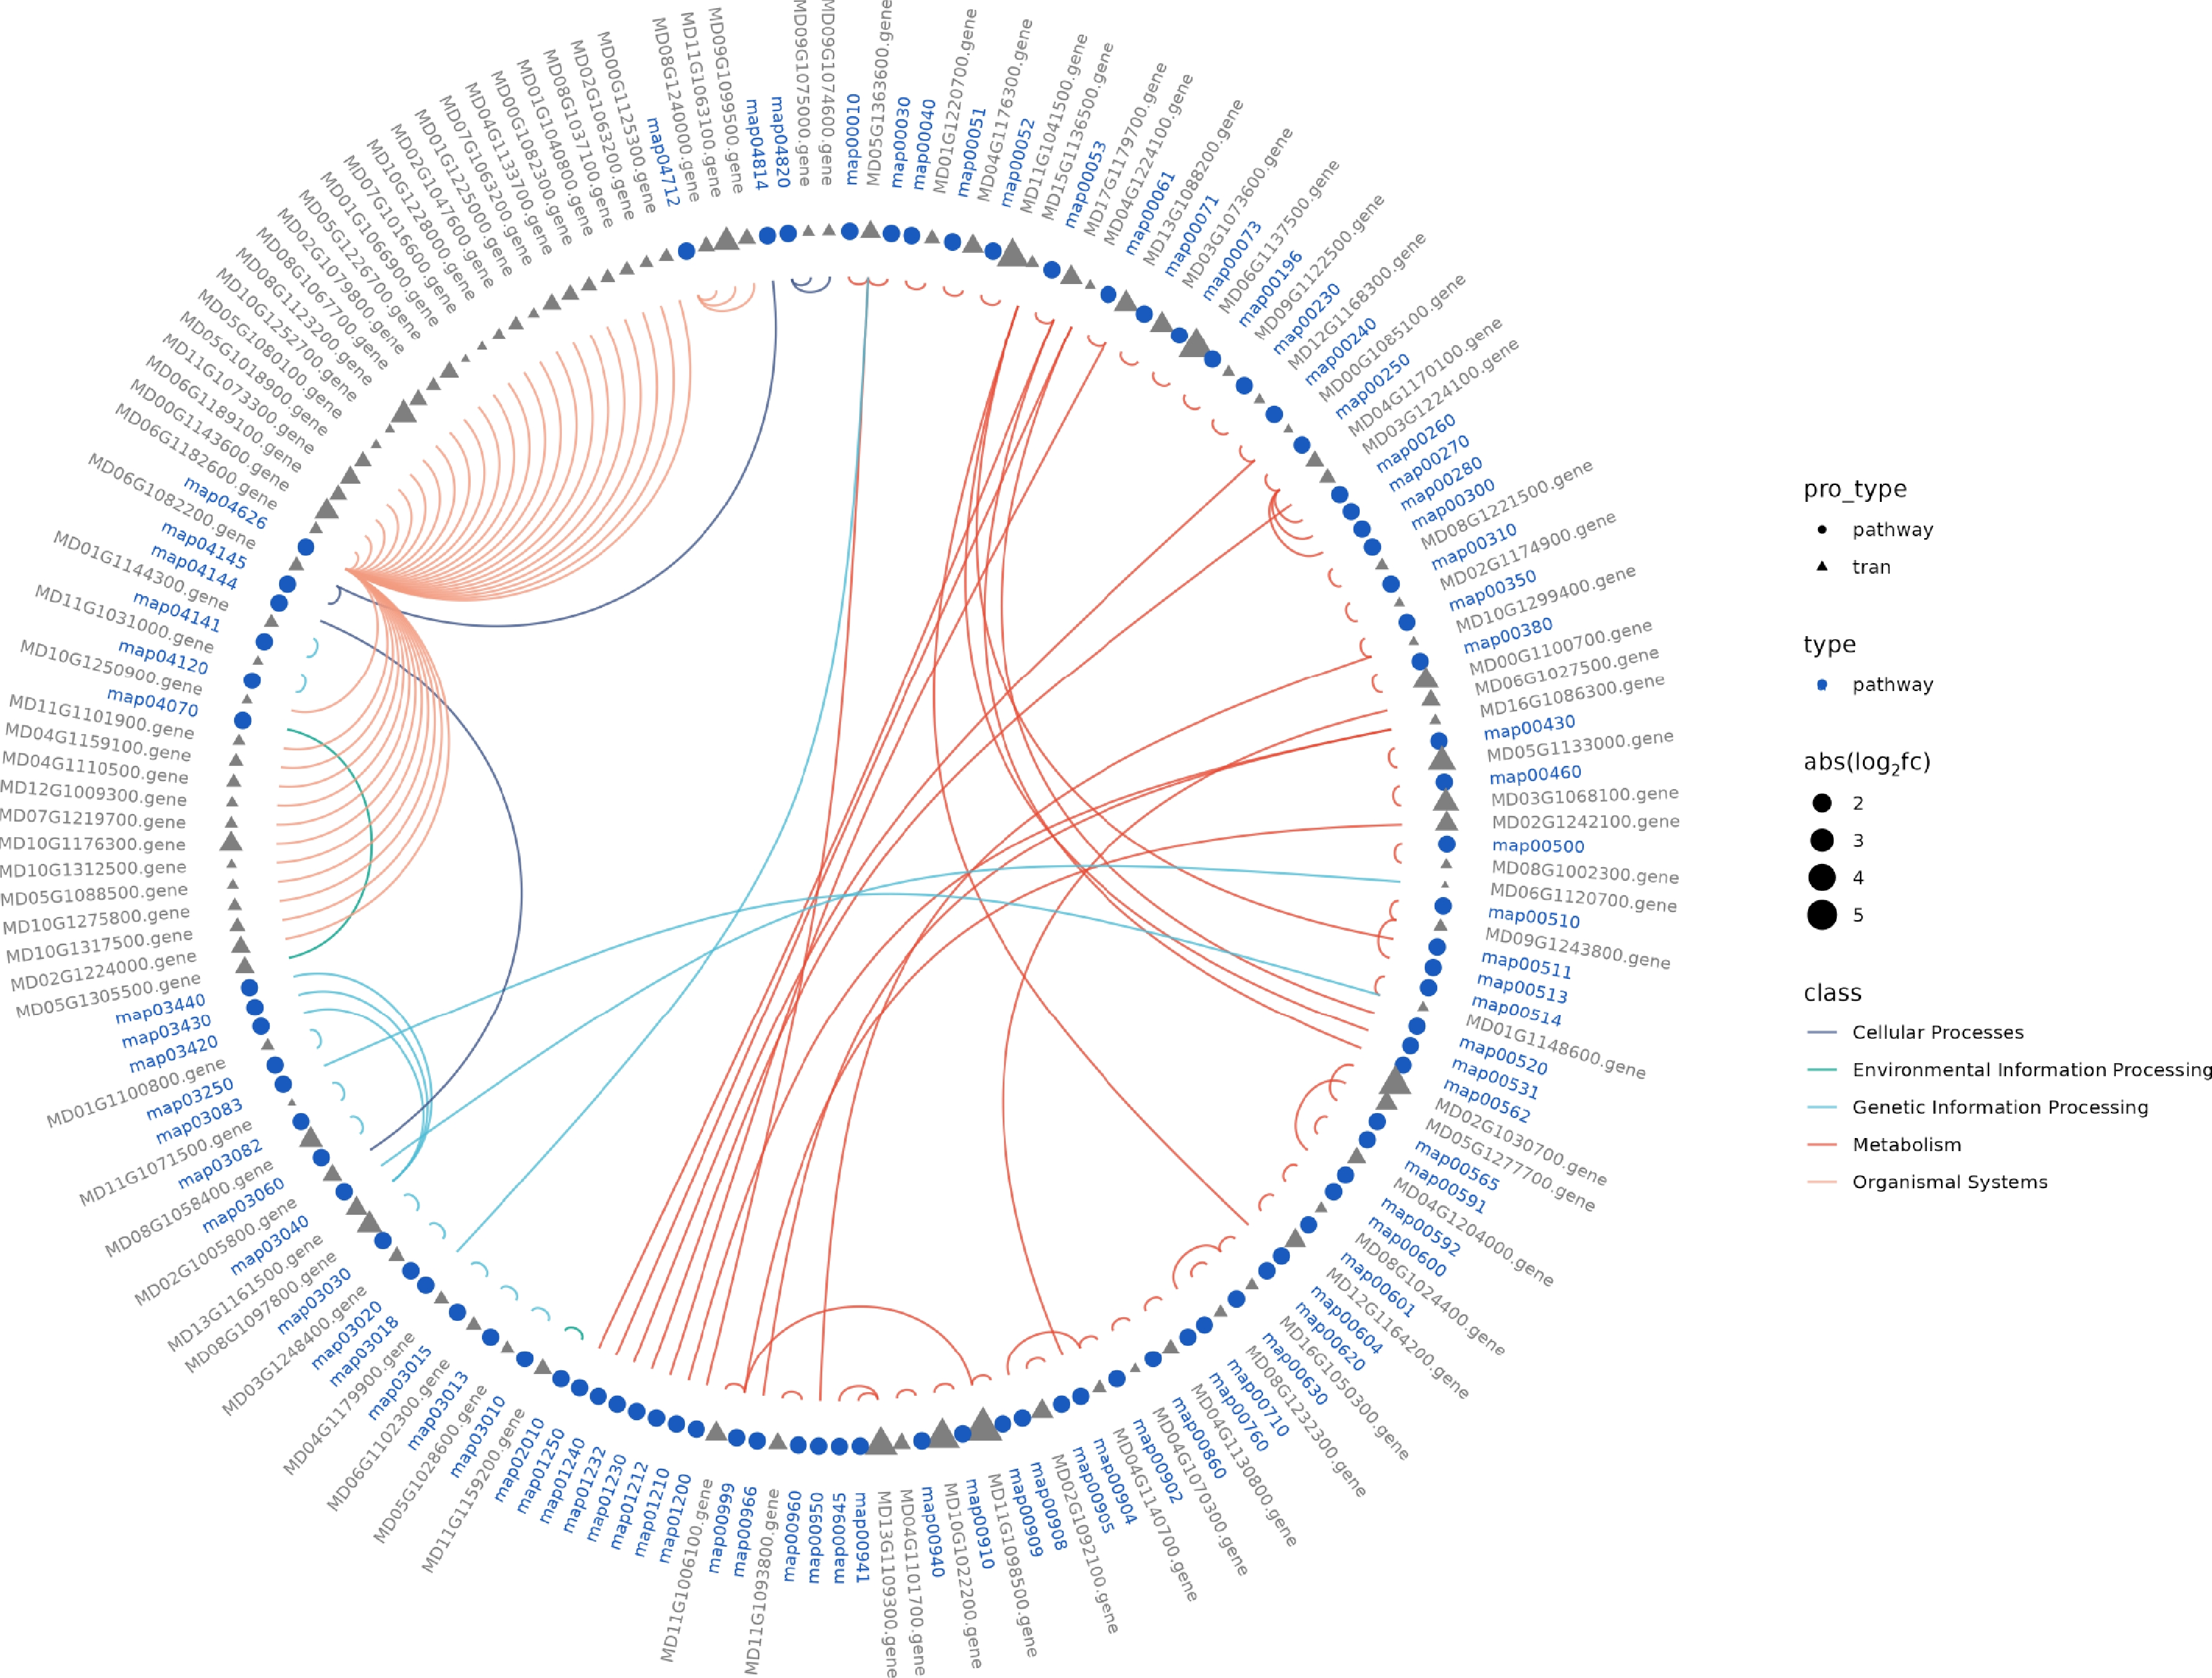
Figure 5.
Transcriptomic analysis of K2 apple rootstock stem cuttings on the 3rd day of adventitious root (AR) formation under low-phosphorus (LP, 0.08 g/L; total P 0.12 g/L) treatment compared with the control (CK, basal P level of standard MS medium, 0.04 g/L). The Kyoto Encyclopedia of Genes and Genomes (KEGG) circle illustrates different pathway types and their associated differentially expressed genes (DEGs) across the classifications.
-
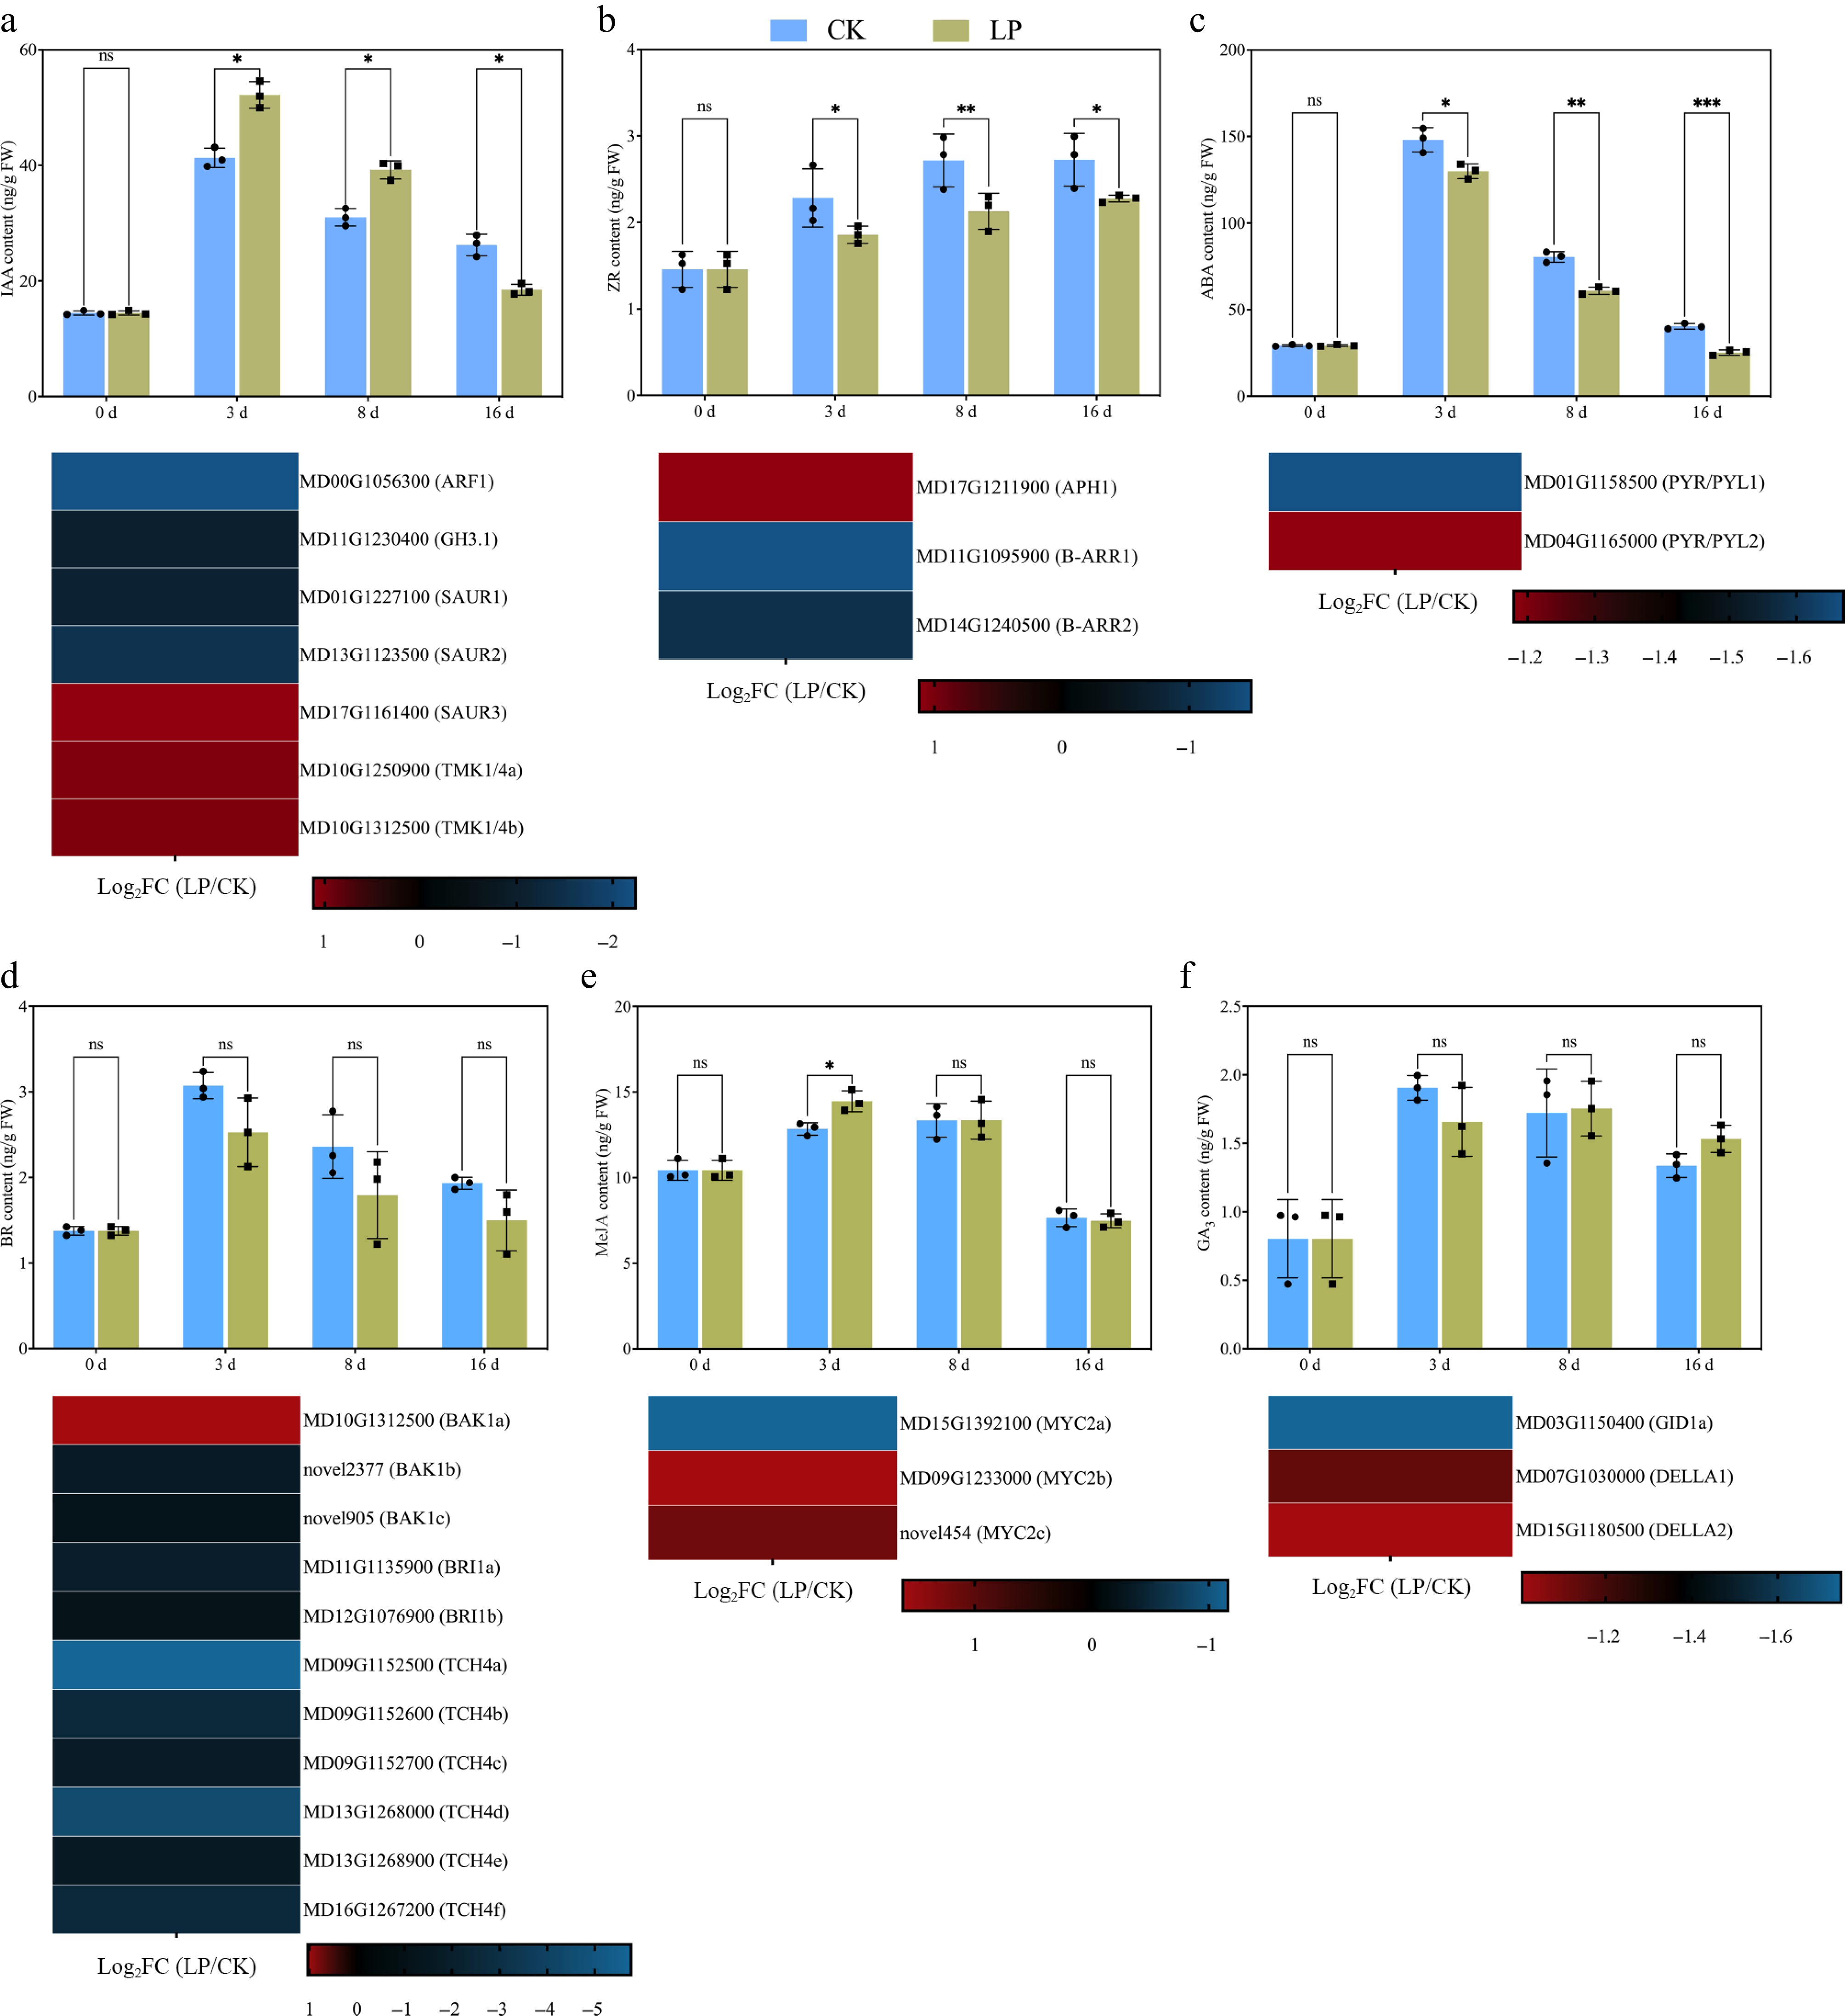
Figure 6.
Effect of low-phosphorus (LP, 0.08 g/L; total P 0.12 g/L) treatment compared with the control (CK, basal P level of standard MS medium, 0.04 g/L) on endogenous hormone levels in K2 apple rootstock stem cuttings during adventitious root (AR) formation at 0, 3, 8, and 16 d. Hormones measured include (a) indole-3-acetic acid (IAA), (b) zeatin riboside (ZR), (c) abscisic acid (ABA), (d) brassinosteroid (BR), (e) methyl jasmonate (MeJA), and (f) gibberellic acid 3 (GA3). Error bars refer to the average value ± SD from three biological replicates. Different asterisks indicate significant differences at ns p > 0.05, * p < 0.05, ** p < 0.01, and *** p < 0.001. Below each hormone level graph, the corresponding heatmap displays the expression of selected differentially expressed genes (DEGs) related to different hormone metabolisms and signaling pathways obtained from RNA-seq data (at 3rd d, which is crucial for the initiation of molecular reprogramming required for AR formation). The heatmaps show the log2FC values for genes across the pairwise comparison of CK_vs_LP, with the color gradient representing the gene expression levels.
-
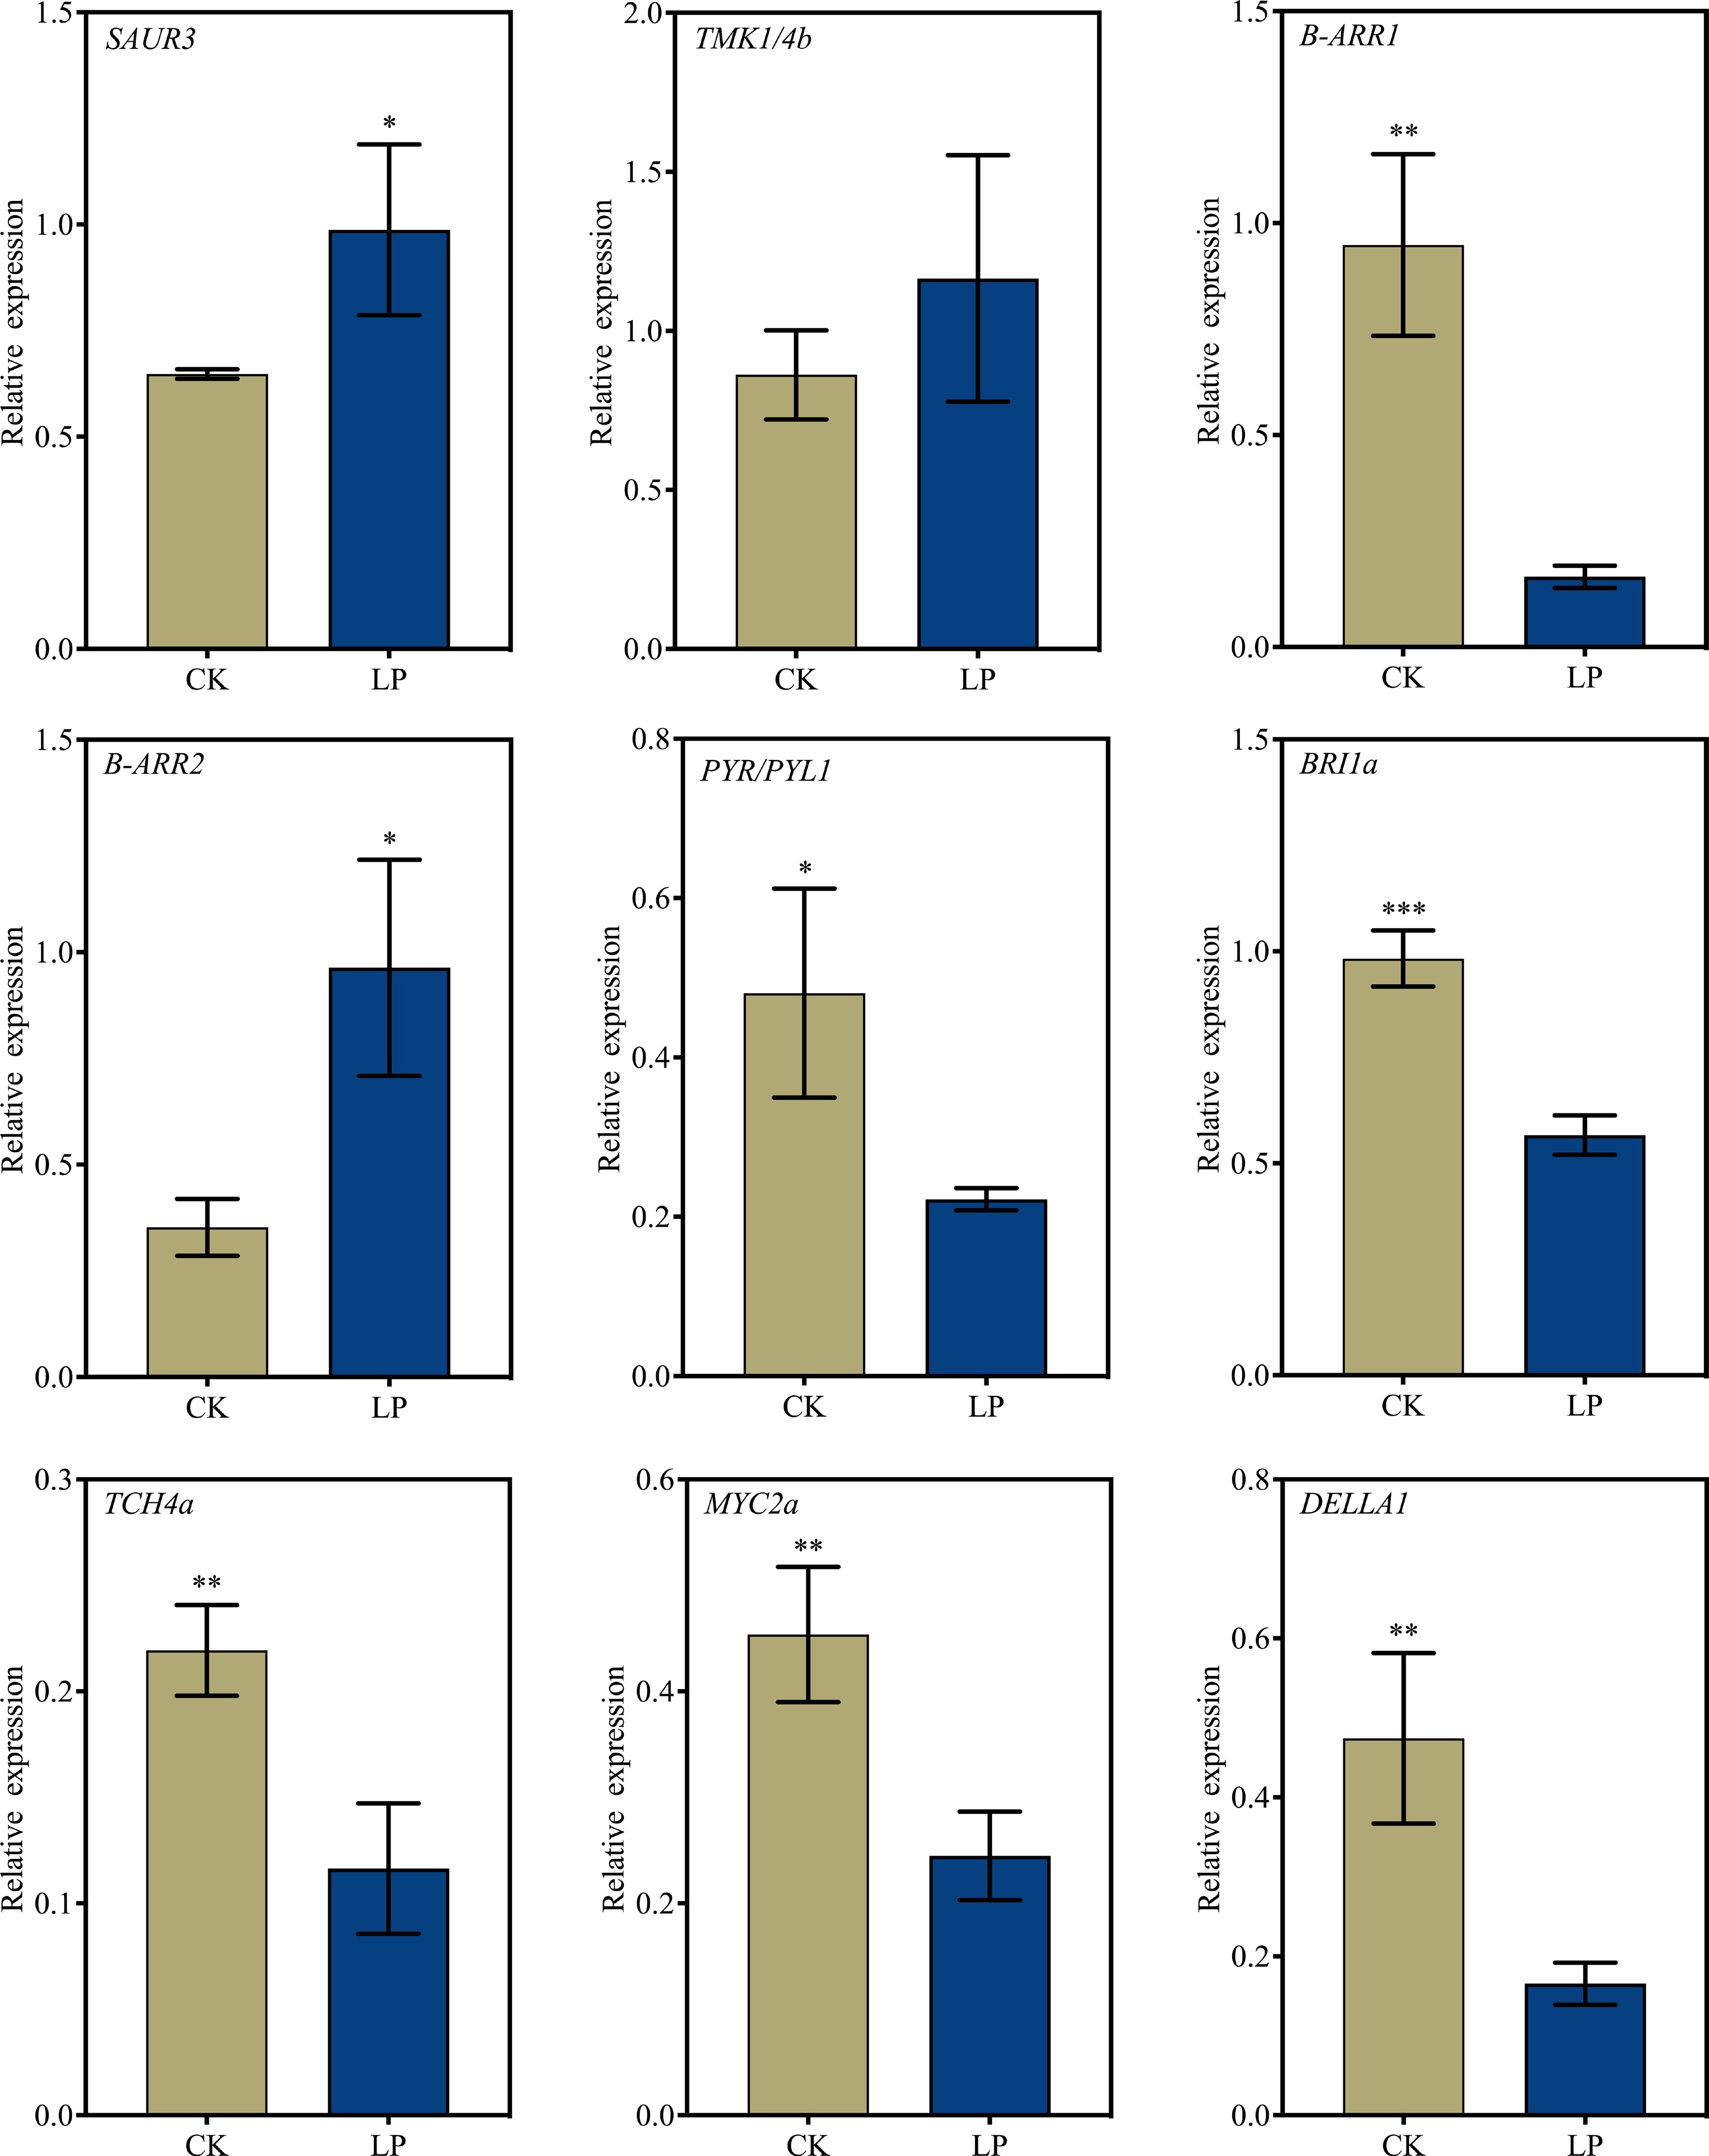
Figure 7.
RT-qPCR validation of selected differentially expressed genes (DEGs) to confirm the reliability of RNA-seq data. K2 apple rootstock stem cuttings were treated with low-phosphorus (LP, 0.08 g/L; total P 0.12 g/L) or grown on the control medium (CK, basal P level of standard MS medium, 0.04 g/L) and sampled on the 3rd day of adventitious root (AR) formation. Error bars indicate mean ± SD from three biological replicates. Different asterisks denote significance levels: ns, p > 0.05; * p < 0.05; ** p < 0.01; *** p < 0.001.
Figures
(7)
Tables
(0)