-
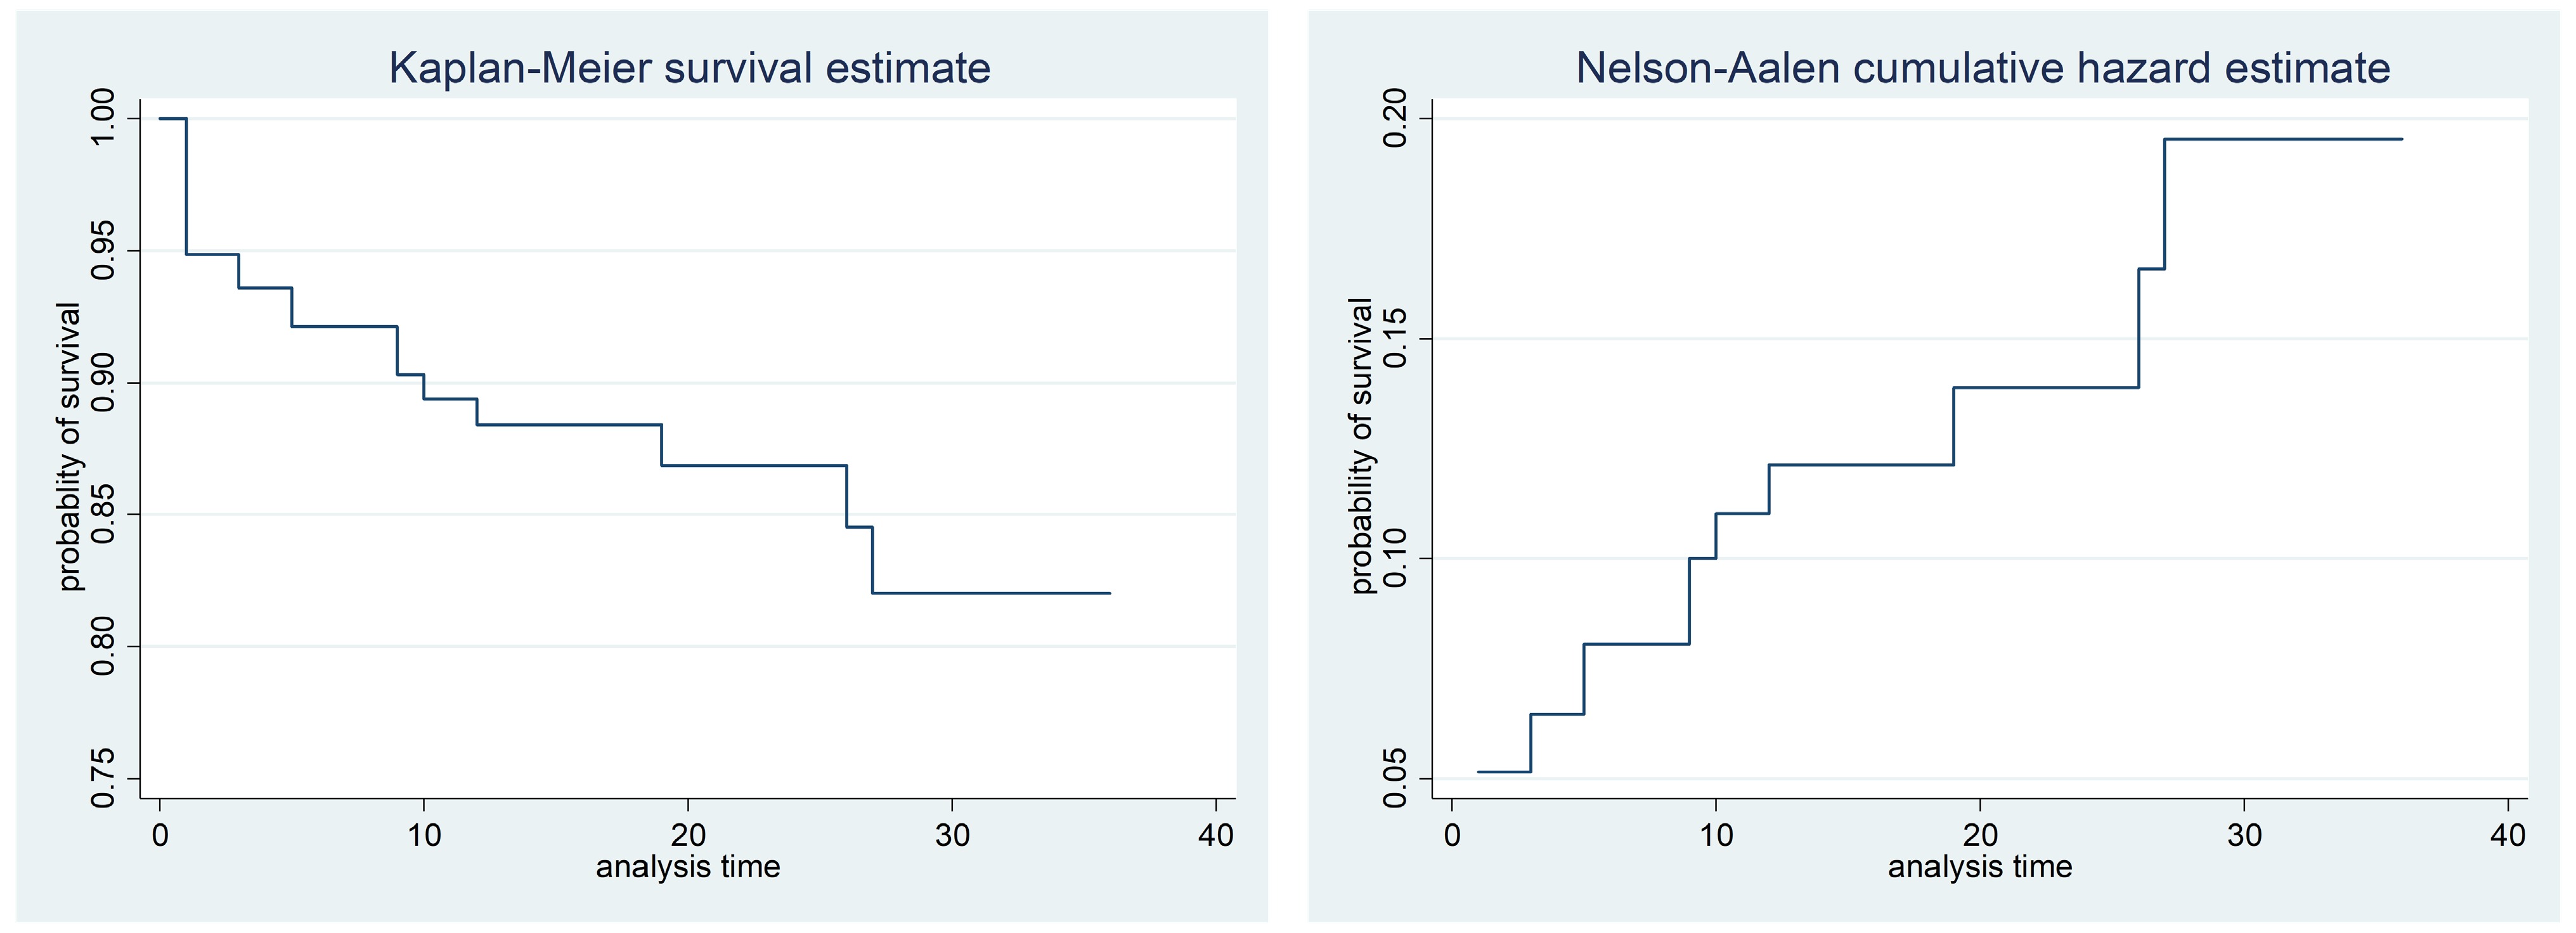
Figure 1.
The K-M of survival and hazard functions plot of the time to death of CHF patients.
-
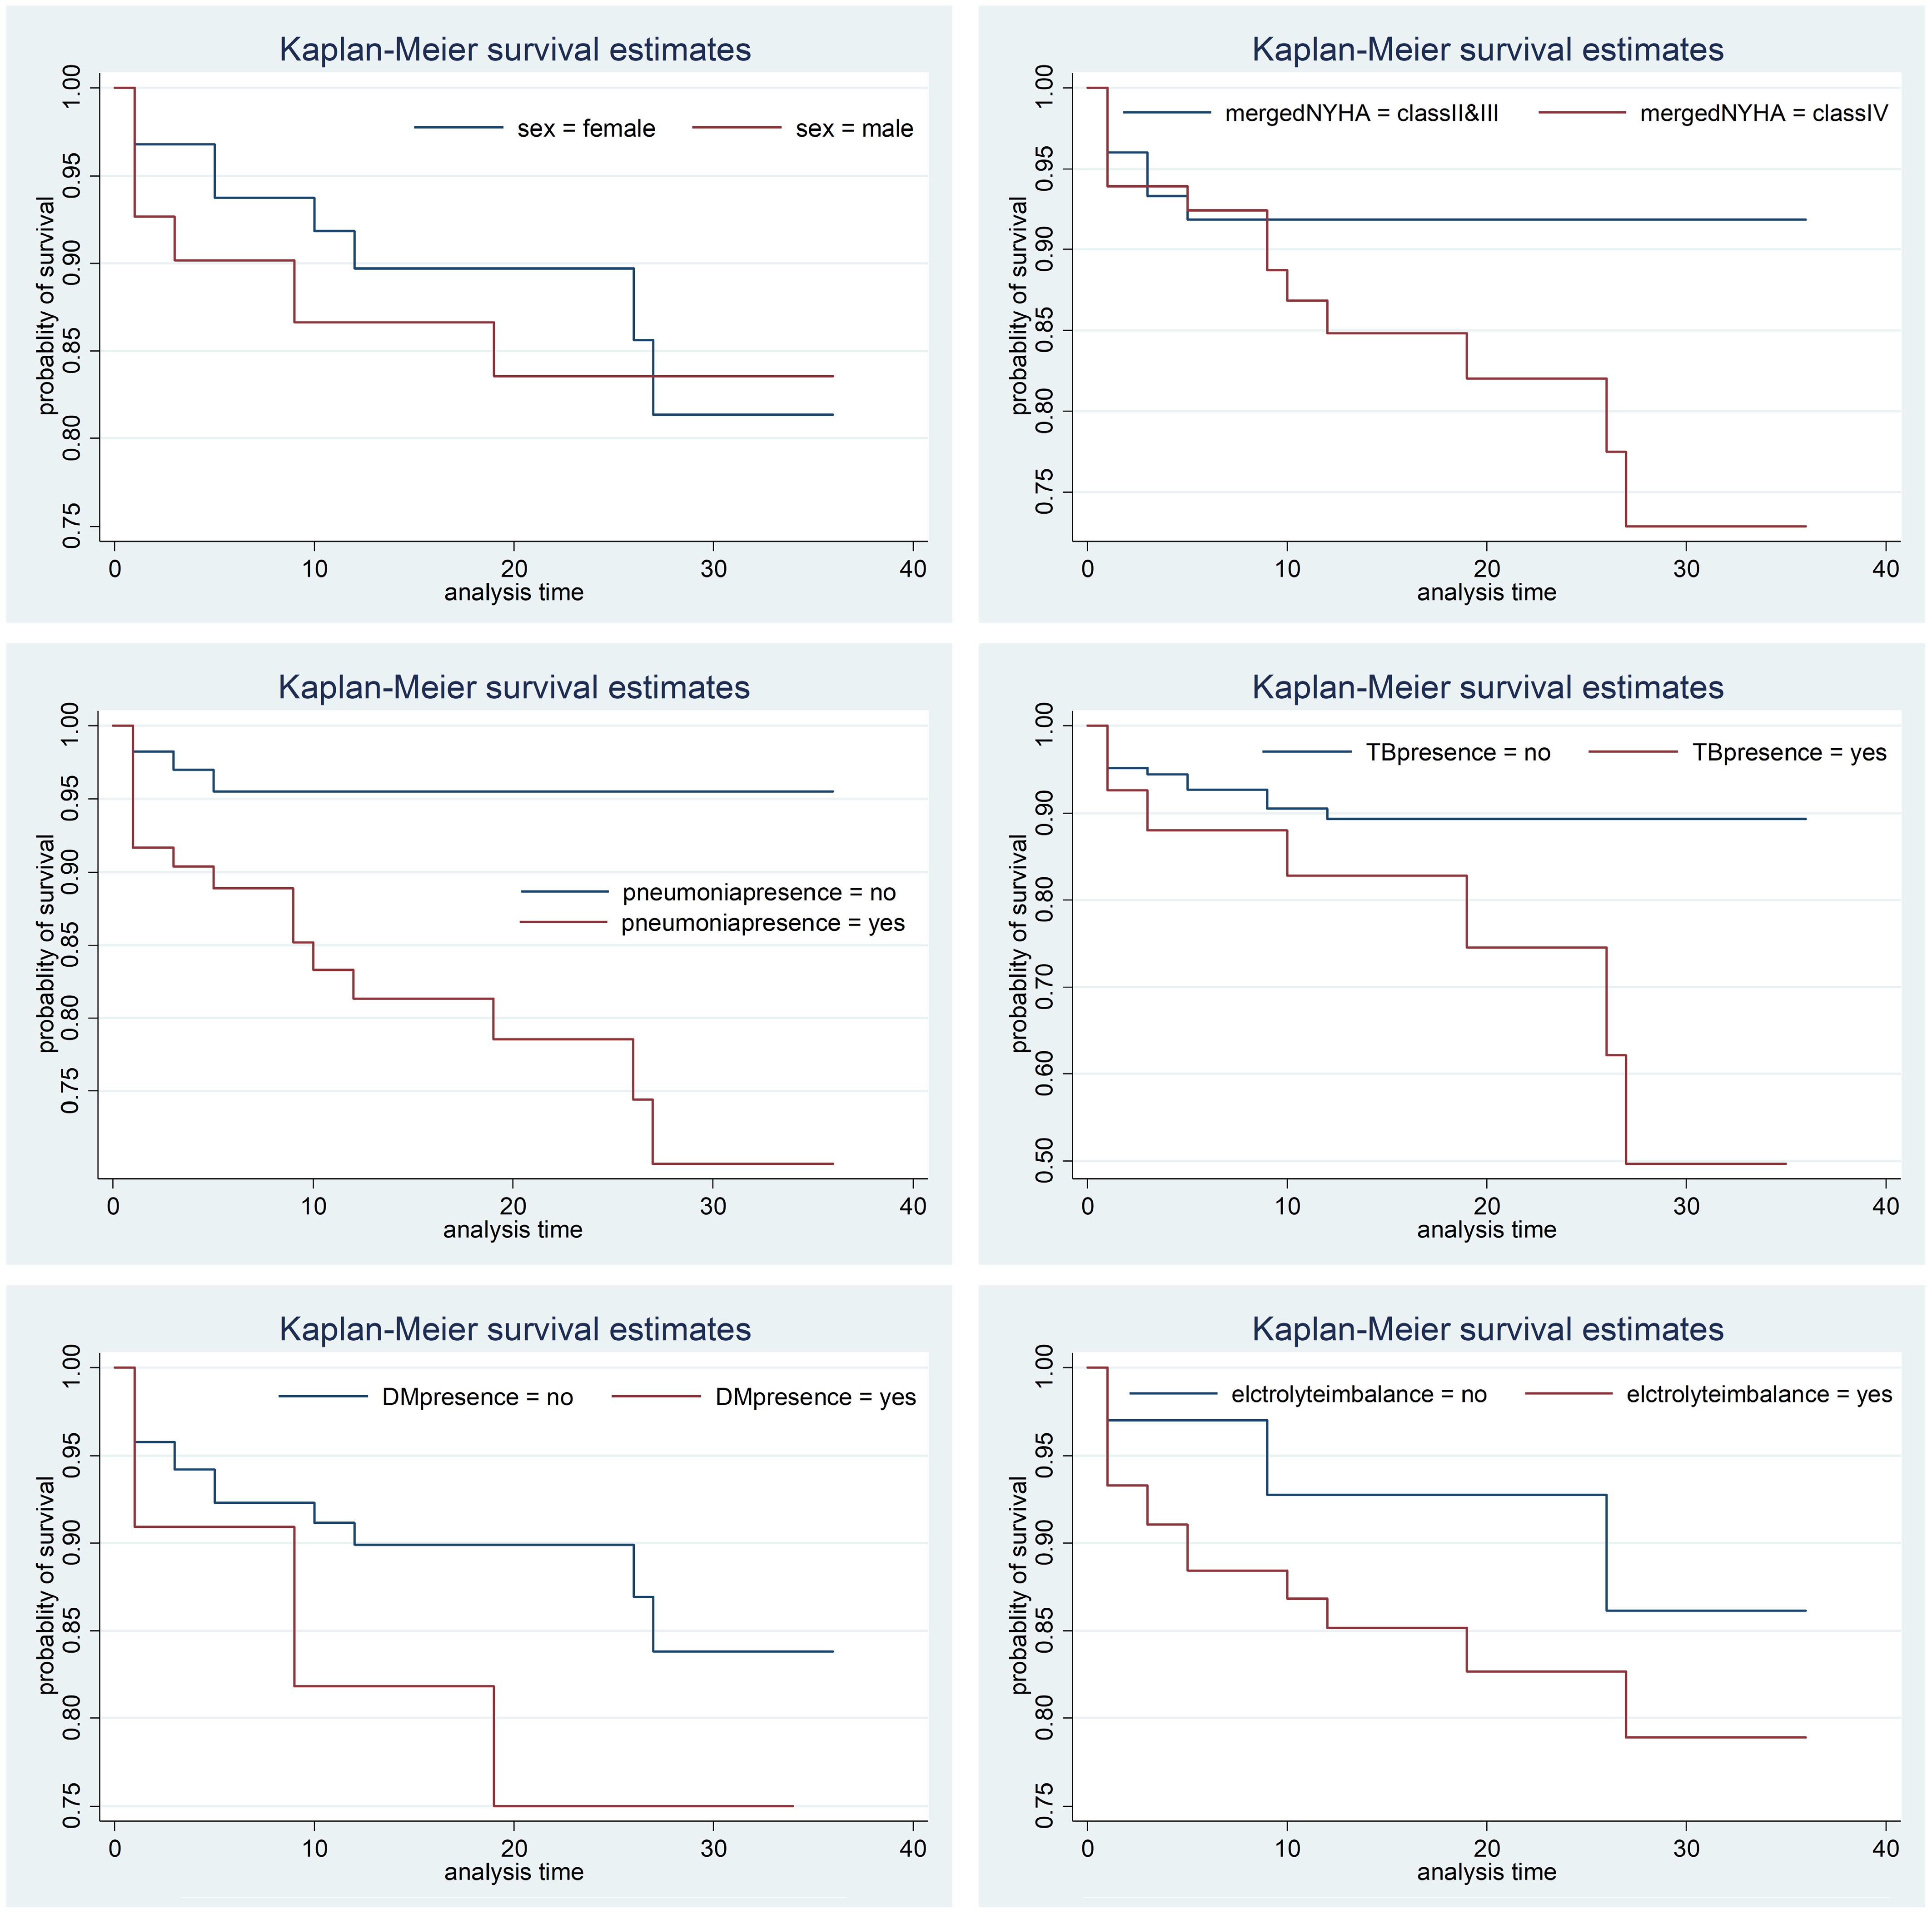
Figure 2.
Plot of Kaplan-Meier estimates for different predictor parameters.
-
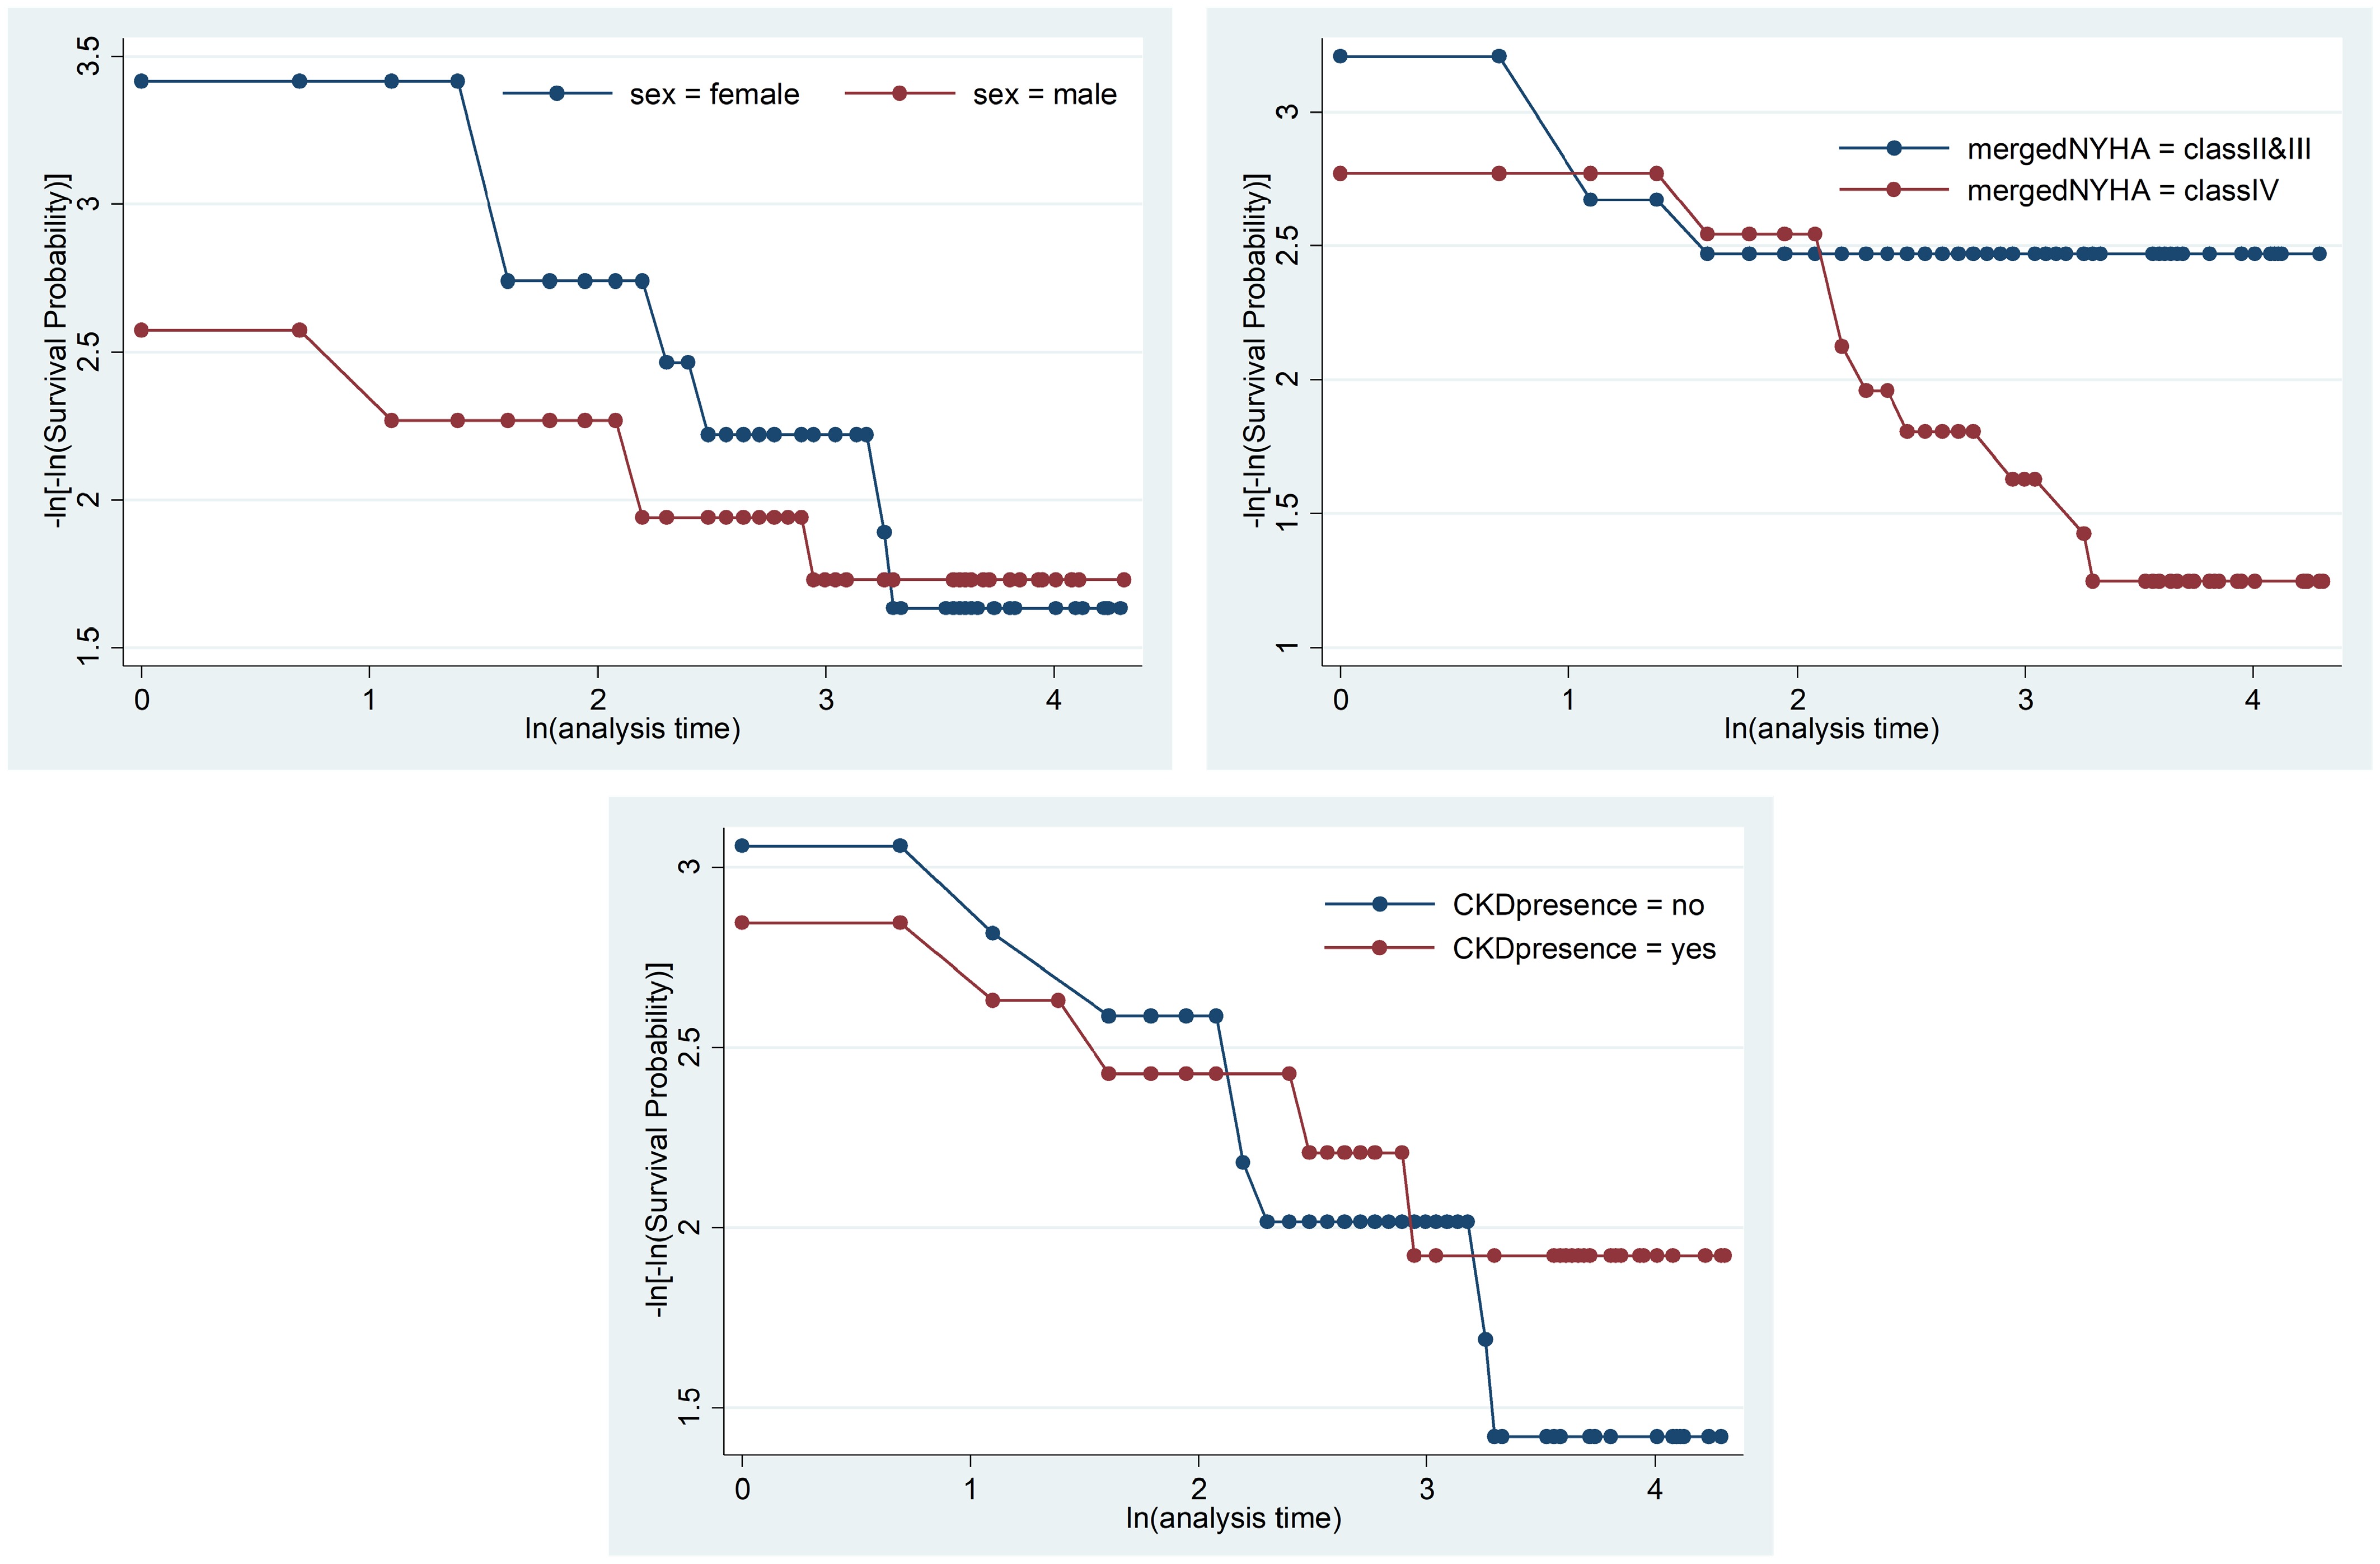
Figure 3.
Check of the proportional hazard assumption using a graphical method.
-
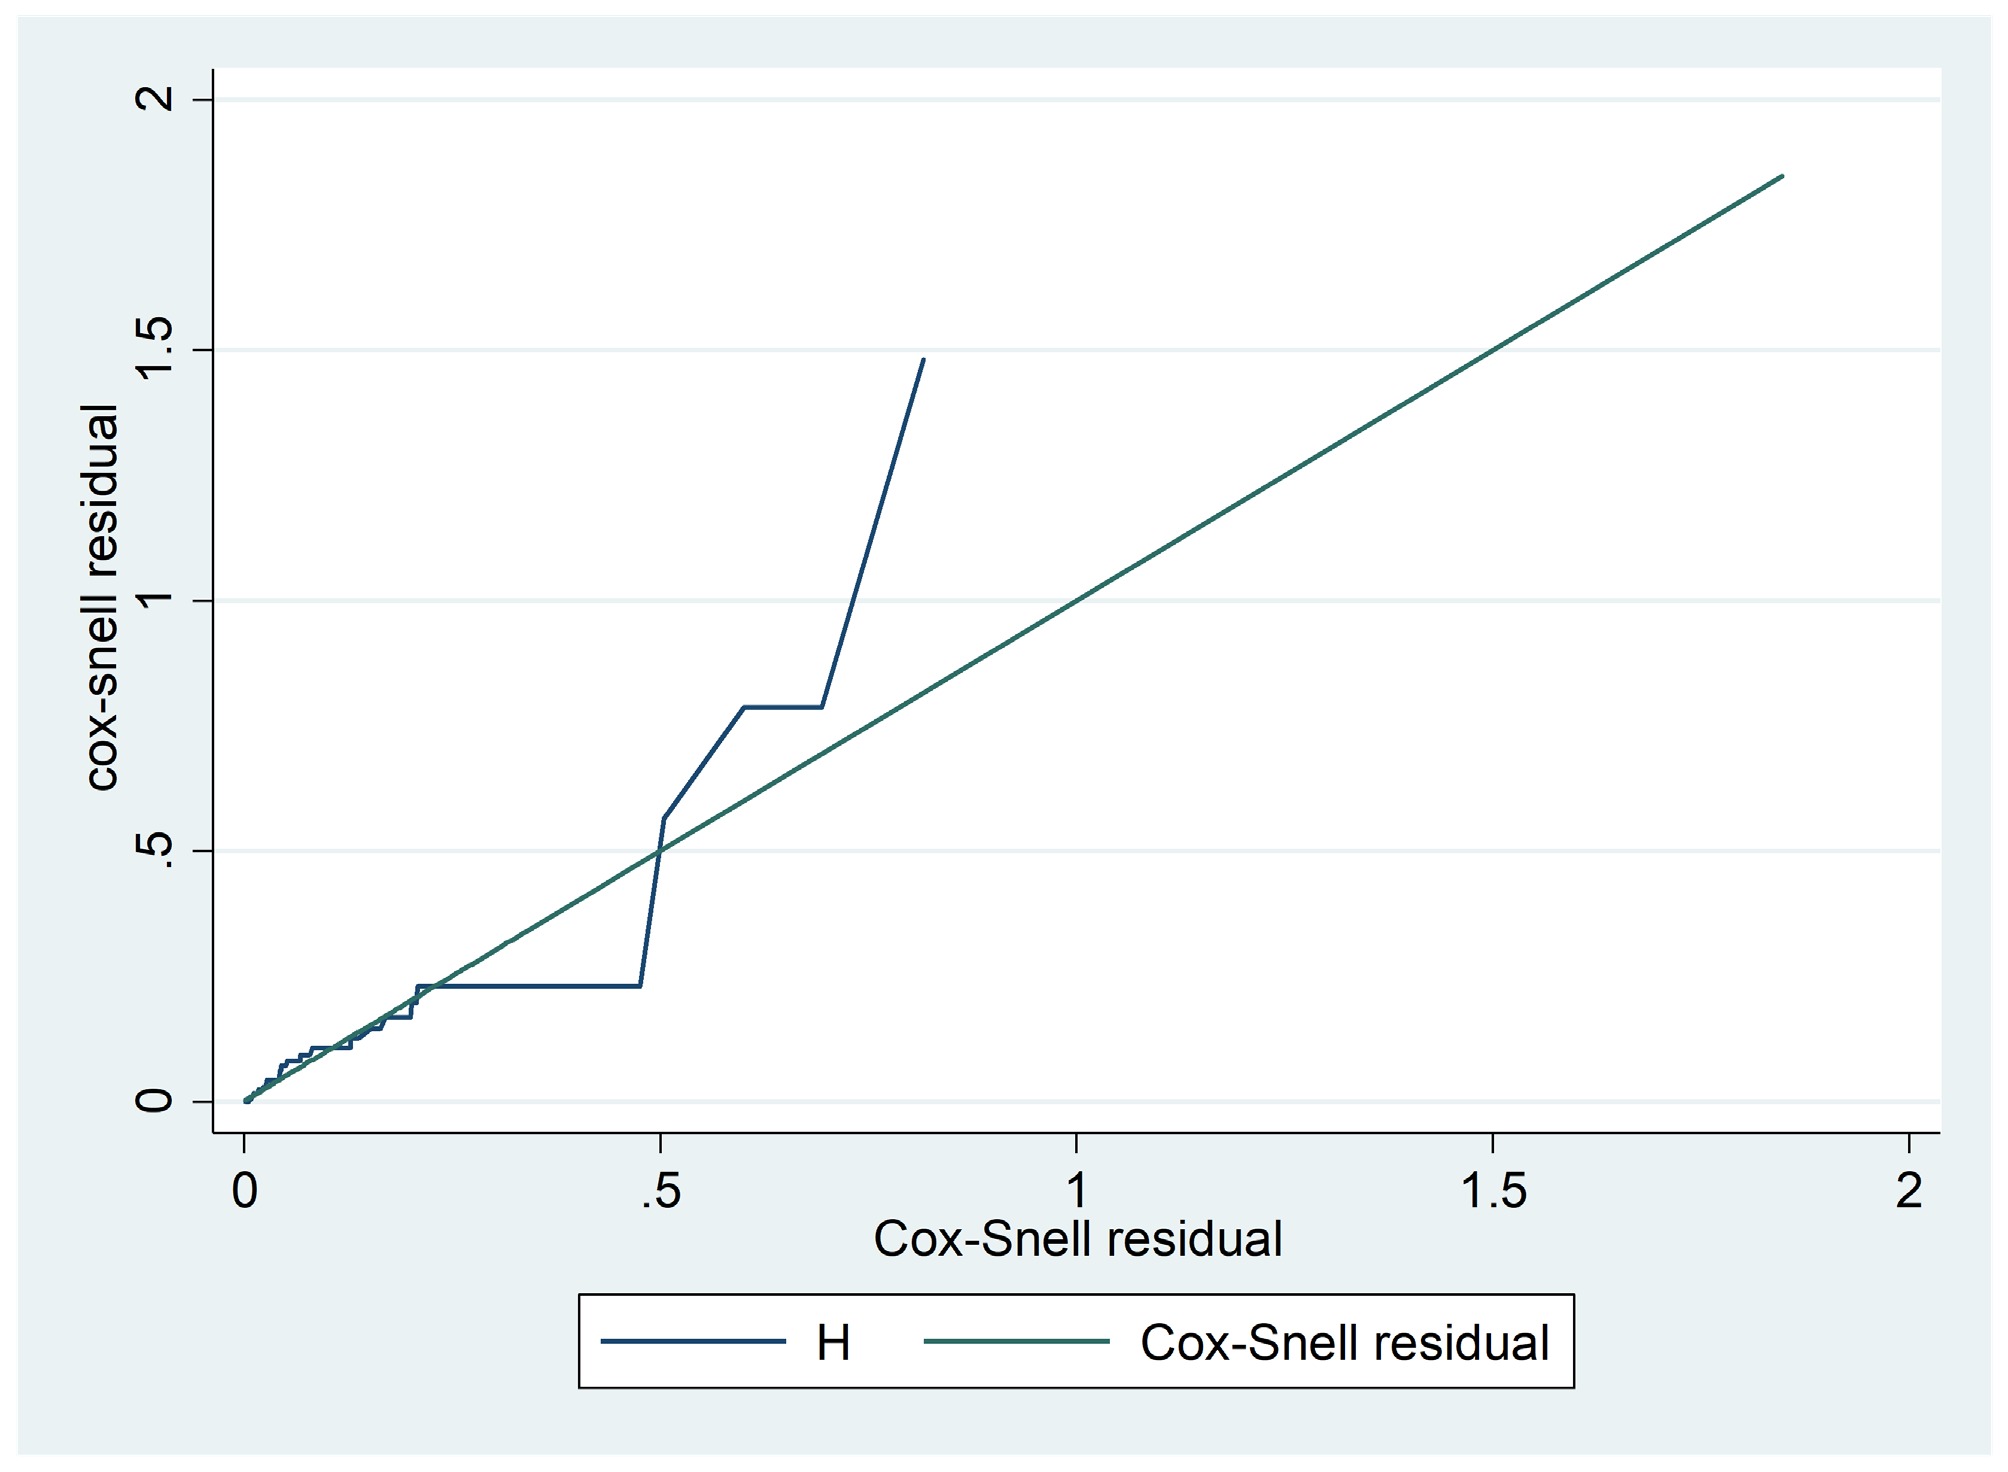
Figure 4.
Cox Snell residual for Weibull distribution.
-
Model Mathematical expression Definition Cox Proportional Hazards[25] $ h(t|X) = h_0(t) \cdot e^{\beta^T X} $ h(t|X): Hazard function; h0(t): Baseline hazard; β: Regression coefficients. Accelerated Failure Time (AFT) Models Exponential[31] $ T_i = \exp(\beta^T X_i + \epsilon_i) $ Ti: Survival time; Xi: Covariates; εi: Error term. Weibull[32] $ T_i = \exp(\beta^T X_i + \epsilon_i)^{1/\gamma} $ γ: Weibull shape parameter; other terms as defined above. Log-normal[33] $ \log(T_i) = \beta^T X_i + \epsilon_i $ Log-transformed survival model; definitions as above. Log-logistic[34] $ T_i = \left[\exp(-(\beta^T X_i + \epsilon_i))\right]^{-1/\gamma} $ γ: Log-logistic shape parameter; other terms as defined above. Table 1.
Summary of survival models used in the present study.
-
Variable Categories Total (%) Censored Died Sex Female 124 (50.8%) 113 (91.9%) 11 (8.1%) Male 109 (49.2%) 97 (88.1%) 12 (11.9%) NYHA class Class II & III 101 (41.4%) 93 (93.1%) 8 (6.9%) Class IV 132 (58.6%) 116 (87.9%) 16 (12.1%) Hypertension Yes 184 (75.4%) 171 (92.9%) 13 (7.1%) No 49 (24.6%) 39 (79.6%) 10 (20.4%) Chronic kidney disease Yes 124 (53.2%) 112 (91.1%) 12 (8.9%) No 109 (46.8%) 97 (89.0%) 12 (11.0%) TB Yes 27 (11.1%) 19 (74.1%) 8 (25.9%) No 206 (88.9%) 189 (92.2%) 17 (7.8%) Pneumonia Yes 120 (48.7%) 100 (84.2%) 20 (15.8%) No 113 (51.3%) 109 (96.5%) 4 (3.5%) Diabetes mellitus Yes 44 (18.0%) 36 (84.1%) 8 (15.9%) No 189 (82.0%) 173 (91.5%) 16 (8.5%) Electrolyte imbalance Yes 134 (57.5%) 117 (87.3%) 17 (12.7%) No 99 (42.5%) 93 (93.9%) 6 (6.1%) Overall 233 (100%) 209 (90.0%) 24 (10.0%) Table 2.
Characteristics of demographic variables.
-
Variable Min. Max. 1st Qu. (25%) Median (50%) 3rd Qu. (75%) Time (m) 1 36 2 6 18 Age (y) 19 90 40 59 70 Table 3.
Summary statistics of time-to-death and age of HF patients.
-
Covariates DF Chi-square p-value Sex 1 0.68 0.4080 NYHA class 1 2.42 0.1198 Hypertension 1 9.81 0.0017 Chronic kidney disease 1 0.13 0.7140 TB 1 6.28 0.0122 Pneumonia 1 10.28 0.0013 Diabetes mellitus 1 1.76 0.1841 Electrolyte imbalance 1 2.58 0.1081 Table 4.
Results of the log-rank test for each category variable.
-
Models AIC BIC Log likelihood Exponential 197.510 221.64 −91.755 Weibull 193.851 221.42 −88.926 Log-logistic 195.293 222.87 −89.646 Log-normal 194.772 222.34 −89.386 Table 5.
AIC, BIC, and log likelihood.
-
Model Covariate $ \hat{\beta}_j $ S.E p-value Cox Sex (male) −0.491 0.660 0.457 NYHA class IV −1.167 0.710 0.100 Hypertension (yes) 1.937 0.694 0.005 Pneumonia (yes) 2.472 0.939 0.008 Chronic kidney disease (yes) 0.152 0.650 0.815 TB (yes) 1.575 0.784 0.045 Diabetes mellitus (yes) 0.913 0.722 0.206 Electrolyte imbalance (yes) 1.191 0.768 0.121 Exponential NYHA class IV 0.521 0.478 0.275 Hypertension (yes) 1.705 0.483 0.000 Pneumonia (yes) −1.733 0.601 0.004 TB (yes) −0.160 0.490 0.744 Diabetes mellitus (yes) −1.035 0.474 0.029 Electrolyte imbalance (yes) −1.139 0.550 0.038 Log-logistic NYHA class IV 0.779 0.697 0.264 Hypertension (yes) 1.954 0.793 0.014 Pneumonia (yes) −1.941 0.804 0.016 TB (yes) 1.048 0.853 0.219 Diabetes mellitus (yes) 1.093 0.784 0.163 Electrolyte imbalance (yes) −1.750 0.834 0.036 Log-normal NYHA class IV −0.779 0.697 0.264 Hypertension (yes) 1.954 0.793 0.014 Pneumonia (yes) −1.941 0.804 0.016 TB (yes) −1.048 0.853 0.219 Diabetes mellitus (yes) −1.093 0.784 0.163 Electrolyte imbalance (yes) −1.750 0.834 0.036 Weibull NYHA class IV −0.697 0.690 0.312 Hypertension (yes) 2.240 0.742 0.003 Pneumonia (yes) −2.270 0.900 0.012 TB (yes) −0.593 0.741 0.423 Diabetes mellitus (yes) −1.399 0.714 0.050 Electrolyte imbalance (yes) −1.600 0.815 0.050 Intercept (constant) 7.561 1.352 0.000 Table 6.
Parameter estimates and p-values for different models.
-
Covariate $ \hat{\beta}_j $ SE $ \hat{\phi}_j $ p-value 95% CI for $ \phi $ LCL UCL NYHA class Class II & III Ref Class IV −0.697 0.690 0.498 0.312 0.129 1.927 Hypertension No Ref Yes 2.240 0.742 9.393 0.003 2.192 40.246 Pneumonia No Ref Yes −2.270 0.900 0.103 0.012 0.018 0.603 TB No Ref Yes −0.593 0.741 0.553 0.423 0.129 2.358 Diabetes
mellitusNo Ref Yes −1.399 0.714 0.247 0.050 0.061 0.999 Electrolyte
imbalanceNo Ref Yes −1.600 0.815 0.202 0.050 0.041 0.998 Intercept
(constant)7.561 1.352 1921.77 0.000 Log likelihood = −88.926, AIC = 193.851, ρ (shape parameter) = 1.458. Table 7.
Maximum likelihood parameter estimate of the Weibull AFT model.
Figures
(4)
Tables
(7)