


-
Heart failure (HF) has had serious global impacts, affecting 64.3 million people worldwide in 2017, making it a major global concern[1]. Each year, an estimated 287,000 deaths are caused by HF, making it among the fastest-growing illnesses[2,3]. The growing prevalence of this condition in both developed and developing countries[4,5] places a significant burden on health systems[6,7]. HF has also significantly affected societies and economies around the world[8], with an increasing burden in Africa. In Sub-Saharan Africa, a large portion of the population consists of children and young adults, comprising two-thirds of the population[9]. CHF ranges from 0.3% to 12% in Nigeria[10], about 35% in Uganda[11], and with a reported prevalence of 13.1% in Cameroon[12]. A systematic review[13] examined the treatment, as well as the prognosis, of adults with HF in Ethiopia, highlighting significant cases of fatality rates. Approximately 18% of residents of sub-Saharan Africa die of HF within 6 months[14], and CHF accounts for 9% of all deaths in Ethiopia. A systematic review[15] indicated that CHF accounts for 4% to 24% of morbidity, 8.9% to 9.8% of admissions to the intensive care unit, and 6.5% to 24% of mortality. In addition, surveillance data analysis has shown that CHF is one of the top three causes of cardiovascular death in Addis Ababa, after hypertension and stroke[16]. HF is rapidly increasing in Ethiopia, and parametric survival models are used to identify predictor variables[17]. Moreover, research has focused on predictor variables associated with depression among HF patients in selected public hospitals in Addis Ababa[18]. The rise in HF in Ethiopia and other African nations highlights the need to assess time to death and relevant predictor variables[18].
Several studies have focused on estimating the time-to-death for patients with HF, highlighting the varying survival rates between different cohorts[19,20]. For instance, research by Taylor et al.[21] analyzed trends in survival following HF diagnosis in the United Kingdom from 2000 to 2017. Another study[22] proposed a population-based approach to capture survival rates among newly diagnosed HF patients. Extending this, Pocock et al.[23] developed a risk score based on a large database, which includes many cohort research outputs to create an easily applicable tool. Additionally, Jackson et al.[24] predicted survival in patients with HF using the Cox Proportional Hazards model. Furthermore, Ahmad et al.[20] conducted a survival analysis of HF patients, although their proposed method was highly based on specific assumptions, and had limitations in the estimation of the parameters.
This paper aims to address these limitations by proposing the AFT method on HF data to analyze the time to mortality, and determine the risk factors using all available information efficiently. Due to the nature of the data, stemming from various sources of patient variation, non of the existing literature to date, to the best of our knowledge, has properly addressed the time to death estimate. Although the concept of both the Cox PH model[25], and AFT[26] is good, the literature on this kind of data set is still limited. Medical research frequently uses time-to-event[27] outcomes as they provide more details rather than imply whether or not an event occurred. Besides, survival analysis techniques[28] should be applied to deal with these outcomes, as well as censored observations if the event was not noticed during follow-up. The observed survival curves can be graphed using Kaplan-Meier estimation, and curves from different groups can be compared using the log-rank test. The use of survival regression methods, such as the Cox PH model or the AFT, including covariates, is necessary simultaneously.
Overall, the key findings of this study are as follows:
(1) AFT models with recently compiled data that include advances in survival techniques are utilized to predict survival times and pinpoint predictors in patients suffering from heart failure. These newly collected data can be made accessible to the public to enhance the development of alternative techniques, and this research will improve both the accuracy of survival data analysis and parameter estimation.
(2) Unlike classical survival methods, the AFT model concentrates on the duration of survival, whereas the Cox model assesses the hazard rate, or the likelihood that the event happens at a particular time.
(3) This study capitalizes on the AFT model's efficiency, as AFT models typically provide faster computation for parameter estimation due to their simpler structure, especially when compared to the classical survival approach, particularly the Cox method.
(4) Employing AFT models enhances parameter estimation in heart failure patient data when the emphasis is on directly modeling survival times rather than hazard rates.
(5) The AFT demonstrates remarkable flexibility in handling new survival data, and accurately estimating the model's parameters. The present findings indicate that the present approach outperforms current leading techniques.
-
In this study, data obtained from Saint Peter's Specialized Hospital, Ethiopia was used. Retrospective analysis was conducted on data from 233 patients who were treated from January 1, 2020, to December 31, 2022. The data includes patients with CHF who had at least three pulse and respiratory rate measurements after the first report of CHF. Data collection from these medical records was conducted after obtaining ethical approval from the research ethical review board on 10 March, 2023. After obtaining ethical approval, access was granted to the information needed to gather all relevant details from the medical records. Moreover, this study does not involve data from clinical trials, distributed questionnaires, or tissue samples. Instead, data was accessed directly from medical records, which contained coded identifiers rather than patient names.
Outcome variables
-
The response variable for this research is the time from the beginning of treatment until death of patients with HF.
Predictor variables
-
The independent variables for this study are a socio-demographic and clinical variable obtained from the patient's medical record, and were selected based on related literature. The predictor variables are age, sex, NYHA classification, hypertension, pneumonia, chronic kidney disease, tuberculosis, diabetes mellitus, and electrolyte imbalance. The findings of this study will serve as a basis for scholars and greatly contribute to the field of survival analysis.
Survival analysis methods
-
In survival data analysis, various models are employed to understand the time-to-event data[29], and to identify factors associated with it. The Cox Proportional Hazards model is often favored for its ability to estimate hazard ratios while assuming proportionality of hazards over time. When the nature of the data is not clustered to estimate the time-to-death, the censoring status for the response variable of time-to-death t is given by:
$ R_{i} = \begin{cases} 1 & \text{if the} \;{\rm{i}}^\text{th} \;{\text{patient is dead}}, \\ 0 & \text{otherwise.} \end{cases} $ (1) where, Ri represents the death status of the ith patient. If the ith patient is dead, Ri takes the value 1; otherwise, it takes the value 0. The appropriate model for this kind of data used to identify the factors associated with it is the Cox Proportional Hazards, given by:
$ h(t|X) = h_0(t) \cdot e^{\beta X} $ (2) where, h(t|X) is the hazard function, h0(t) is the baseline hazard, and β denotes coefficients. However, when this assumption is violated, or when the focus is on the effect of covariates rather than hazard rates, AFT models[30] offer a suitable alternative by directly modeling survival time. If the proportional hazards assumption of the Cox Proportional Hazards model is violated, such that the hazard ratio for any two individuals remains not constant over time, AFT models become a viable alternative, directly to model the effect of covariates on the survival time itself rather than on the hazard rate. The general formula for an AFT model is given by:
$ \log(T_{i}) = \alpha_{i} + \beta_{i} X_{i} + \epsilon_{i} $ (3) where, Ti is the survival time, αi is the intercept, βi is the coefficient associated with the covariate Xi and εi is the error term, which follows a particular distribution. To better understand the work, the models are summarized in Table 1, which highlights the need for using the proposed method compared to baseline methods.
Table 1. Summary of survival models used in the present study.
Model Mathematical expression Definition Cox Proportional Hazards[25] $ h(t|X) = h_0(t) \cdot e^{\beta^T X} $ h(t|X): Hazard function; h0(t): Baseline hazard; β: Regression coefficients. Accelerated Failure Time (AFT) Models Exponential[31] $ T_i = \exp(\beta^T X_i + \epsilon_i) $ Ti: Survival time; Xi: Covariates; εi: Error term. Weibull[32] $ T_i = \exp(\beta^T X_i + \epsilon_i)^{1/\gamma} $ γ: Weibull shape parameter; other terms as defined above. Log-normal[33] $ \log(T_i) = \beta^T X_i + \epsilon_i $ Log-transformed survival model; definitions as above. Log-logistic[34] $ T_i = \left[\exp(-(\beta^T X_i + \epsilon_i))\right]^{-1/\gamma} $ γ: Log-logistic shape parameter; other terms as defined above. Data analysis procedures
-
Data analysis was performed using Stata 19 and R 4.5.2 software to predict the median survival time of patients with HF after understanding the unique characteristics of the data set and methodological precision. Moreover, a statistical summary was used to better present the characteristics of the data, and Kaplan-Meier curves were fitted to learn the time to death, followed by a validation of the Cox model, and the fitting of various survival models. Then, the Gehan-Breslow test was used to compare the survival distributions of two or more groups in survival analysis, highlighting differences in survival times at earlier time points, and helping to determine if there are significant differences in survival experiences.
Subsequently, Cox-Snell residuals are applied to assess the fit of models such as the Cox Proportional Hazards model or an AFT model. By plotting these residuals against the cumulative hazard function, researchers can check for systematic deviations that might indicate poor model fit. It is important to describe the features of the data, and the way the data were collected when performing any statistical analysis. Thus, in this study, the classical Cox and AFT models were used to estimate the time to mortality, and the risk factors associated with patients with HF in Ethiopia were determined. To this end, various information criteria were employed. This evaluation involved assessing the models' performance using metrics such as AIC[35], and BIC[36].
-
In this section, a summary of the results are presented to give readers an overview of the data. The results are then displayed which prove beyond doubt that the proposed methods are better to estimate the median survival time of heart failure patients, and to identify risk factors for heart failure patients in the present study area. Along the way, comparisons with other pre-existing techniques in the literature are highlighted. Finally, the present method is applied to simulated examples to emphasize its advantages, as well as its implications in patients with HF.
Summary of results
-
Here, the descriptive results are discussed to understand the characteristics of the dataset. The median survival time was found to be 6 months, with minimum and maximum survival times of 2 and 18 months, respectively. The median age of patients with HF was 59 years, with ages ranging from 19 to 90 years. Besides, 24 (10%) of the 233 patients with HF died. The survival (censor) time of the patients was right-skewed, with the 25th, 50th, and 75th percentiles being 2, 6, and 18 months, respectively.
Of the 233 CHF patients, 124 (50.8%) were women, and 109 (49.2%) were men. Among female patients, 11 (8.1%) died, while 113 (91.9%) were censored. Of the 101 (41.4%) class II and III patients, eight (6.9%) died, and 93 (93.1%) were censored. Among the 132 (58.6%) class IV patients, 16 (12.1%) experienced an event (death), while the remaining were censored.
Regarding the 124 (53.2%) of patients with chronic kidney disease, 11 (8.9%) died, while the remaining were censored. Additionally, among the 184 (75.4%) CHF patients with hypertension, 13 (7.1%) died, while the remaining were censored. According to the study's findings, 27 (11.1%) patients had tuberculosis (TB), and among those patients, eight (25.9%) died, while the remaining were censored. Furthermore, among the 120 (51.5%) patients affected by pneumonia, 20 (16.7%) died, while 100 (83.3%) were censored. Among the 44 (18.9%) patients with diabetes mellitus, eight (15.9%) died, and 36 (84.1%) were censored. Finally, of the 134 (57.5%) patients who experienced electrolyte imbalance, 17 (12.7%) died (Table 2).
Table 2. Characteristics of demographic variables.
Variable Categories Total (%) Censored Died Sex Female 124 (50.8%) 113 (91.9%) 11 (8.1%) Male 109 (49.2%) 97 (88.1%) 12 (11.9%) NYHA class Class II & III 101 (41.4%) 93 (93.1%) 8 (6.9%) Class IV 132 (58.6%) 116 (87.9%) 16 (12.1%) Hypertension Yes 184 (75.4%) 171 (92.9%) 13 (7.1%) No 49 (24.6%) 39 (79.6%) 10 (20.4%) Chronic kidney disease Yes 124 (53.2%) 112 (91.1%) 12 (8.9%) No 109 (46.8%) 97 (89.0%) 12 (11.0%) TB Yes 27 (11.1%) 19 (74.1%) 8 (25.9%) No 206 (88.9%) 189 (92.2%) 17 (7.8%) Pneumonia Yes 120 (48.7%) 100 (84.2%) 20 (15.8%) No 113 (51.3%) 109 (96.5%) 4 (3.5%) Diabetes mellitus Yes 44 (18.0%) 36 (84.1%) 8 (15.9%) No 189 (82.0%) 173 (91.5%) 16 (8.5%) Electrolyte imbalance Yes 134 (57.5%) 117 (87.3%) 17 (12.7%) No 99 (42.5%) 93 (93.9%) 6 (6.1%) Overall 233 (100%) 209 (90.0%) 24 (10.0%) The median survival for HF patients is 6 months, signifying an extended survival duration. The Kaplan-Meier (KM) approach is employed to predict the survival time distributions for death in each group, while the log-rank test is applied to compare the survival curves of two or more groups. A summary of the results of this are given in Table 3. In addition, plots of the KM curves that illustrate survival and hazard experiences over time, are presented in Fig. 1. The analysis reveals that the probability of survival is highest during the first month following CHF diagnosis, subsequently decreasing as the follow-up duration progresses. In addition, the probability of experiencing a hazard drops to the lowest immediately after CHF diagnosis but increases as the follow-up time increases. This trend clearly highlights the dynamic nature of survival, and the probability of hazard in CHF patients over time.
Table 3. Summary statistics of time-to-death and age of HF patients.
Variable Min. Max. 1st Qu. (25%) Median (50%) 3rd Qu. (75%) Time (m) 1 36 2 6 18 Age (y) 19 90 40 59 70 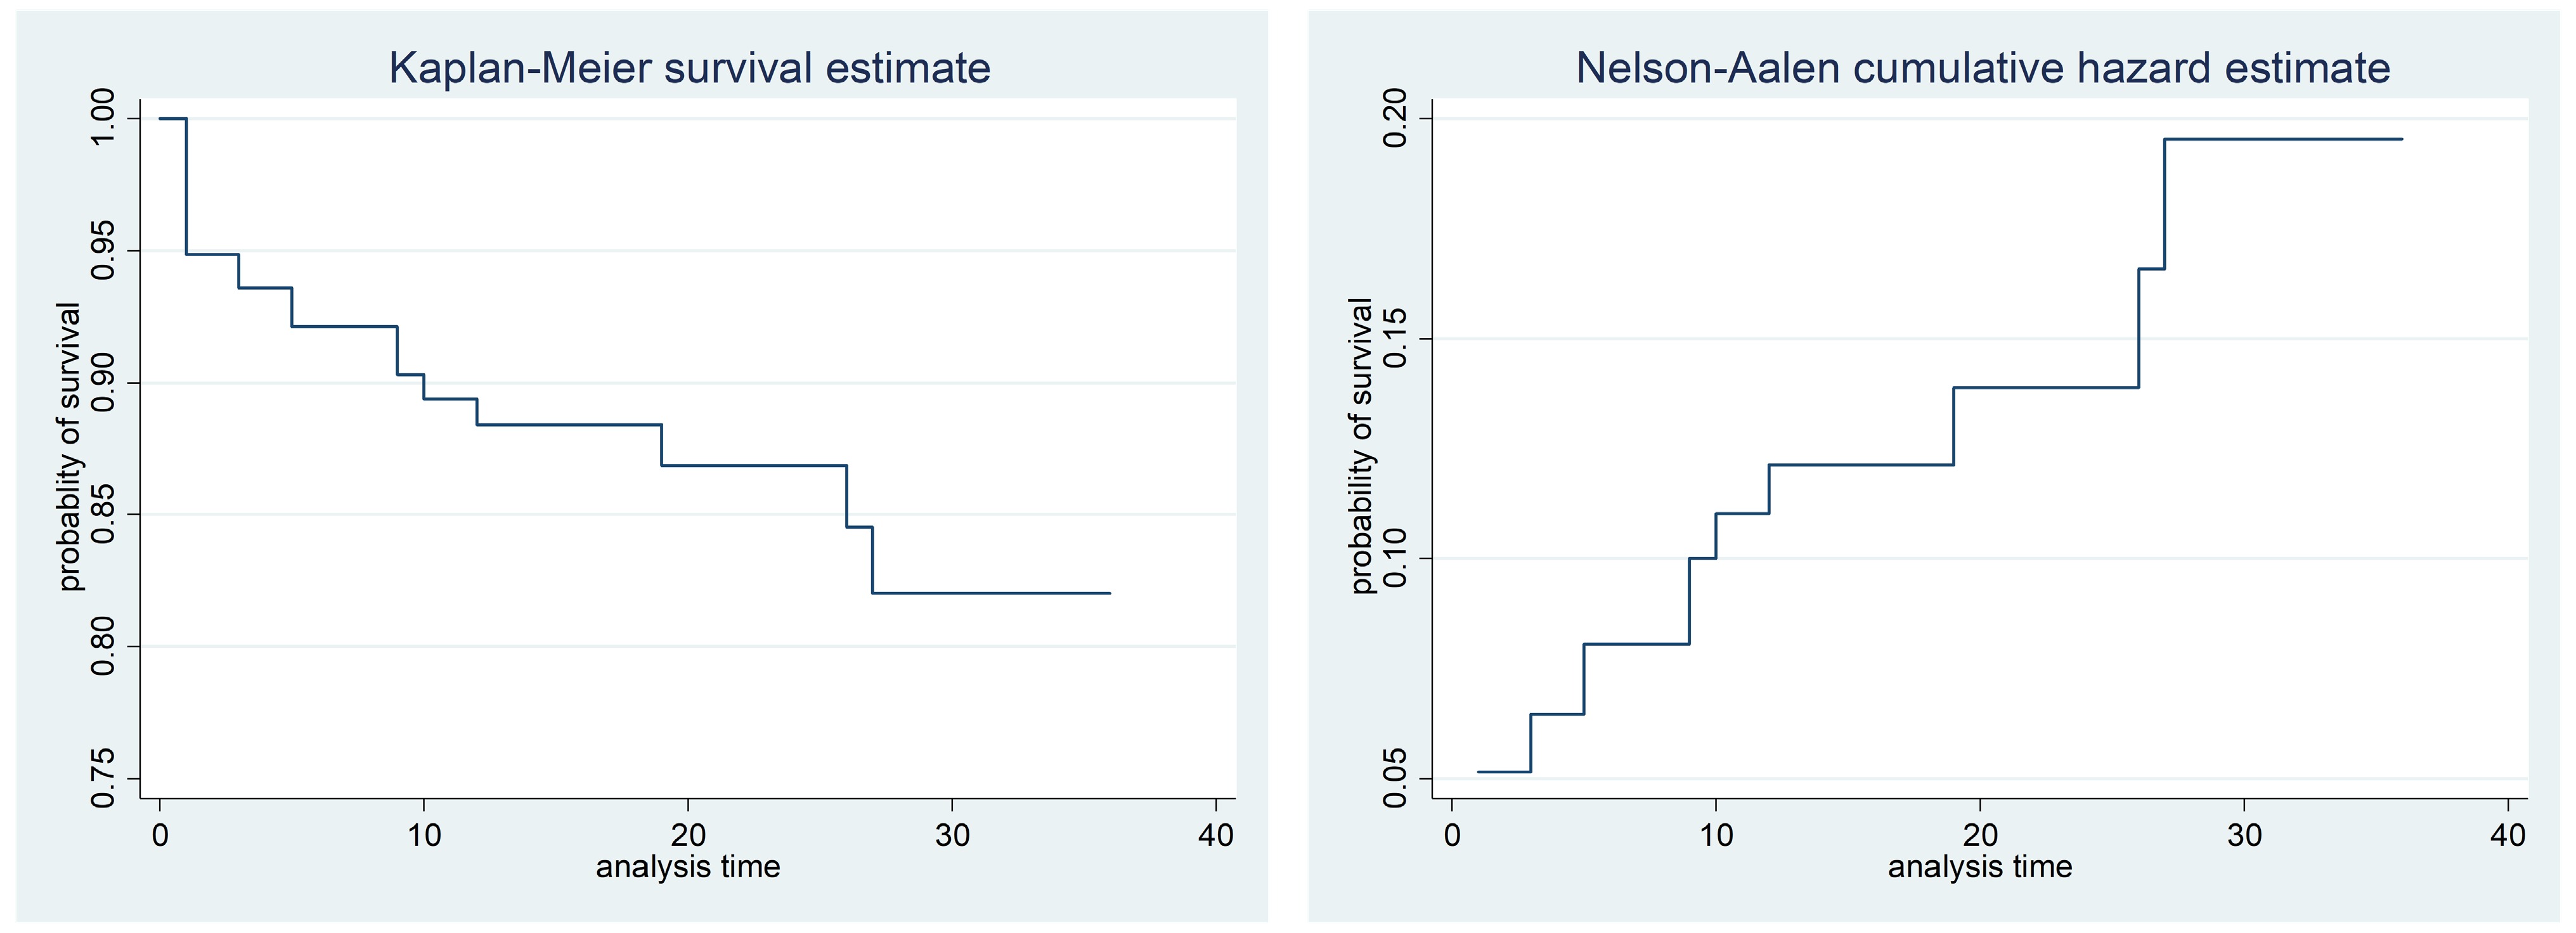
Figure 1.
The K-M of survival and hazard functions plot of the time to death of CHF patients.
The differences displayed in the survival curves underscore that the probability of survival for female CHF patients is relatively shorter than that of male CHF patients over time. Figure 2 illustrates that CHF patients diagnosed in NYHA classes II and III have a higher probability of survival compared to those in NYHA class IV. In addition, survival curves indicate that CHF patients without pneumonia have a higher probability of survival than those with pneumonia. Similarly, patients without TB exhibit a higher probability of survival than those with TB. Figure 2 also shows that CHF patients with diabetes mellitus (DM) have a lower probability of survival compared to those without DM. Furthermore, the curves reveal that patients with CHF who do not experience electrolyte imbalance have a higher probability of survival than those who do. These findings highlight the significant impact of various comorbid conditions on the survival probabilities of CHF patients, highlighting the need for targeted medical interventions and management strategies. Finally, survival analysis indicates that CHF patients without electrolyte imbalance had a significantly higher probability of survival than those with electrolyte imbalance.
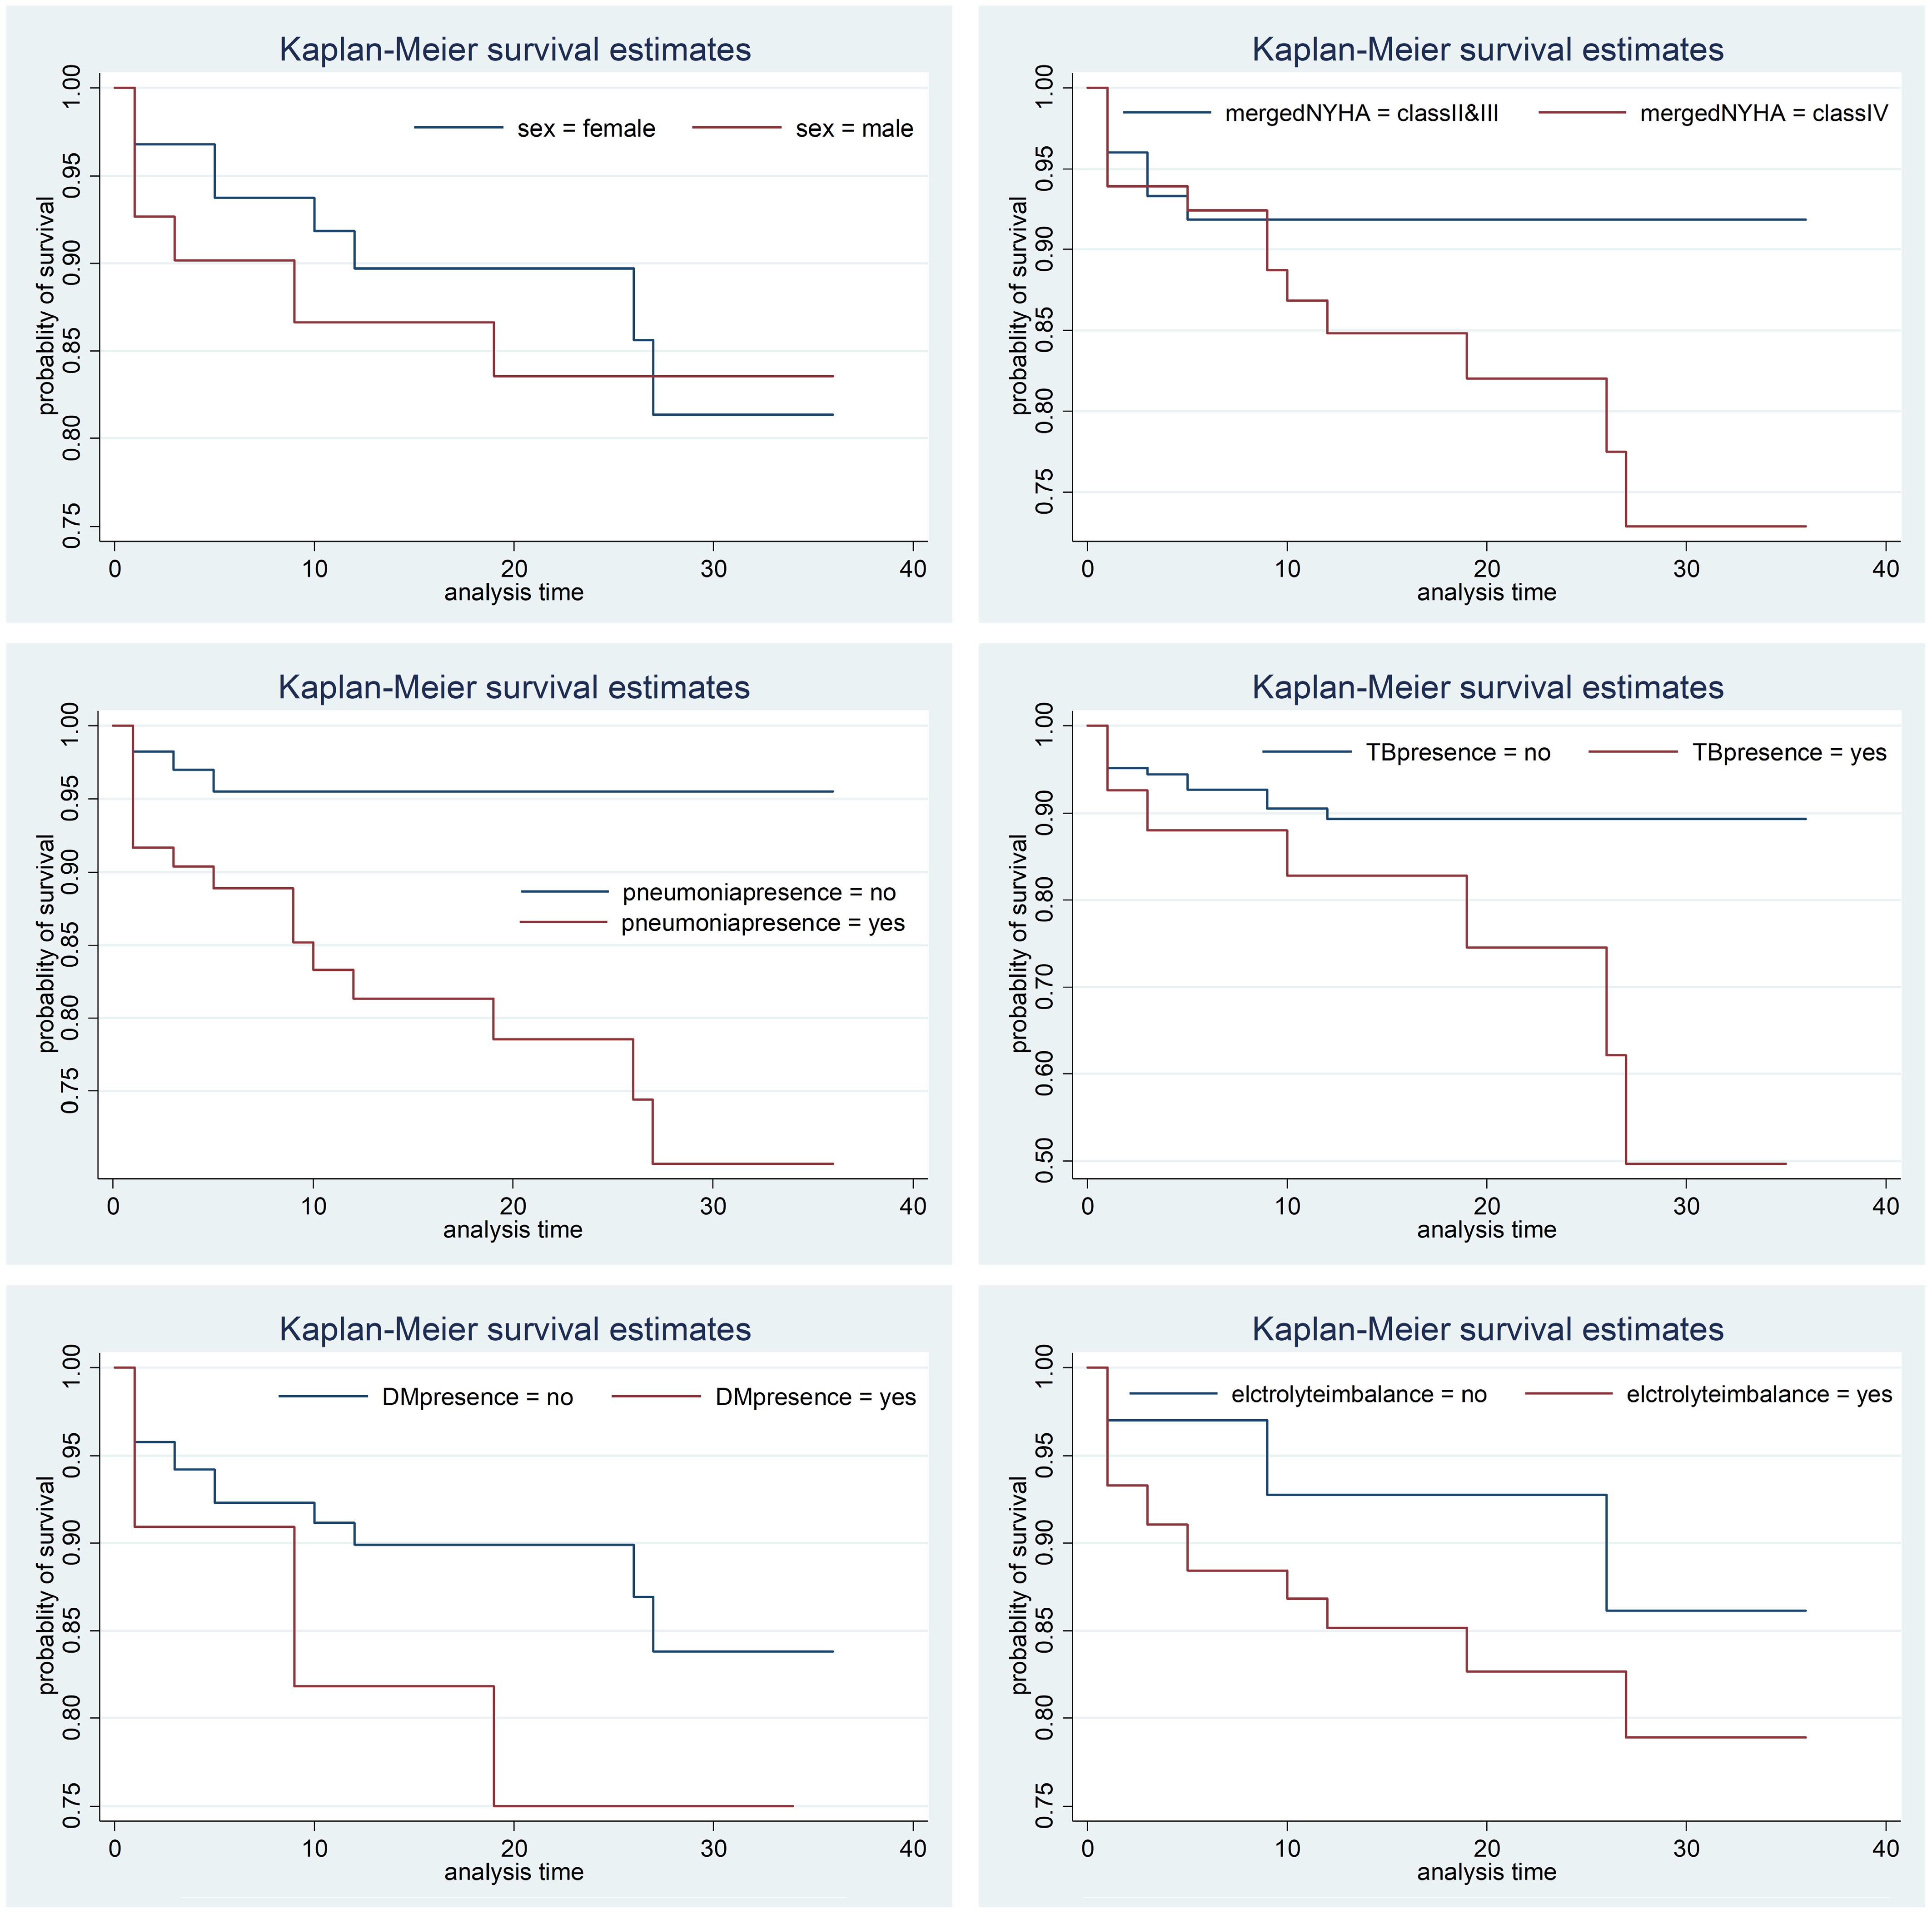
Figure 2.
Plot of Kaplan-Meier estimates for different predictor parameters.
In this study, the log-rank statistical test was utilized to compare the survival time differences among various factors, as estimated by the Kaplan-Meier survivor functions. The log-rank test did not show statistically significant differences in survival according to sex, NYHA class, chronic kidney disease (CKD), DM, and electrolyte imbalance. However, it revealed significant differences in survival outcomes for CHF patients with hypertension, pneumonia, and tuberculosis. This implies that effective treatment or intervention in these conditions can substantially improve survival rates (Table 4).
Table 4. Results of the log-rank test for each category variable.
Covariates DF Chi-square p-value Sex 1 0.68 0.4080 NYHA class 1 2.42 0.1198 Hypertension 1 9.81 0.0017 Chronic kidney disease 1 0.13 0.7140 TB 1 6.28 0.0122 Pneumonia 1 10.28 0.0013 Diabetes mellitus 1 1.76 0.1841 Electrolyte imbalance 1 2.58 0.1081 In Fig. 3, the estimated survival times for the three groups are not parallel, indicating a violation of the assumption of proportional hazards. Consequently, a parametric survival model was used, which is detailed in the next section. As in the study by May & Hosmer[37], any covariate with a p-value less than 0.25 should be in the multivariate analysis following the univariate analysis as a screening tool. A univariate analysis was first conducted to assess the significance of each covariate on the time to death. Various parametric survival models were applied to covariates with p-values less than 0.25, and NYHA class, hypertension (HTN), pneumonia, tuberculosis (TB), and electrolyte imbalance identified as significant at the 25% level. Additionally, in the exponential, Weibull, log-normal, and log-logistic models, the confidence intervals of the acceleration factors for all significant covariates did not include 1, it confirms their significance in influencing time-to-death. Based on these findings, the variables sex, age, and CKD were excluded, and multivariable analysis was performed using the six significant variables identified earlier. The goal of this analysis was to investigate the impact of these factors on the time to death in CHF patients (Table 4). By including all risk factors identified in the univariate analysis at the 5% level of significance, multivariable analyses was fitted using exponential, Weibull, log-normal, and log-logistic parametric models. The presence of hypertension (HTN), pneumonia, and electrolyte imbalance was significant at the 5% level in all multivariate models. These models were compared using AIC and log likelihood values (Table 5). The model with the lowest AIC value, and the highest log likelihood value is considered the best fit. Among the four models, the Weibull model had the lowest AIC value of 193.851, and the highest log likelihood value of −88.926. This shows that the Weibull model is the most appropriate for representing the available data set of CHF patients (Table 5).
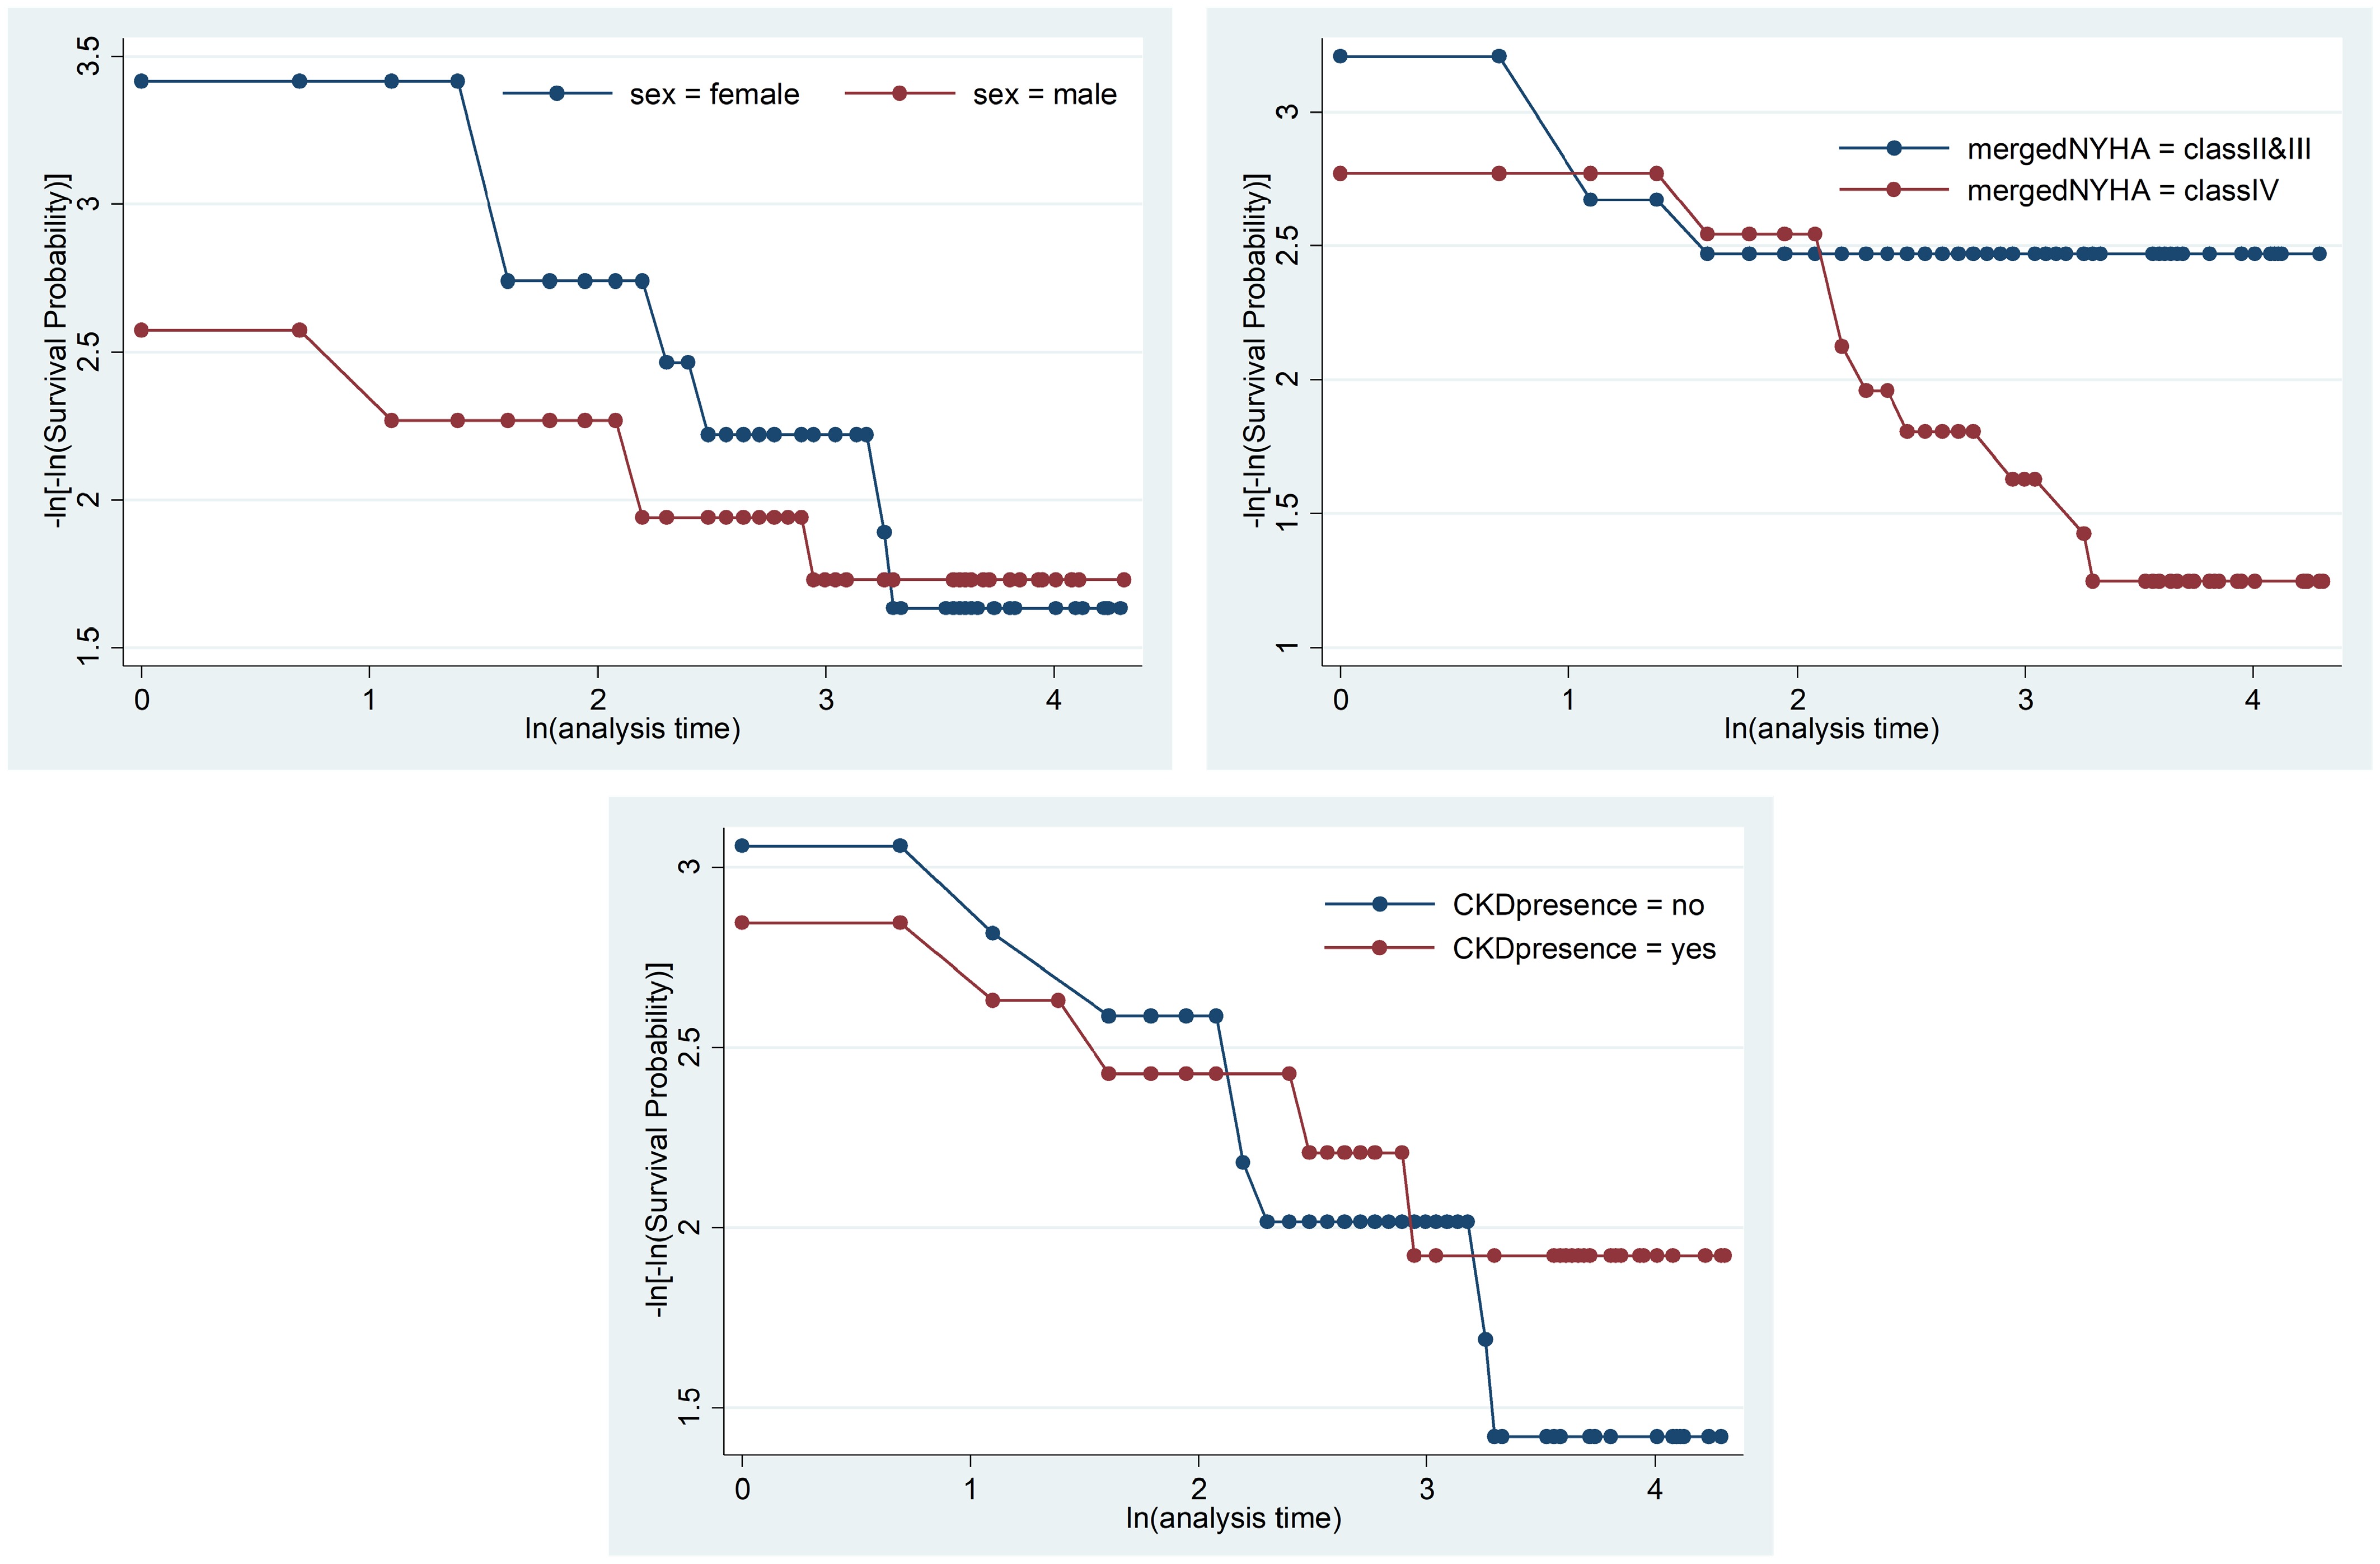
Figure 3.
Check of the proportional hazard assumption using a graphical method.
Table 5. AIC, BIC, and log likelihood.
Models AIC BIC Log likelihood Exponential 197.510 221.64 −91.755 Weibull 193.851 221.42 −88.926 Log-logistic 195.293 222.87 −89.646 Log-normal 194.772 222.34 −89.386 The estimated acceleration factor for CHF patients with HTN is 9.393, according to the Weibull AFT model, with a confidence interval of 95% (2.192, 40.246). The confidence interval does not include one, and the significant p-value 0.003, which indicates that CHF patients with HTN did not reveal a notable difference in results when compared to those without HTN. The findings of the present study are similar to those reported in the study by Jin et al.[38].
Patients with pneumonia had a shorter survival time than those without, with an acceleration factor of 0.103 (95% confidence interval: 0.018, 0.603, p = 0.012). For CHF patients, the acceleration factor for those with DM was 2.47 (95% CI: 0.061, 0.999), indicating that CHF patients without DM have longer survival times than those with DM (p = 0.050). This result is consistent with the study by Li et al.[39].
The result of the classical survival with all the AFT models is presented in Table 6, with the standard error of the regression coefficient in Cox being higher compared to the AFT models. Similarly, most of the variables found to be insignificant in Cox became significant in the AFT models. Another interesting finding of the best model is that it has less standard error in estimating the parameter, unlike the AFT models, and most of the variables involved are found significant at the 5% level of significance. For CHF patients with electrolyte imbalance (either increased or decreased sodium [Na] or potassium [K]), the acceleration factor was 0.202 (95% CI: 0.041, 0.998), using patients without electrolyte imbalance as the reference category. This result indicates that CHF patients without electrolyte imbalance have a longer survival time than those with the imbalance (p = 0.050). The shape parameter of the Weibull model is 1.458, indicating a unimodal hazard function. This suggests that the hazard rate increases with time (Table 7).
Table 6. Parameter estimates and p-values for different models.
Model Covariate $ \hat{\beta}_j $ S.E p-value Cox Sex (male) −0.491 0.660 0.457 NYHA class IV −1.167 0.710 0.100 Hypertension (yes) 1.937 0.694 0.005 Pneumonia (yes) 2.472 0.939 0.008 Chronic kidney disease (yes) 0.152 0.650 0.815 TB (yes) 1.575 0.784 0.045 Diabetes mellitus (yes) 0.913 0.722 0.206 Electrolyte imbalance (yes) 1.191 0.768 0.121 Exponential NYHA class IV 0.521 0.478 0.275 Hypertension (yes) 1.705 0.483 0.000 Pneumonia (yes) −1.733 0.601 0.004 TB (yes) −0.160 0.490 0.744 Diabetes mellitus (yes) −1.035 0.474 0.029 Electrolyte imbalance (yes) −1.139 0.550 0.038 Log-logistic NYHA class IV 0.779 0.697 0.264 Hypertension (yes) 1.954 0.793 0.014 Pneumonia (yes) −1.941 0.804 0.016 TB (yes) 1.048 0.853 0.219 Diabetes mellitus (yes) 1.093 0.784 0.163 Electrolyte imbalance (yes) −1.750 0.834 0.036 Log-normal NYHA class IV −0.779 0.697 0.264 Hypertension (yes) 1.954 0.793 0.014 Pneumonia (yes) −1.941 0.804 0.016 TB (yes) −1.048 0.853 0.219 Diabetes mellitus (yes) −1.093 0.784 0.163 Electrolyte imbalance (yes) −1.750 0.834 0.036 Weibull NYHA class IV −0.697 0.690 0.312 Hypertension (yes) 2.240 0.742 0.003 Pneumonia (yes) −2.270 0.900 0.012 TB (yes) −0.593 0.741 0.423 Diabetes mellitus (yes) −1.399 0.714 0.050 Electrolyte imbalance (yes) −1.600 0.815 0.050 Intercept (constant) 7.561 1.352 0.000 Table 7. Maximum likelihood parameter estimate of the Weibull AFT model.
Covariate $ \hat{\beta}_j $ SE $ \hat{\phi}_j $ p-value 95% CI for $ \phi $ LCL UCL NYHA class Class II & III Ref Class IV −0.697 0.690 0.498 0.312 0.129 1.927 Hypertension No Ref Yes 2.240 0.742 9.393 0.003 2.192 40.246 Pneumonia No Ref Yes −2.270 0.900 0.103 0.012 0.018 0.603 TB No Ref Yes −0.593 0.741 0.553 0.423 0.129 2.358 Diabetes
mellitusNo Ref Yes −1.399 0.714 0.247 0.050 0.061 0.999 Electrolyte
imbalanceNo Ref Yes −1.600 0.815 0.202 0.050 0.041 0.998 Intercept
(constant)7.561 1.352 1921.77 0.000 Log likelihood = −88.926, AIC = 193.851, ρ (shape parameter) = 1.458. Finally, as shown in Fig. 4, the cumulative hazard curve of the Cox-Snell residuals for the Weibull AFT model closely follows the unit slope line, showing that the model fits the data very well. This match highlights the model's flexibility, and how easy it is to understand, making it a strong alternative to the Cox PH model, especially when dealing with complicated survival data.
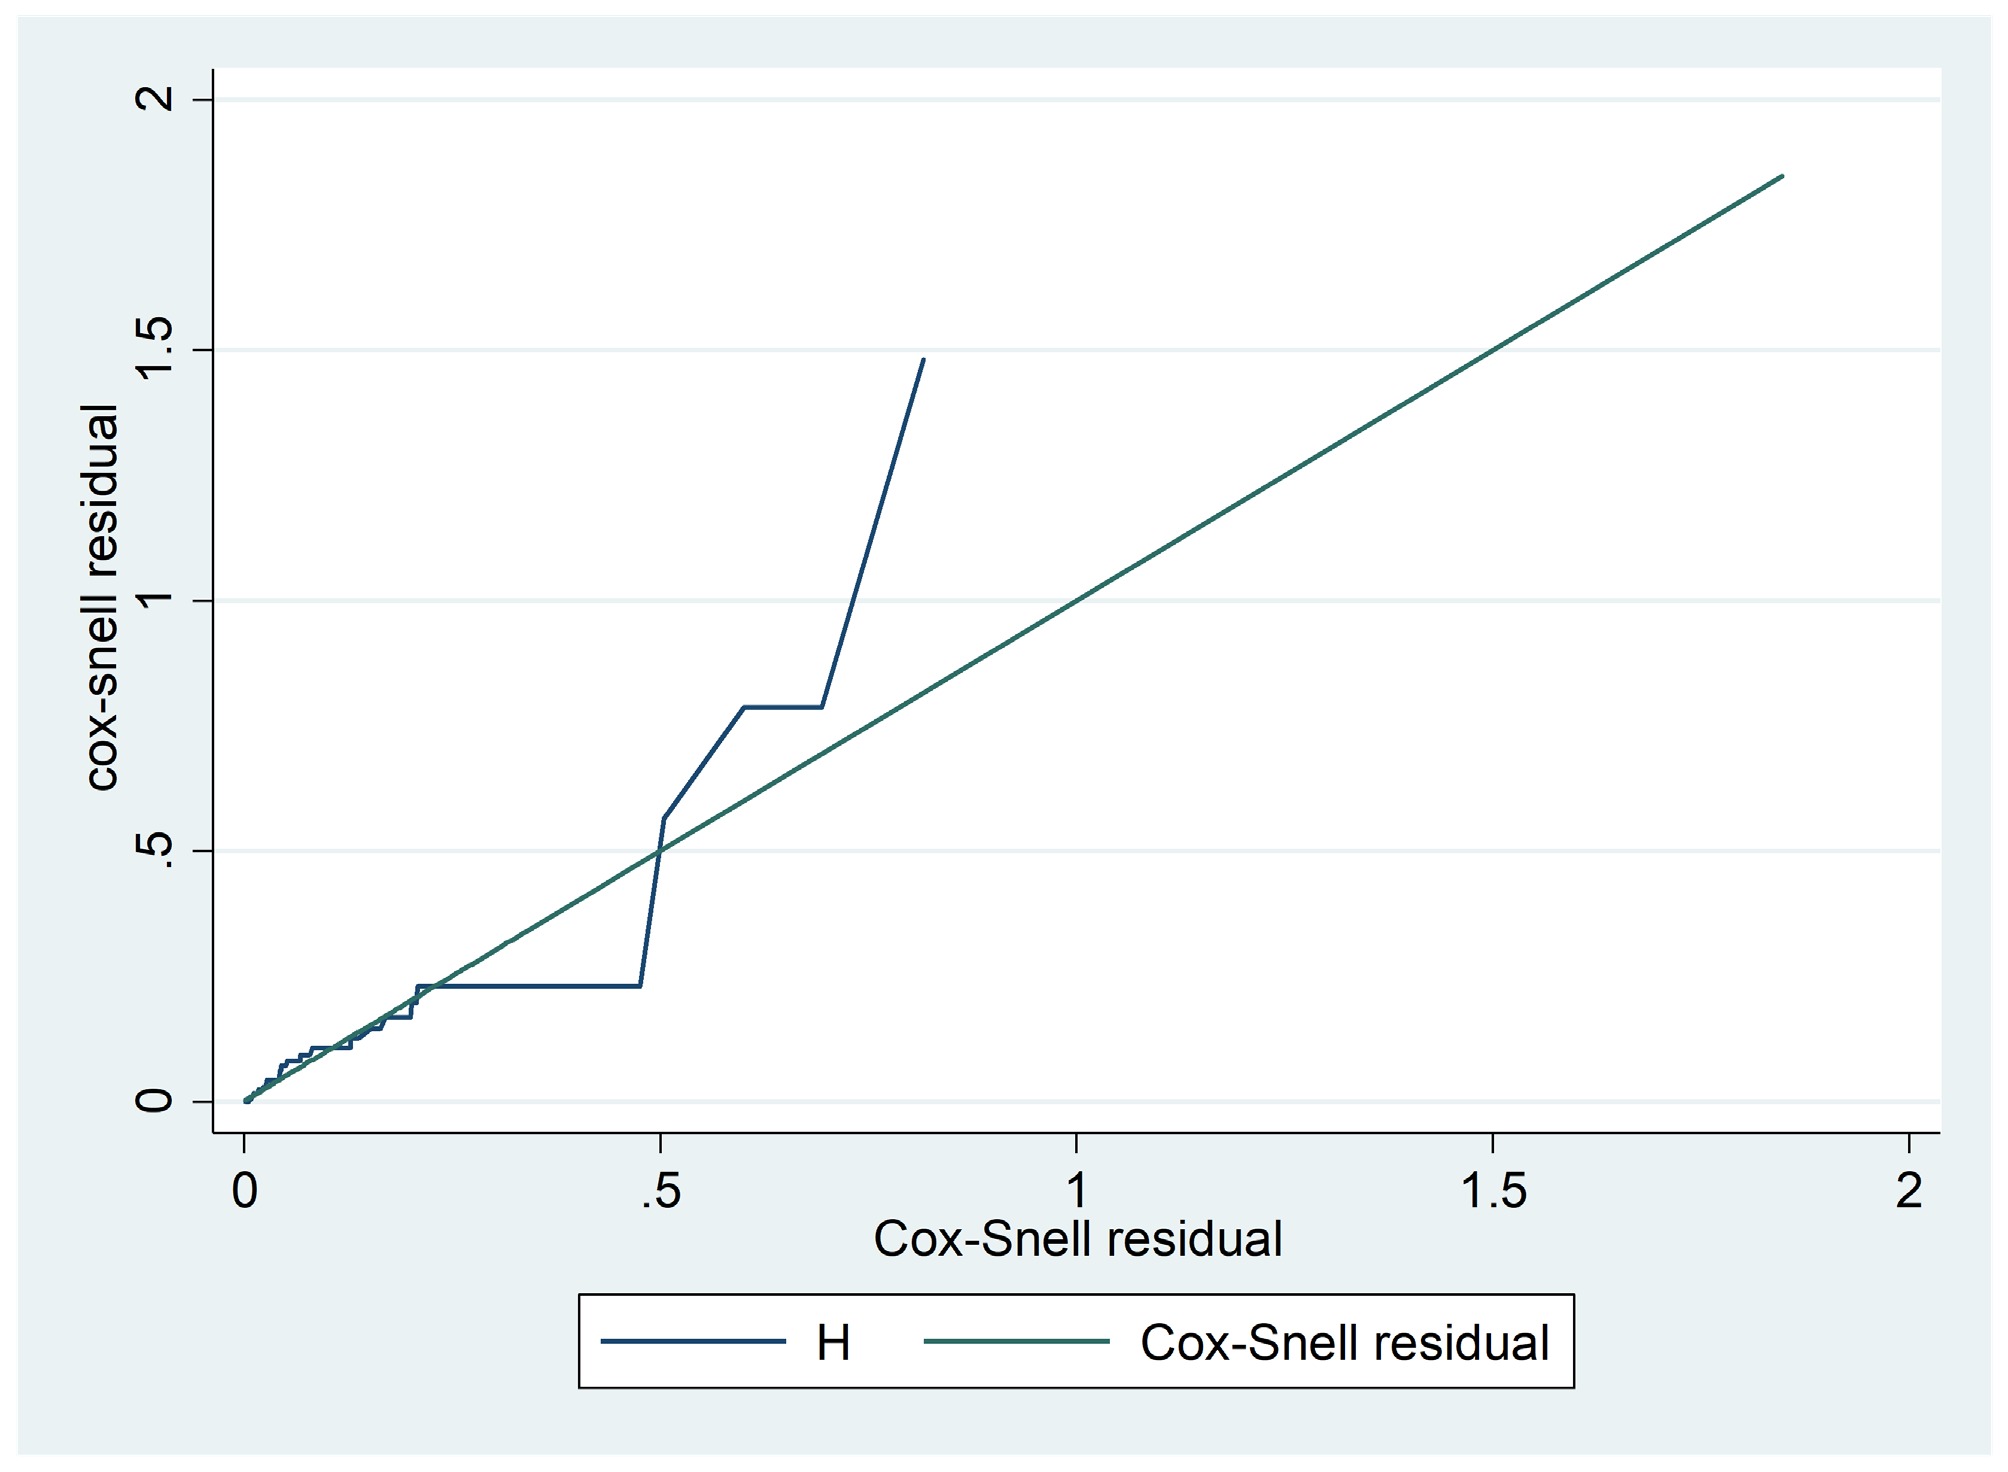
Figure 4.
Cox Snell residual for Weibull distribution.
Discussion
-
This study aimed to apply survival models to analyze the survival of CHF patients at Saint Peter's Specialized Hospital (Ethiopia), and identify factors that significantly impact their survival time. The covariates considered in the study were sex, NYHA class, HTN, pneumonia, DM, TB, electrolyte imbalance, and CKD. The Cox Proportional Hazards model is commonly used in clinical research to analyze survival data. However, if the assumption of proportional hazards does not hold, alternative methods must be considered, as in the study by Materu et al.[40]. The AFT model is one of such alternatives for analyzing survival data when hazards are not proportional. Univariate analysis revealed that the NYHA class, pneumonia, DM, TB, and electrolyte imbalance significantly affect survival time. This result is also presented in thre study by Beri et al.[41]. All significant covariates in the multivariable AFT model analyses were therefore included, and the best model selected based on the AIC. The Weibull AFT model emerged as the most appropriate with the smallest AIC and largest log likelihood value, outperforming exponential, log-normal, and log-logistic. This justifies that the AFT Weibull model better captures an estimated survival time, which is very useful for clinical relevance, and applicability in health and health related environments. Interestingly, the NYHA class did not significantly affect survival time, which aligns with a similar finding by Ahmad et al.[20]. CHF patients with DM are at a significantly higher risk of death compared to those without DM[42]. The present results indicate that CHF patients with TB had shorter survival times, consistent with the findings of Birlie et al.[43]. Similarly, CHF patients with electrolyte imbalances had lower survival times, aligning with a study by Niriayo et al.[44]. CHF patients with pneumonia had shorter survival times, which is supported by the previous study by Martin et al.[45].
-
This work focuses mainly on survival models, and in the future, other robust methods, like machine learning and deep learning algorithms should be considered for survival data. Another limitation of this study is the high proportion of censored observations, which can affect the precision and reliability of survival estimates. Although the time-to-event approach was selected to fully utilize the available follow-up data and capture the temporal patterns of risk, the extent of censoring could limit the strength of some inferences. Although a binary outcome model (e.g., death at discharge) was not employed, it is acknowledged that such an approach could offer a simplified, and potentially more robust alternative, in the presence of heavy censoring, and it may be considered in future analyses. Although survival analysis captures information from time-to-event, shorter follow-up can affect precision. A binary outcome model may be more appropriate in settings with minimal time-to-event data. Additionally, the baseline comparability of the severity of the disease between patients could not be fully assessed due to limited data. Although key clinical covariates were included, unmeasured confounders may remain. A large proportion of patients were censored, possibly due to the limited duration of follow-up. In the future, it is recommended to apply other survival approaches using different methods such as in the study by Ashine et al.[46].
-
Survival curves are essential for estimating median event times, and survival models are widely used to identify risk factors in patients with heart failure. However, classical methods often face challenges such as overfitting or underfitting due to restrictive model assumptions. In this study, data from 233 patients with congestive heart failure at Saint Peter's Specialized Hospital (Ethiopia) were analyzed. The Kaplan-Meier curve revealed a median survival time of 6 months, with longer follow-ups linked to reduced survival rates. The assumptions of the Cox Proportional Hazards model failed, leading to the evaluation of accelerated failure time models. Among these, the Weibull AFT model emerged as the best fit, outperforming the exponential, log-logistic, and log-normal models. It highlighted pneumonia, diabetes mellitus, and electrolyte imbalance as significant prognostic factors. Besides, diabetes mellitus, pneumonia, and electrolyte imbalance were associated with shorter survival times. These results highlight the need for urgent targeted interventions for patients with these comorbidities, and it is suggested that future research should explore additional factors such as exercise, smoking, marital status, and education.
-
Since the present data was from patient medical records, and patients were not directly involved in data collection, informed consent from patients was not applicable. To access patients' medical record, ethical clearance was obtained from the research ethical review board of Saint Peter's Specialized Hospital (Ethiopia), with reference number: V603/10/03/2023. This study was conducted in accordance with the Principles of the Declaration of Helsinki.
-
The authors confirm their contributions to the paper as follows: project supervision, conceptualization, review & editing: Temesgen S; conceptualization, methodology, data analysis, writing original draft: Kedir R, Tulu TW; formal analysis, visualization: Wang Y. All authors reviewed the results and approved the final version of the manuscript.
-
The datasets and code used in this study will be made available upon request from the corresponding author.
-
The authors thank Saint Peter's Specialized Hospital for providing the data, and the reviewers for their invaluable comment.
-
The authors declare that they have no conflict of interest.
- Copyright: © 2026 by the author(s). Published by Maximum Academic Press, Fayetteville, GA. This article is an open access article distributed under Creative Commons Attribution License (CC BY 4.0), visit https://creativecommons.org/licenses/by/4.0/.
-
About this article
Cite this article
Temesgen S, Kedir R, Wang Y, Tulu TW. 2026. Estimating time-to-death and determining risk predictors of heart failure patients. Statistics Innovation 3: e001 doi: 10.48130/stati-0026-0001 

Estimating time-to-death and determining risk predictors of heart failure patients
- Received: 15 May 2025
- Revised: 16 December 2025
- Accepted: 26 December 2025
- Published online: 12 February 2026
Abstract: Congestive heart failure (CHF) is one of the global health issues affecting millions, and is a leading cause of hospitalization worldwide. Despite extensive research, accurately estimating survival times, and identifying risk factors for CHF patients remains an ongoing challenge. To overcome this challenge, the Accelerated Failure Time (AFT) model is employed to identify key prognostic factors for CHF using retrospective data from Saint Peter's Specialized Hospital. Specifically, the assumptions of the Cox model were checked, and it was found that they were violated. This led to the comparison of AFT models to identify the one that provides better parameter estimates. The Akaike Information Criterion (AIC), and the Bayesian Information Criterion (BIC) were used to evaluate model performance. In this dataset, the Weibull AFT model decisively outperformed the Cox model, providing the best fit with the lowest AIC/BIC, highest log-likelihood, more accurate parameter estimates, and reduced bias. The key prognostic factors identified includes pneumonia, diabetes mellitus, and electrolyte imbalance, which are strongly associated with reduced survival in CHF patients. These findings lead to the need for urgent, targeted interventions, and establish the Weibull AFT model as a robust tool for analyzing complex survival data.
-
Key words:
- CHF /
- Time-to-death /
- AFT /
- Cox and Weibull