-
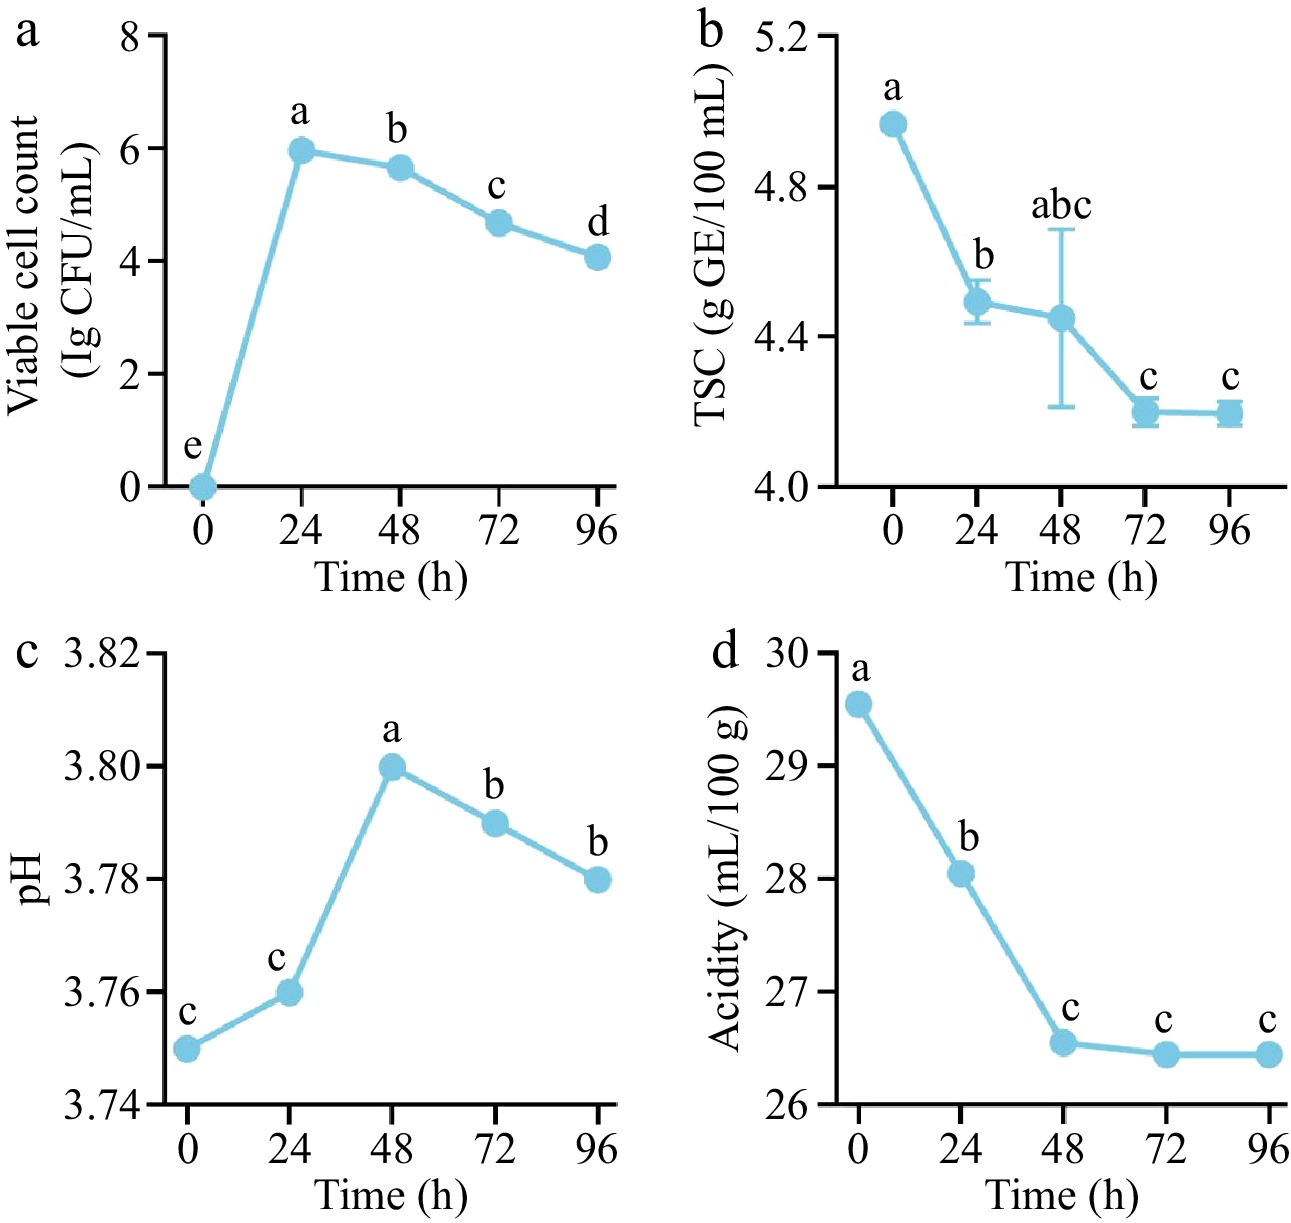
Figure 1.
Fermentation kinetics and physicochemical properties of A. melanocarpa juice: (a) viable cell counts, (b) total sugar content (TSC), (c) pH, and (d) titratable acidity at different time points. Different lowercase letters indicate significant differences (p < 0.05) among fermentation durations.
-
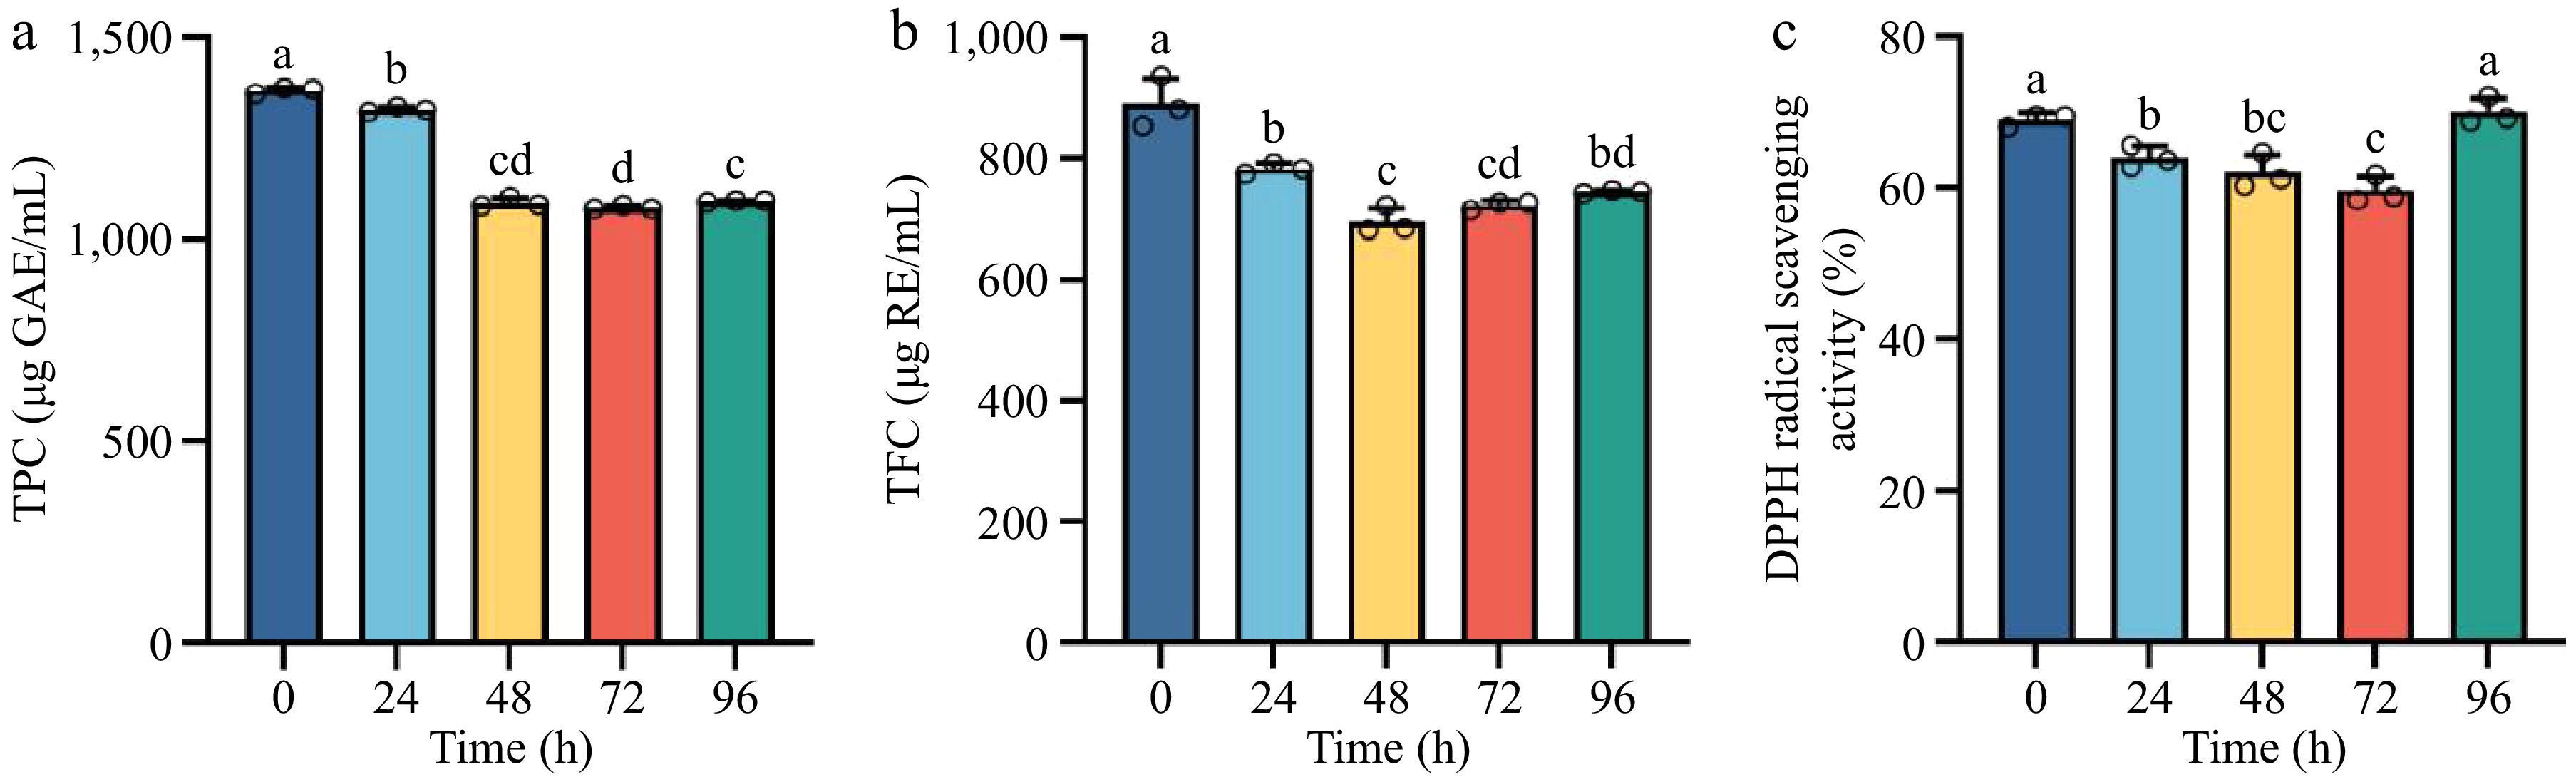
Figure 2.
Temporal changes in (a) total phenolic content (TPC), (b) total flavonoid content (TFC), and (c) DPPH radical scavenging activity in FAJ across fermentation. Distinct lowercase letters denote significant differences (p < 0.05) among time points.
-
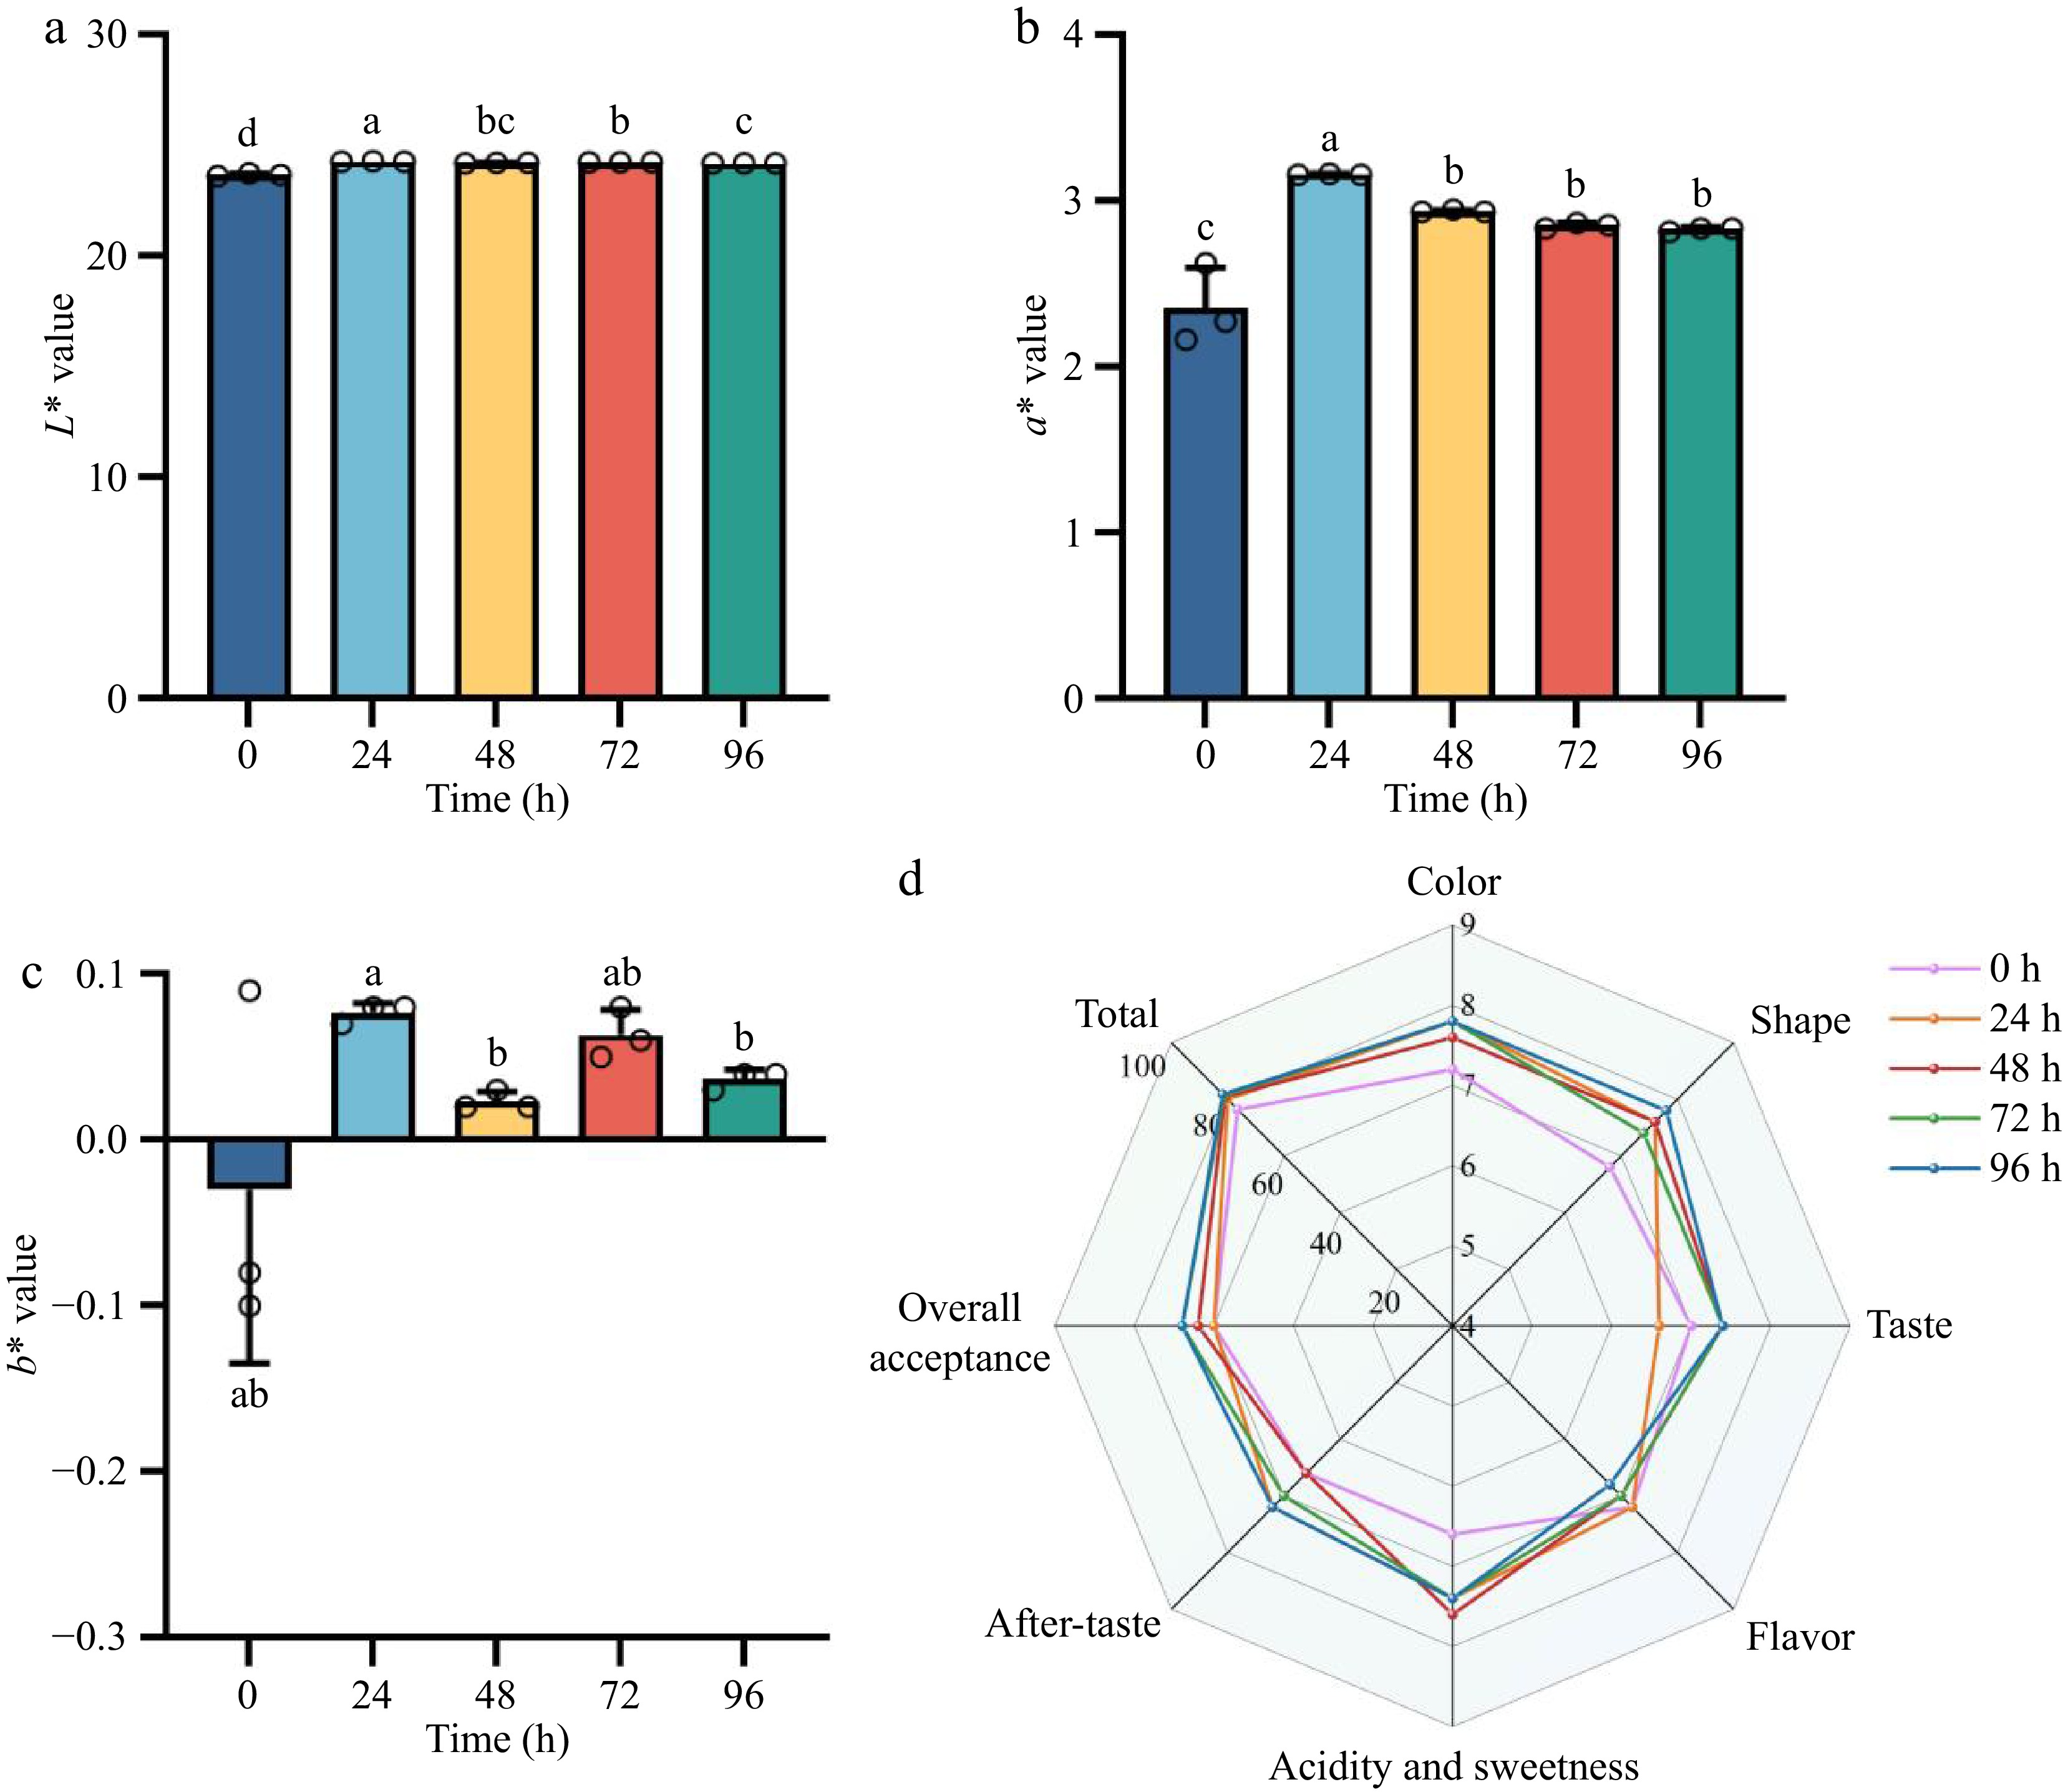
Figure 3.
Evolution of color characteristics and sensory attributes in FAJ across fermentation. Shown are (a) lightness (L*), (b) red-green chromaticity (a*), (c) yellow-blue chromaticity (b*), and (d) sensory evaluation. Lowercase letters indicate statistically significant differences (p < 0.05) between fermentation durations.
-
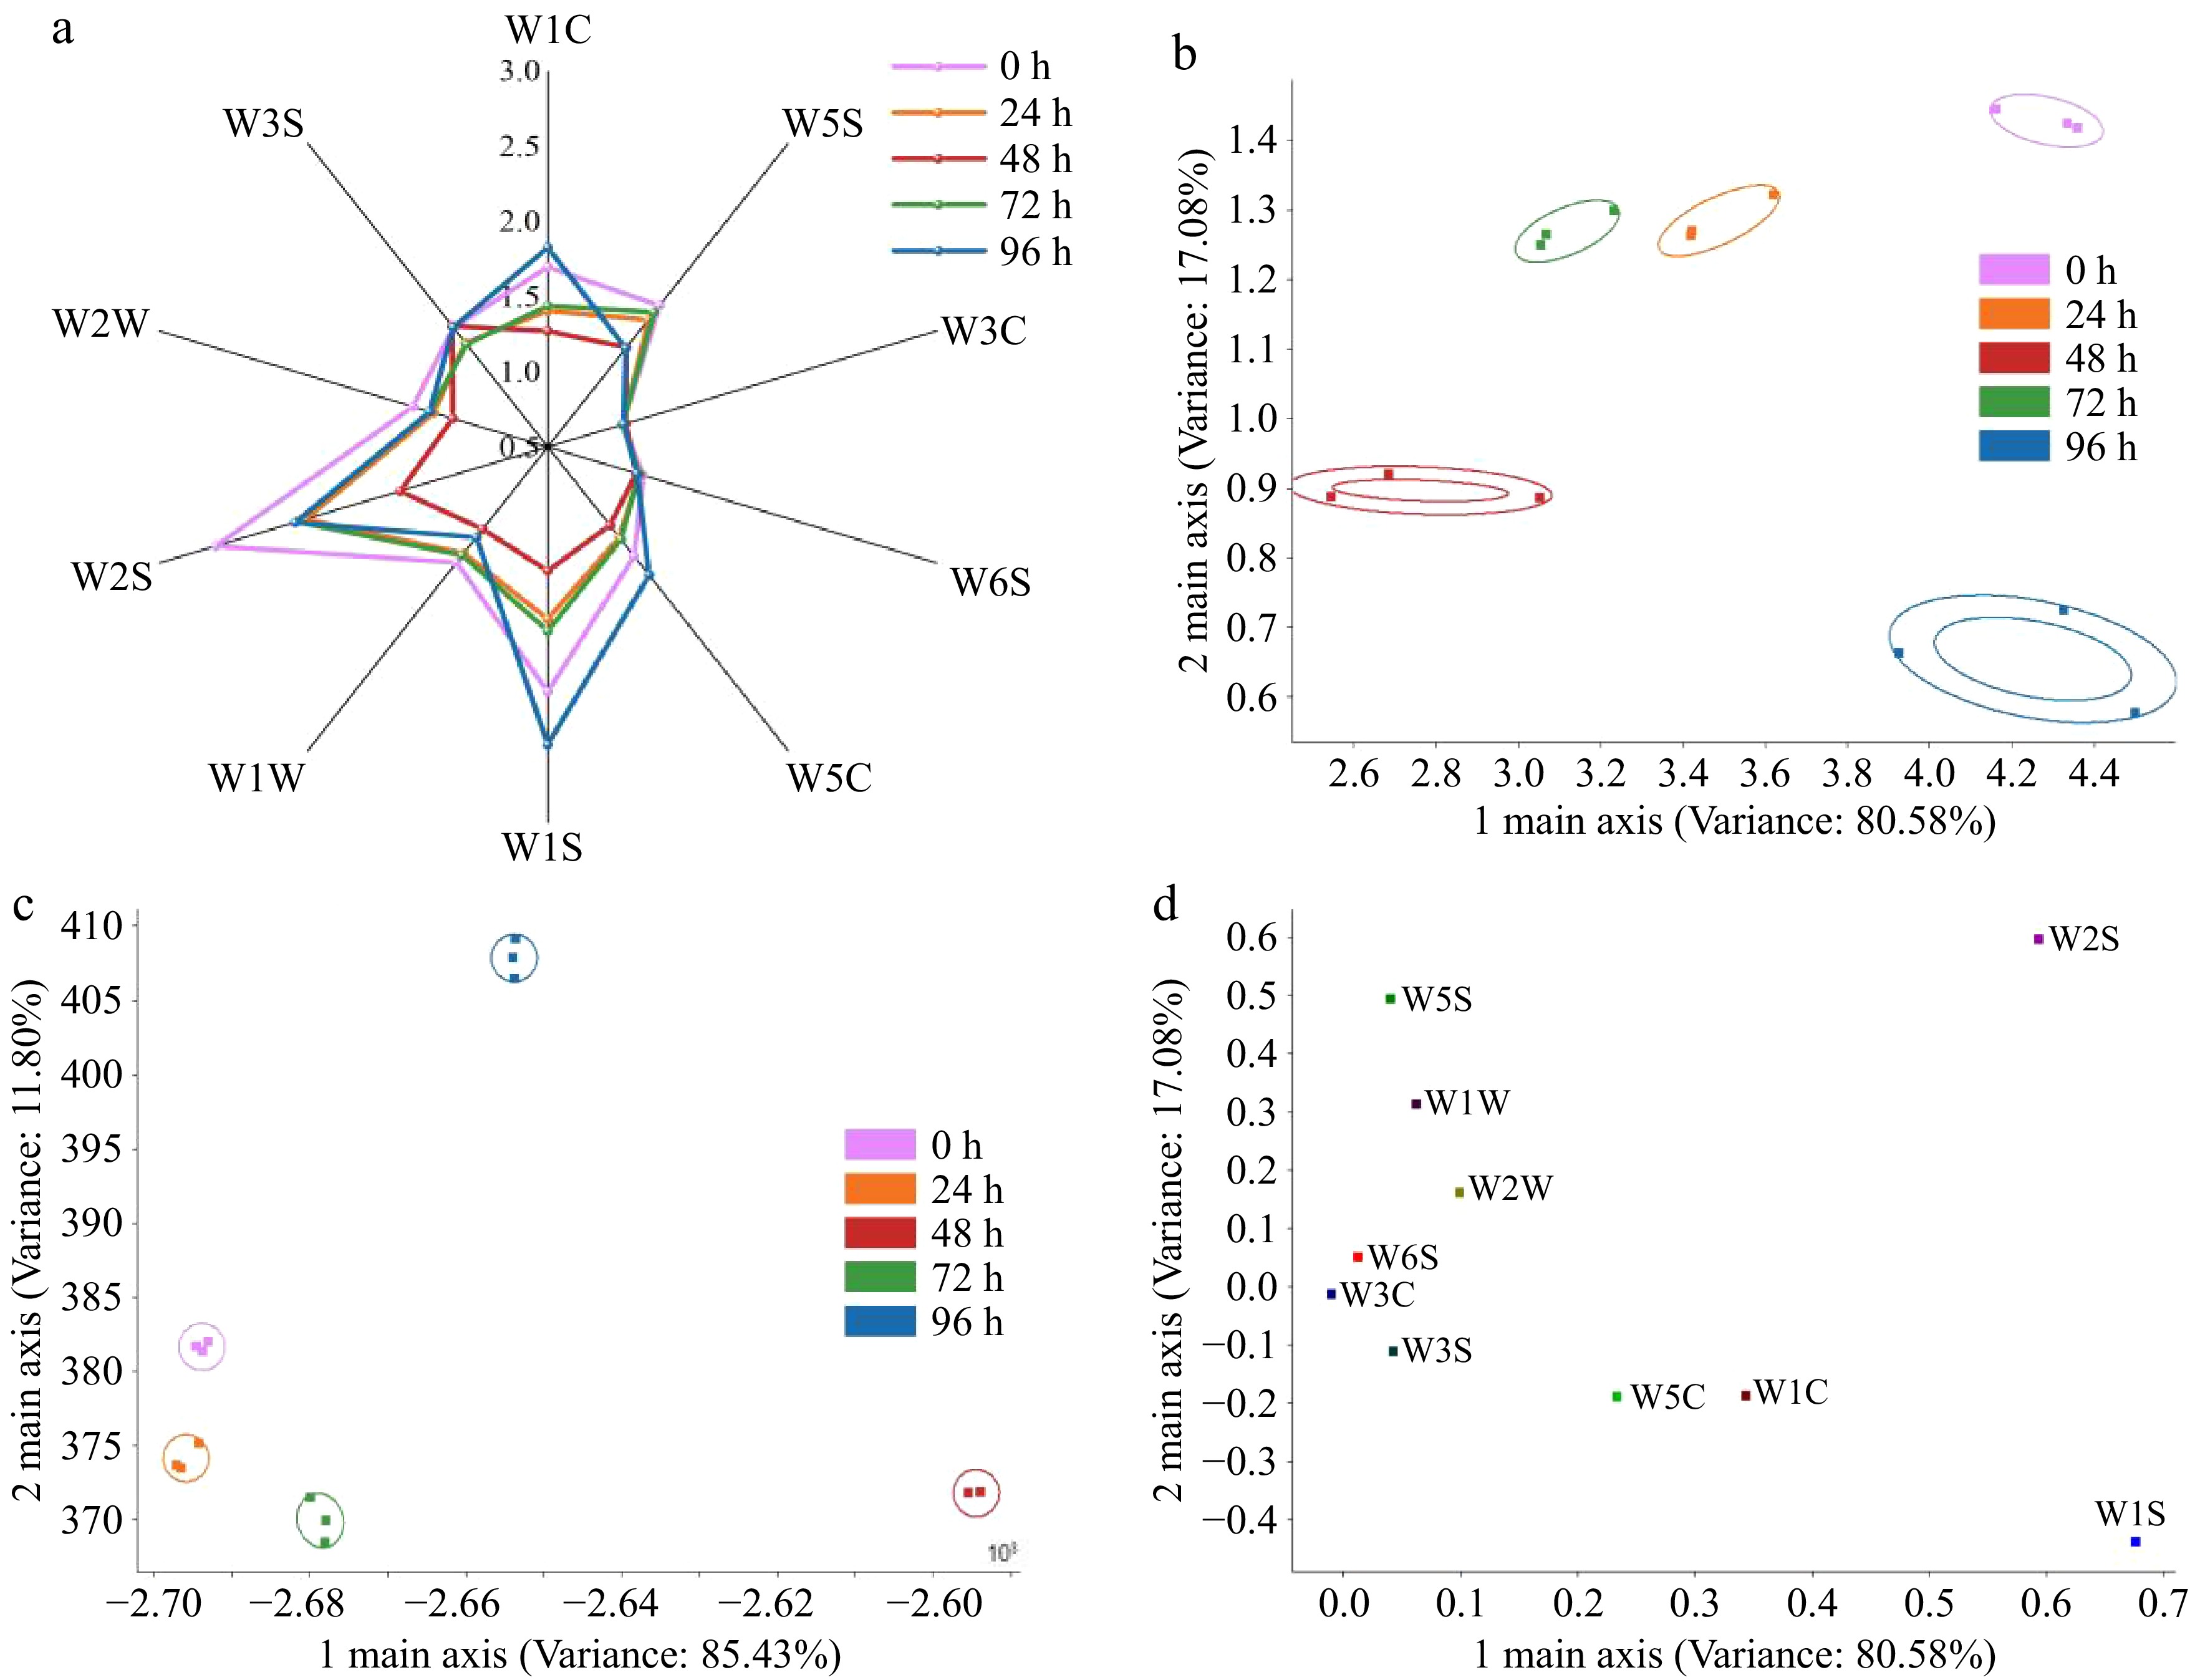
Figure 4.
The E-nose characterization of flavor profile evolution in FAJ during fermentation. The figure is organized as follows: (a) radar plot, (b) PCA plot, (c) LDA plot, and (d) loading analysis plot.
-
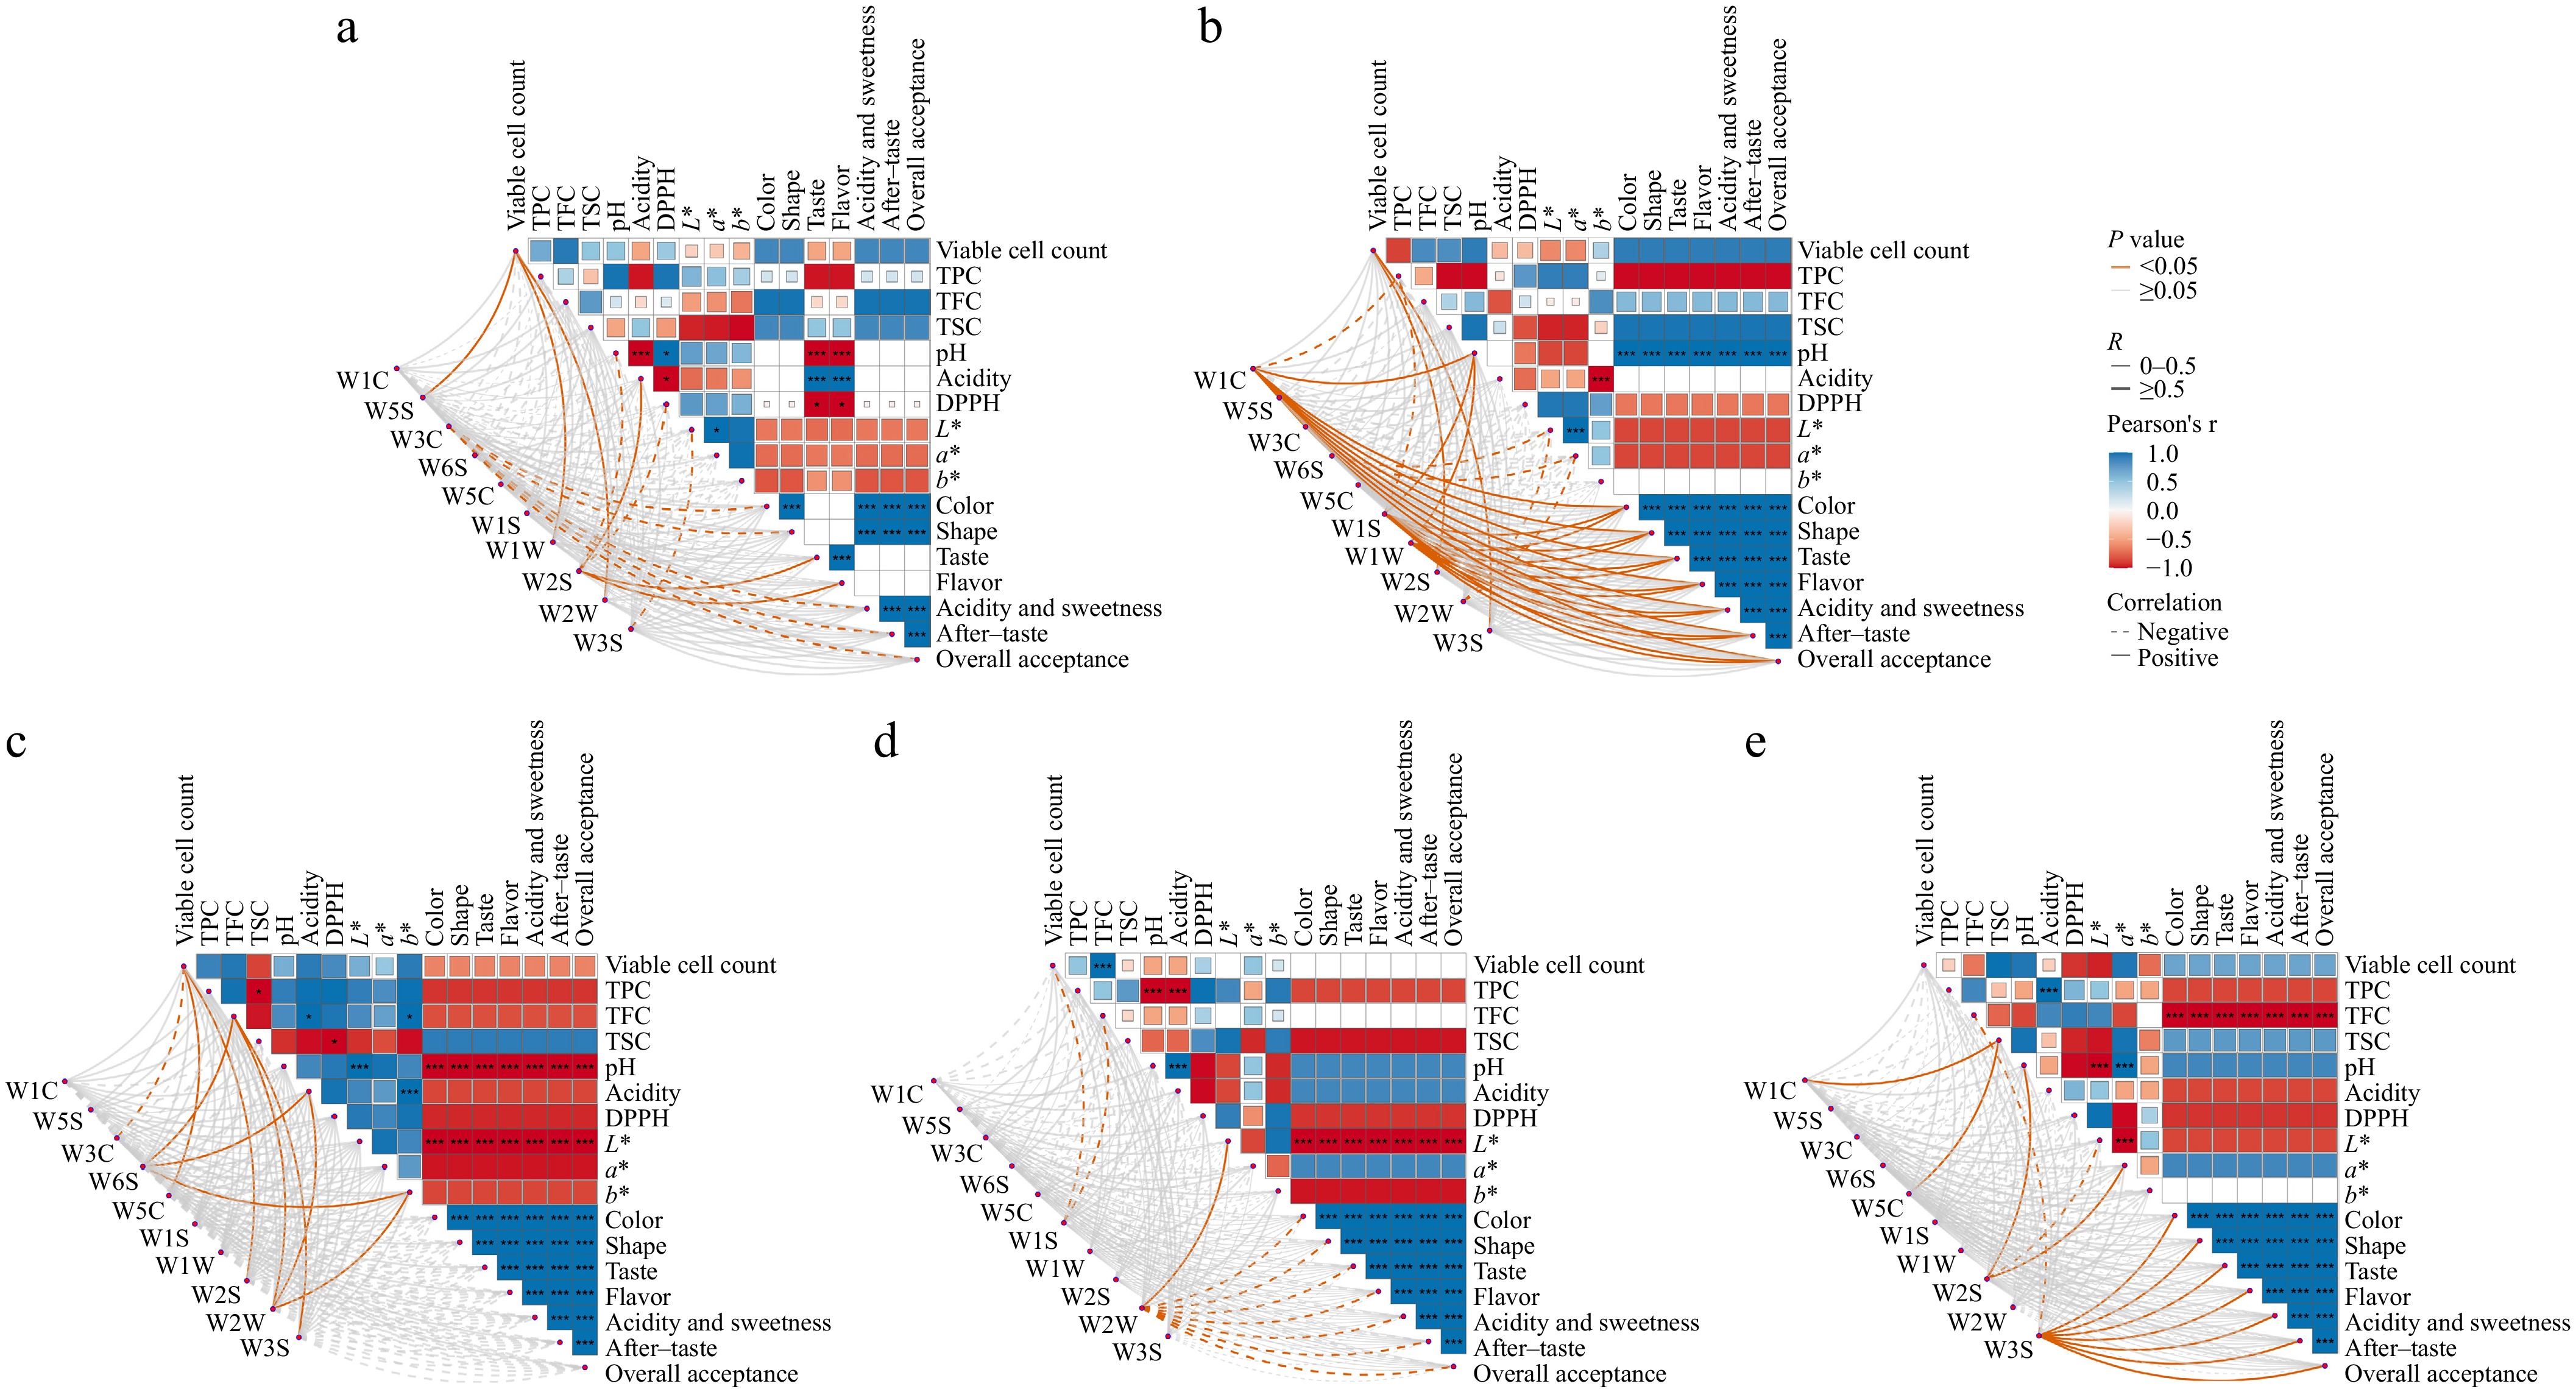
Figure 5.
Heatmaps of flavor volatile variations in FAJ during fermentation analyzed by electronic nose, with panels (a) to (e) showing the characteristic profiles at 0, 24, 48, 72, and 96 h, respectively. The color bar gradient from red to blue represents negative to positive correlation. Statistical significance is indicated as * p < 0.05, or *** p < 0.01.
Figures
(5)
Tables
(0)