


-
Aronia melanocarpa (Michx) Elliott, a North American native shrub now extensively cultivated in Northeast China, has attracted increasing attention for its unique phytochemical profile, dominated by anthocyanins[1], proanthocyanidins, and chlorogenic acids[2,3]. These bioactive compounds have been associated with the regulation of metabolic processes and the mitigation of oxidative stress, thereby positioning the fruit as a promising candidate for the development of functional foods[4]. However, its intense astringency and tartness (pH 3.4–3.8), attributed to high tannin content and organic acid content, impairs the flavor of the resulting juice[5], and thus necessitates advanced processing strategies (e.g., enzymatic hydrolysis, co-fermentation), to balance the fruit's bioactivity with its sensory quality[6].
Recent advancements in microbial bioprocessing have highlighted the potential of targeted strain selection for tailoring plant-based matrices[7]. Unlike conventional multi-strain fermentation, monoculture approaches, particularly with acid-resistant Lacticaseibacillus casei variants, offer precise control over metabolic pathways[8]. For instance, L. casei 393, distinguished by its β-glucosidase activity and acid tolerance, demonstrates exceptional capacity to hydrolyze the phenolic glycosides into bioactive aglycones, and degrade bitterness precursors such as epicatechin polymers[9]. Strain-specific adaptations, including upregulated stress-response genes under low pH further enhance its suitability for acidic fruit matrices[10]. Additionally, this strain's enzymatic repertoire modulates volatile ester synthesis, a critical determinant of fruity aroma profiles[11]. In black sapote fermentation models, Lactobacillus cremoris, L. rhamnosus, and L. reuteri have elevated free phenolic acids levels, especially enhanced protocatechuic and gallic acid production[12]. These findings align with recent reports of strain-specific anthocyanin stabilization in Vaccinium species fermentations[13], underscoring the niche efficacy of such strains in berry-based systems[14]. This indicates that specific strains hold high potential for the directed regulation of fermentation systems to stabilize anthocyanins, encouraging further exploration of their generalizability, and mechanisms in other berry fermentation systems to optimize the retention of functional components.
Compared with other commonly used Lactobacillus strains, such as L. plantarum and L. acidophilus, L. casei exhibits superior tolerance to acidic environments and high polyphenol matrices, which are a characteristic of A. melanocarpa juice. Moreover, L. casei has been reported to possess strong adaptability to phenolic-rich substrates, stable fermentation performance, and favorable metabolic profiles for flavor modulation and bioactive compound transformation[15,16]. In particular, L. casei 139 has demonstrated consistent growth and metabolic activity under low pH conditions, making it a suitable candidate for the controlled fermentation of highly acidic berry juices. Therefore, this study employed L. casei 139 to systematically evaluate the dynamic changes in nutritional quality and flavor characteristics of fermented A. melanocarpa juice.
L. casei 139 was used in the fermentation of A. melanocarpa juice (FAJ) to explore its potential for directed regulation of the fermentation system through the independent role of a single strain. The dynamic changes were monitored by determining lactic acid bacterial counts, total sugar, pH value, acidity, and color parameters during fermentation. Total phenolics, flavonoids, and DPPH radical scavenging activity was also assessed through the sensory and electronic nose analyses. The findings revealed the correlations between microbial activity and the evolution of functional and flavor components, providing a foundation for the development of functional fermented beverages with enhanced nutritional and sensory properties.
-
The experimental system employed the Lactobacillus casei 139 strain derived from Kefir (College of Food Science, South China Agricultural University). Man-Rosa broth (MRS) was procured from Huankai Microbial Science & Technology Co., Ltd (Guangdong, China). The 1,1-biphenyl-2-picrylhydrazyl (DPPH) reagent was acquired from Sigma-Aldrich Co., Ltd (St. Louis, MO, USA). Rutin standard and Folin-Ciocalteu reagent were purchased from Solarbio Science & Technology Co., Ltd (Beijing, China), and Shanghai Macklin Biochemical Co., Ltd (Shanghai, China), respectively. All other chemicals and reagents used were of analytical grade.
Raw material pretreatment
-
Fresh ripe A. melanocarpa berries procured from Liaoning Province, China, underwent pretreatment comprising manual removal of foliar residues and calyces, and then washing with distilled water. The homogenized matrix was formulated with 9% (w/w) brown sugar supplementation, prior to aseptic bottling in 200 g aliquots using sterile glass bottles. A precisely controlled thermal process was implemented through a low-temperature pasteurization regime (80 °C, 15 min), succeeded by controlled cooling to 25 ± 0.5 °C to achieve optimal inoculation conditions.
Microorganism preparation and fermentation
-
A monoculture system was established using L. casei 139 with an initial inoculum density standardized to 7.0 lg CFU/mL. Unfermented juice was used as a control in the same batch of experiments, and as a common control in other studies involving different strains[5]. The fermentation system comprising L.casei 139 -inoculated A.melanocarpa matrix, and a sterile control (0 h baseline) underwent parallel incubation at 37 °C for 96 h. Aseptic sampling was periodically executed at defined intervals (0, 24, 48, 72, and 96 h) for time-course analysis.
Microbial viability profiling
-
While adhering to the framework of GB 4789.2-2022, the initial inoculation levels were determined with reference to previous literature[17,18]. After sampling, serial dilution in 0.9% NaCl solution was performed, generating a dilution gradient spanning 10−1 to 10−7. Triplicate plating was performed on modified MRS agar, supplemented with 0.5% L-glutamic acid sodium salt under the conditions of 37 °C for 24–48 h. Viable cell quantification was performed by enumerating colonies within the valid counting range (30–300 CFU/plate), with final concentrations expressed as base-10 logarithmic colony-forming units per milliliter (lg CFU/mL).
Determination of total sugar content
-
Total sugar content (TSC) was determined using an optimized phenol-sulfuric acid method[11]. A glucose standard calibration curve (y = 0.0088x + 0.0815, R2 = 0.9964) was initially established through spectrophotometric quantification at 490 nm (Molecular Device, SpectraMax i3x, Silicon Valley, California, USA). Quantified values were ultimately expressed as grams glucose equivalents (GE) per 100 mL of sample (g GE/100 mL).
Determination of pH and total acidity
-
The determination of pH values was performed at 25.0 ± 0.5 °C using a calibrated digital pH meter (PHS-3C, Rex Electric Chemical, Shanghai, China). Total acidity was determined by acid-base titration using 0.1 M NaOH, consumed by 100 g of sample (mL/100 g), following CNIS GB5009.239-2016. The titration endpoint was determined by attaining a pH value of 8.30 using a calibrated pH meter, with triplicate verification ensuring measurement reproducibility.
Antioxidant capacity evaluation
Total phenolic content quantification
-
Total phenolic content (TPC) was quantified using an optimized Folin-Ciocalteu assay adapted from Rizvi et al.[19] , with slight modifications. Reaction mixtures contained 0.5 mL diluted extract, 0.5 mL H2O, and 2.5mL 0.1 mol/L Folin-Ciocalteu reagent (Sigma-Aldrich, USA), vortexed and incubated (5 min, 25 °C). After adding 2 mL 7.5% (w/v) Na2CO3, samples were dark-incubated (60 min, 25 °C). Absorbance at 765 nm was measured using a microplate reader (SpectraMax i3x, Molecular Devices). Quantification employed a gallic acid standard curve (y = 0.0076x + 0.0684, R2 = 0.9953), expressed as micrograms of gallic acid equivalents (GAE) per 1 mL of sample (μg GEA/mL).
Total flavonoid component analysis
-
Total flavonoid component (TFC) was performed using aluminum chloride complexation[20]. Briefly, 10-fold diluted juice was mixed with 5% AlCl3 (v/v) in pH 5.5 acetate buffer (0.1 M), adjusted to a final volume (1 mL) with 60% ethanol, and stabilized (30 min, dark). Absorbance at 400 nm was recorded (VersaMax, Molecular Devices). Data was calculated against a rutin calibration curve (y = 0.0008x + 0.047, R2 = 0.9884), and reported as micrograms of rutin equivalents (RE) per 1 mL of sample (μg RE/mL).
DPPH radical scavenging activity
-
The DPPH radical scavenging assay was performed according to an adapted protocol. Control blanks utilized an identical volume of extraction buffer in place of the juice sample. Absorbance readings at 515 nm were obtained via microplate spectrophotometry. Percent radical scavenging activity was derived using the following equation:
$ DPPH\; radical \;scavenging \;activity\; ({\text{%}}) = \dfrac{{Ac-As}}{{Ac}}\times 100{\text{%}} $ As represents the absorbance of the juice sample, and Ac is determined relative to the absorbance of the blank control.
Color measurement
-
The chromatic properties of FAJ were quantified using an ST60 colorimeter (3NH Technology Co., Ltd, Shenzhen, China). The color parameters measured were L* (lightness), a* (red-green chromaticity), and b* (yellow-blue chromaticity), where L* values range from 0 (black) to 100 (white)
Sensory profiling
-
Sensory analysis was performed according to the Chinese national standard GB 7101-2022. A panel of trained assessors (six members in total) evaluated the samples in a controlled environment with uniform lighting, ventilation, and absence of direct sunlight. Key sensory attributes included color, shape, taste, flavor, after-taste, acidity, sweetness, and overall acceptability. A standardized 9-point hedonic scale (Supplementary Table S1) was applied for scoring.
Assessment with an E-nose system
-
The aroma profiles were analyzed using the PEN3 electronic nose from Airsense Analytics GmbH. Samples were collected at fermentation time points 0, 24, 48, 72, and 96 h, and were immediately heated to 80 °C for 15 min to terminate microbial metabolic activity. Prior to electronic nose (AirsenseTM) detection, calibration was performed using standardized parameters: the carrier gas flow rate was set to 300 mL/min, which was verified as the linear response range of the sensors, according to the instrument manual. The cleaning interval was set to 120 s to ensure sensor baseline stability, with zero-point calibration lasting for 30 s to reset the sensor signal to the baseline level. A pre-equilibration time of 10 s for the samples was employed to ensure thorough diffusion of the volatile components, and the total measurement cycle was set to 140 s. Data collection focused on the stable response interval of 128–130 s.
The PEN3 system comprises 10 sensors, each designed to detect specific compounds. Specifically, W1C senses aromatic components and benzene, W5S is highly sensitive to nitrogen oxides, W3C responds to aromatic components and ammonia, W6S primarily detects hydrides, W5C senses alkane aromatic compounds, W1S is responsive to methyl groups, W1W reacts to sulfides, W2S detects alcohols, aldehydes, and ketones, W2W identifies aromatic components and organosulfides, and W3S is sensitive to long-chain alkanes. Prior to each measurement, the analysis system was purged with dry and pure air. All measurements were conducted in triplicate to ensure accuracy.
Statistical analysis
-
All measurements were triplicated, obtaining the data expressed as mean ± standard deviation (SD). A one-way analysis of variance was conducted using IBM SPSS Statistics 22.0 software. When variances were heterogeneous, Tamhane's test was employed for post-hoc analysis. When data violated the assumption of normal distribution, non-parametric alternative methods were implemented. Multivariate analyses, including principal component analysis (PCA), linear discriminant analysis (LDA), and loading plot interpretation, were implemented in Winmuster software (Airsense Analytics GmbH, Germany). For graphical representation, radar plots were generated using OriginPro 2021 (OriginLab, USA), while bar graphs were constructed with GraphPad Prism 10 (GraphPad Software, USA). Electronic nose (E-nose) data was processed through Win-muster v1.6.2.22, and R code implemented to create a Mantel plot for visualizing the results of Pearson correlation analysis. The experimental workflow was schematically illustrated using Figdraw.com (Toronto, Canada).
-
Throughout the fermentation of the monoculture fermentation process, dynamic changes were detected in bacterial colony counts, pH, titratable acidity, and TSC. Specifically, the microbial population rapidly increased to a maximum of 6.0 lg CFU/mL at 24 h, followed by a significant decline to 4.10 lg CFU/mL by 96 h. The results revealed significant differences (p < 0.05), with the specific trends illustrated in Fig. 1a. TSC peaked at 4.97 g GE/100 mL at 0 h, sharply decreasing to a minimum by 72 h, and stabilizing thereafter (Fig. 1b). The overall trend reflected progressive sugar consumption during fermentation.
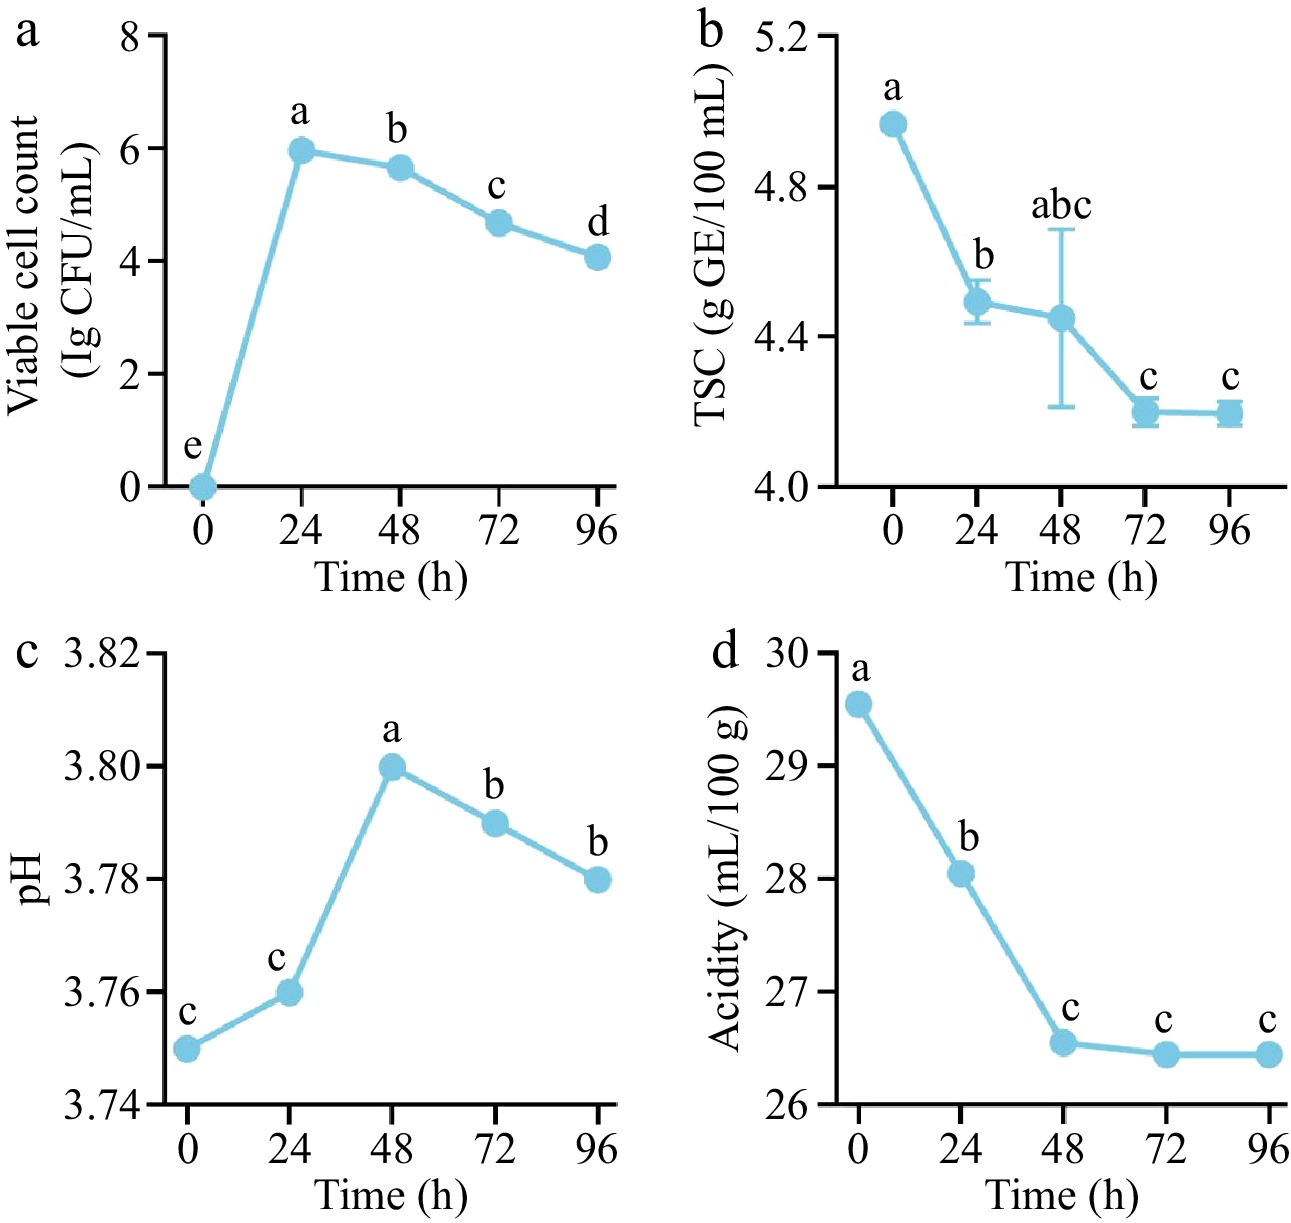
Figure 1.
Fermentation kinetics and physicochemical properties of A. melanocarpa juice: (a) viable cell counts, (b) total sugar content (TSC), (c) pH, and (d) titratable acidity at different time points. Different lowercase letters indicate significant differences (p < 0.05) among fermentation durations.
As shown in Fig. 1c, the initial pH of A. melanocarpa juice was 3.75, and the pH value increased during the early stages of fermentation (24–48 h), reaching 3.80 at 48 h. Subsequently, it stabilized at 3.78 until the end of fermentation. In contrast, titratable acidity decreased steadily from an initial 29.55 mg/L to 26.51 mg/L in 48 h (p < 0.05), maintaining this level until 96 h (Fig. 1d). Notably, the variation trends of pH and TA were not synchronized, indicating a non-linear and stage-dependent relationship between these two parameters during fermentation. This specific trend is primarily attributed to the metabolic utilization of organic acids by L. casei 139[21]. These results highlight the metabolic interplay between microbial activity and substrate utilization in the fermentation system.
Changes in total phenol content, total flavonoid content, and DPPH radical scavenging activity
-
The antioxidant capacity of fermented A. melanocarpa juice, along with its TPC and TFC, exhibited dynamic shifts during fermentation. The TPC of the juice decreased significantly within the first 24 h of fermentation, with the highest TPC observed in the unfermented juice. A gradual decline ensued, reaching a minimum of 1,080 μg GAE/mL in 72 h, followed by a slight rebound to 1,095 μg GAE/mL by 96 h, with statistically significant interphase variations (Fig. 2a). TFC displayed a marked reduction from its initial value of 891, to 697 μg RE/mL in 48 h (p < 0.05). Despite a partial recovery to 745 μg RE/mL in 96 h, the final TFC remained significantly lower than at 0 h. The results were statistically significant at the 0.05 level, as depicted in Fig. 2b, confirming an overall downward trend during fermentation.
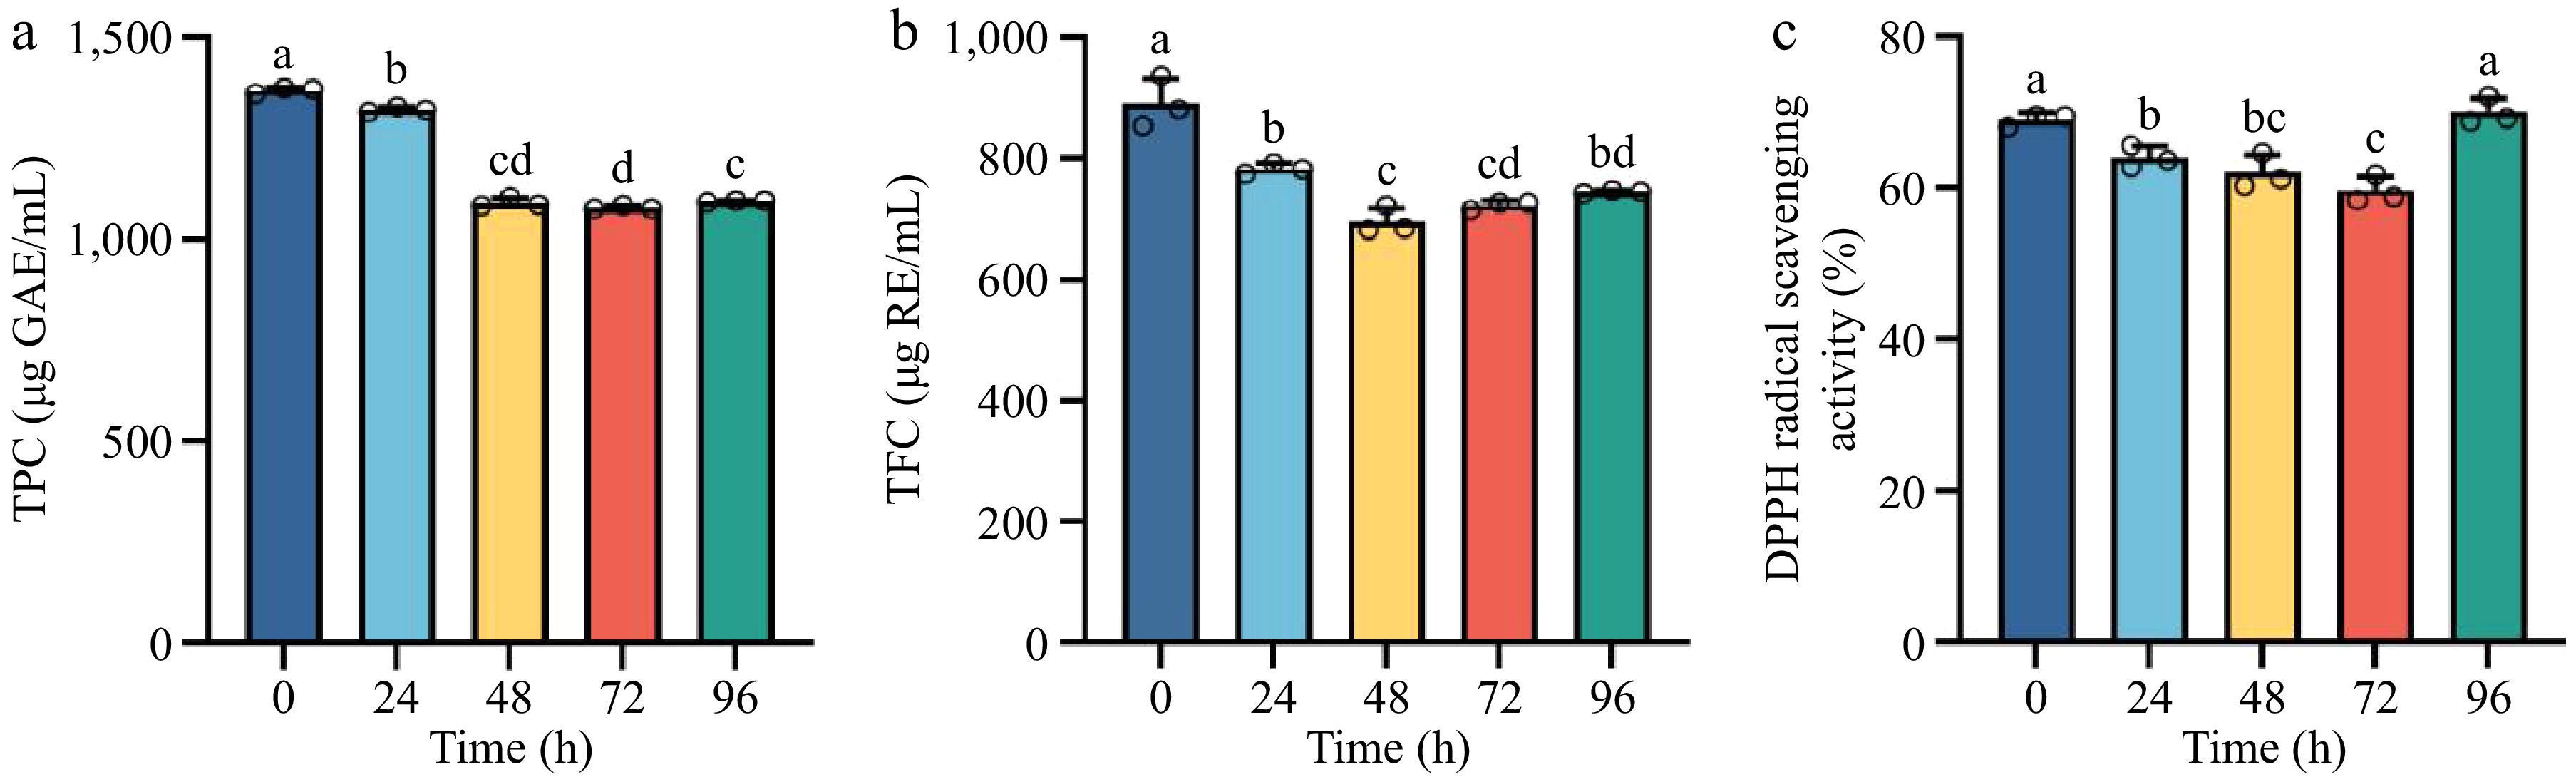
Figure 2.
Temporal changes in (a) total phenolic content (TPC), (b) total flavonoid content (TFC), and (c) DPPH radical scavenging activity in FAJ across fermentation. Distinct lowercase letters denote significant differences (p < 0.05) among time points.
DPPH radical eliminating activity decreased steadily from 69.1% to 59.7% over 72 h, followed by a rapid rise to 70.1% by 96 h. The significance of the findings was confirmed with a p-value less than 0.05, as illustrated in Fig. 2c. Notably, eliminating rates consistently exceeded 60%, underscoring the inherent antioxidant potency of A. melanocarpa juice.
Characterization of color and sensory properties
-
Fermentation of A.melanocarpa juice induced modifications in its L*, a*, and b* values (Fig. 3a–c). After 24 h of fermentation, both L* and a* values showed a significant increase compared to the unfermented juice (p < 0.05). However, the increase of b* does not reflect significance. The values of L*, and a* in the juice over the following 48-96 h increased compared with those at 0 h.
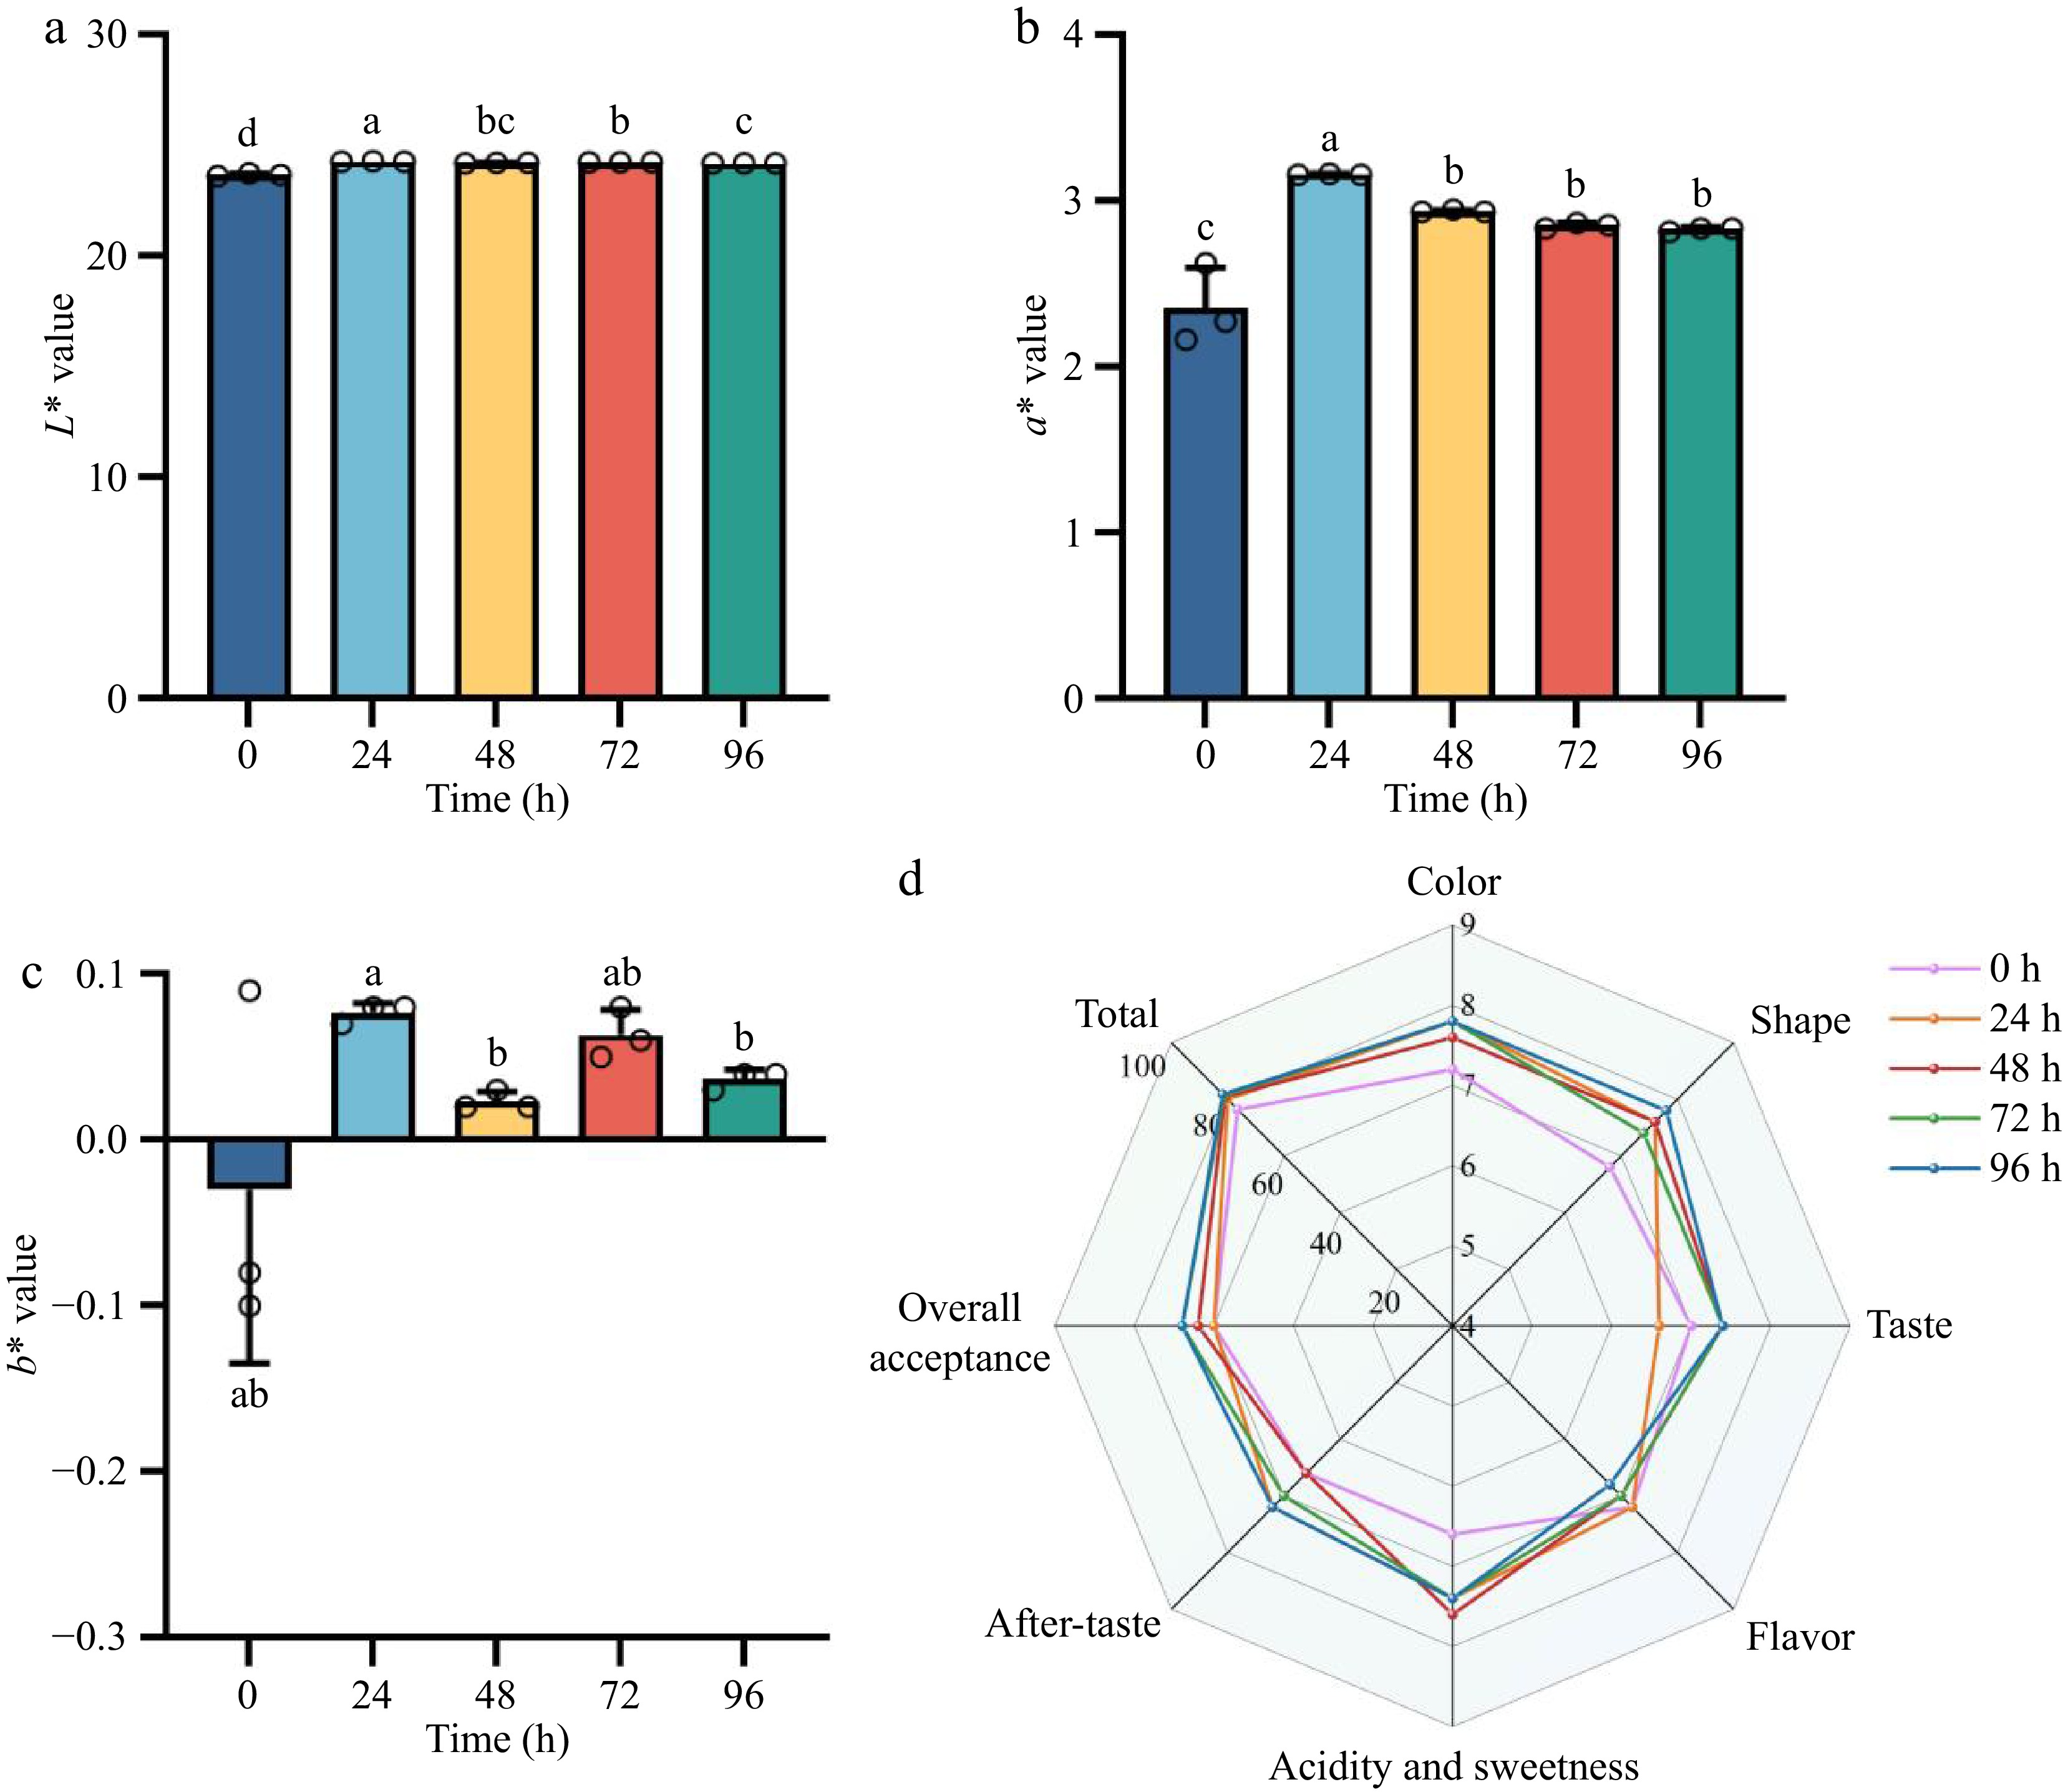
Figure 3.
Evolution of color characteristics and sensory attributes in FAJ across fermentation. Shown are (a) lightness (L*), (b) red-green chromaticity (a*), (c) yellow-blue chromaticity (b*), and (d) sensory evaluation. Lowercase letters indicate statistically significant differences (p < 0.05) between fermentation durations.
Sensory evaluation revealed a change in color, intensity, texture, aroma complexity, acid-sweet balance, aftertaste persistence, and overall acceptability during the fermentation process. Radar plot analysis showed that the acceptance score increased with the fermentation time (Fig. 3d). At 0 h, the score was the same as at 24 h. By 48 h the acceptance score had slightly increased, and continued to rise at 72 h and 96 h with the 72–96 h samples reaching the highest scores, indicating consumer preference for prolonged fermentation. The 48 h sample excelled in acid-sweet balance, and the 72–96 h batches were dominant in aftertaste quality. The results indicated that the monoculture fermentation process not only amplified chromatic attributes, but also enhanced organoleptic qualities, leading to the sensorial superiority of the fermented juice to its unfermented counterpart. Color scores increased with fermentation time, suggesting improved juice appearance and consumer acceptance. In line with this, the previously reported colorimetric analysis revealed that although fluctuations in L*, a*, and b* values were observed during fermentation, both parameters exhibited a clear upward trend at 96 h compared with the initial state. This enhancement in color characteristics is consistent with the improved visual perception observed in sensory evaluation.
Flavor profile analysis by electronic nose
-
Radar plot analysis revealed differential response patterns of the 10 electronic nose sensors to volatile organic compounds in FAJ across various fermentation stages (Fig. 4a). These shifts form the sensory foundation for the evolving flavor complexity of FAJ. Notable differences in signal intensity were observed, particularly in the W1C, W5C, and W1S channels. The intensified response of W1C suggests the accumulation of antioxidants like phenolics, which not only contribute richer fruity and sweet aromatic undertones to the juice, but also potentially enhance its oxidative stability. Meanwhile, the stable response of W5C indicates a balanced metabolism of alkane-like compounds, helping to form a soft, mellow flavor background, and preventing off-flavors.
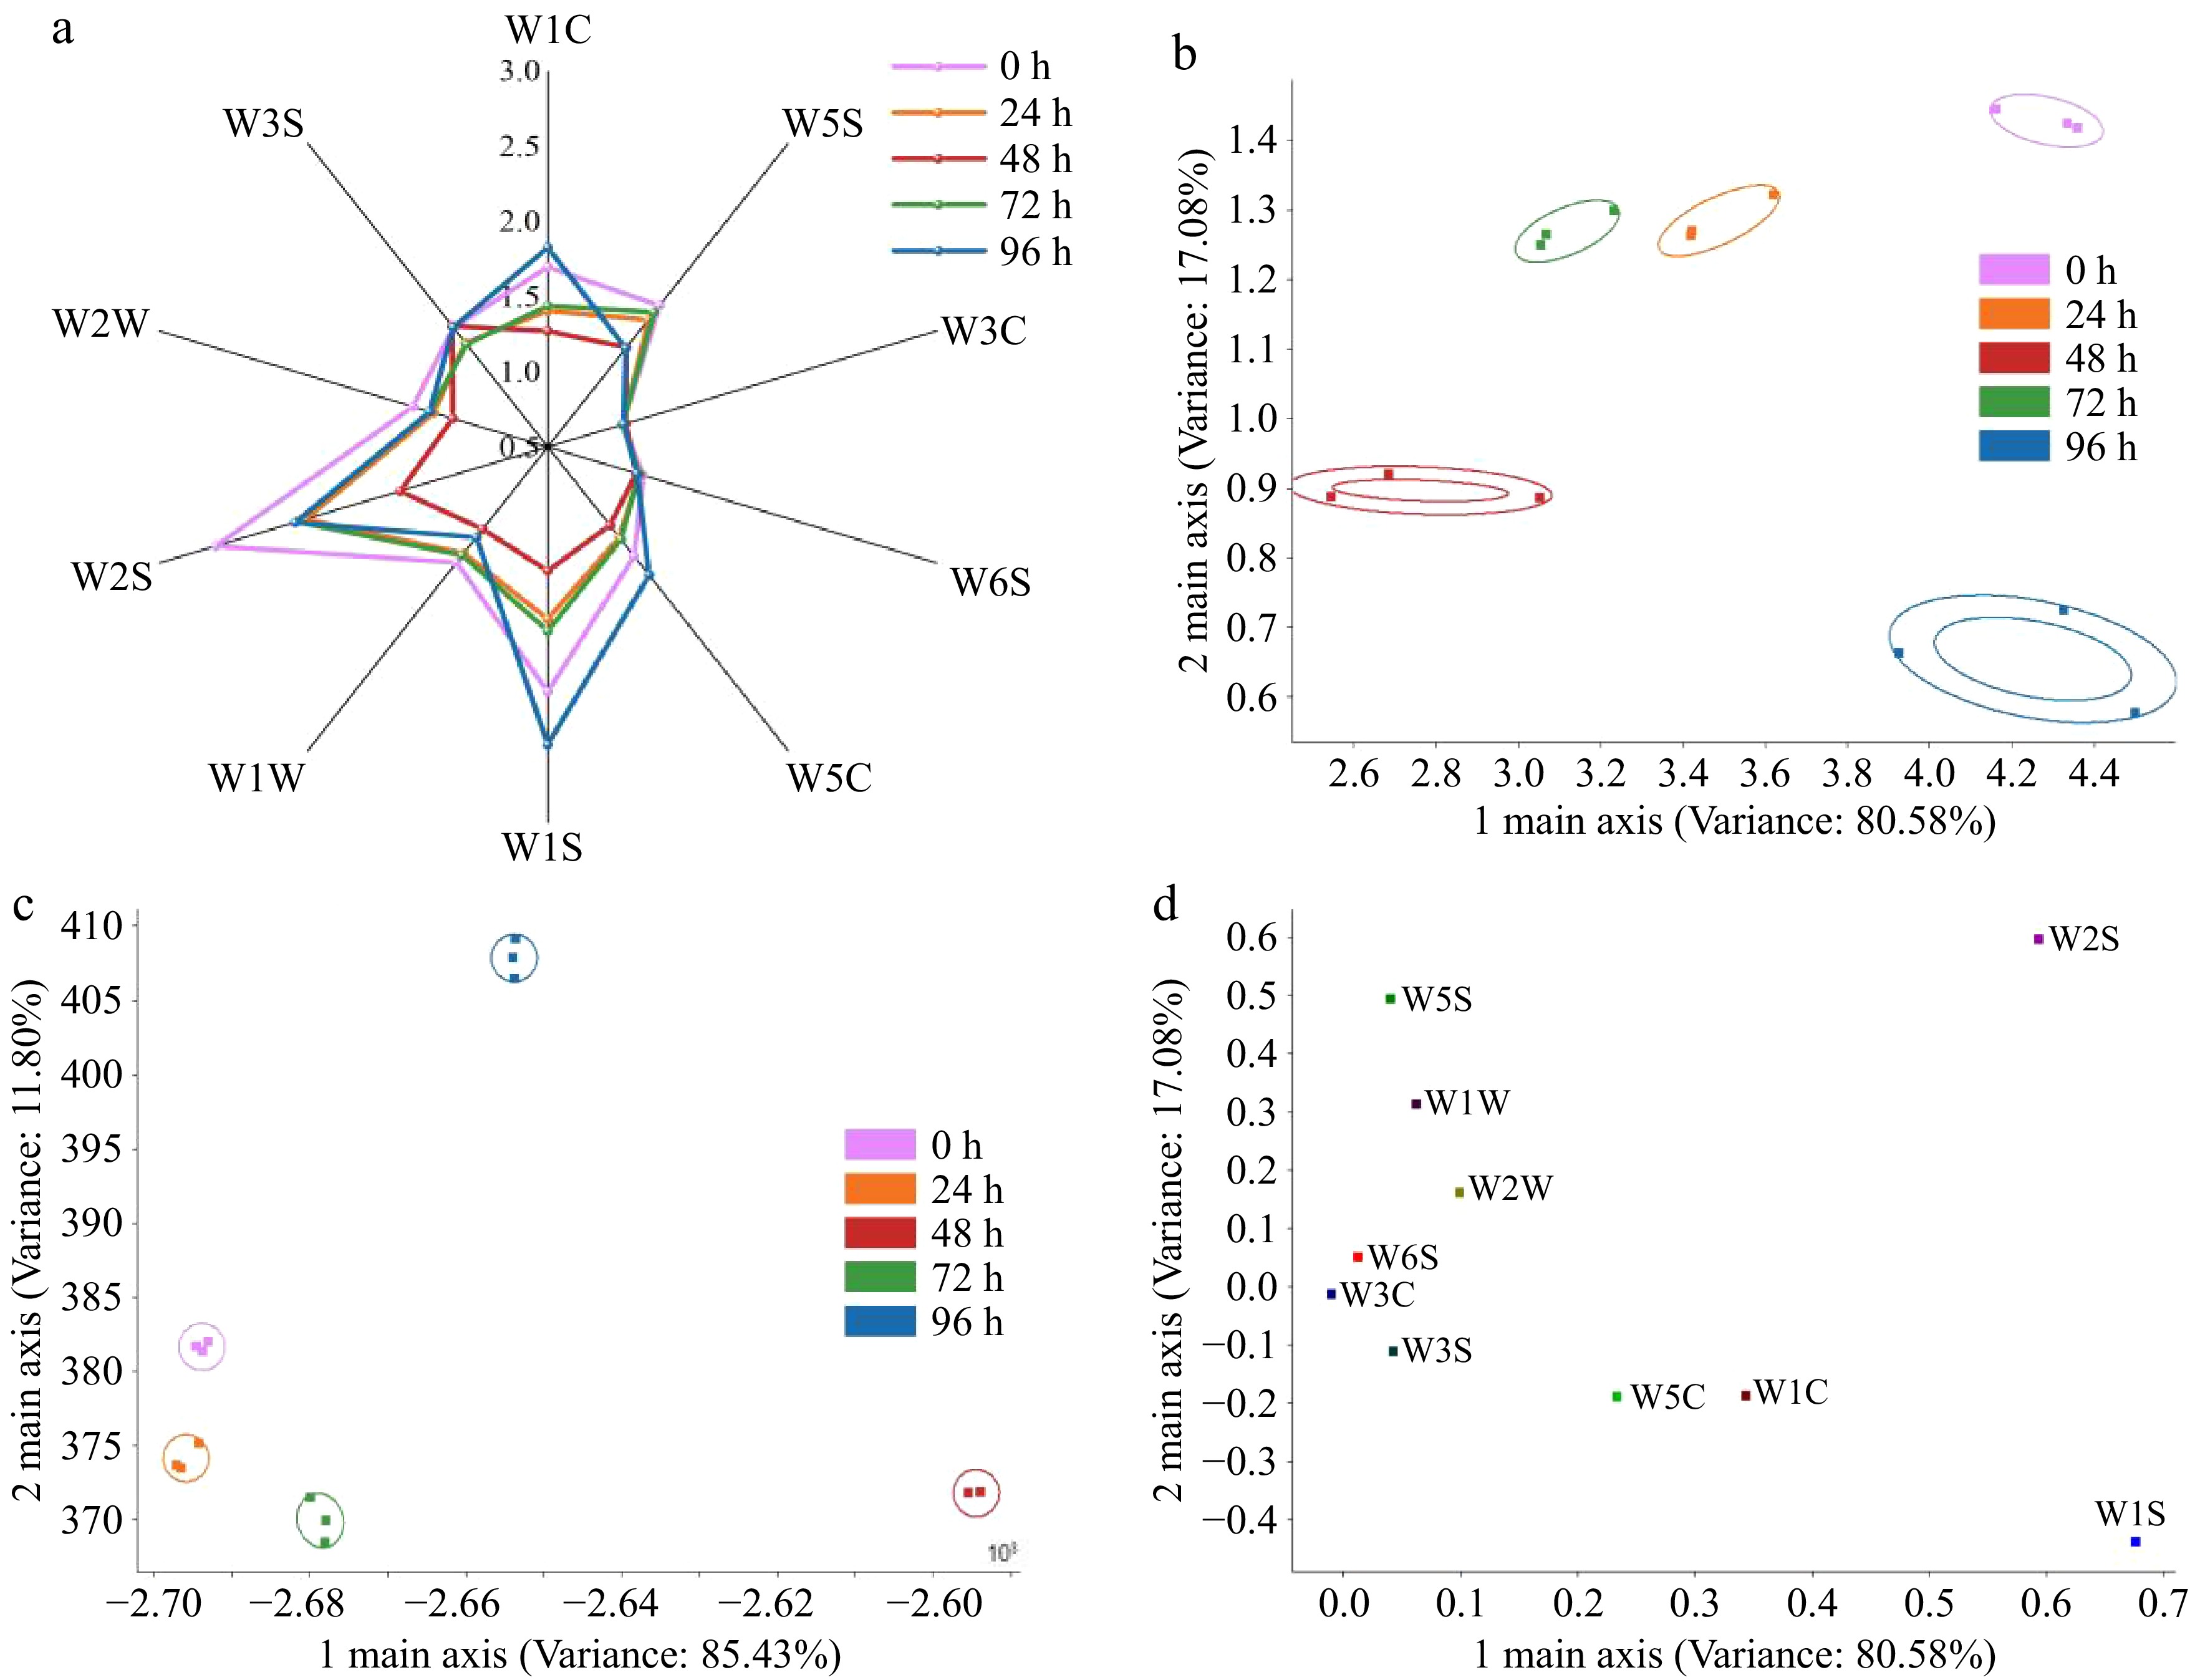
Figure 4.
The E-nose characterization of flavor profile evolution in FAJ during fermentation. The figure is organized as follows: (a) radar plot, (b) PCA plot, (c) LDA plot, and (d) loading analysis plot.
PCA of the electronic nose data showed that the cumulative variance explained by PC1 and PC2 reached 97.66%, effectively discriminating aroma patterns over time (Fig. 4b). The 0, 48, and 96 h samples occupied distinct subspaces, indicating that the juice developed uniquely characteristic and significantly different overall flavor profiles at the start, mid-point, and end of fermentation. LDA yielded a cumulative discrimination power of 97.23%, further confirming the presence of distinctive aromatic profiles corresponding to each fermentation (Fig. 4c).
Load analysis (Fig. 4d) showed that sensor W1S had the greatest displacement along the second principal component, reflecting the contribution of sulfides. Sensor W1W shifted most along the first principal component, associated with methyl-containing compounds such as esters, aldehydes, and ketones. Other sensors also indicated roles of sulfides, nitrogen oxides, alcohols, aldehydes, and ketones. These changes together contributed to a more complex and harmonious flavor profile, consistent with the electronic nose responses.
Correlation analysis
-
To examine associations between quality indicators and sensory evaluations across fermentation stages, correlation analyses were performed (Fig. 5a–e). Unfermented juice demonstrated significant negative correlations between pH and sensory attributes taste and flavor (Fig. 5a). At 24 h fermentation, concentrations of W1C, W1S, and W1W showed significant positive correlations with all sensory parameters (color, shape, taste, flavor, acidity, sweetness, after-taste, and overall acceptance), while b* values exhibited significant negative correlations with juice acidity (Fig. 5b). For 48 h fermented samples (Fig. 5c), significant inverse relationships emerged between both L* values, pH values, and sensory coefficients. The 72 h fermentation model also showed a significant negative correlation between the L* value and various sensory attributes (Fig. 5e), whereas 96 h fermented samples manifested significant negative correlations between TFC and sensory coefficients (Fig. 5e).
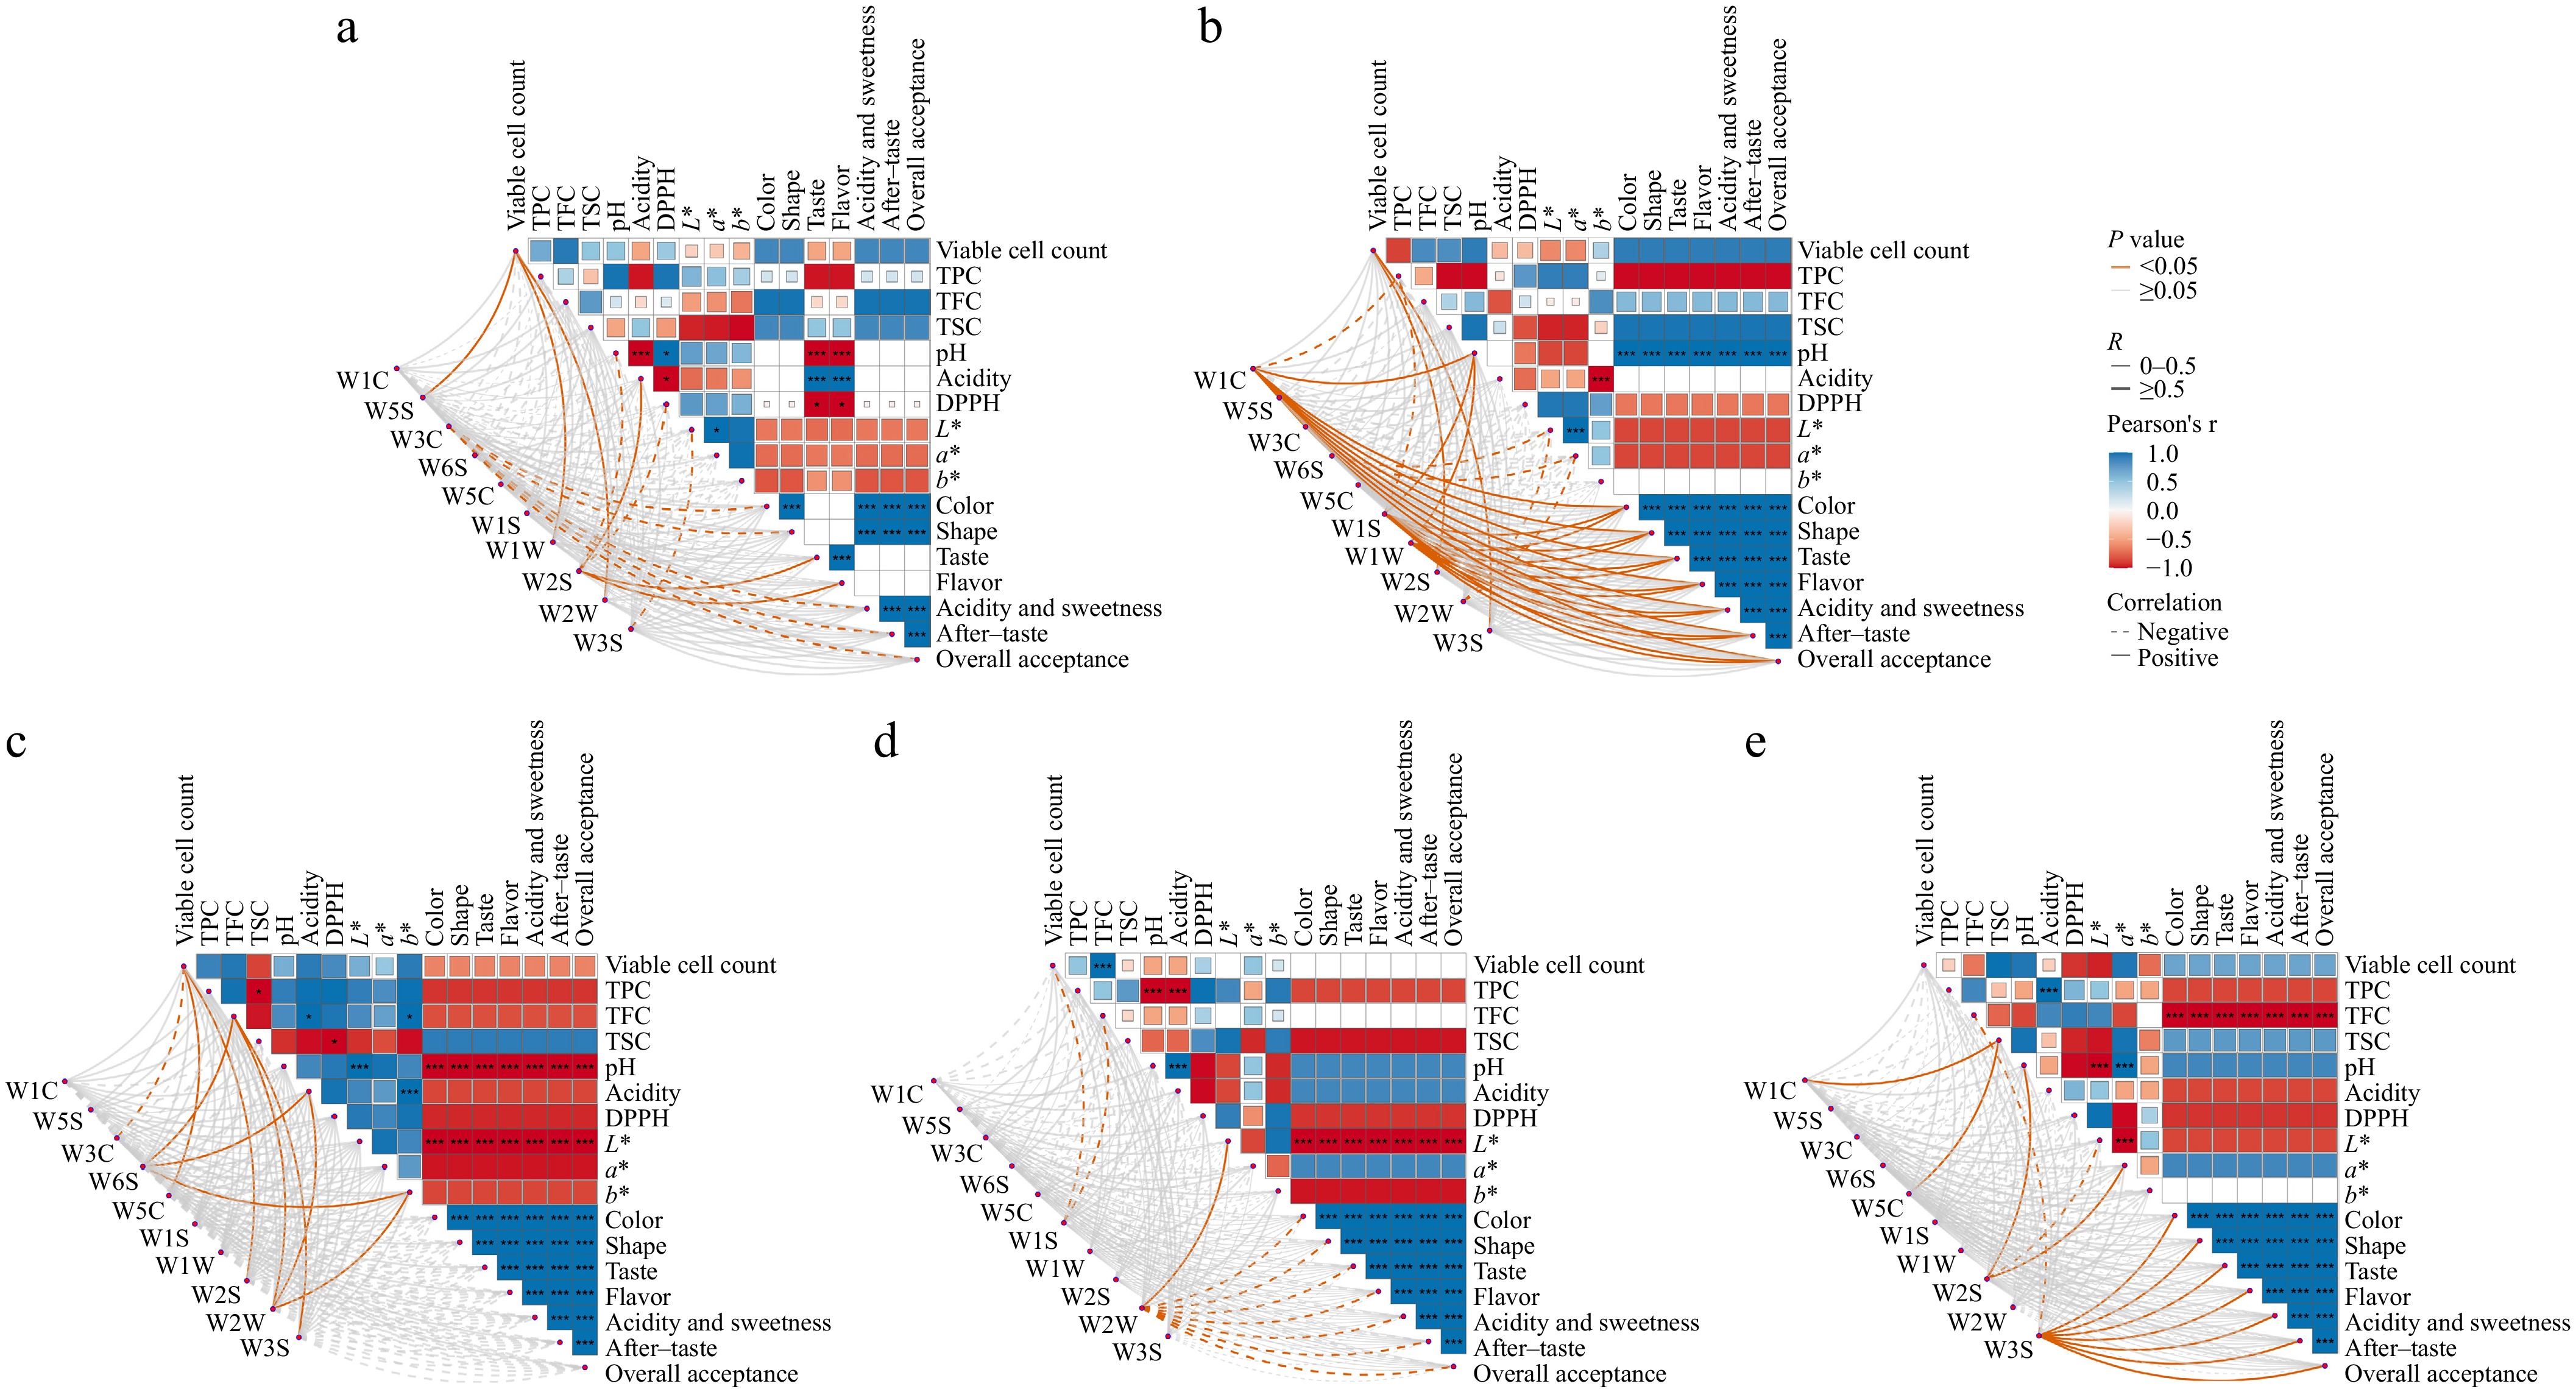
Figure 5.
Heatmaps of flavor volatile variations in FAJ during fermentation analyzed by electronic nose, with panels (a) to (e) showing the characteristic profiles at 0, 24, 48, 72, and 96 h, respectively. The color bar gradient from red to blue represents negative to positive correlation. Statistical significance is indicated as * p < 0.05, or *** p < 0.01.
-
The results of the study indicate that the viable bacterial count exhibited a rapid increase during the initial 24 h of fermentation, followed by a gradual decline from 24 to 96 h[22]. The overall increase in bacterial count can be attributed to the binary fission mode of reproduction, which is a hallmark of lactic acid bacteria (LAB) proliferation in nutrient-rich environments[23]. This decrease in viable counts after 24 h can be attributed to multiple stress factors associated with the A. melanocarpa juice matrix, including low pH, accumulation of organic acids, and high concentrations of polyphenols, which are known to exert antimicrobial or bacteriostatic effects on lactic acid bacteria[24]. Under such conditions, bacterial cells may experience membrane destabilization, reduced enzymatic activity, or oxidative stress, leading to inhibited growth or partial loss of culturability[9]. Even though a decline in viability occurred, the probiotic counts in the juice exceeded 6 log CFU/mL at both 24 and 48 h, thereby meeting the universally accepted threshold for effective probiotic delivery[25].
The initial pH value of fresh A. melanocarpa juice was 3.75, reflecting its inherently acidic nature. During fermentation, the pH increased slightly within the first 48 h (from 3.75 to 3.80), and then remained relatively stable, whereas titratable acidity continuously decreased, indicating a decoupling of pH and acidity variations[26]. The pH rise may be attributed to the utilization of nitrogenous compounds by microorganisms, which can generate alkaline metabolites, such as ammonia and amines[27]. Simultaneously, the initiation of malolactic fermentation played a crucial role in this atypical acidity profile. Lactic acid bacteria can decarboxylate strong dicarboxylic acids (such as malic acid) into weaker monocarboxylic acids (such as lactic acid), and carbon dioxide, thereby inherently reducing the total titratable acidity and contributing to the initial pH elevation. Notably, the correlation between pH and titratable acidity was not constant throughout fermentation, but exhibited clear stage-dependent characteristics. As fermentation progressed, the rapid proliferation of LAB led to the accumulation of acidic metabolites, including lactic acid and acetic acid, resulting in a subsequent pH decline[28]. Furthermore, microbial enzymatic activities, particularly the hydrolysis of polysaccharides into fermentable monosaccharides, provide additional substrates for acid production, while simultaneous interactions between organic acids and phenolic compounds, such as complexation or precipitation, may reduce the proportion of free titratable acids measurable in the juice system[29,30]. These monosaccharides were subsequently metabolized into organic acids, further contributing to the pH reduction. Thus, the observed pH fluctuations reflect the complex interplay between microbial nitrogen metabolism, acid production, and enzymatic hydrolysis of carbohydrates[31]. These results indicate that the dynamic relationship between pH and acidity during fermentation is governed by the evolving composition of organic acids, rather than by total acid concentration alone.
Phenolic compounds, renowned for their potent antioxidant properties, play a crucial role in eliminating free radicals and are often used as quality indicators in fermented products[32]. During fermentation, the TPC of A.melanocarpa juice generally exhibited a declining trend. This phenomenon can be primarily attributed to microbial enzymatic activities and physicochemical interactions occurring during lactic acid fermentation. Specifically, phenolic compounds may interact with proteins, polysaccharides, or microbial cell surfaces through adsorption, hydrogen bonding, or complex formation, leading to partial precipitation or reduced extractability. For instance, in goji berry juice fermentation, phenolic compounds have been shown to form complexes with proteins. These interactions, combined with microbial adsorption, contribute to the observed decrease in phenolic content during fermentation[33].
Flavonoids, recognized for their significant antioxidant activity, exhibit dynamic changes during fermentation. Studies have demonstrated that flavonoid content initially decreases sharply before gradually increasing as fermentation progresses[34]. In the early stages, microbial enzymes, such as glycosidases, catalyze the deglycosylation of flavonoid glycosides, converting them into flavonoid aglycones and sugars. These aglycones are typically less stable than their glycosylated precursors and are highly susceptible to further oxidative degradation, leading to the initial decline[35]. As fermentation advances, microbial enzymes facilitate the breakdown of plant cell walls, releasing bound flavonoids and converting them into free forms, thereby increasing flavonoid content[36]. Moreover, fermentation byproducts, such as ethanol, enhance the solubility of flavonoids, allowing more to dissolve into the juice. Under specific conditions, certain microorganisms may also synthesize additional flavonoid compounds, further elevating their content[37]. Importantly, a reduction in TPC and TFC values does not necessarily imply a loss of antioxidant functionality. Fermentation can convert polymeric or glycosylated phenolics into smaller phenolic acids or aglycones with altered redox properties.
The trend of first decreasing and then increasing DPPH scavenging activity may be attributed to microbial metabolic competition in the juice. Enzymatic oxidation reactions, such as those catalyzed by enzymes secreted by microorganisms[38], can oxidize antioxidant substances like polyphenols in the juice, generating products with weaker antioxidant capacity, which reduces the DPPH radical eliminating ability. The significant increase in the DPPH radical eliminating ability of the juice between 72 and 96 h may be due to the release and transformation of antioxidant substances. During fermentation, microbial enzymes break down plant cell walls, releasing antioxidants like polyphenols and flavonoids, and generate additional ones, increasing the variety and quantity of DPPH radical scavengers[39].
The increase in the a* value may be attributed to structural changes or reactions of pigment substances, such as anthocyanins[40] in the juice during fermentation, leading to the formation of substances with a more reddish hue[41], thereby causing the rise of a* value. For instance, in grape juice fermentation, anthocyanins may combine with substances like tannins, forming complexes that result in a redder color[42]. Color changes, reflecting the release and transformation of phenolic compounds and microbial enzyme activity, enhance the juice's sensory properties, with improved color vividness and acceptability observed particularly at 24 h of fermentation.
Overall, fermentation enhances both the nutritional and sensory attributes of A.melanocarpa juice, boosting its antioxidant capacity and consumer appeal[43]. The fermented juice demonstrates a more pronounced sweet-sour profile, better aligning with consumer preferences for balanced sweetness and acidity[44]. This improvement in sensory properties is attributed to the generation of aromatic compounds, aliphatic aromatics, and methyl compounds during fermentation, which enhance the overall aroma and flavor profile of the juice[45]. Additionally, the reduction in astringency and undesirable flavors, along with the optimization of volatile compounds, contributes to the enhanced sensory appeal of the fermented A.melanocarpa juice[46].
Through electronic nose analysis, aldehydes and alcohols were identified as key contributors to the flavor profile of FAJ, consistent with their known association with fresh and fruity aromas[12]. During fermentation, the abundance of W1C initially increased, likely reflecting the synthesis of phenolic compounds under oxidative stress. During this period, the system showed active synthesis of aromatic compounds contributing to significant increases in the content of benzene derivatives and aldehydes or ketones, as well as the activation of antioxidant defense systems[11]. These later declined due to oxidative degradation[47]. Meanwhile, W5C remained relatively stable, suggesting equilibrium in alkane-related metabolism, whereas W3C rebounded at 96 h, possibly linked to ester hydrolysis releasing additional aromatic components[48]. The combined effect of these aromatic compounds endow FAJ with its unique flavor characteristics[49].
In the 24 h fermentation model, the concentrations of W1C, W1S, and W1W demonstrated significant positive correlations with all sensory parameters (including shape, taste, flavor, acidity and sweetness, aftertaste, and overall acceptability), suggesting that these volatile compounds produced during the early fermentation stage may contribute to improved sensory quality. Notably, in both the 48 and 72 h fermentation models, a significant negative correlation was observed between L* value and sensory scores, which may be attributed to the Maillard reaction, simultaneously generating dark-colored compounds and rich flavors[50]. In the 96 h fermentation model, a significant negative correlation was also found between TFC and sensory scores, possibly due to the hydrolysis of glycosides and consumption of sugars, leading to a more pronounced bitterness[51].
-
The effects of L. casei 139 fermentation on physicochemical properties, antioxidant activity, and flavor characteristics of A. melanocarpa juice were investigated. The viable cell count increased rapidly during the first 24 h, reaching 6.00 lg CFU/mL, after which it gradually declined. The pH of the juice initially increased, then gradually decreased. The acidity of the juice showed a continuous downward trend during the fermentation process, and the abnormal decrease in acidity may be due to the conversion of stronger fruit acids into milder lactic acid during fermentation. Additionally, TPC generally decreased during fermentation, while TFC decreased at the beginning and then increased. Although TPC declined, the DPPH radical eliminating activity increased within 96 h of fermentation, reaching a peak of 70.14%, which may be attributed to the formation of small-molecule phenolic acids and other metabolites with strong antioxidant activity. Through sensory evaluation and electronic nose analysis, an increase was observed in the types and contents of aromatic compounds during fermentation. Combined with sensory evaluation and electronic nose analysis, color difference analysis further confirmed the significant impact of fermentation time on flavor optimization, providing an essential basis for improving the fermentation process. In conclusion, fermentation for 48 h yielded the optimal comprehensive quality of A. melanocarpa juice, achieving a superior balance between sensory refinement, aroma enhancement, and nutritional retention. Given the improved sensory and functional properties observed, future studies should focus on the bioavailability of fermented juices with good sensory performance.
This work was supported by the Guangdong Provincial Seed Industry Revitalization Special Program (2024-WPY-00-008) and Guangzhou Science and Technology Program (2024B03J1354).
-
This study was conducted in strict accordance with the principles of the Declaration of Helsinki and involved human subjects in its sensory evaluation phase. The experimental protocol was reviewed and approved by the Experimental Animal Ethics Committee of South China Agricultural University (Approval No.: SCAU2025c072). Informed consent was obtained from all participants prior to their involvement in the study. Each participant provided written consent via a signed consent form. Before consent was obtained, the investigators provided all prospective participants with a clear, thorough, and sufficient explanation of the study to ensure they were fully informed before deciding whether to participate.
-
The authors confirm their contributions to the paper as follows: investigation: Liao J, Liu M; data curation: Liu M, Chen R; validation: Hao F, Liu X, Fang X; software: Hao F, Liu X; methodology: Fang Y; formal analysis: Fang Y, Chen R; conceptualization: Yang X, Fang X; resources: Yang X; funding acquisition: Fang X; writing – review & editing, Visualization: Dong S; writing – original draft: Liao J. All authors reviewed the results and approved the final version of the manuscript.
-
All data generated or analyzed in this study are included within this manuscript and its supplementary information.
-
The authors declare that they have no conflict of interest.
- Supplementary Table S1 Scoring criteria for FAJ.
- Copyright: © 2026 by the author(s). Published by Maximum Academic Press on behalf of China Agricultural University, Zhejiang University and Shenyang Agricultural University. This article is an open access article distributed under Creative Commons Attribution License (CC BY 4.0), visit https://creativecommons.org/licenses/by/4.0/.
-
About this article
Cite this article
Liao J, Liu M, Hao F, Fang Y, Chen R, et al. 2026. Dynamic modulation of nutritional and flavor profiles in Aronia melanocarpa juice during fermentation with Lactobacillus casei 139. Food Innovation and Advances 5(1): 55−63 doi: 10.48130/fia-0026-0004 

Dynamic modulation of nutritional and flavor profiles in Aronia melanocarpa juice during fermentation with Lactobacillus casei 139
- Received: 23 November 2025
- Revised: 19 January 2026
- Accepted: 19 January 2026
- Published online: 28 February 2026
Abstract: The dynamic regulatory mechanisms by which Lactobacillus casei 139 fermentation modulates the nutritional components and flavor characteristics of Aronia melanocarpa (Michx) Elliott juice were investigated through a systematic evaluation of temporal changes in nutritional and flavor profiles during fermentation. The results indicated that the viable cell density peaked at 6.01 log CFU/mL within 24 h. During fermentation, the pH of A. melanocarpa juice initially increased slightly within 48 h before gradually decreasing, while titratable acidity consistently decreased, reflecting the metabolic activity of Lactobacillus casei 139. Concurrently, total sugar content exhibited a decline followed by a leveling off to a steady state. It was found that the contents of total phenolic and flavonoid contents decreased initially, while the color difference a* first decreased, then increased. Combined electronic nose and sensory analyses revealed that fermentation enhanced aroma complexity, and mitigated astringency by promoting aromatic compound accumulation. The research confirms that fermentation with strain L. casei 139 can effectively improve both the sensory quality and nutritional value of fermented A. melanocarpa beverages.