-
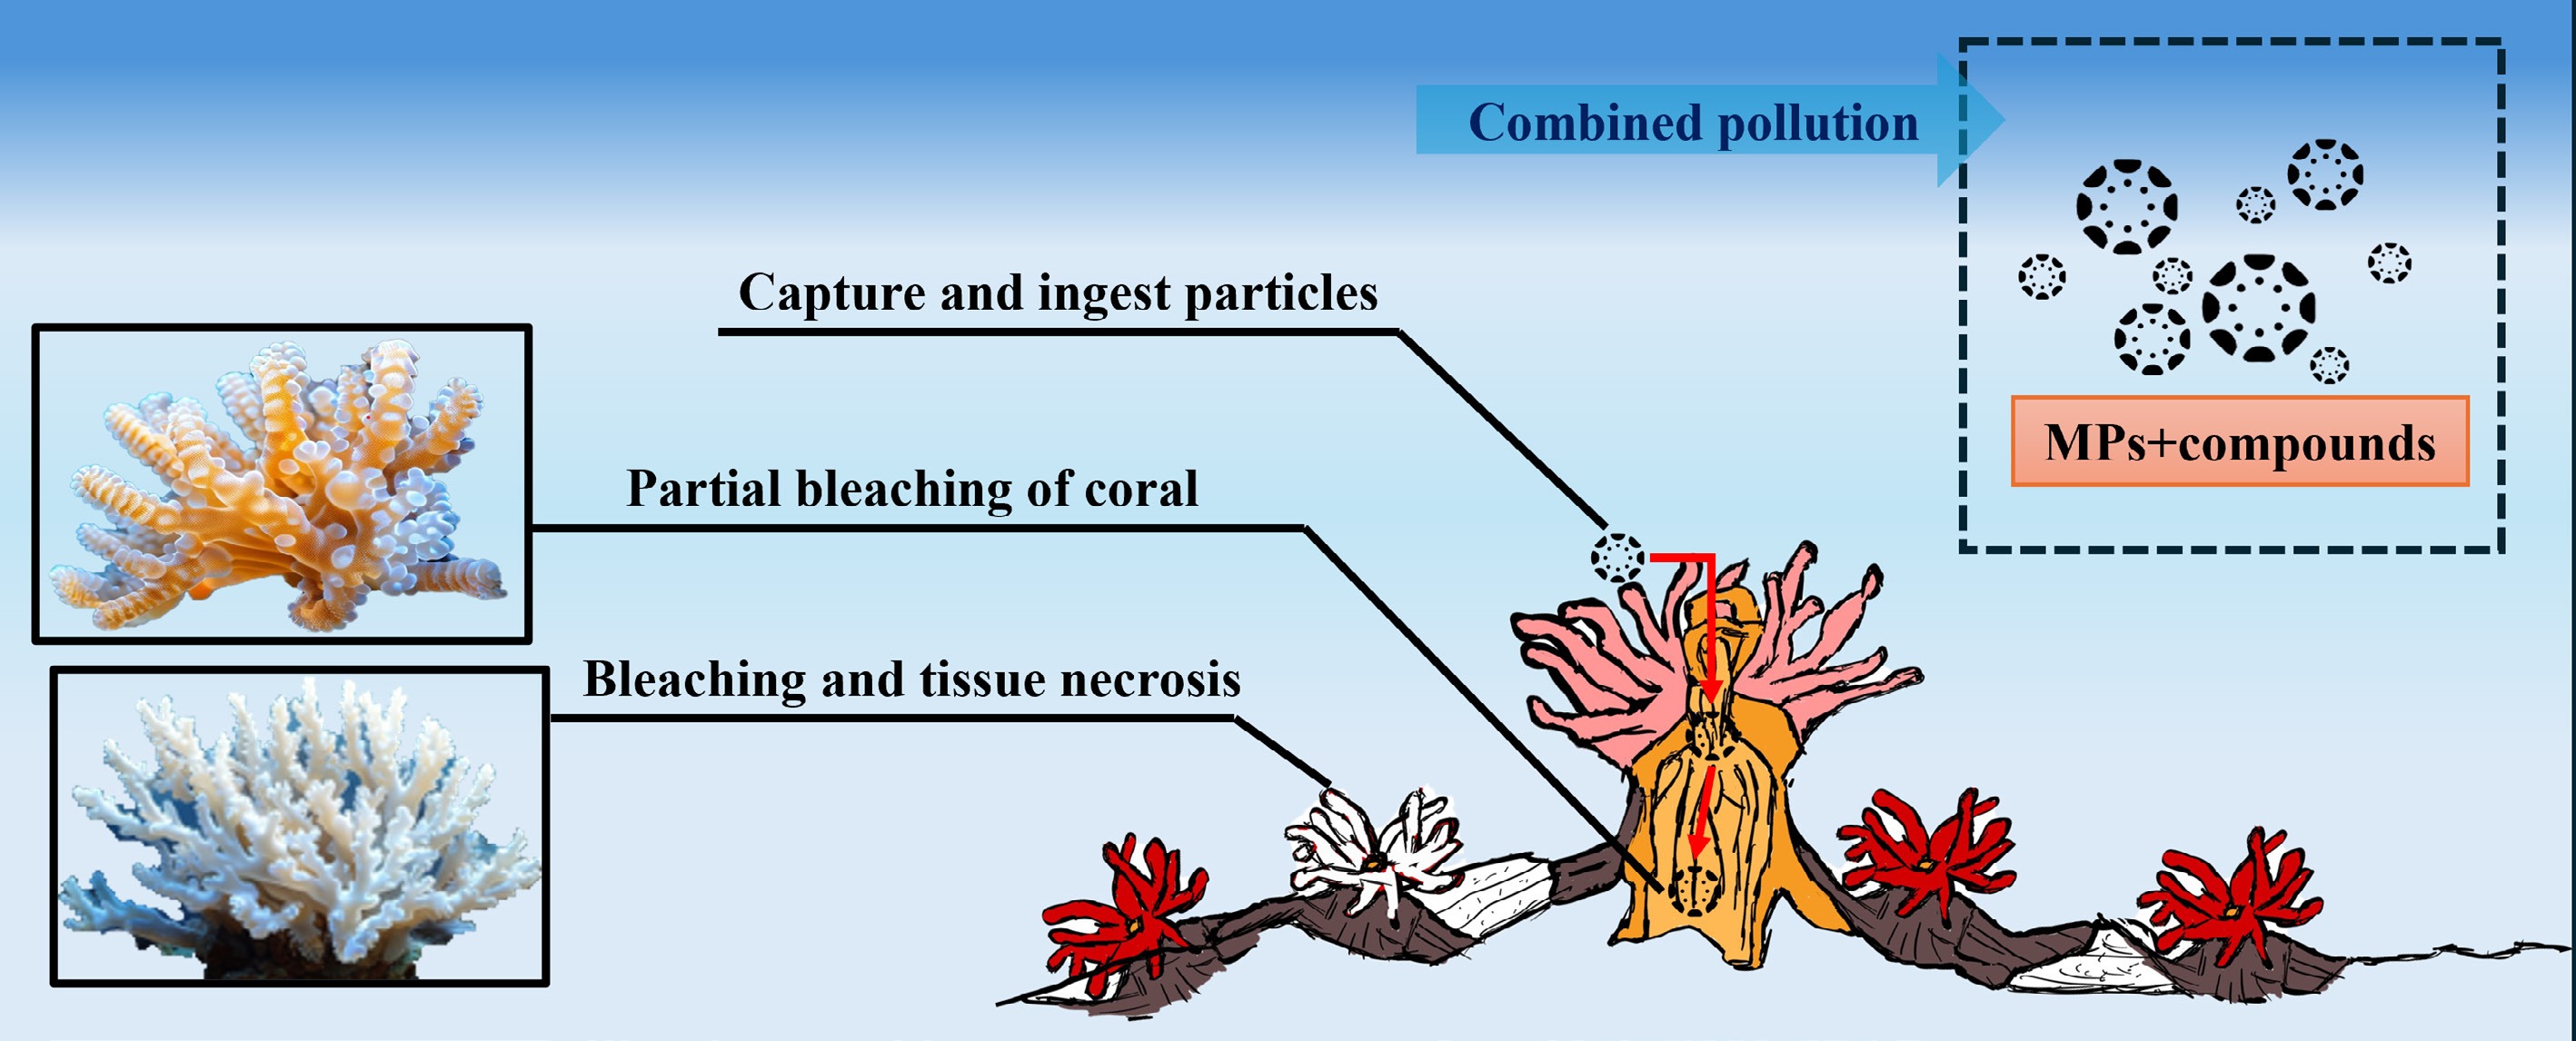
Figure 1.
ECs are captured and absorbed by coral and cause coral bleaching.
-
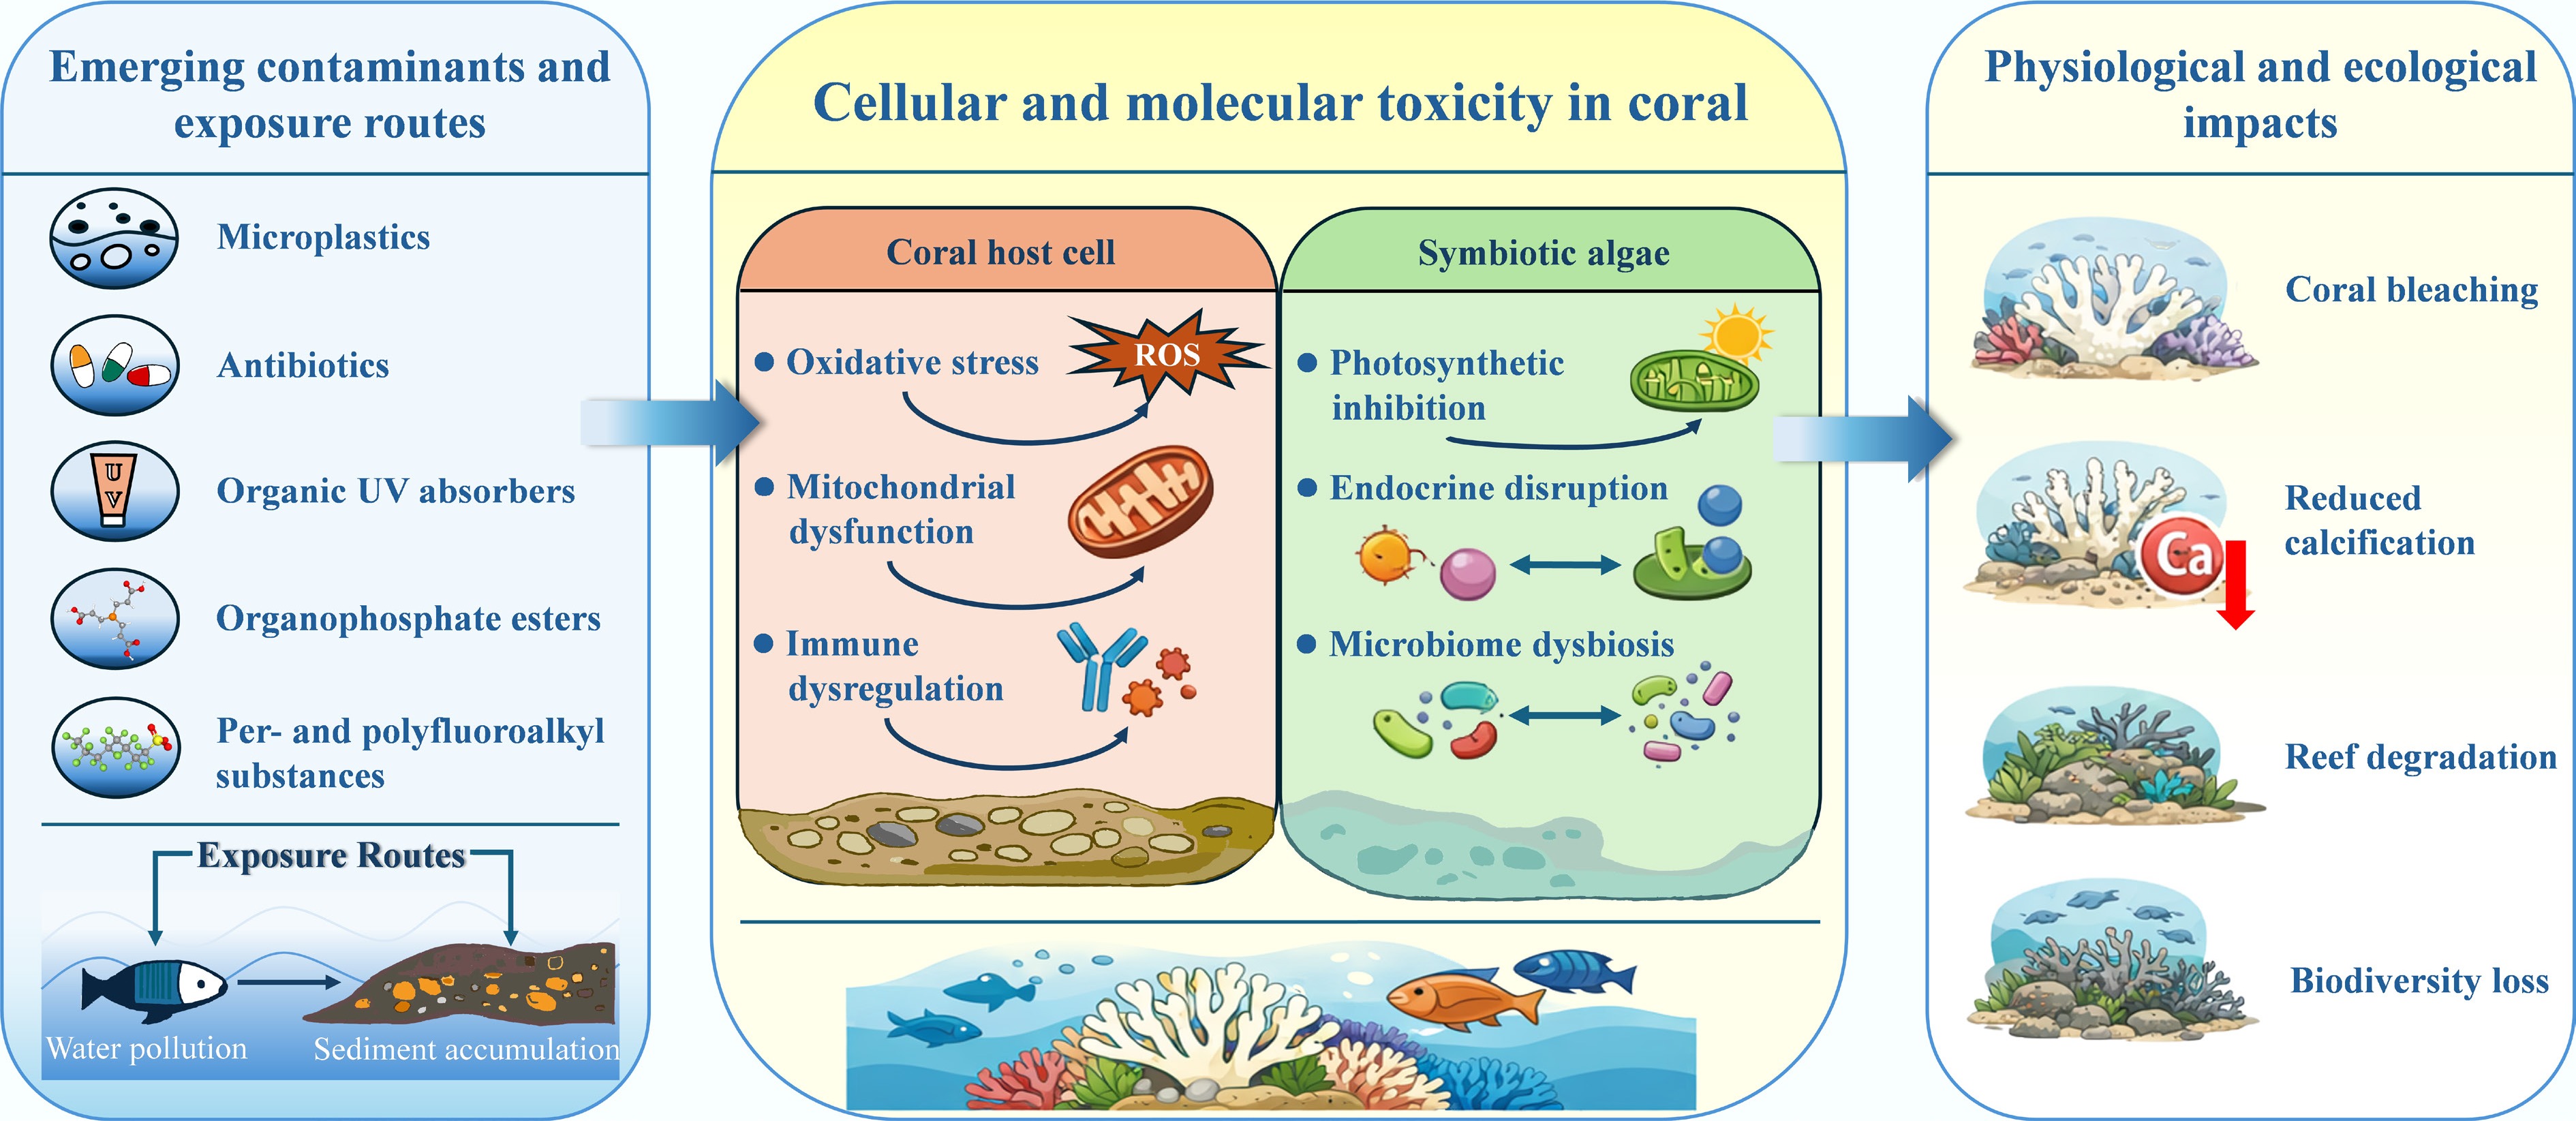
Figure 2.
Exposure pathways, cellular toxicity mechanisms, and ecological consequences of ECs in coral reef ecosystems.
-
Sea area MP type Physical property Seawater Sediment Fish Coral tissue Ref. The Xisha Islands, South China Sea PP (53.85%), PS (11.54%),
HDPE (9.62%), EVA (7.69%)Fragment (58.08%) and film (36.54%); transparent (76.92%) and yellow (15.38%) − 0–2,444 items kg−1; average: 682 ± 780
items kg−1− − [59] The Xisha Islands, South China Sea CP (61.13%),
PET (33.49%)Transparent 9.5 ± 3.7 particles L−1 280.9 ± 231.9
particles kg−1− P. damicornis (0.9 ± 0.5), G. fascicularis (1.2 ± 0.6), P. lutea (2.5 ± 1.6) particles cm−2 [53] The Xisha Islands, South China Sea PET, PVDC, PE,
PA, PVC, CPEFiber (79.9%), fragment (13.2%), and particle (5.2%) 1.0–12.2 particles L−1;
average: 6.1 particles L−1− 0–4.7 items g−1 1.0–44.0 items individual−1; 0.02–1.3 items g−1 [60] The Nansha Islands,
South China SeaPP, PE Transparent, blue and green 0.0112–0.149 nm−3; average: 0.0556 ± 0.0355 nm−3 − − − [61] Sanya Bay,
South China SeaPET, CP, PE, PS,
PA, PP, PEFibrous; transparent and black 18.37 ± 2.60 particles L−1 − − A. millepora (0.27 ± 0.26 items/polyp), G. fascicularis (2.32 ± 0.86 items/polyp) [62] Hainan Island in the South China Sea CP, PET, PE, PS, PA Fibrous; black 14.90 ± 7.76 particles L−1 343.04 ± 266.13
particles kg−10.67–3.12 items g−1 P. damicornis (3.68 ± 3.94 particles cm−2), G. fascicularis (5.89 ± 5.15 particles cm−2) [54] Coral Reef Islands in the South China Sea PP, PE, PET, PC, PA Less than 1 mm accounted for 75% Xisha Islands: 60–610 particles kg−1; Nansha Islands: 40–100 particles kg−1; Weizhou Island: 60–90 particles kg−1; Sanya Luhuitou: 50–530 particles kg−1 − − − [63] Hong Kong Bay PE (51.9%), PET (29.3%),
PP, PS, PVCFiber (48.5%),
film (40.8%)− 171.7–223 items kg−1; average: 196.0 ± 39.5 items kg−1 − 189 ± 50 items kg−1 [64] PP stands for polypropylene; PE for polyethylene; PET for polyethylene terephthalate; PS for polystyrene; PVC for polyvinyl chloride; PC for polycarbonate; CP for cellophane; HDPE for high-density polyethylene; EVA for ethylene vinyl acetate polymer; PA for polyamide, nylon. Table 1.
Concentrations of MPs in seawater, sediments, and coral tissues across selected Chinese reef regions
-
Area Matrix ΣABs DF% Max Ref. Bohai Sea, Dalian Seawater 22.6–2,402.4 ng L−1 ENR (100%), TMP (100%), SMX (90.9%) ENR: 2,364.8 ng L−1 [68] Along the coast of Liaodong Peninsula, China Seawater Nd–25.0 ng L−1 SMX (62.5%), ENR (43.8%), OFX (37.5%) OFX: 25.0 ng L−1 [65] Sanya Coral Reef Reserve in the South China Sea Seawater 17.7–44.2 ng L−1 Quinolones (88%), NFC (34.83%), Sulfonamides (6.83%) NFC: 5.07 ng L−1 [17] Coral host 0.54 ± 0.34 ng cm−2 MAR (76%), TIL (32%), SPZ (26%) TIL: 2.315 ng cm−2 Symbiotic algae 0.05 ± 0.05 ng cm−2 STZ (84%), SMX (44%), SCP (40%) SDZ: 0.312 ng cm−2 Beibu Gulf, South China Sea Seawater Winter: Nd–364 ng L−1 FF (96%), TMP (93%), SMX (89%), SDZ (89%) FF: 72.1 ng L−1 [71] Seawater Summer: Nd–70.1 ng L−1 DETM (97%), FF (93%), TMP (90%) FF: 48.6 ng L−1 Northern South China Sea Seawater 43.2–441 ng L−1 – ETM-H2O: 31.6–234 ng L−1 [28] Coral Reef Area in the South China Sea Seawater Nd–6.3 ng L−1 DETM (100%), RTM (100%), CTM (100%) SMX: 6.3 ng L−1 [27] Coral Reef Area in the South China Sea Coral reef fish 0.019–5.3 ng g−1 ww DETM (100%), NOX (100%), SDZ (78%) NOX: 4.7 ng g−1 ww [70] Coral Reef Area in the South China Sea Coastal seawater 4.36 ± 1.71 ng L−1 DETM (100%), RTM (100%), CTM (100%) RTM: 1.01 ± 0.78 ng L−1 [69] Offshore seawater 0.71 ± 0.60 ng L−1 DETM (100%), RTM (100%), CTM (100%) SMZ: 0.26 ± 0.37 ng L−1 Coastal coral 28.2 ± 43.7 ng g−1 dw NOX (100%), DETM (88%), RTM (88%) CIX: 8.40 ± 36.0 ng g−1 dw Offshore coral 31.4 ± 24.9 ng g−1 dw TMP (100%), SDZ (100%), SMZ (100%) SDZ: 9.74 ± 5.72 ng g−1 dw Beibu Gulf Water 1.79–885 ng L−1 NOX (100%), CIX (100%), CTM (100%) FF: 578 ng L−1 [67] Sediment 0.023–525 ng g−1 TMP (100%), NOX (92%), CIX (83%) NOX: 52.5 ng g−1 Feed 0.03–95.4 ng g−1 – TMP: 95.4 ng g−1 Shrimp 1.8–10.55 ng g−1 NOX (87.5%), CTM (62.5%), DETM (50%) SMX: 8.21 ng g−1 Crab 1.66–5.67 ng g−1 NOX (100%), DETM (50%), TMP (37.5%) NOX: 3.14 ng g−1 Oysters 1.81–6.77 ng g−1 DETM (100%), CIX (75%), SPD (75%) DETM: 3.76 ng g−1 Beibu Gulf Water 52.94–77.76 ng L−1 ETM-H2O (100%), NOX (100%), ENX (100%) ETM-H2O: 27.85 ng L−1 [72] Sediment 9.69–15.43 ng g−1 dw NOX (100%), OFX (100%), CIX (100%) NOX: 7.63 ng g−1 dw Marine life 0.68–4.75 ng g−1 ww ENX (92.86%), NOX (82.14%), OFX (64.29%) ENX: 3.15 ng g−1 ww Qinzhou Bay, Guangxi Aquaculture water 0.81–1,386 ng L−1 NOX (86.7%), ENX (86.7%), FF (53.3%) DETM: 1,290 ng L−1 [73] Sediment 1.56–80.6 ng g−1 dw NOX (100%), ENR (100%), CIX (80%) NOX: 3.06 ng g−1 dw Biota 0.17–5.26 ng g−1 ww NOX (100%), TMP (84.6%), SMX (61.5%) NOX: 2.23 ng g−1 dw Feed Nd–5.06 ng g−1 ENR (66.7%), SDZ (66.7%), CIX (66.7%) ENR: 1.86 ng g−1 Bohai Sea, Yellow Sea,
East China Sea and
South China SeaSeawater 389–3,302.3 ng L−1 NFC (100%), RTM (100%), CFC (94.12%) NFC: 1,990 ng L−1 [66] DF: Detection frequency, Nd: Not detected, ENR: Enrofloxacin, TMP: Trimethoprim, FF: Florfenicol, SMX: Sulfamethoxazole, SDZ: Sulfadiazine, DETM: Dirithromycin, ETM-H2O: Erythromycin hydrate, RTM: Roxithromycin, CTM: Clarithromycin, NOX: Norfloxacin, SMZ: Sulfamethazine, CIX: Ciprofloxacin, AZM: Azithromycin, ENX: Enoxacin, OFX: Ofloxacin, NFC: Norfloxacin, CFC: Cefaclor, TIL: Tilmicosin, MAR: Marbofloxacin, SPZ: Sulfaphenazole, STZ: Sulfathiazole, SCP: Sulfachloropyridazine. Table 2.
Concentrations of antibiotics in selected sea areas and coral reef regions of China
-
Area Matrix OUVAs DF% ΣOUVAs Max Ref. Virgin Islands Seawater BP-3 − − BP-3: 75–1,400 µg L−1 [74] Hawaii Seawater BP-3 − − BP-3: 0.8–19.2 µg L−1 [74] Pearl River Estuary, South China Sea Seawater 7 types including
BP-3, BP-8, OC, etc.BP-3 (100%) − BP-3: 13.2–31.7 ng L−1 [75] Sediment BP-3 (100%) − BP-3: 4.2–17.0 ng g−1 dw Coral BP-3 > 65%,
BP-8 > 65%− BP-3: 1–38.4 (31.8 ± 8.6) ng g−1 ww;
BP-8: 1.3–19.9 (24.7 ± 10.6) ng g−1 wwOahu Island, Hawaii Seawater 13 types including
BP-3, HMS, OS, etc.BP-3 (100%), OC (95%), HMS (65%), OS (63%) 6.8–745.3 ng L−1 HMS: 53.0–625.7 ng L−1;
OS: 33.1–96.0 ng L−1[76] Sediment HMS (91%), OS (88%),
OC (65%), BP-3 (56%)0.38–67.37 ng g−1 dw HMS: 0.08–38.54 (25.85 ± 13.72) ng g−1 dw;
OC: 0.16–19.64 (10.52 ± 7.26) ng g−1 dwCoral tissue HMS (100%), OS (100%), OC (96%), BP-3 (82%) 666.2–1,178.4 ng g−1 dw OC: 210.4–527.1 (404.1 ± 75.3) ng g−1 dw;
HMS: 188.7–441.1 (368.5 ± 51.5) ng g−1 dwCoral Reef Area, South China Sea Coral 10 types including
BP-3, EHMC, OCR, etc.4-MBC, OD-PABA, EHMC and UV-327 > 80% 2.31 ± 1.96 μg g−1 dw − [31] Hainan Island and the coastal waters of the South China Sea Seawater 14 types including
OC, PABA, BP-3, etc.All 100% 77.7–313.9 ng L−1 BP-3: 53.2 ng L−1 [80] Sediment All 100% 52.3–110.2 ng g−1 dw BP-3: 17.0 ng g−1 dw Hainan Island, South China Sea Seawater 14 types including
BP-3, 4-MBC, BP-8, etc.All 100% 174.5–343.8 ng L−1 BP-3: 35.3–75.6 ng L−1 [43] Sediment All 100% 84.0–175.8 ng g−1 dw BP-3: 13.2–25.9 ng g−1 dw Coral All 100% 32.1–91.8 ng g−1 dw BP-3: 4.5–21.3 ng g−1 dw Sanya Luhuitou Coral tissue 8 types including BP-3, OC, OD-PABA, etc. All ≥ 83.3% 7.0–35.8 (25.1 ± 10.9) ng g−1 dw OC: 2.7–31.8 ng g−1 dw [79] Macroalgae All ≥ 90.9% 15.6 ± 6.4 ng g−1 dw − DF: Detection frequency, BP-3: Benzophenone-3, BP-8: Benzophenone-8, OC: Octocrylene, HMS: Homosalate, OS: Octyl Salicylate, EHMC: Ethylhexyl Methoxycinnamate, OCR: Octocrylene, PABA: 4-Aminobenzoic acid, 4-MBC: 4-Methylbenzylidene Camphor, OD-PABA: Octyl Dimethyl-p-Aminobenzoic acid. Table 3.
Concentrations of OUVAs in some coral reef environments around the world
-
Area Matrix OPEs category ΣOPEs OPEs (max) Ref. South China Sea Seawater 14 types including TEP, TCPP, TPPO, etc. 1.25–147 ng L−1 TEP: 53.1 ng L−1 [84] Tokyo Bay Seawater 14 types including TEP, TCPP, TPPO, etc. 107–284 ng L−1 TCPP: 126 ng L−1 Pearl River Delta Seawater 14 types including TEP, TCPP, TPPO, etc. 14.9–1790 ng L−1 TPPO: 759 ng L−1 Yellow River Estuary Seawater 14 types including TEP, TCPP, TPPO, etc. 253–1,720 ng L−1 TEP: 555 ng L−1 Arctic Seawater 9 types including TCIPP, TDCIPP, TPHP, etc. 2.71–8.38 ng L−1 TDCIPP: 8.38 ng L−1 [83] Western Mediterranean Fish 13 types including TDClPP, TCEP, TPPO, etc. 0.38–73.4 ng g−1 ww TDClPP: 27.2 ng g−1 ww [85] Liaodong Bay,
Bohai SeaMarine life 7 types including TCEP, TEHP, TCIPP, etc. 2.60–776 ng g−1 ww TCEP: 281 ± 234 ng g−1 ww [86] The Great Lakes of North America Fish 22 types including TBOEP, TCIPP, TEP, etc. 9.6–74 ng g−1 ww TBOEP: 50.7 ± 1.4 ng g−1 ww [87] Coral area of South China Sea Seawater 11 types including TCIPP, TBOEP, TNBP, etc. 0.735–4.949 ng L−1 TCIPP: 1.551 ng L−1 [18] Coral tissue 128.05–924.29 ng g−1 dw TBOEP: 601.48 ng g−1 dw Coral mucus 29.62–1,798.8 ng g−1 dw TNBP: 802.98 ng g−1 dw Xisha Islands in the South China Sea Seawater and
marine life11 types including TCIPP, TBOEP, TCEP, etc. Seawater: 1.52 ± 0.33 ng L−1 TCIPP [19] Coral fish 2,227 ± 2,062 ng g−1 lw Benthic mollusc 1,024 ± 606 ng g lw Coral 1,800 ± 1,344 ng g−1 lw TBOEP Nansha Islands,
South China SeaCoral reef fish 9 types including TBEP, TCEP, TCPP, etc. 38.7–2,090 ng g−1 lw EDP: 795.24 ng g−1 lw [82] Zhushan Bay,
Taihu Lake, ChinaLake water 11 types including TCIPP, EHDPP, TEHP, etc. 1,150 ± 232 ng L−1 TCIPP: 835 ± 168 ng L−1 [88] Sediment 40.4 ± 9.24 ng g−1 dw TCIPP: 18.6 ± 3.65 ng g−1 dw Plankton 10.758 ± 0.534 ng g−1 ww EHDPP: 5.223 ± 0.186 ng g−1 ww Invertebrate 21.754 ± 1.06 ng g−1 ww TEHP: 6.910 ± 0.92 ng g−1 ww Fish 15.739 ± 0.611 ng g−1 ww TCIPP: 12.441 ± 0.54 ng g−1 ww TCIPP: Tris(2-chloroisopropyl)phosphate, TBOEP: Tris(2-butoxyethyl)phosphate, TNBP: tri-n-butyl phosphate, TCEP: Tris(2-chloroethyl)phosphate, TBEP: tris(2-butoxyethyl)phosphate, TCEP: Tris(2-chloroethyl)phosphate, TCPP: Tris(1-chloro-2-propyl)phosphate, EDP: 2-ethylhexyl diphenyl phosphate, EHDPP: 2-ethylhexyl diphenyl phosphate, TEHP: tris(2-ethylhexyl)phosphate, TDCIPP: tris(chloroisopropyl)phosphate, TPHP: tris(phenyl)phosphate, TPPO: triphenylphosphine oxide, TEP: triethyl phosphate. Table 4.
OPEs pollution in some sea areas and coral reefs around the world
-
Area Matrix Classification PFAS of the top three DF% ΣPFAS Max Ref. South China Sea Egret Heart PFDoDA, PFTrDA and PFUnDA
(DF = 100%)0.25–9.01 ng g−1 ww PFOS: 5.04 ng g−1 ww [89] Liver PFDoDA, PFTrDA and PFUnDA
(DF = 100%)1.20–17.1 ng g−1 ww PFOS: 11.4 ng g−1 ww Kidney PFDoDA, PFTrDA and PFUnDA
(DF = 100%)1.30–33.7 ng g−1 ww PFTrDA: 11.4 ng g−1 ww Hainan Island Seawater Rainy season PFOA (97.5%), PFOS (91.5%) and
PFHpA (78.5%)0.212–11.963 ng L−1 PFOS: 8.023 ng L−1 [90] Dry season PFOA (100%), PFBA (100%) and
PFOS (99.5%)0.263–20.330 ng L−1 PFOS: 12.867 ng L−1 Biscayne Bay Seawater Nearshore surface water PFBA, PFPeA and PFHxA (DF > 94 %) 29.52 ± 15.25 ng L−1 PFOS: 19.84 ng L−1 [91] Nearshore bottom water PFBA, PFPeA and PFHxA (DF > 94 %) 21.45 ± 7.85 ng L−1 Offshore surface water PFHpA, PFOA and PFNA (DF > 94 %) 5.17 ± 2.66 ng L−1 PFOS: 3.30 ng L−1 Offshore bottom water PFHpA, PFOA and PFNA (DF > 94 %) 2.20 ± 1.60 ng L−1 Biscayne Bay Marine life Thunnus atlanticus DF > 80% (6:2 FTS, PFNA and PFOS) 0.15–3.40 ng g−1 ww PFTrDA: 0.14 ±
0.16 ng g−1 ww[93] Lobster DF > 80% (PFBA, FHxSA and PFOS) 0.37–5.15 ng g−1 ww N-MeFOSAA:
1.62 ± 0.45 ng g−1 wwNew York Bay and Bahamas Shark Muscle tissue PFTrDA (95%), PFOA (92%), PFBA (92%) 1.1–58.5 ng g−1 PFOA: 28.6 ng g−1 [94] Florida Surface water – PFOA (94%), PFBS (65%), PFHxA (61%) 1–3048 ng L−1 PFOS: 1,135 ng L−1 [92] Mangrove estuary in Zhangzhou, Fujian Surface water, aquatic organisms Surface water PFPeA, PFOA and PFBS (DF = 100%) 5.27–12.54 ng L−1 PFPeA: 3.65 ng L−1 [96] Fish PFBA, PFHxA and PFHpA (DF = 100%) 0.45–17.67 ng g−1 ww PFBA: 7.68 ng g−1 ww Shrimp – 3.20 ng g−1 ww – Crab – 5.29 ng g−1 ww – Indian Ocean Seabird egg – PFOS, PFUdA and PFNA (DF = 100%) 1.9–10.3 ng g−1 ww PFOS: 3.8 ng g−1 ww [97] The Red Sea Seawater – PFOA (96.4%), 6:2 FTS (76.0%) and PFHpA (75.0%) < LOQ–956 ng L−1 6:2 FTS: 450 ng L−1 [95] South China Sea Coral Dry season PFOA, PFNA and PFDoDA (DF = 100%) 0.84–26.05 ng g−1 dw PFHxS: 18.9 ng g−1 dw [20] Rainy season PFOA, PFHxS and PFOS (DF = 100%) 2.05–20.31 ng g−1 dw PFHxS: 13.5 ng g−1 dw South China Sea Coral reef fish – PFOS, PFUnDA and PFTrDA (DF > 94%) 0.38–20.43 ng g−1 ww PFOS: 20.23 ng g−1 ww [26] Beibu Gulf Seawater Summer PFBA, PFPeA, PFBS (DF = 100%) 1,609–4,727 pg L−1 PFBA: 1,771 pg L−1 [98] Winter PFHxA, PFHpA, PFHxS (DF = 100%) 610–4,920 pg L−1 PFPeA: 1,968 pg L−1 DF: Detection frequency, PFDoDA: Perfluorododecanoic acid, PFTrDA: Perfluorotridecanoic acid, PFUnDA: Perfluoroundecanoic acid, PFOS: Perfluorooctane sulfonate, PFOA: Perfluorooctanoic acid, PFHpA: Perfluoroheptanoic acid, PFBA:Perfluorobutanoic acid, PFPeA:Perfluoropentanoic acid, PFHxA: Perfluorohexanoic acid, PFNA: Perfluorononanoic acid, 6:2 FTS: Sodium 1H,1H,2H,2H-perfluoro-1-octanesulfonate, N-MeFOSAA: N-methylperfluoro-1-octanesulfonamidoacetic acid, FHxSA: Perfluoro-1-hexanesulfonamide, PFBS (Perfluorobutane sulfonate, PFUdA: Perfluoro-n-undecanoic acid, PFHxS: Perfluorohexane sulfonate. Table 5.
Pollution status of PFAS in several sea areas and typical coral ecosystems around the world
Figures
(2)
Tables
(5)