-
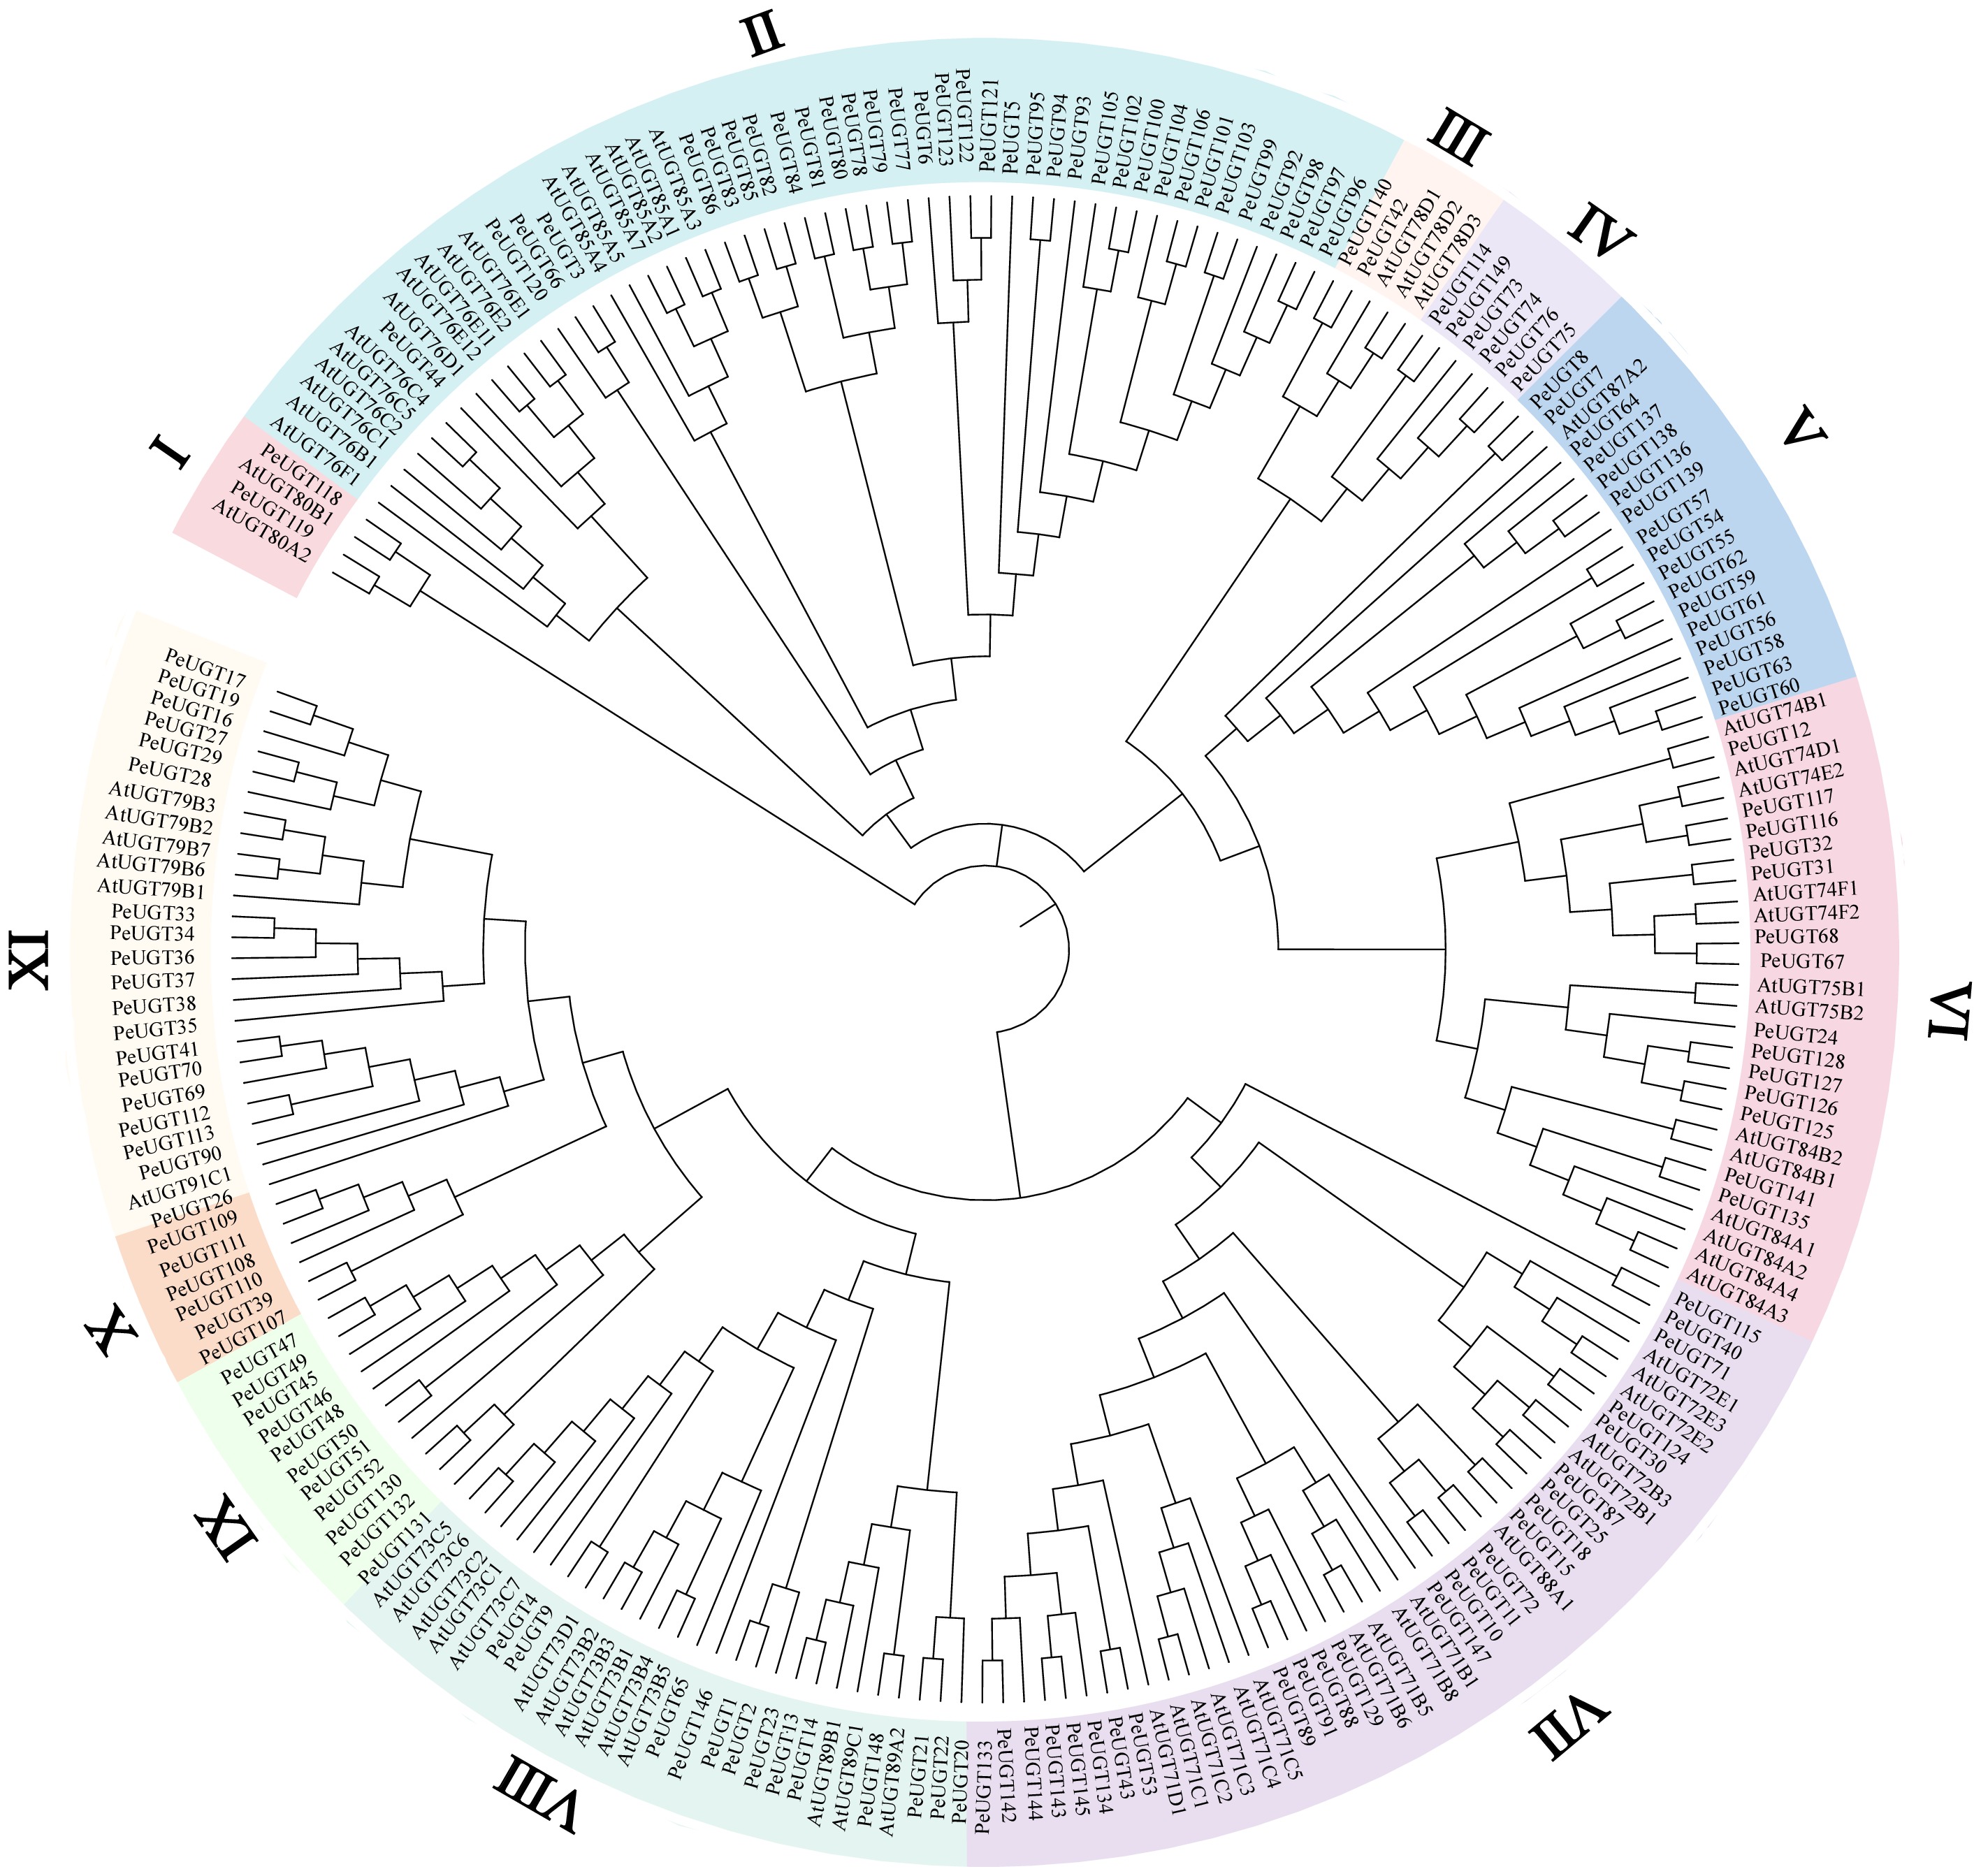
Figure 1.
Phylogenetic analysis of UGT proteins in Arabidopsis and passion fruit. Using the neighbor-joining (NJ) method implemented in MEGA12 software, a phylogenetic tree was constructed using 73 AtUGT proteins from Arabidopsis and 149 PeUGT proteins from passion fruit. Different subfamilies are represented by different colors.
-
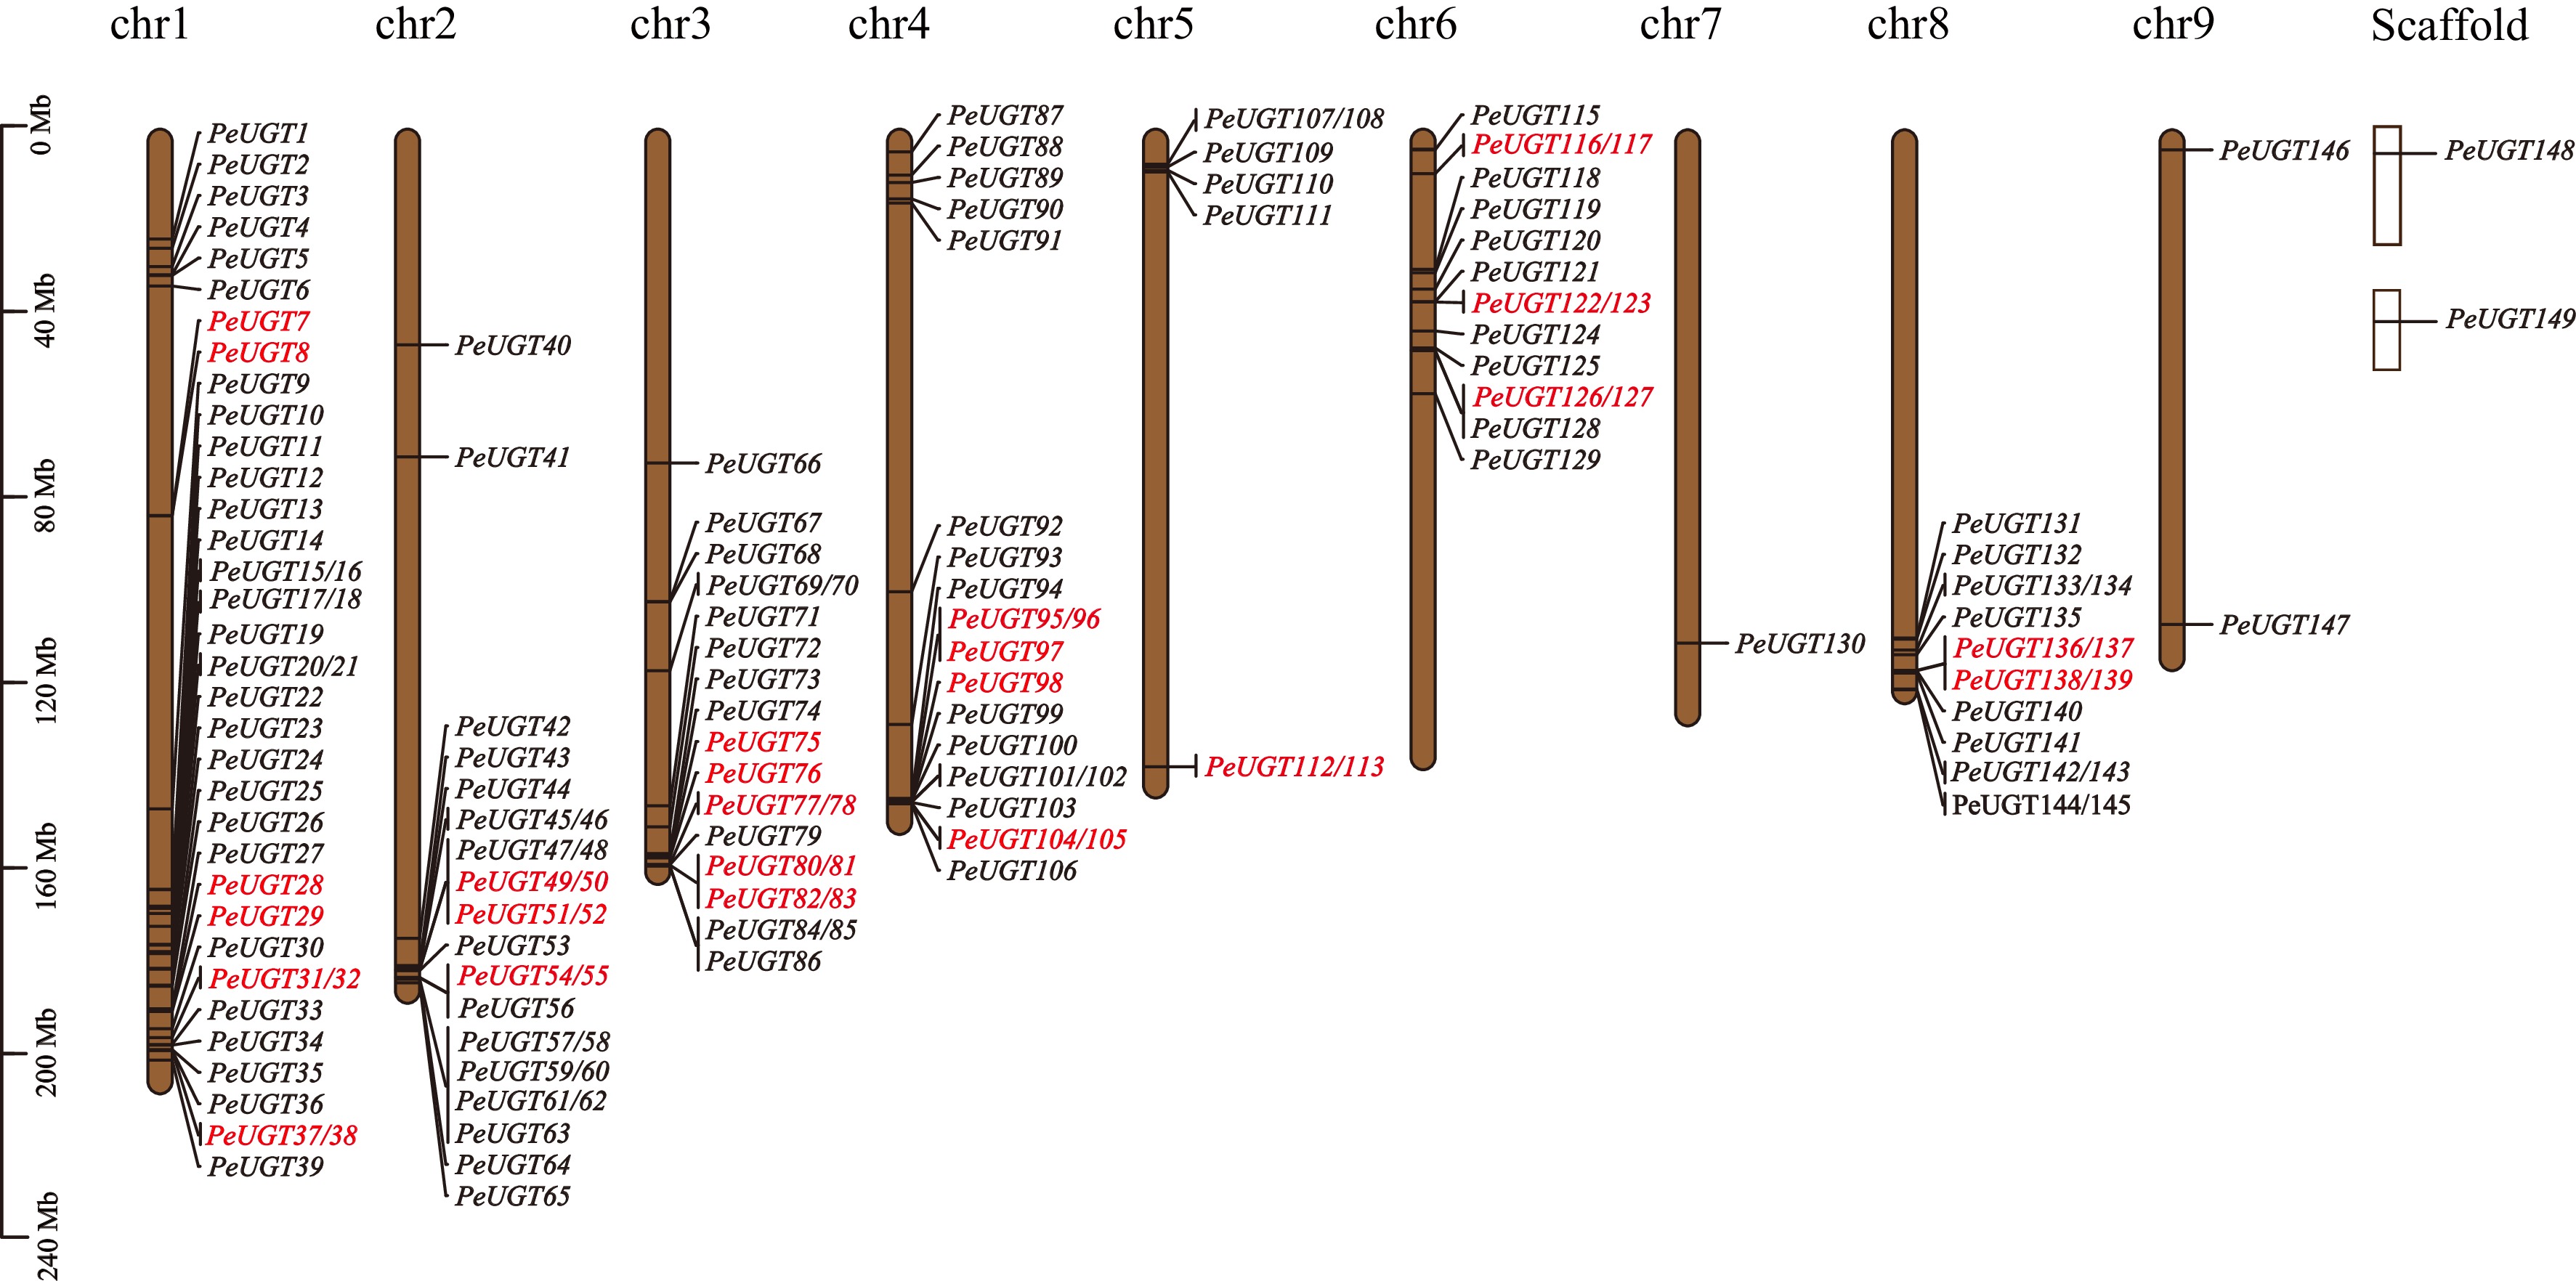
Figure 2.
Chromosome distribution and tandem repeat analysis of the PeUGT gene. Each line represents a chromosome, with duplicated gene pairs highlighted in red. The approximate location of each PeUGT gene on each chromosome is indicated.
-
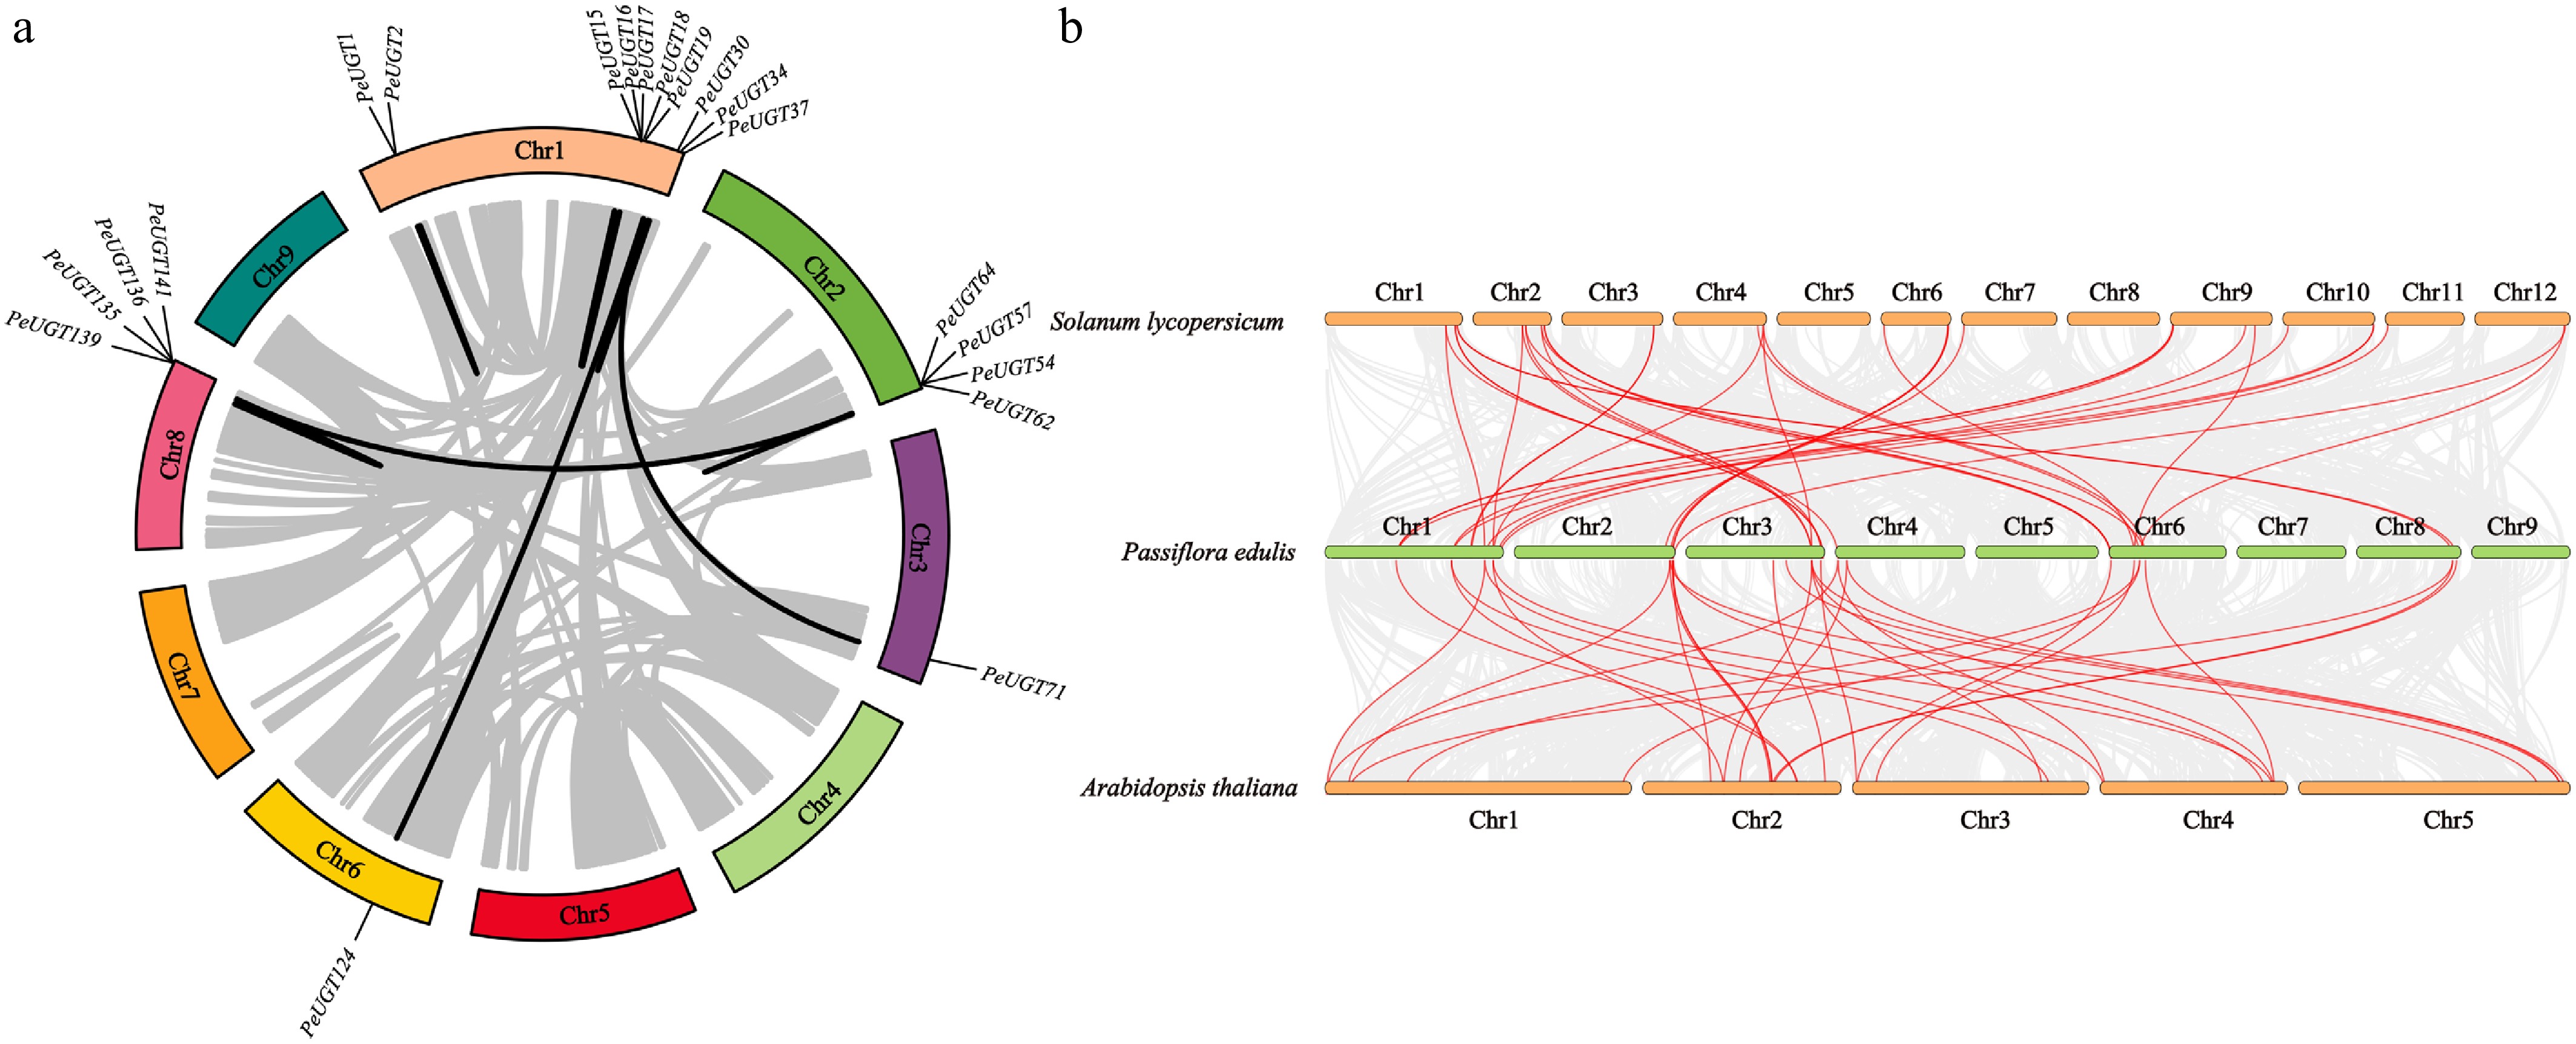
Figure 3.
Analysis of intraspecific and interspecific collinearity of UGT genes. (a) Intraspecific collinearity analysis of the PeUGT gene in passion fruit. (b) Collinearity analysis of UGT genes in passion fruit, Arabidopsis thaliana, and tomato.
-
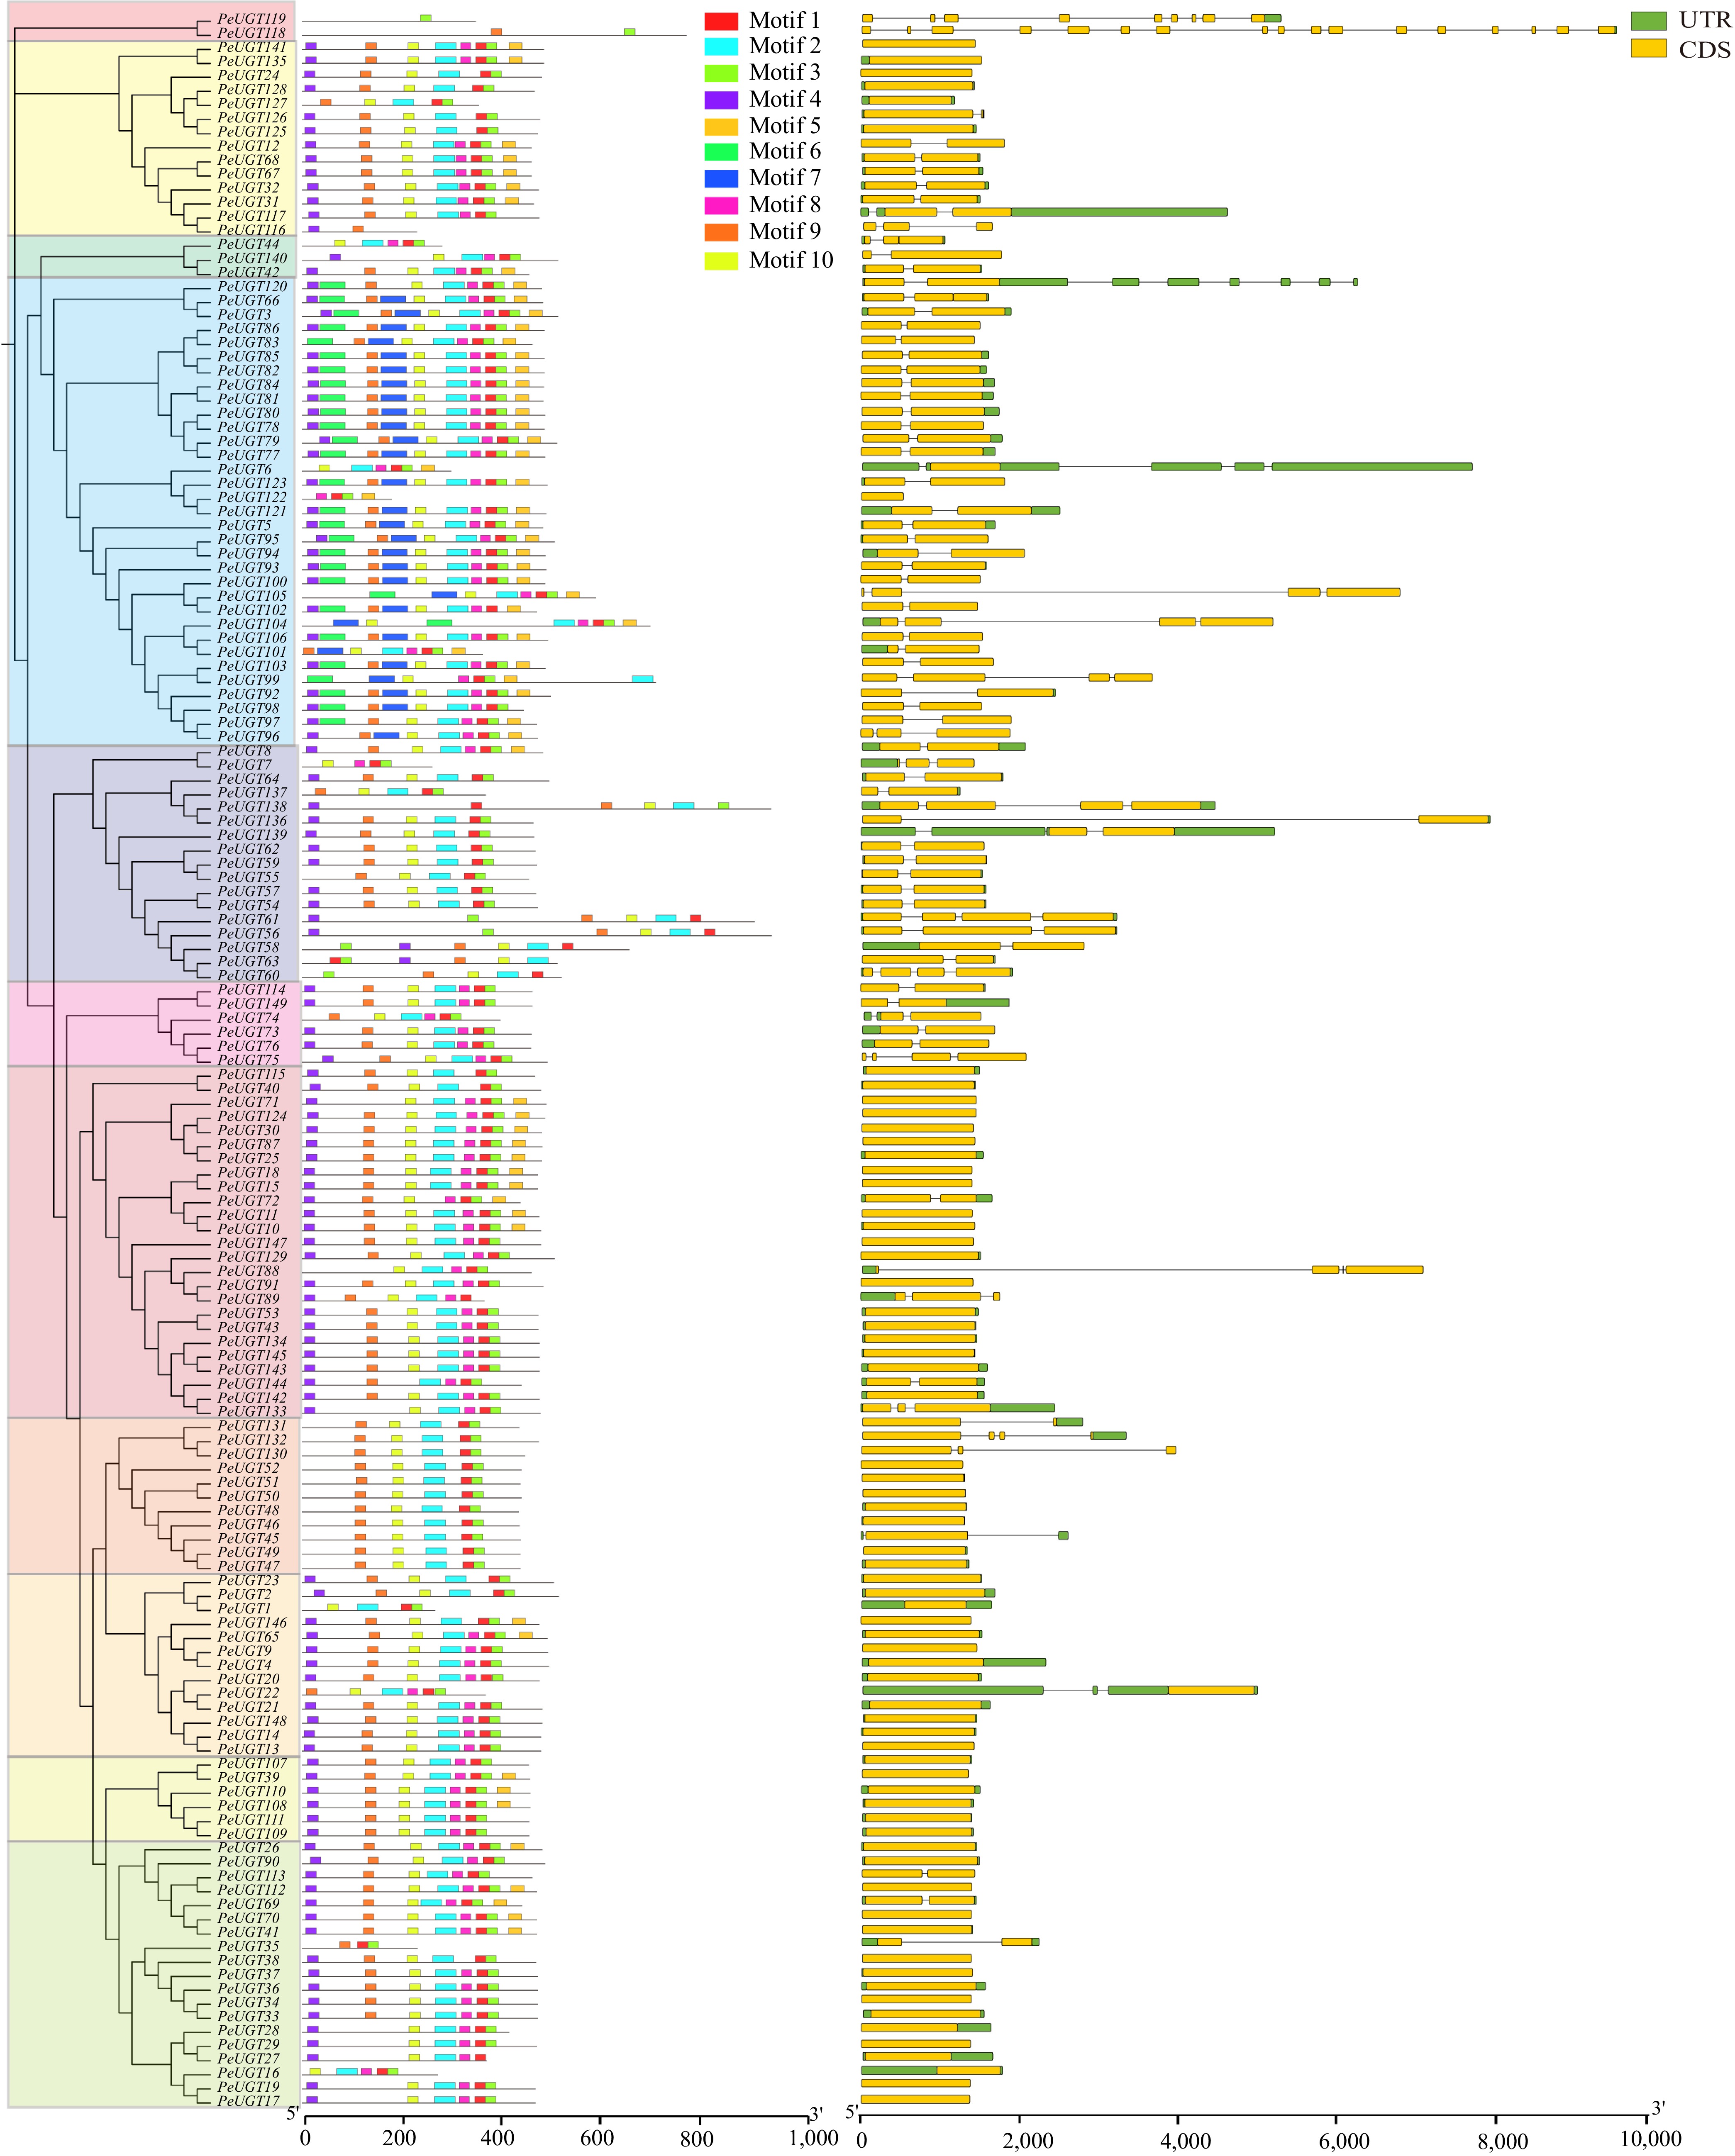
Figure 4.
Analysis of PeUGT conserved motifs and gene structure. PeUGT conservative motifs are sorted according to different subfamilies, with different colors representing different subfamilies in the evolutionary tree. There are a total of ten motifs, each represented by a colored box, and non-conservative regions represented by black lines. In the PeUGT gene structure analysis, CDS is represented by yellow boxes, UTR is represented by green boxes, and introns are represented by black lines.
-
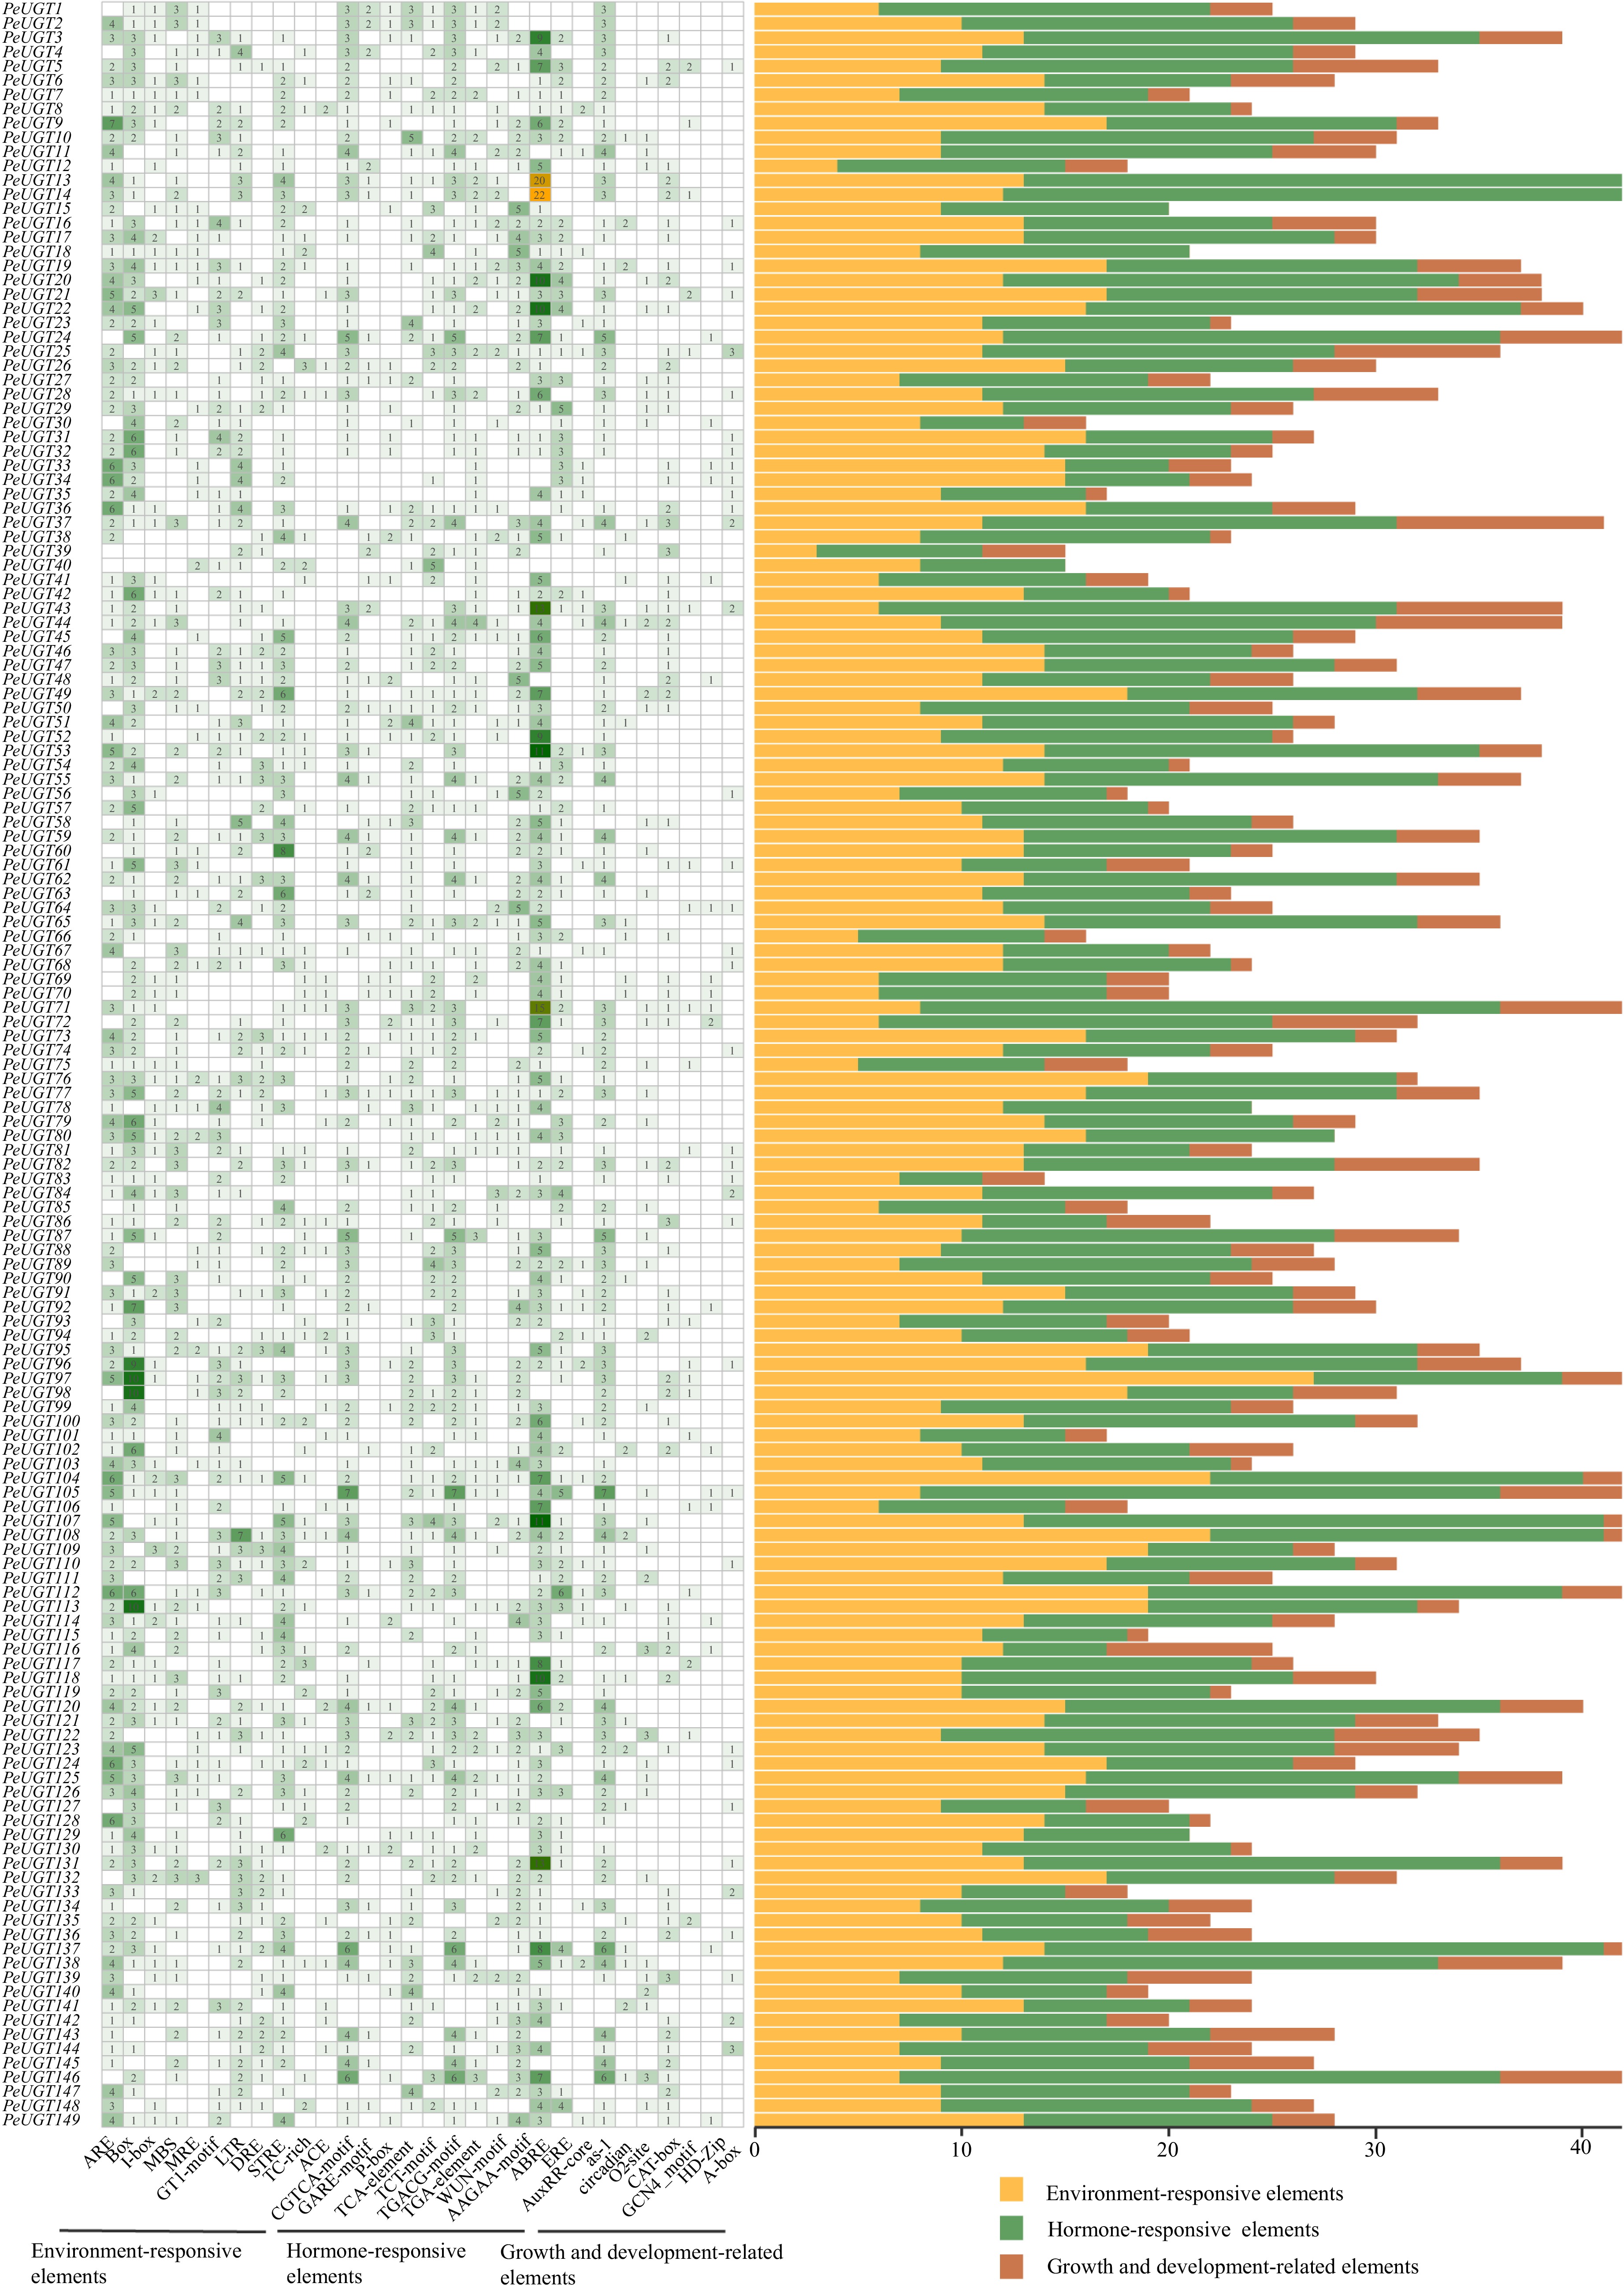
Figure 5.
Identification of cis-regulatory elements in the PeUGT gene promoter. The left figure shows the number of each type of cis-regulatory element present in each gene promoter region, while the right figure shows the number of elements belonging to plant hormone response, plant growth and development, and stress responsiveness within each genome promoter.
-
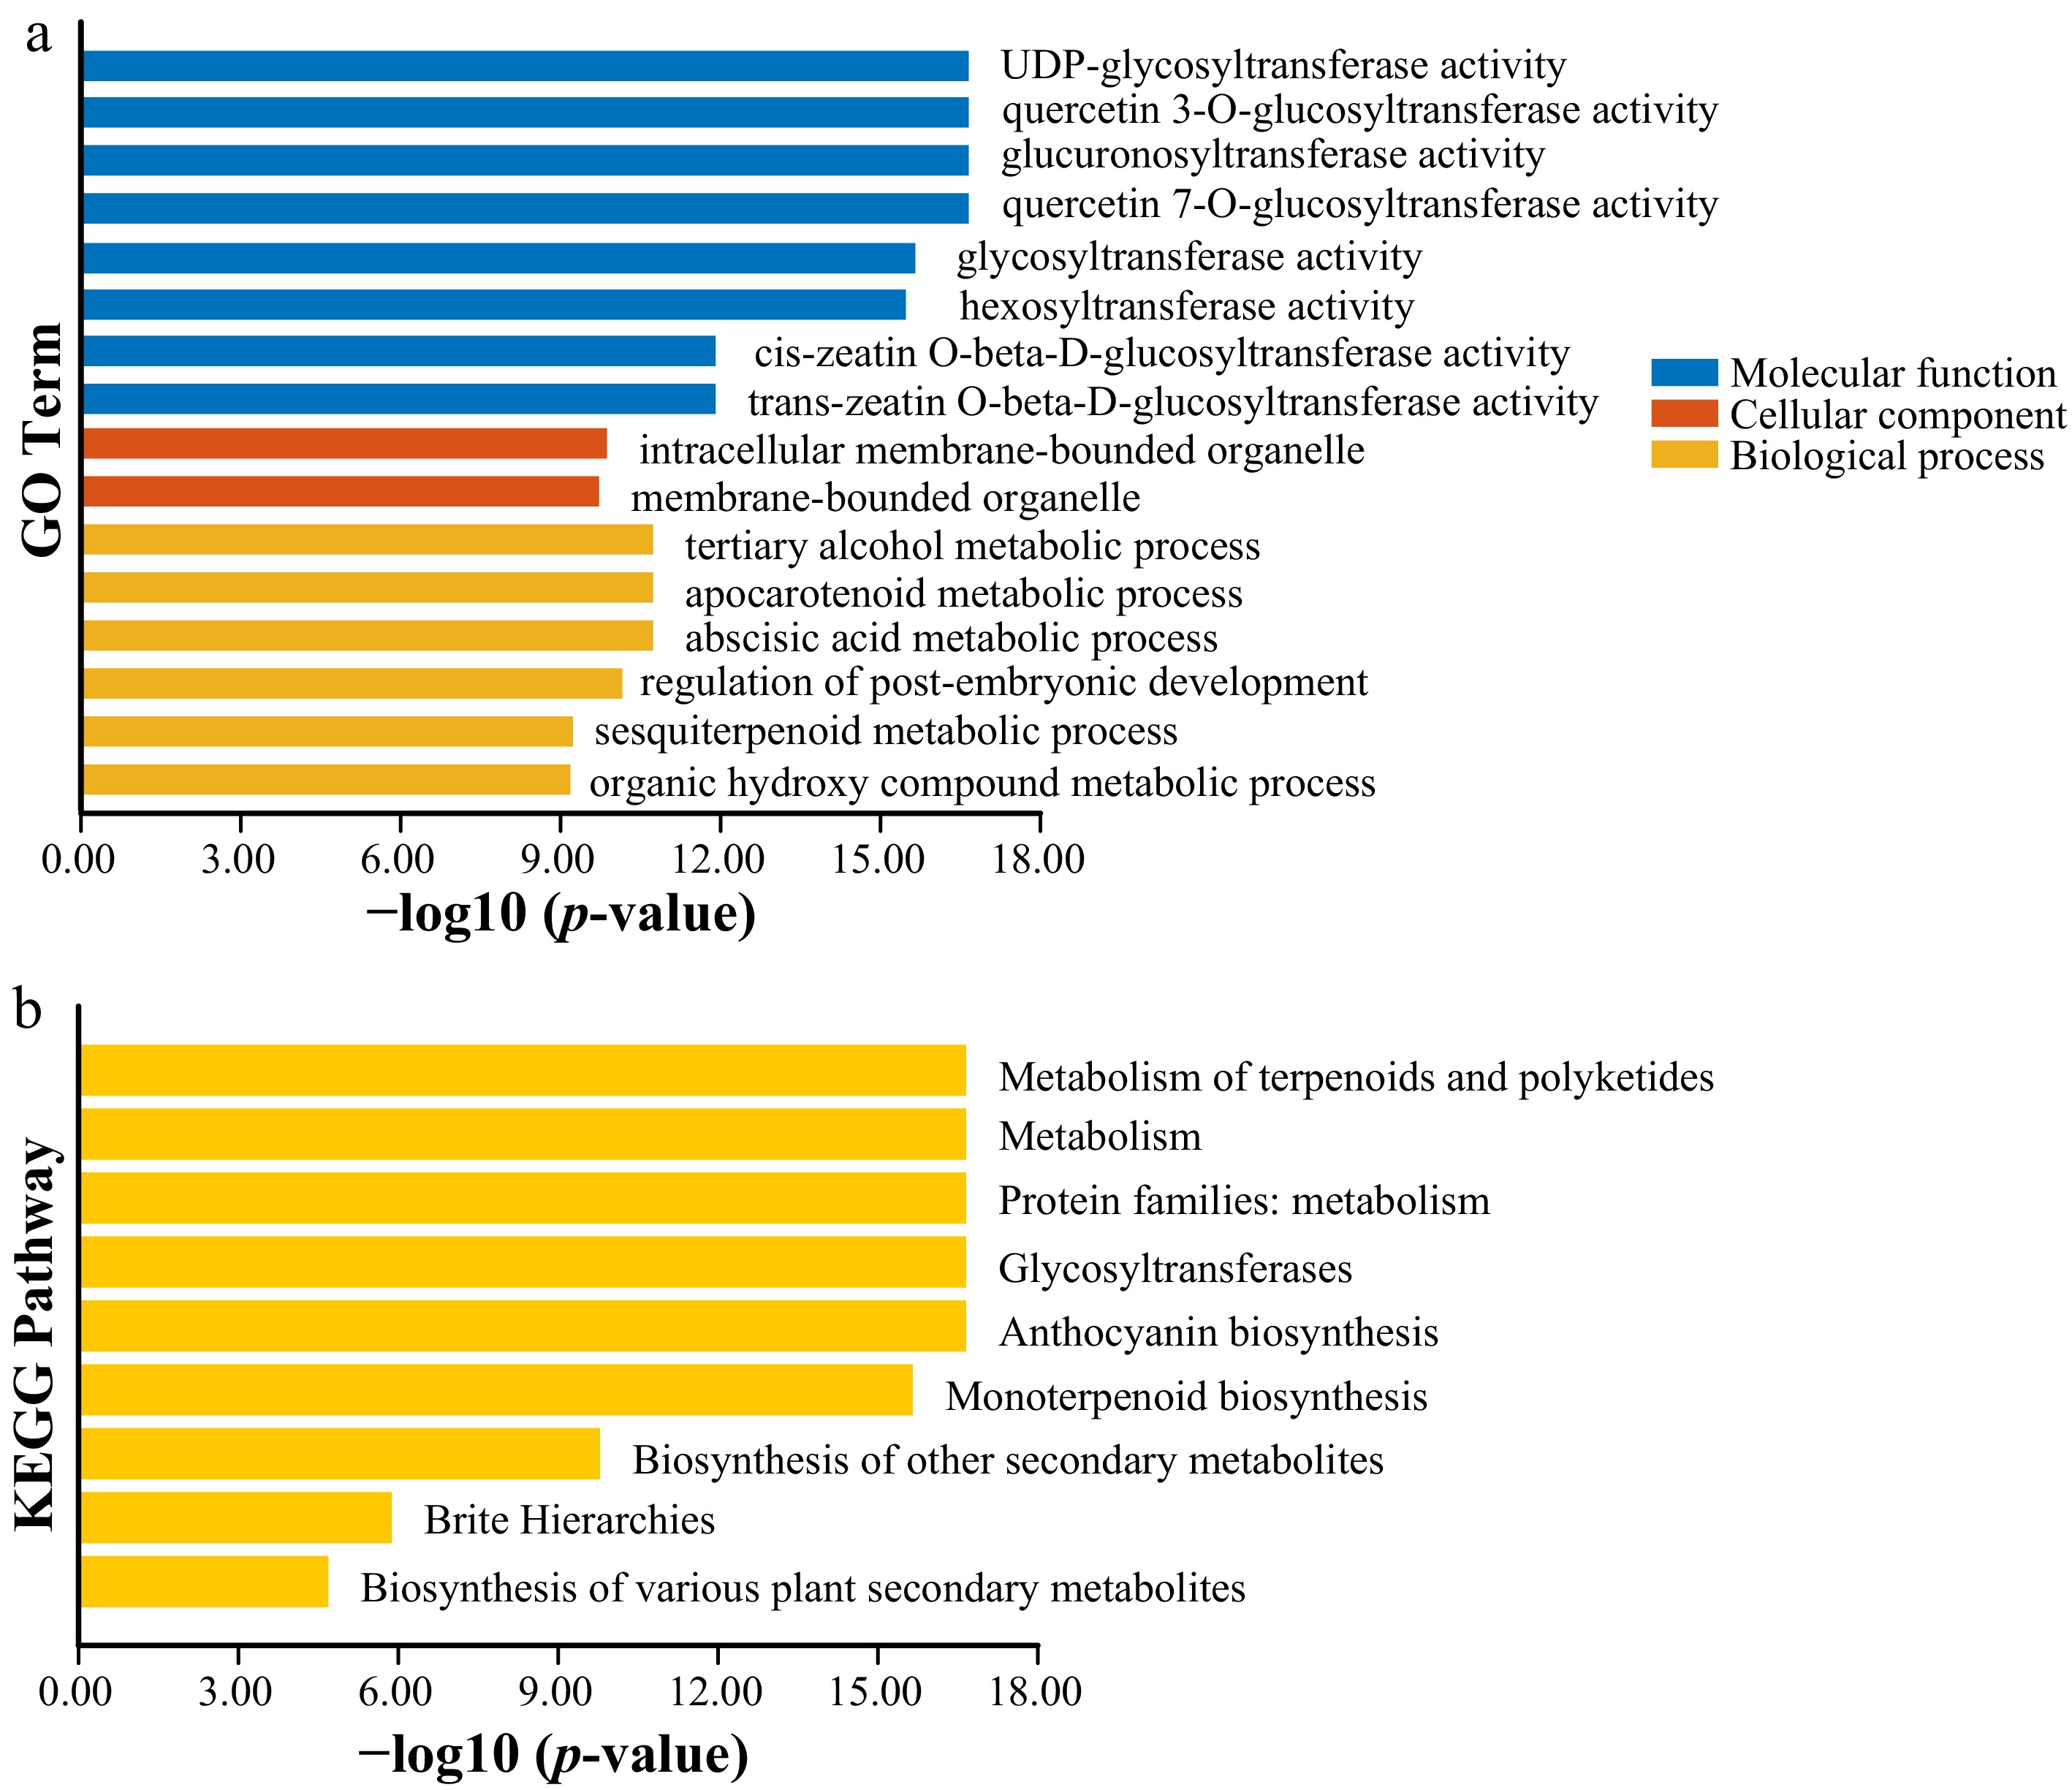
Figure 6.
GO and KEGG enrichment analysis of the PeUGT gene. (a) GO analysis of the PeUGT gene. GO classification of cellular components, molecular functions, and biological processes has been determined. (b) Annotation of the KEGG pathway of the PeUGT gene.
-
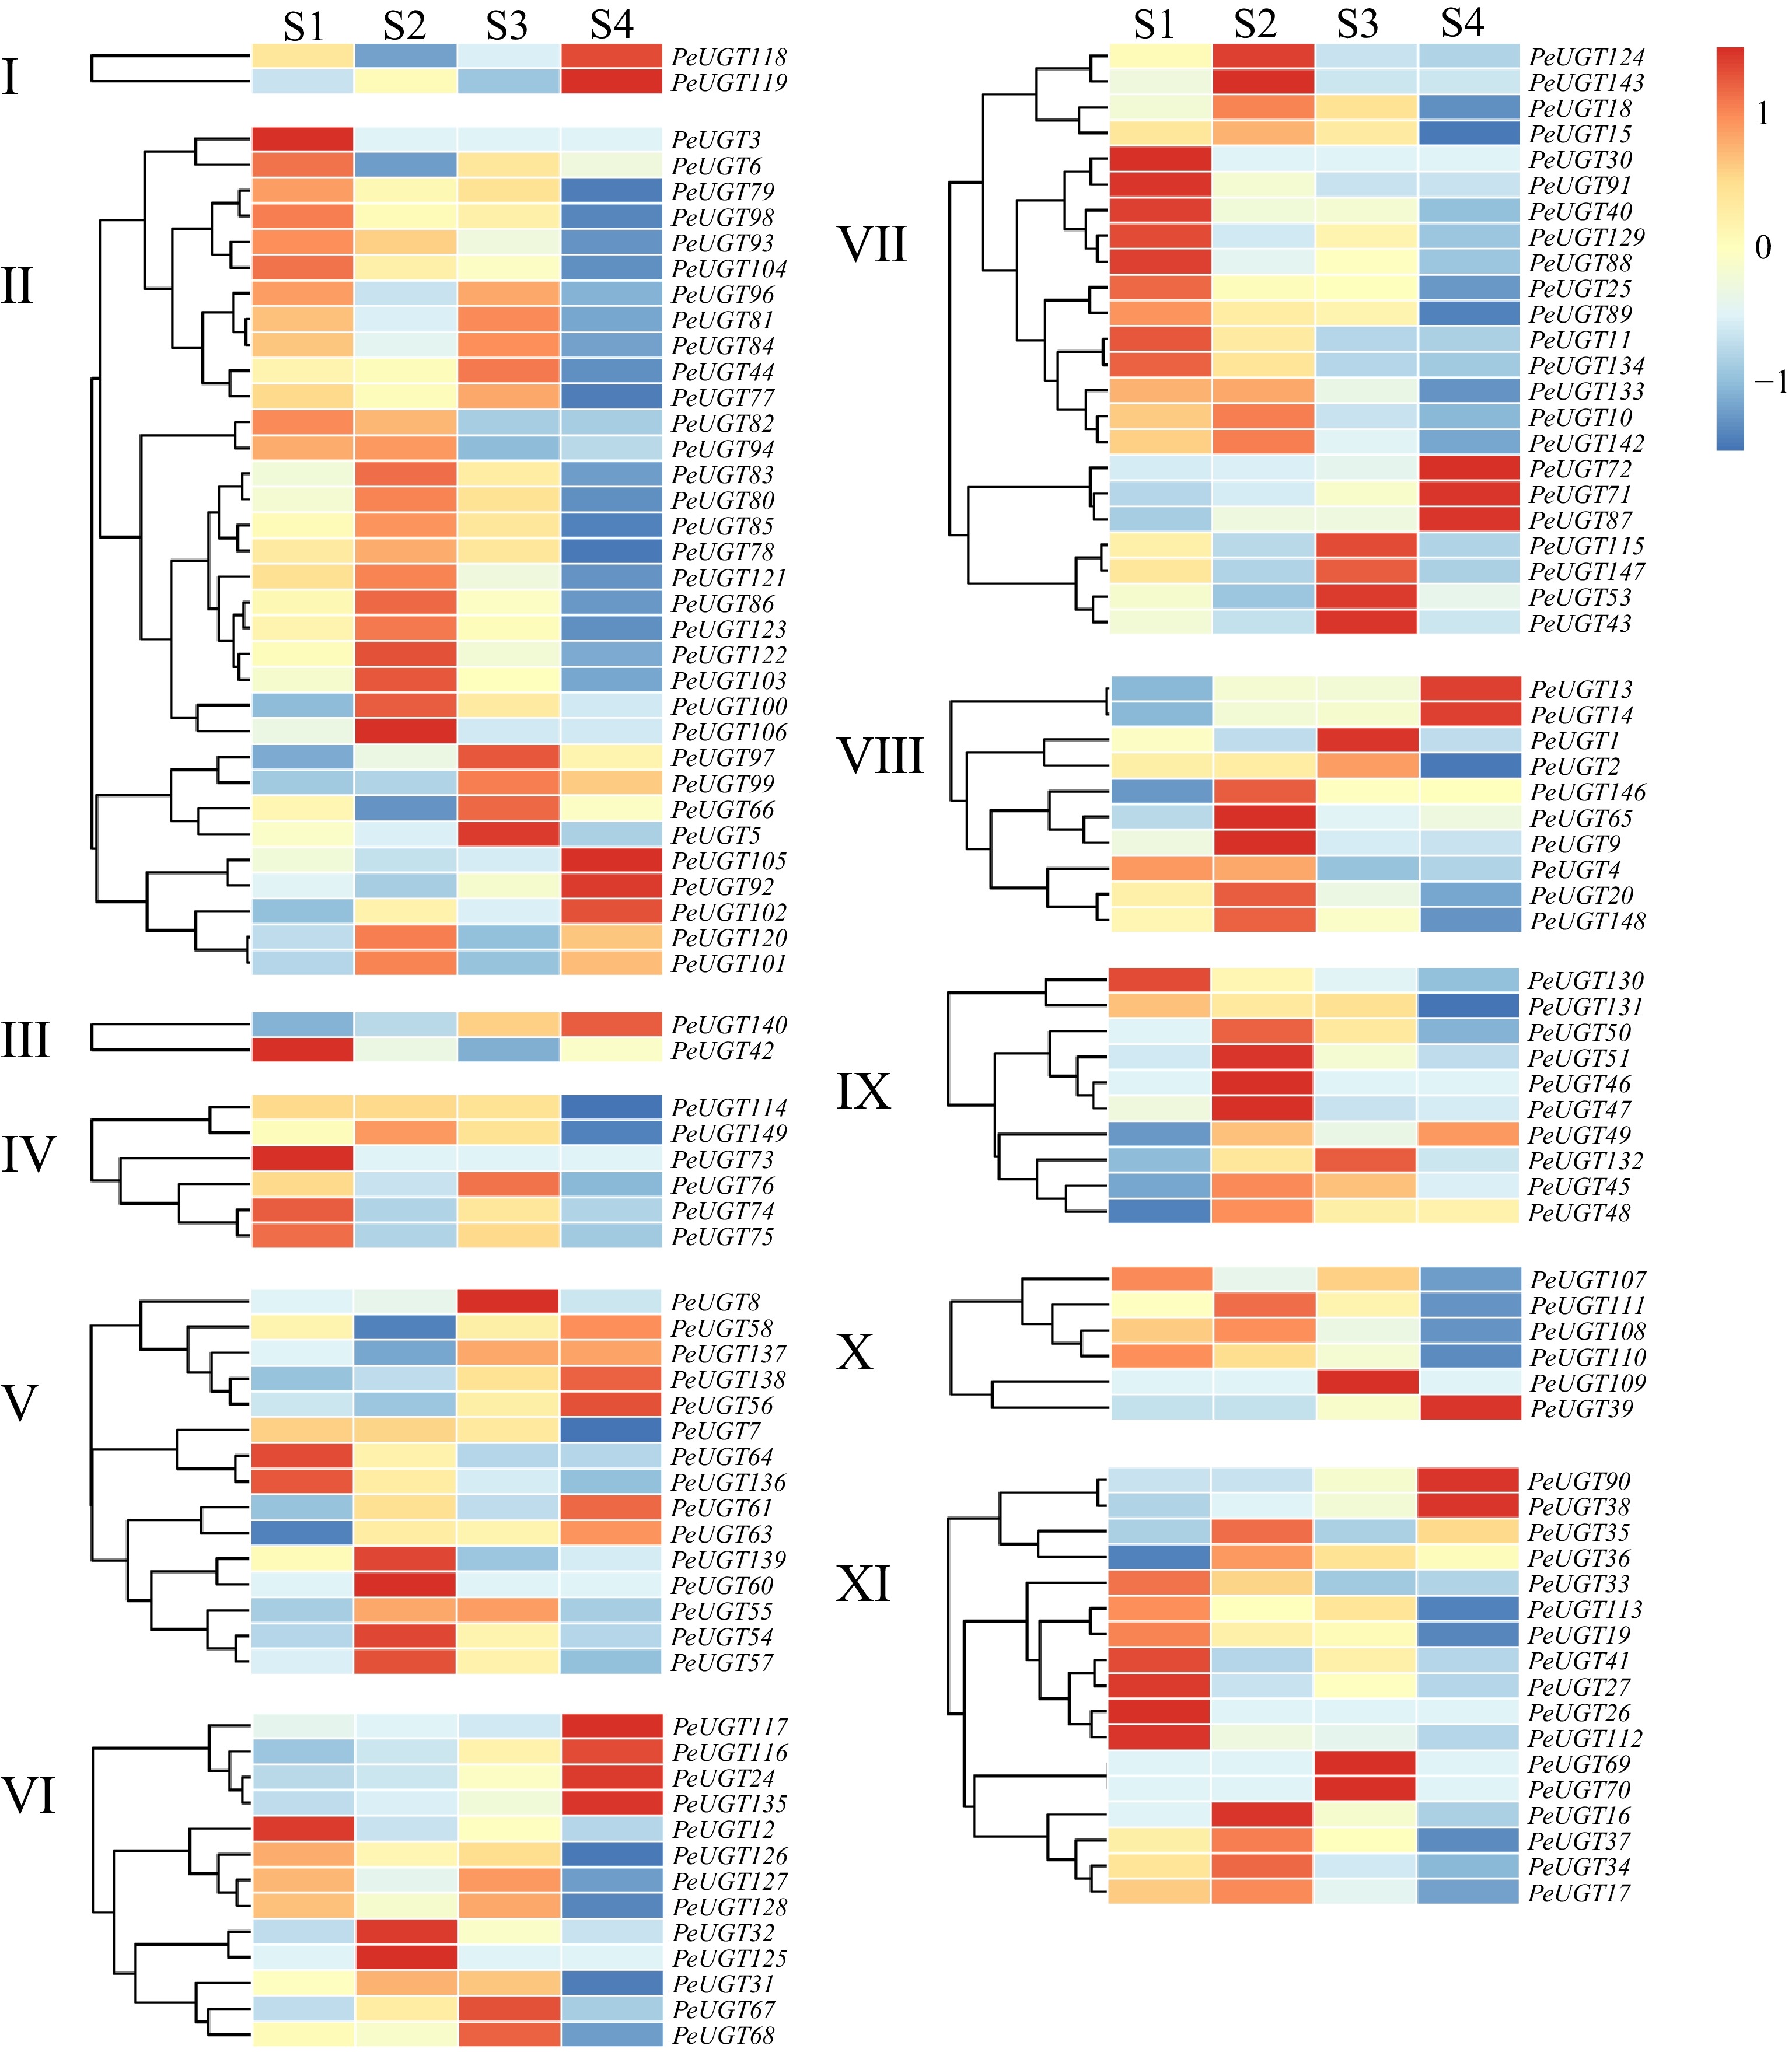
Figure 7.
Analysis of PeUGT gene expression pattern during the developmental stage of passion fruit. Different subfamilies of PeUGT are clustered separately, with S1 representing 18 d after flowering, S2 representing 28 d after flowering, S3 representing 41 d after flowering, and S4 representing 58 d after flowering. Gene expression levels are represented as TPM (Transcripts Per Million) values and subjected to Z-score normalization (row-wise scaling). The color gradient indicates the deviation from the mean expression level: red denotes higher-than-average expression (Z-score > 0), while blue denotes lower-than-average expression (Z-score < 0).
-
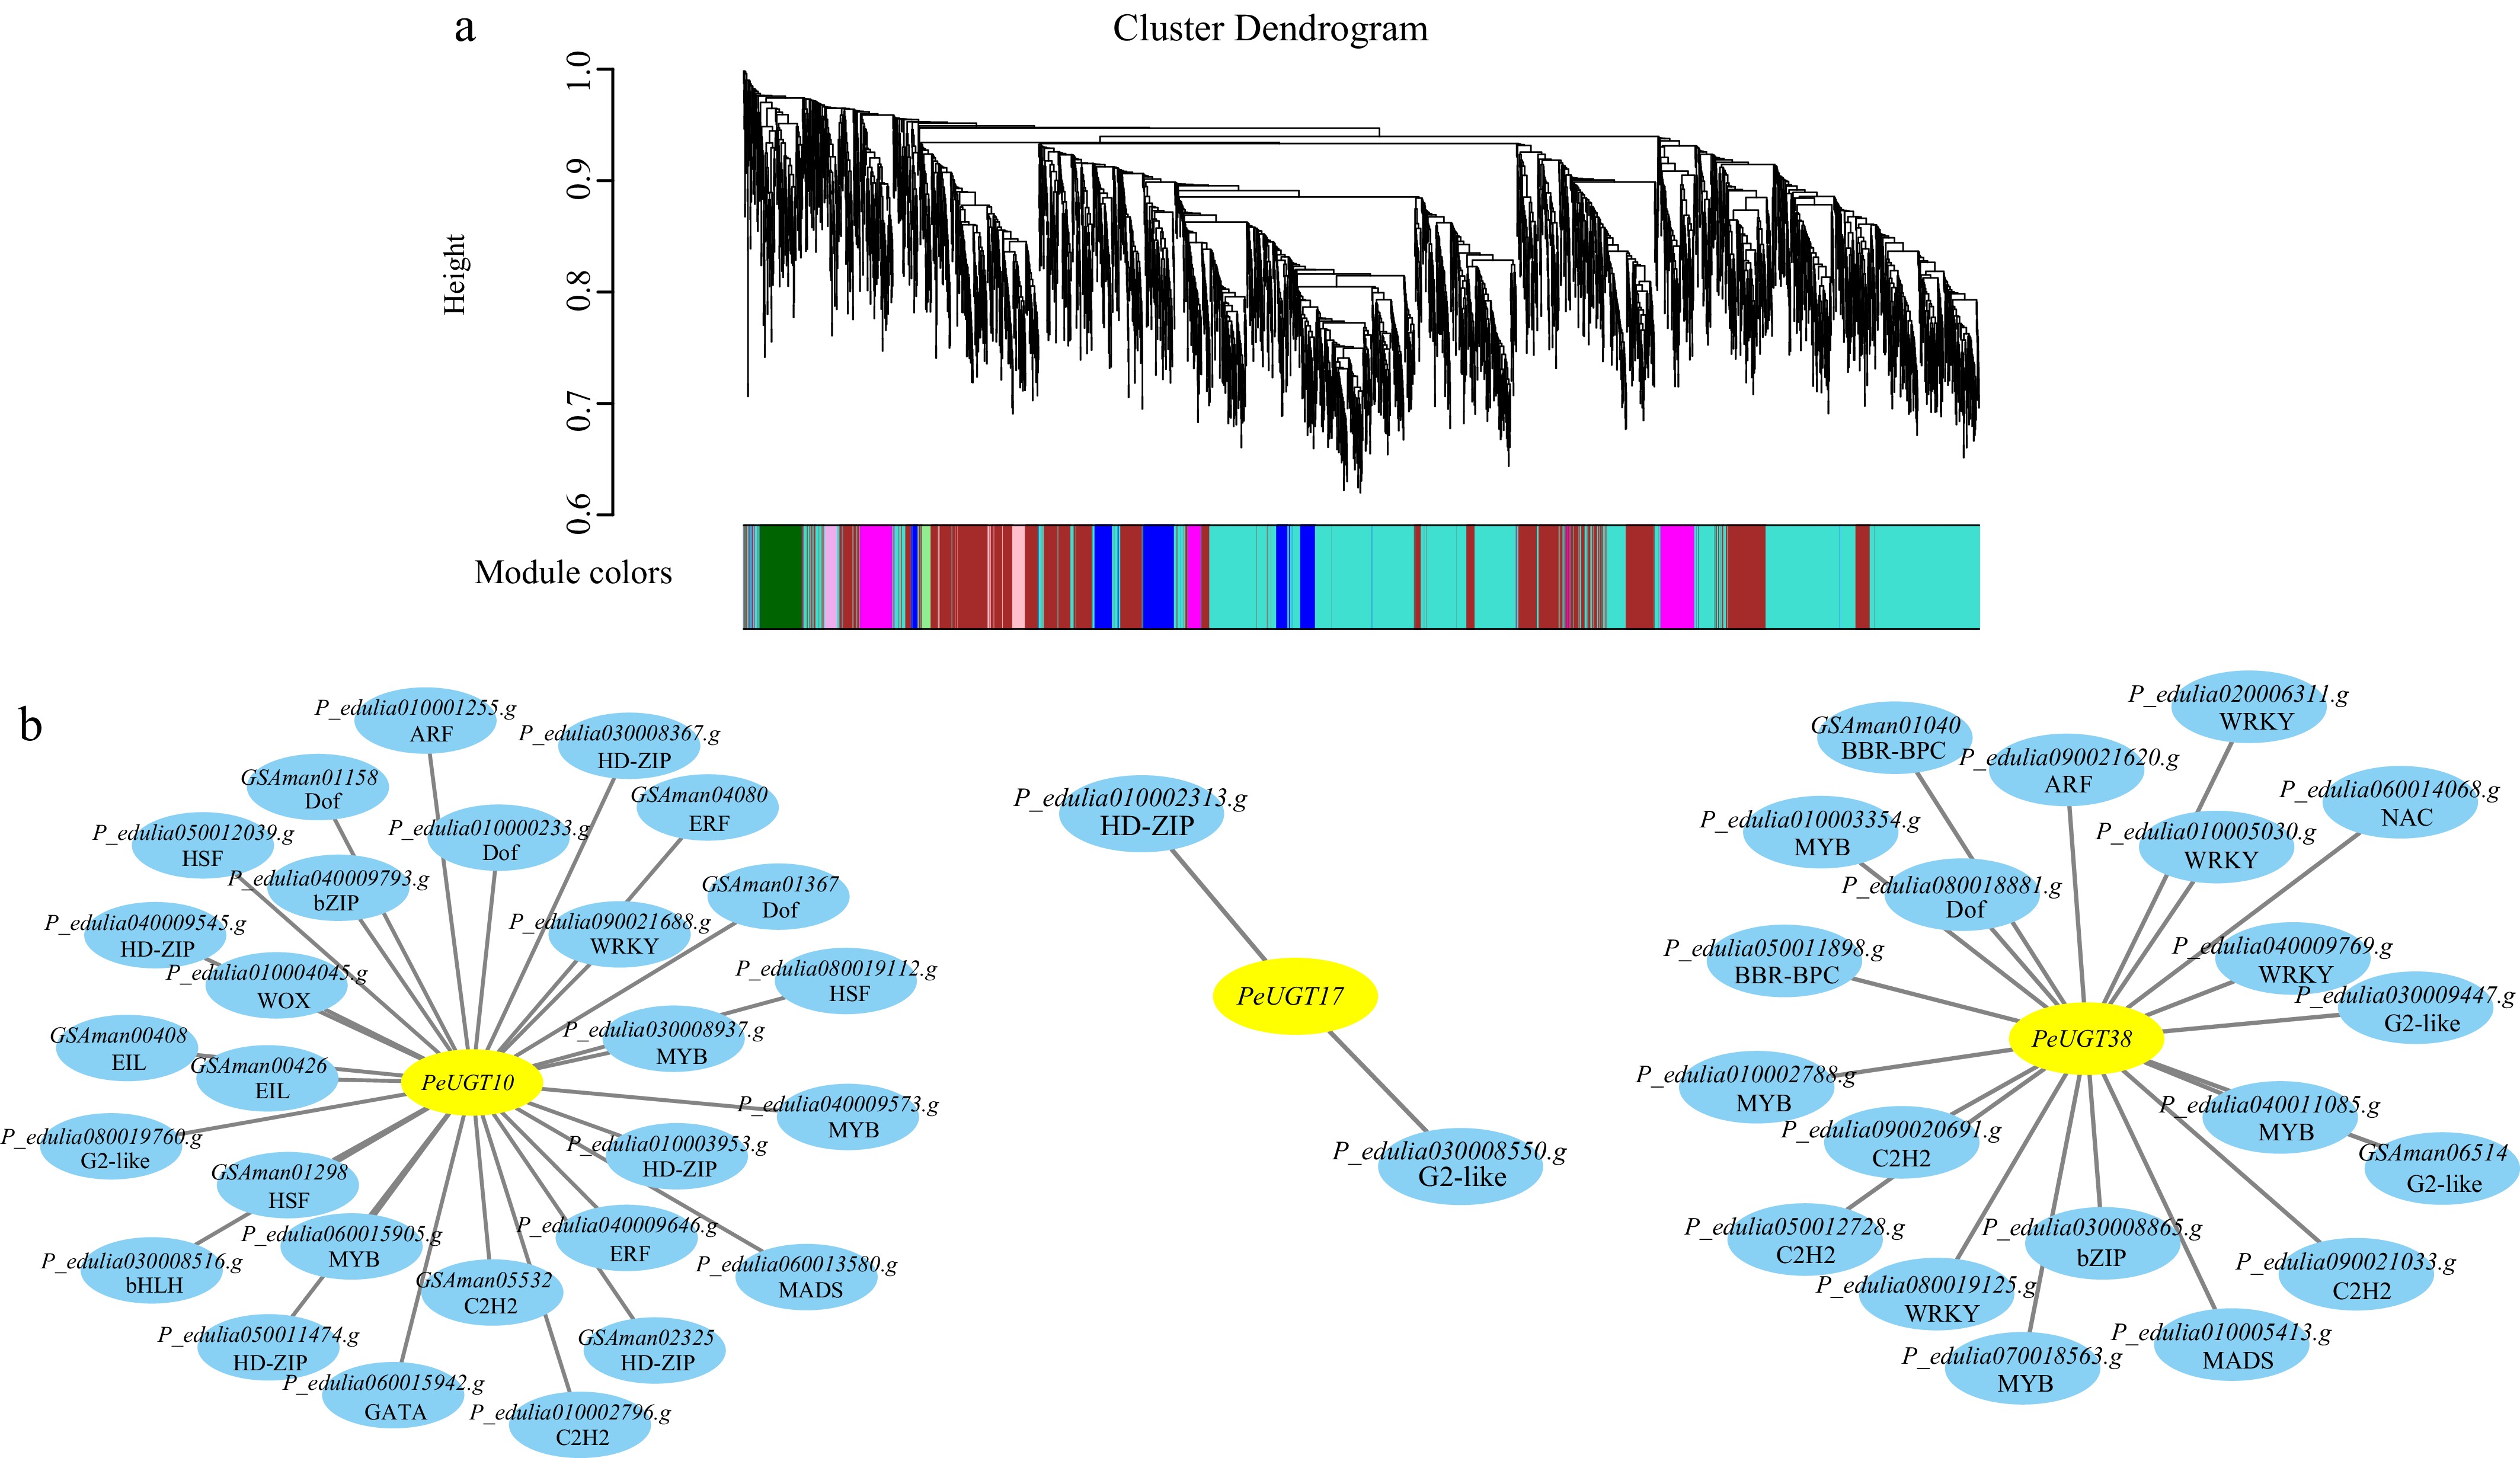
Figure 8.
Potential transcriptional regulatory networks of PeUGT10, PeUGT17, and PeUGT38. (a) Identify gene co-expression modules through WGCNA. (b) Identifying transcription factors with potential regulatory relationships with PeUGT10, PeUGT17, and PeUGT38 through integration of co-expression and FIMO analysis. The first row in the circle in the figure is the gene number, and the second row is the corresponding transcription factor family.
Figures
(8)
Tables
(0)