-
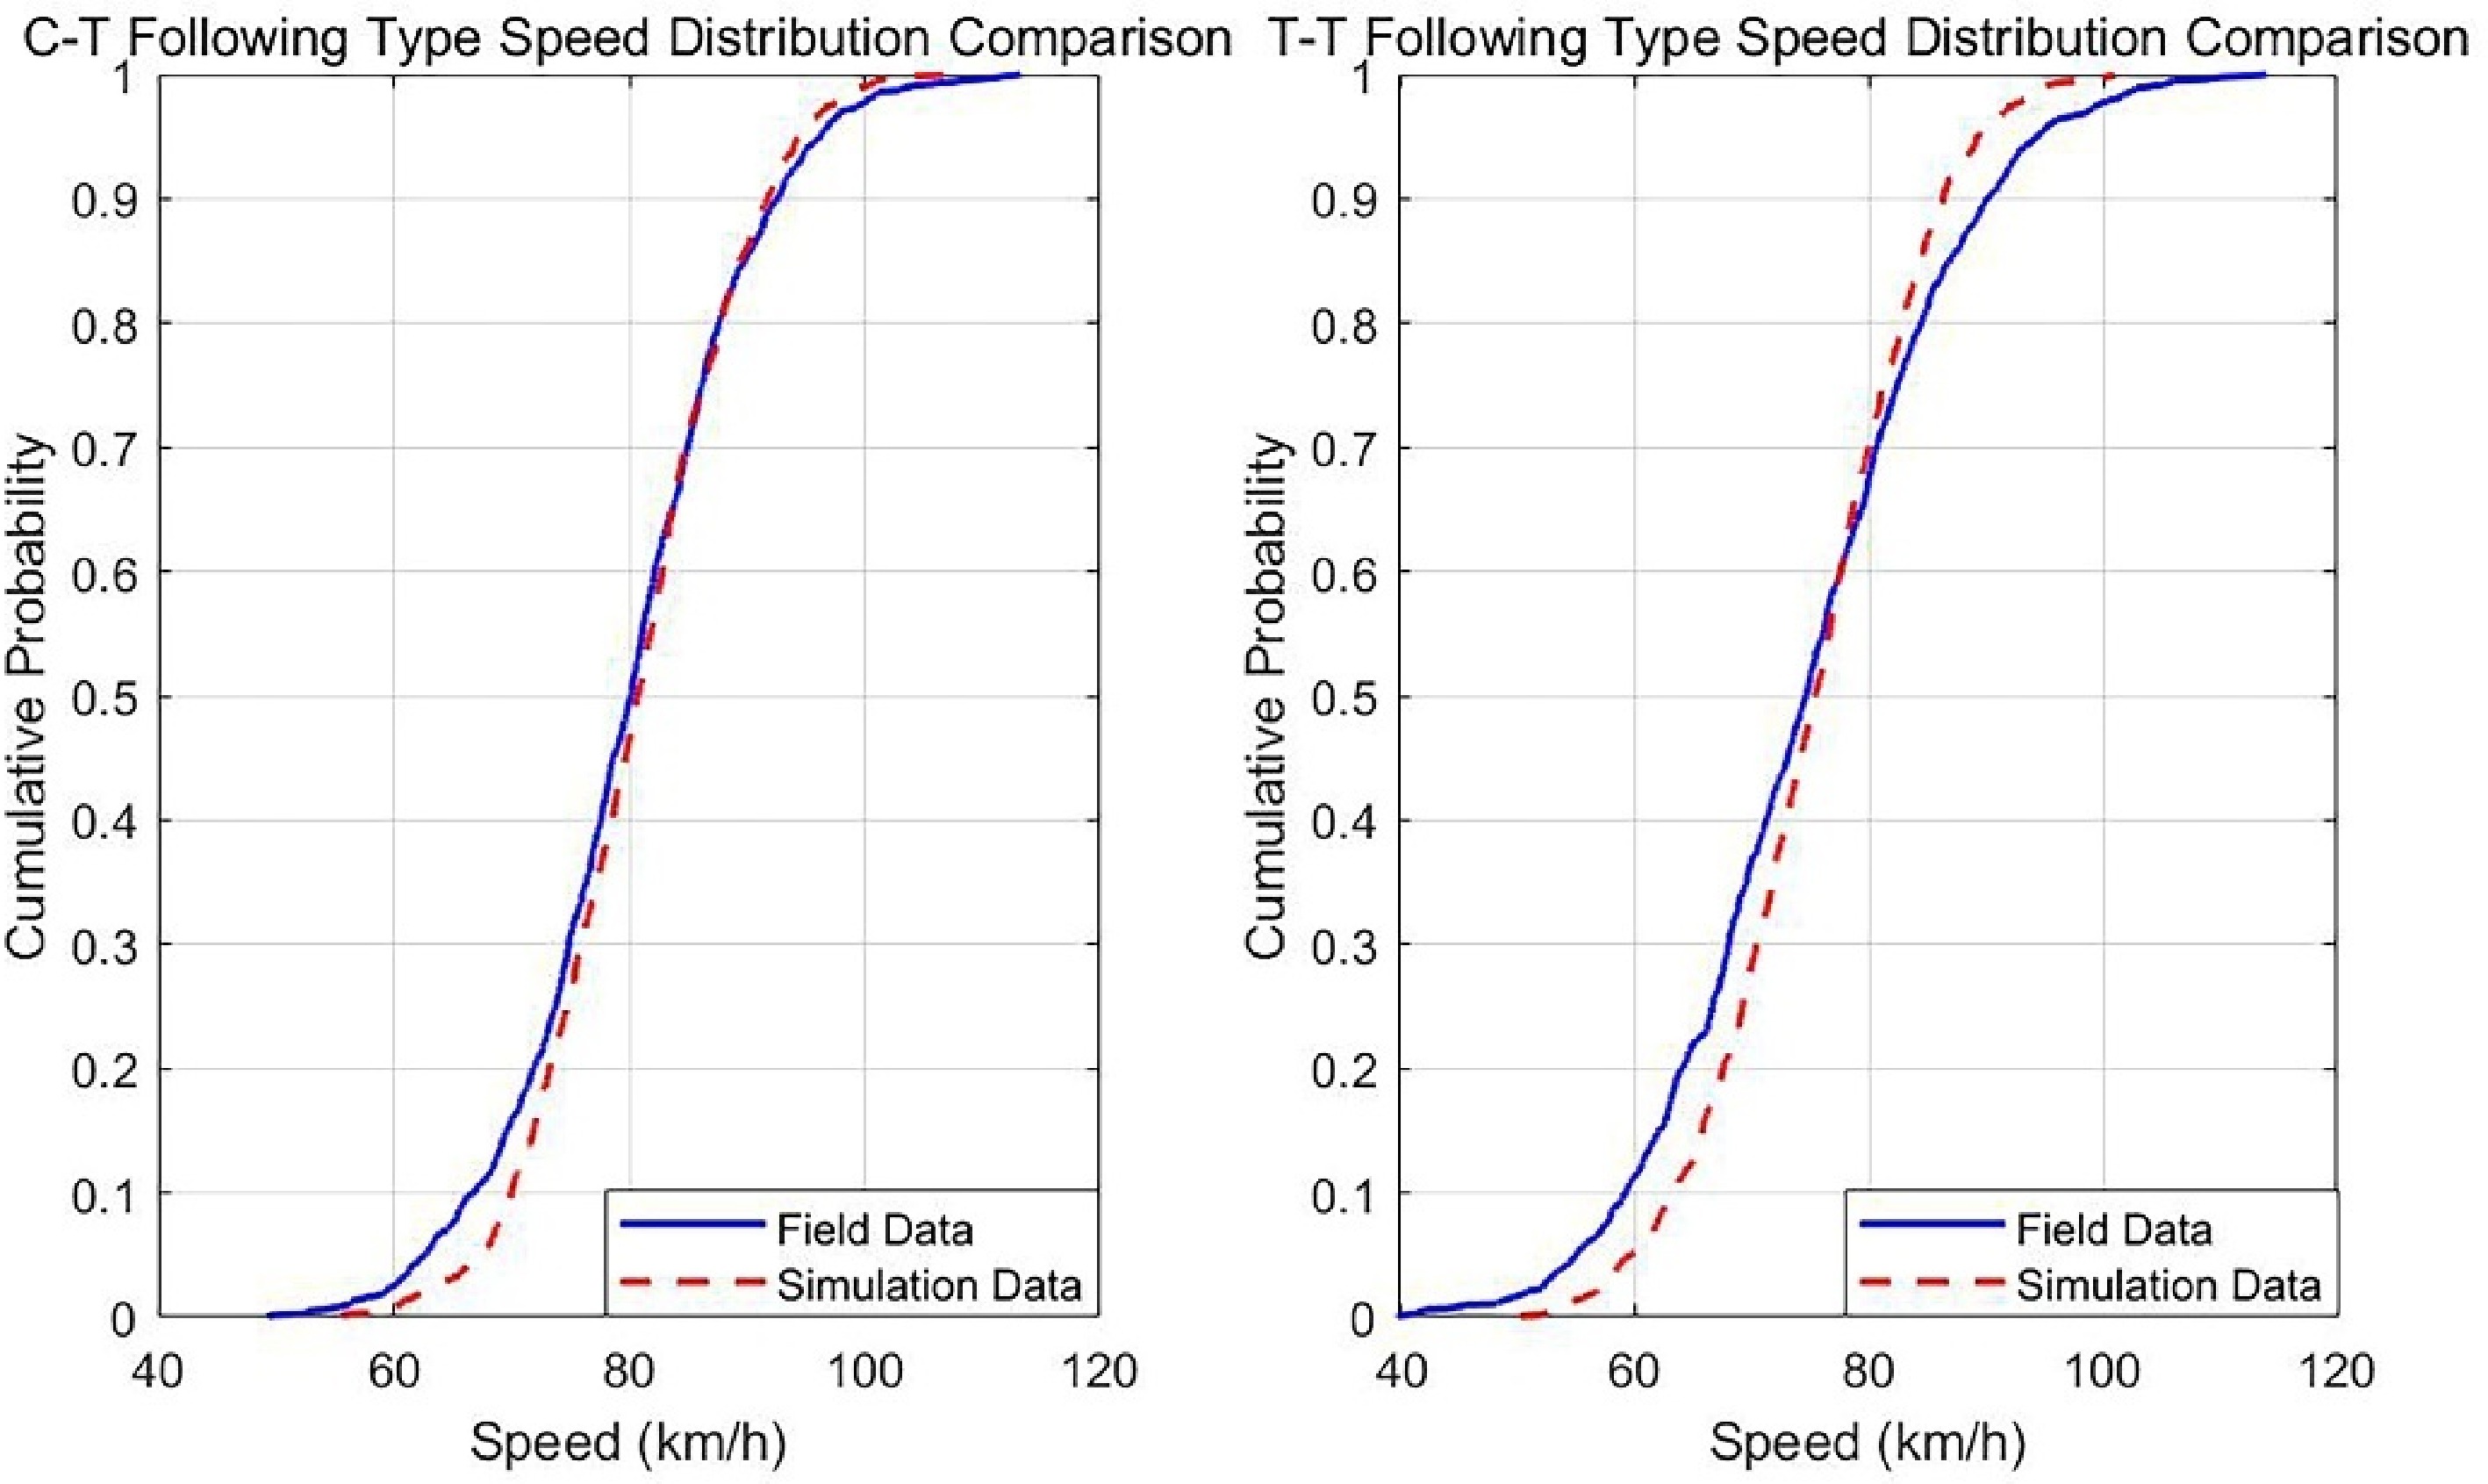
Figure 1.
Comparison of vehicle speed simulation and field data.
-
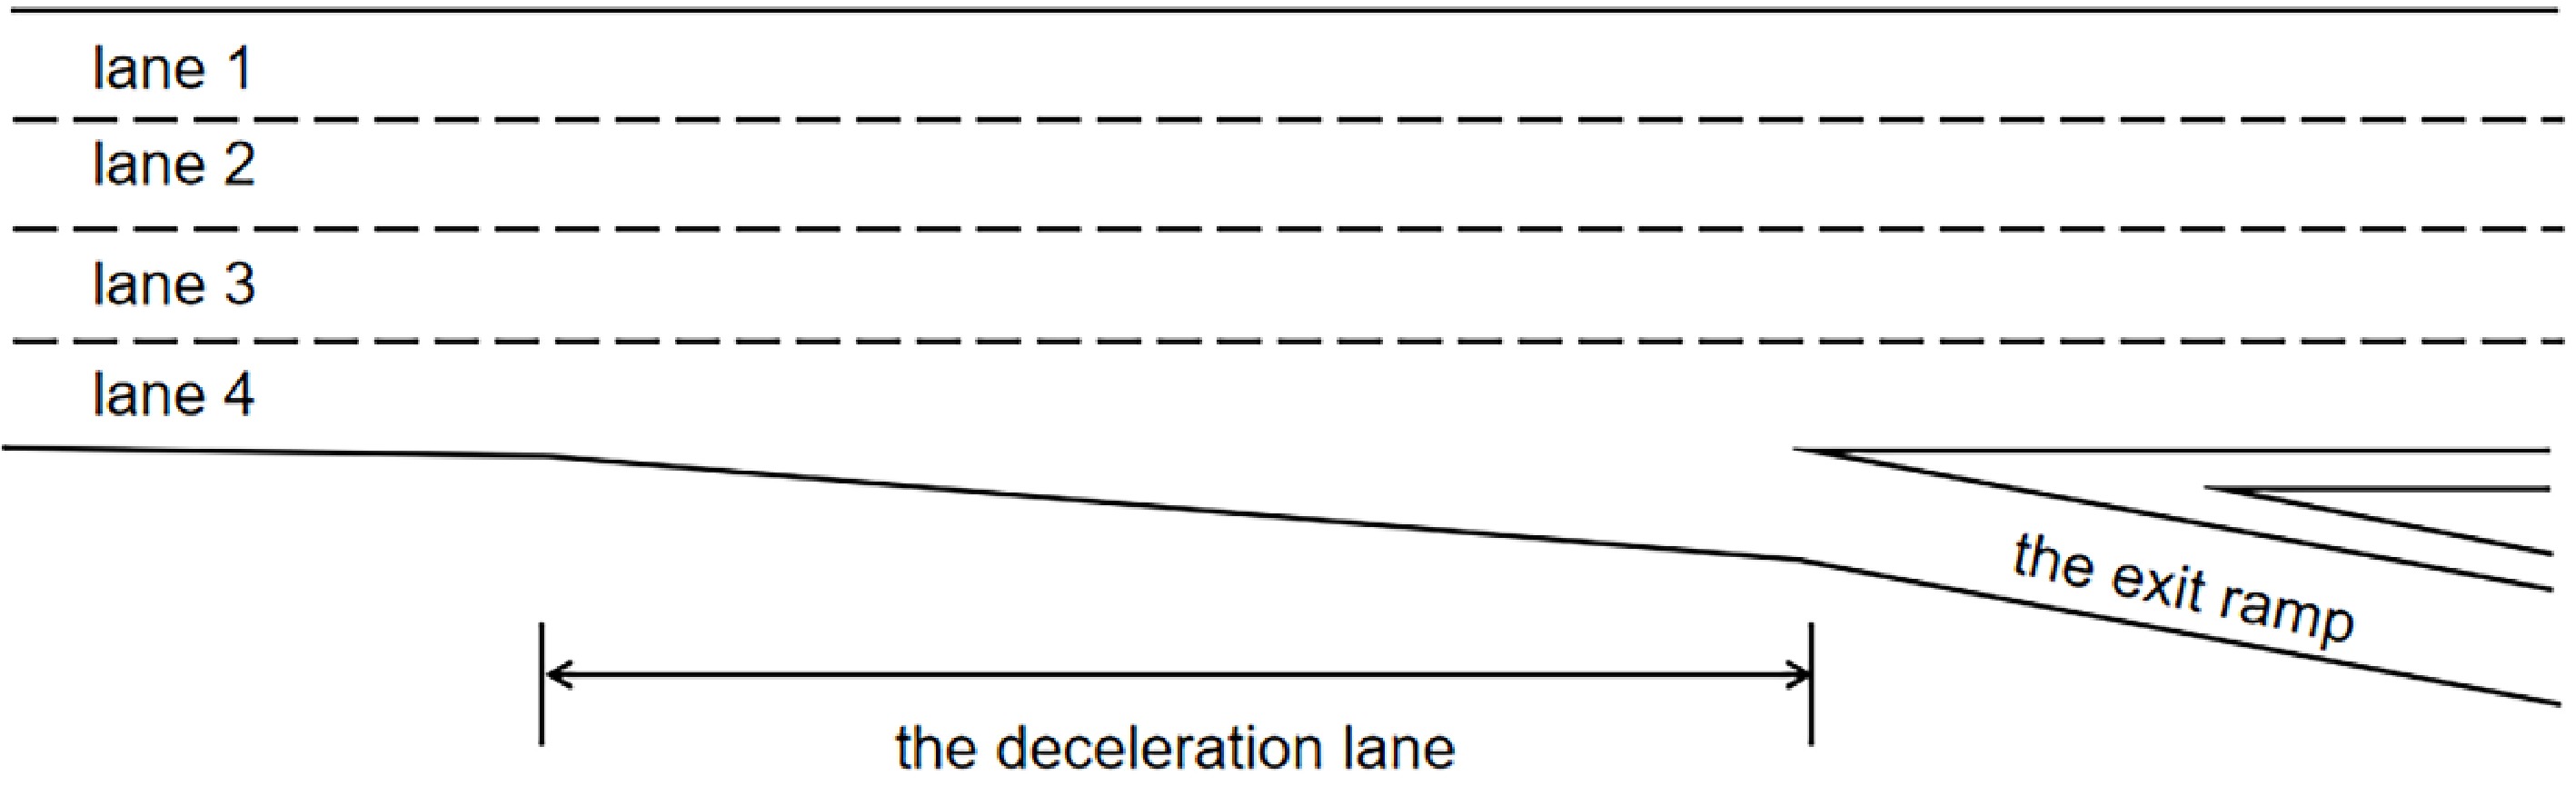
Figure 2.
Schematic diagram of the diversion area.
-
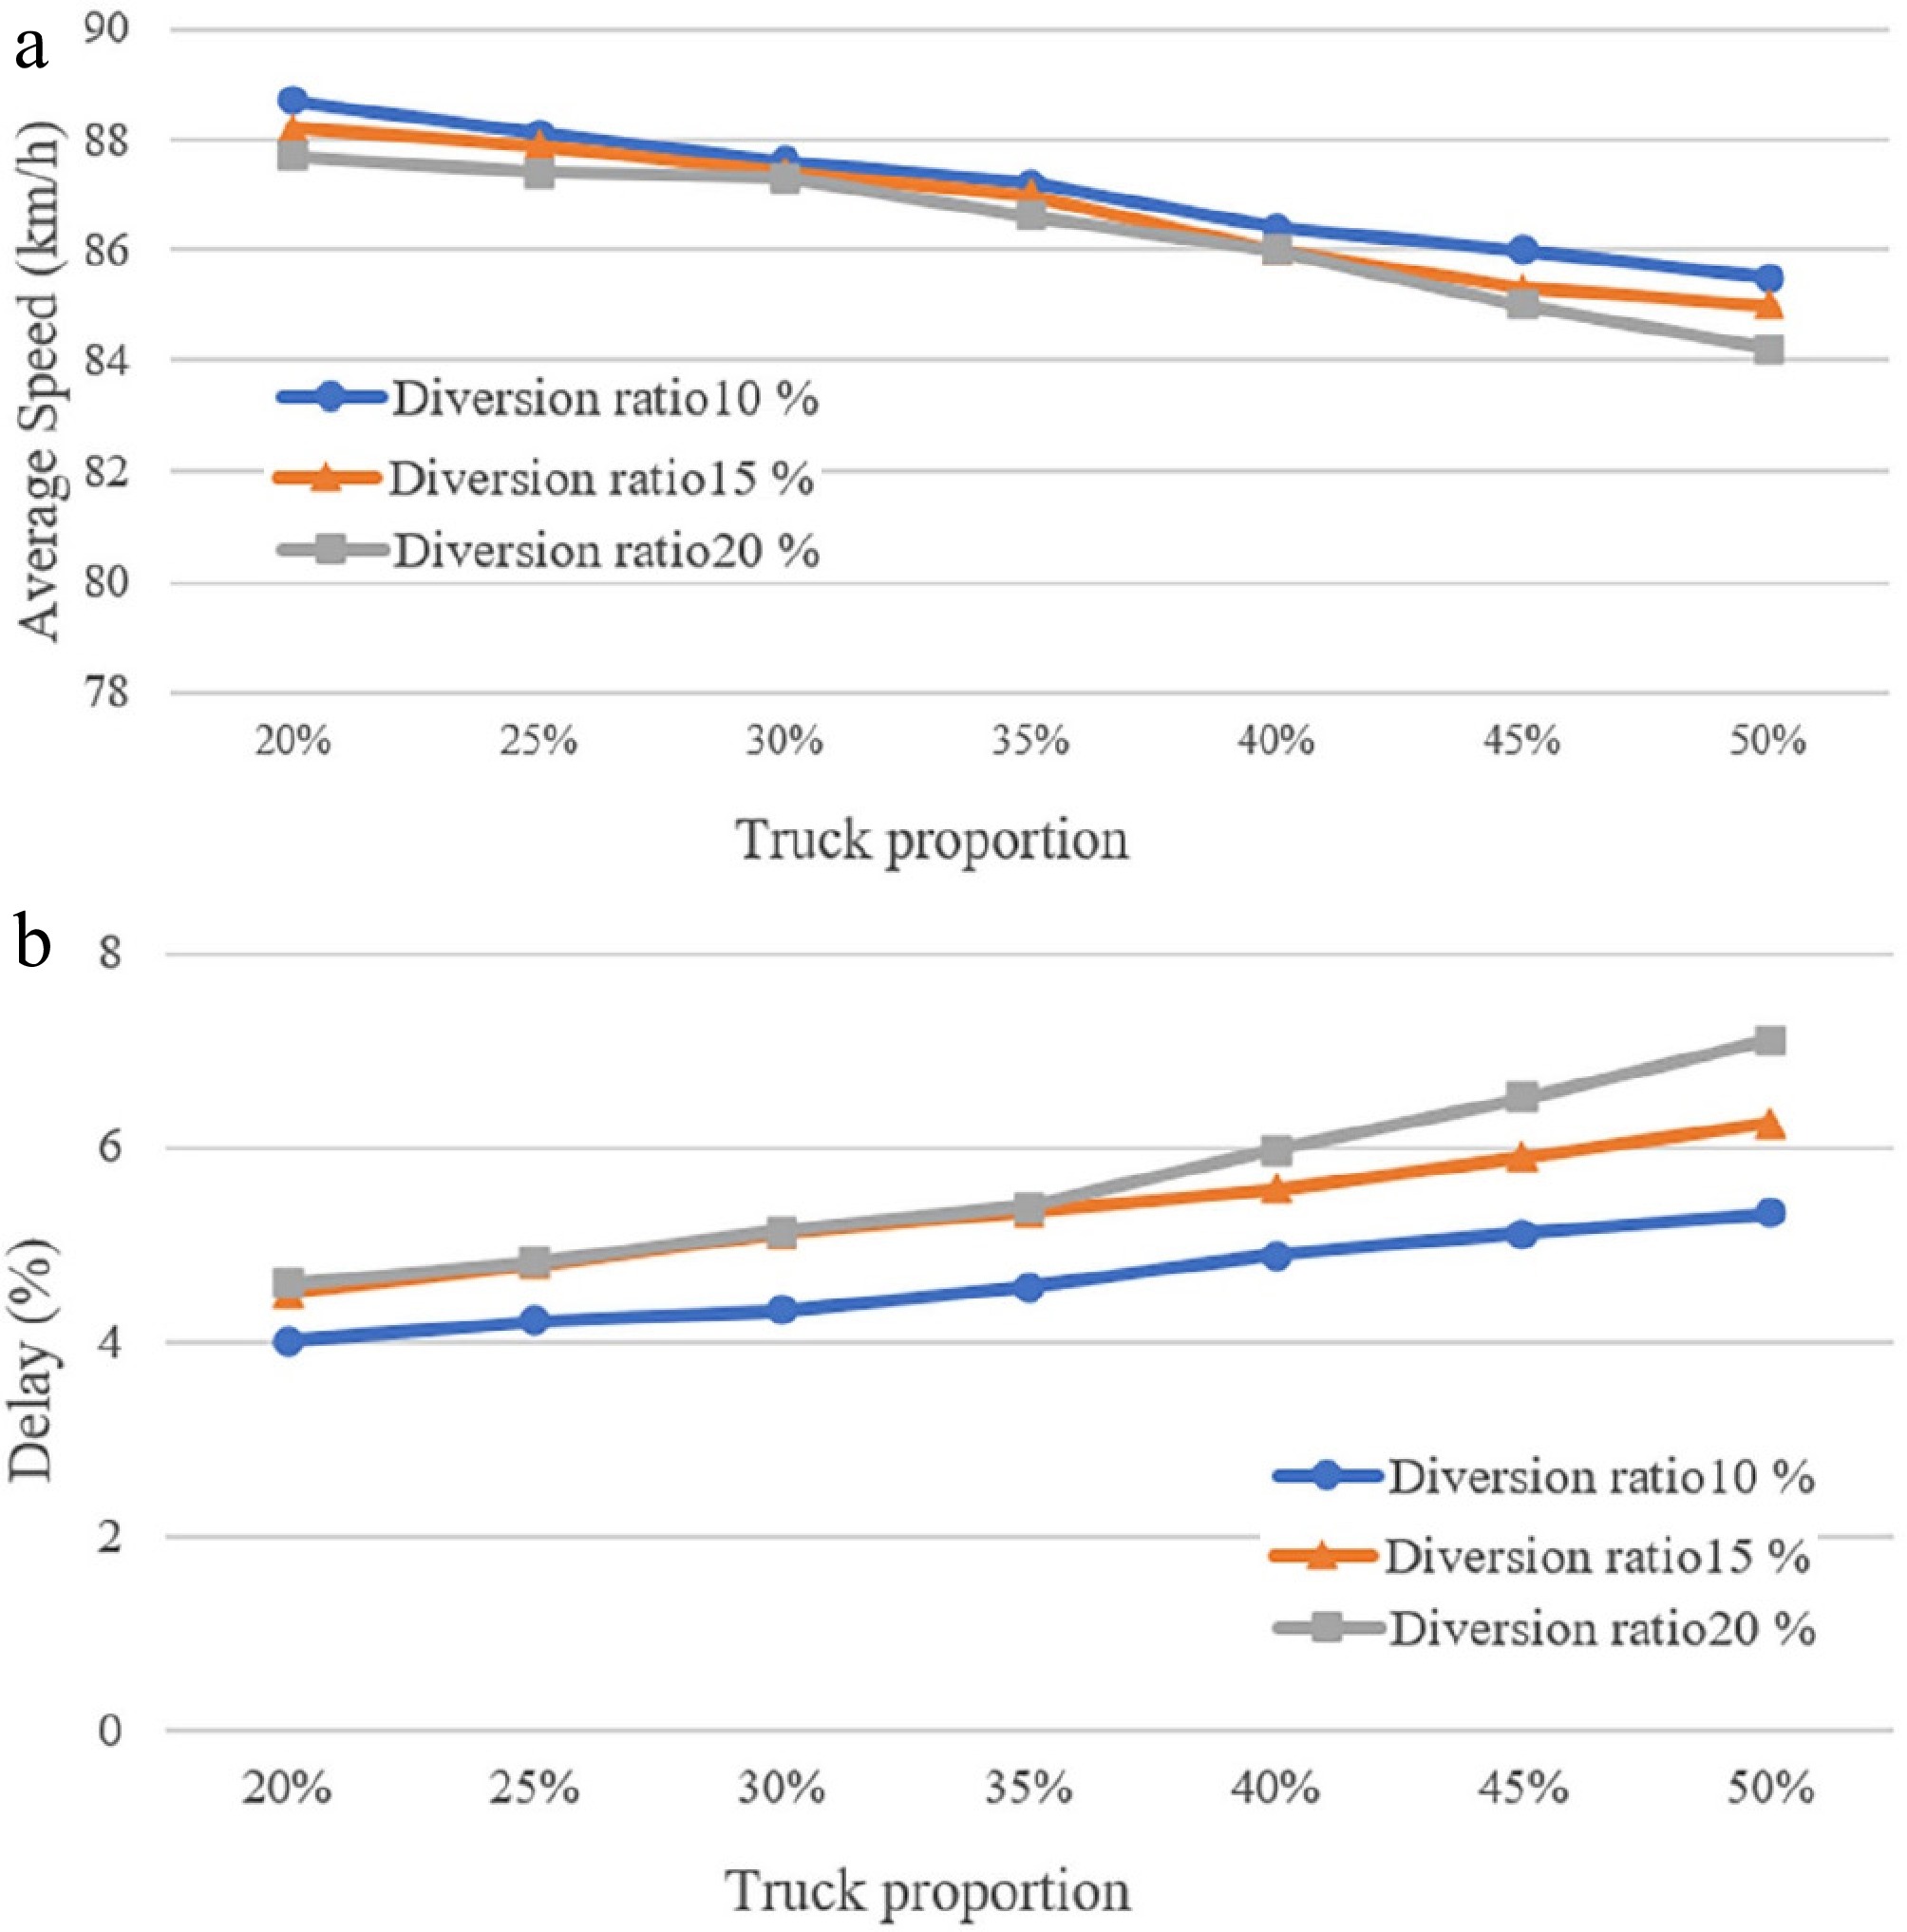
Figure 3.
Traffic operating conditions of low traffic volume. (a) Graph of speed and truck proportion, (b) Graph of delay and truck proportion.
-
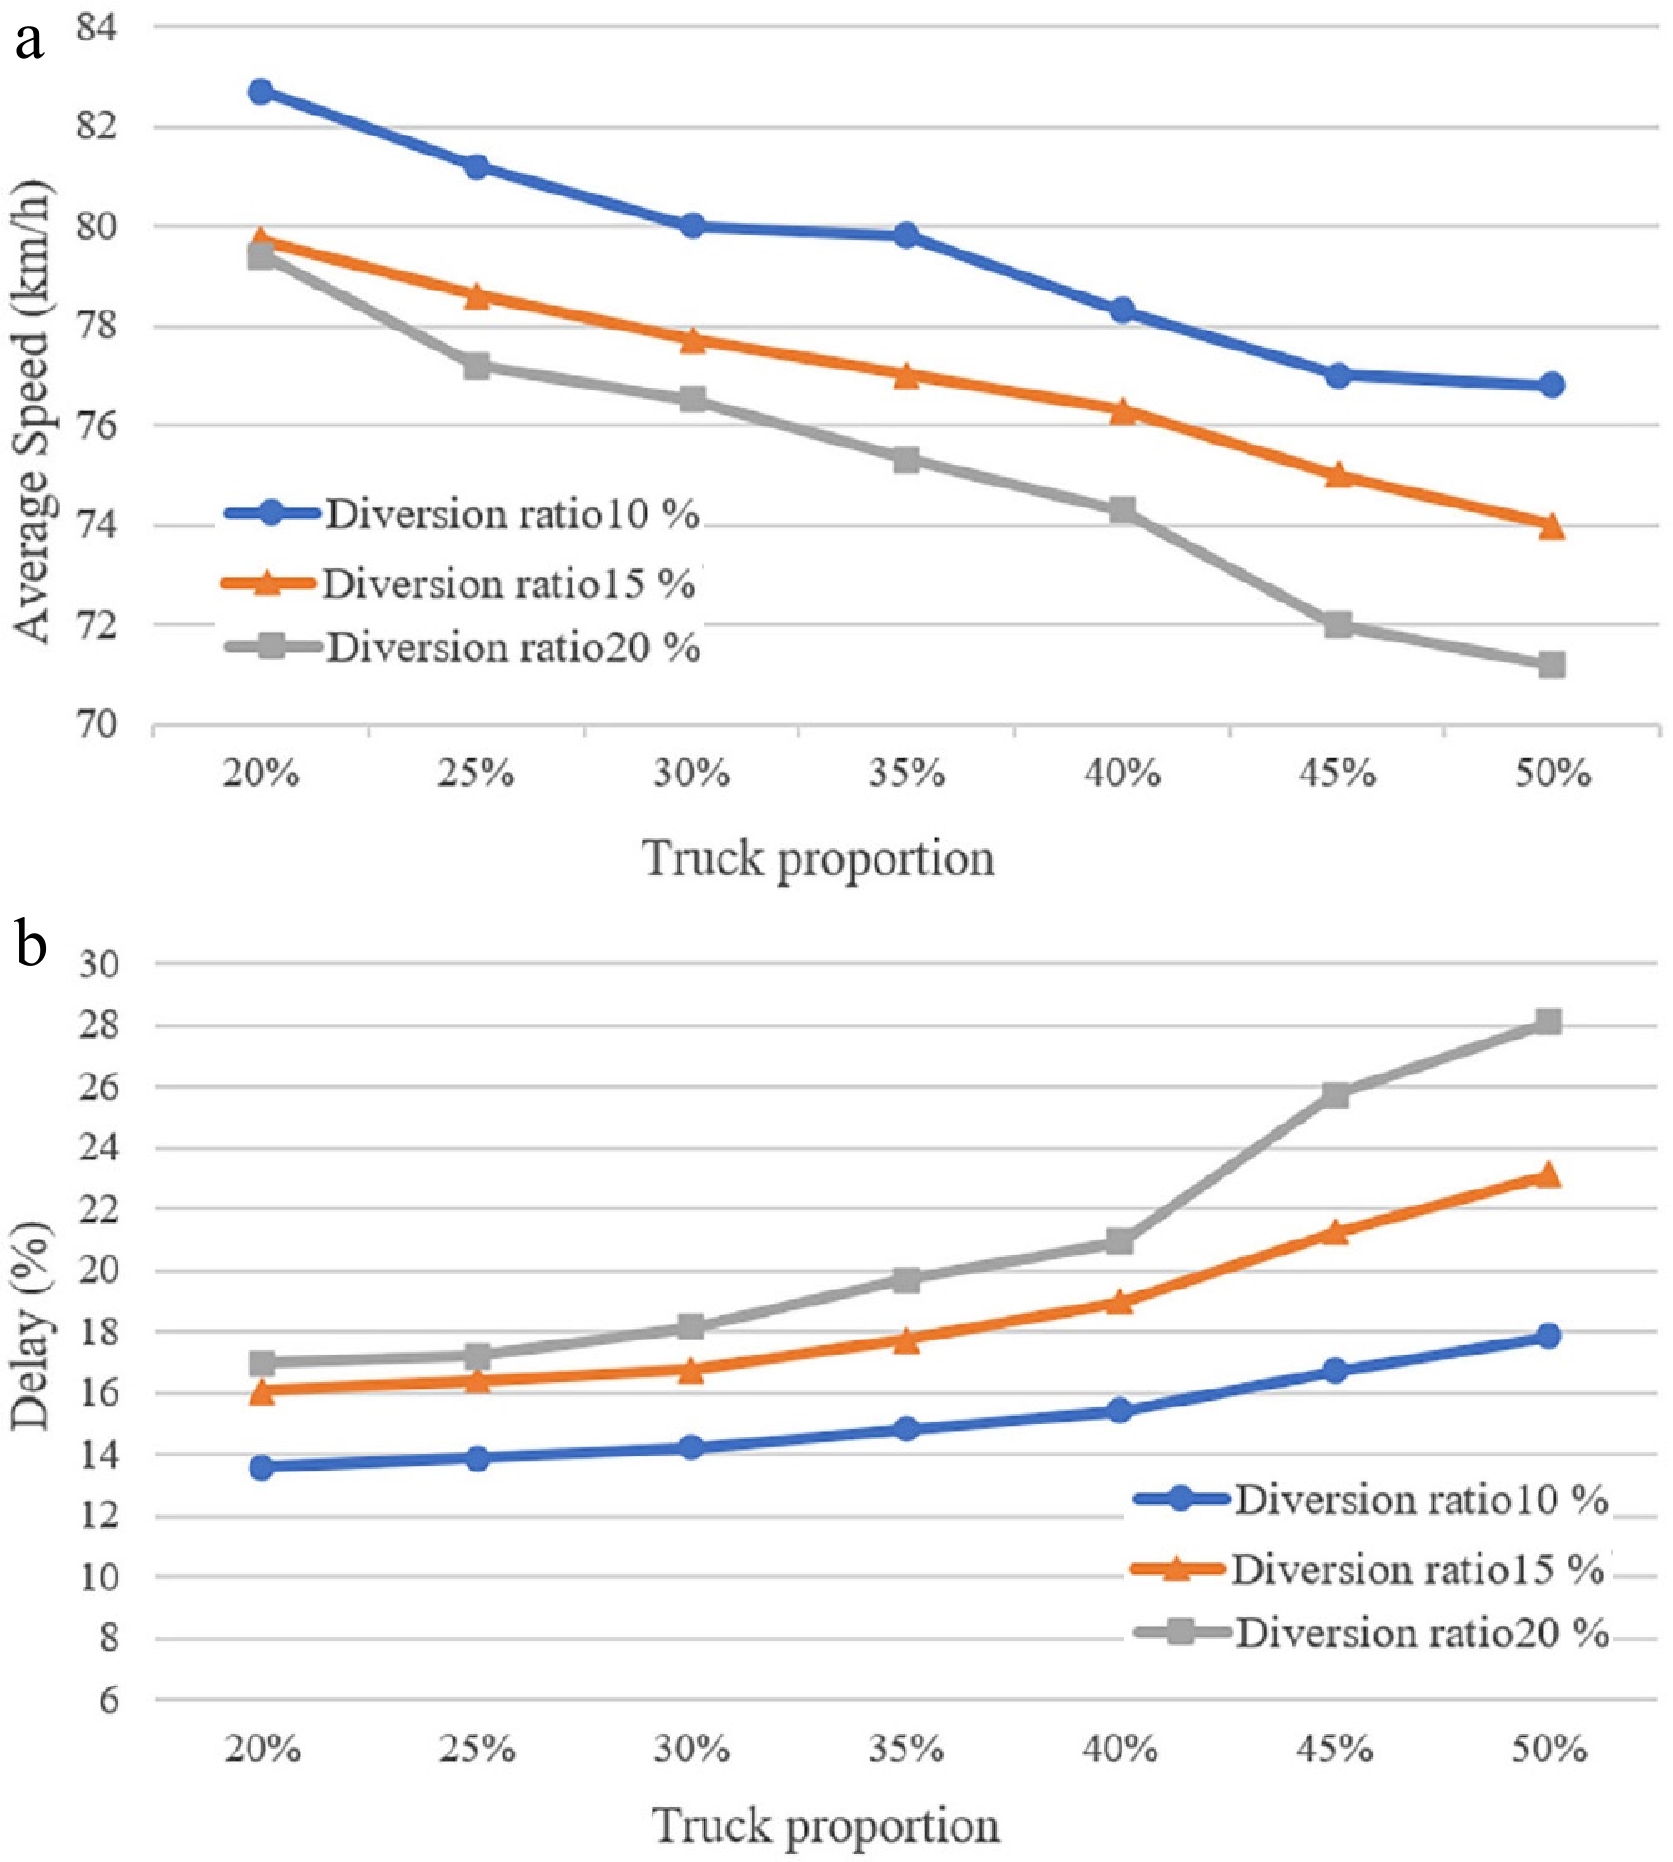
Figure 4.
Traffic operating conditions of medium traffic volume. (a) Graph of speed and truck proportion, (b) Graph of delay and truck proportion.
-
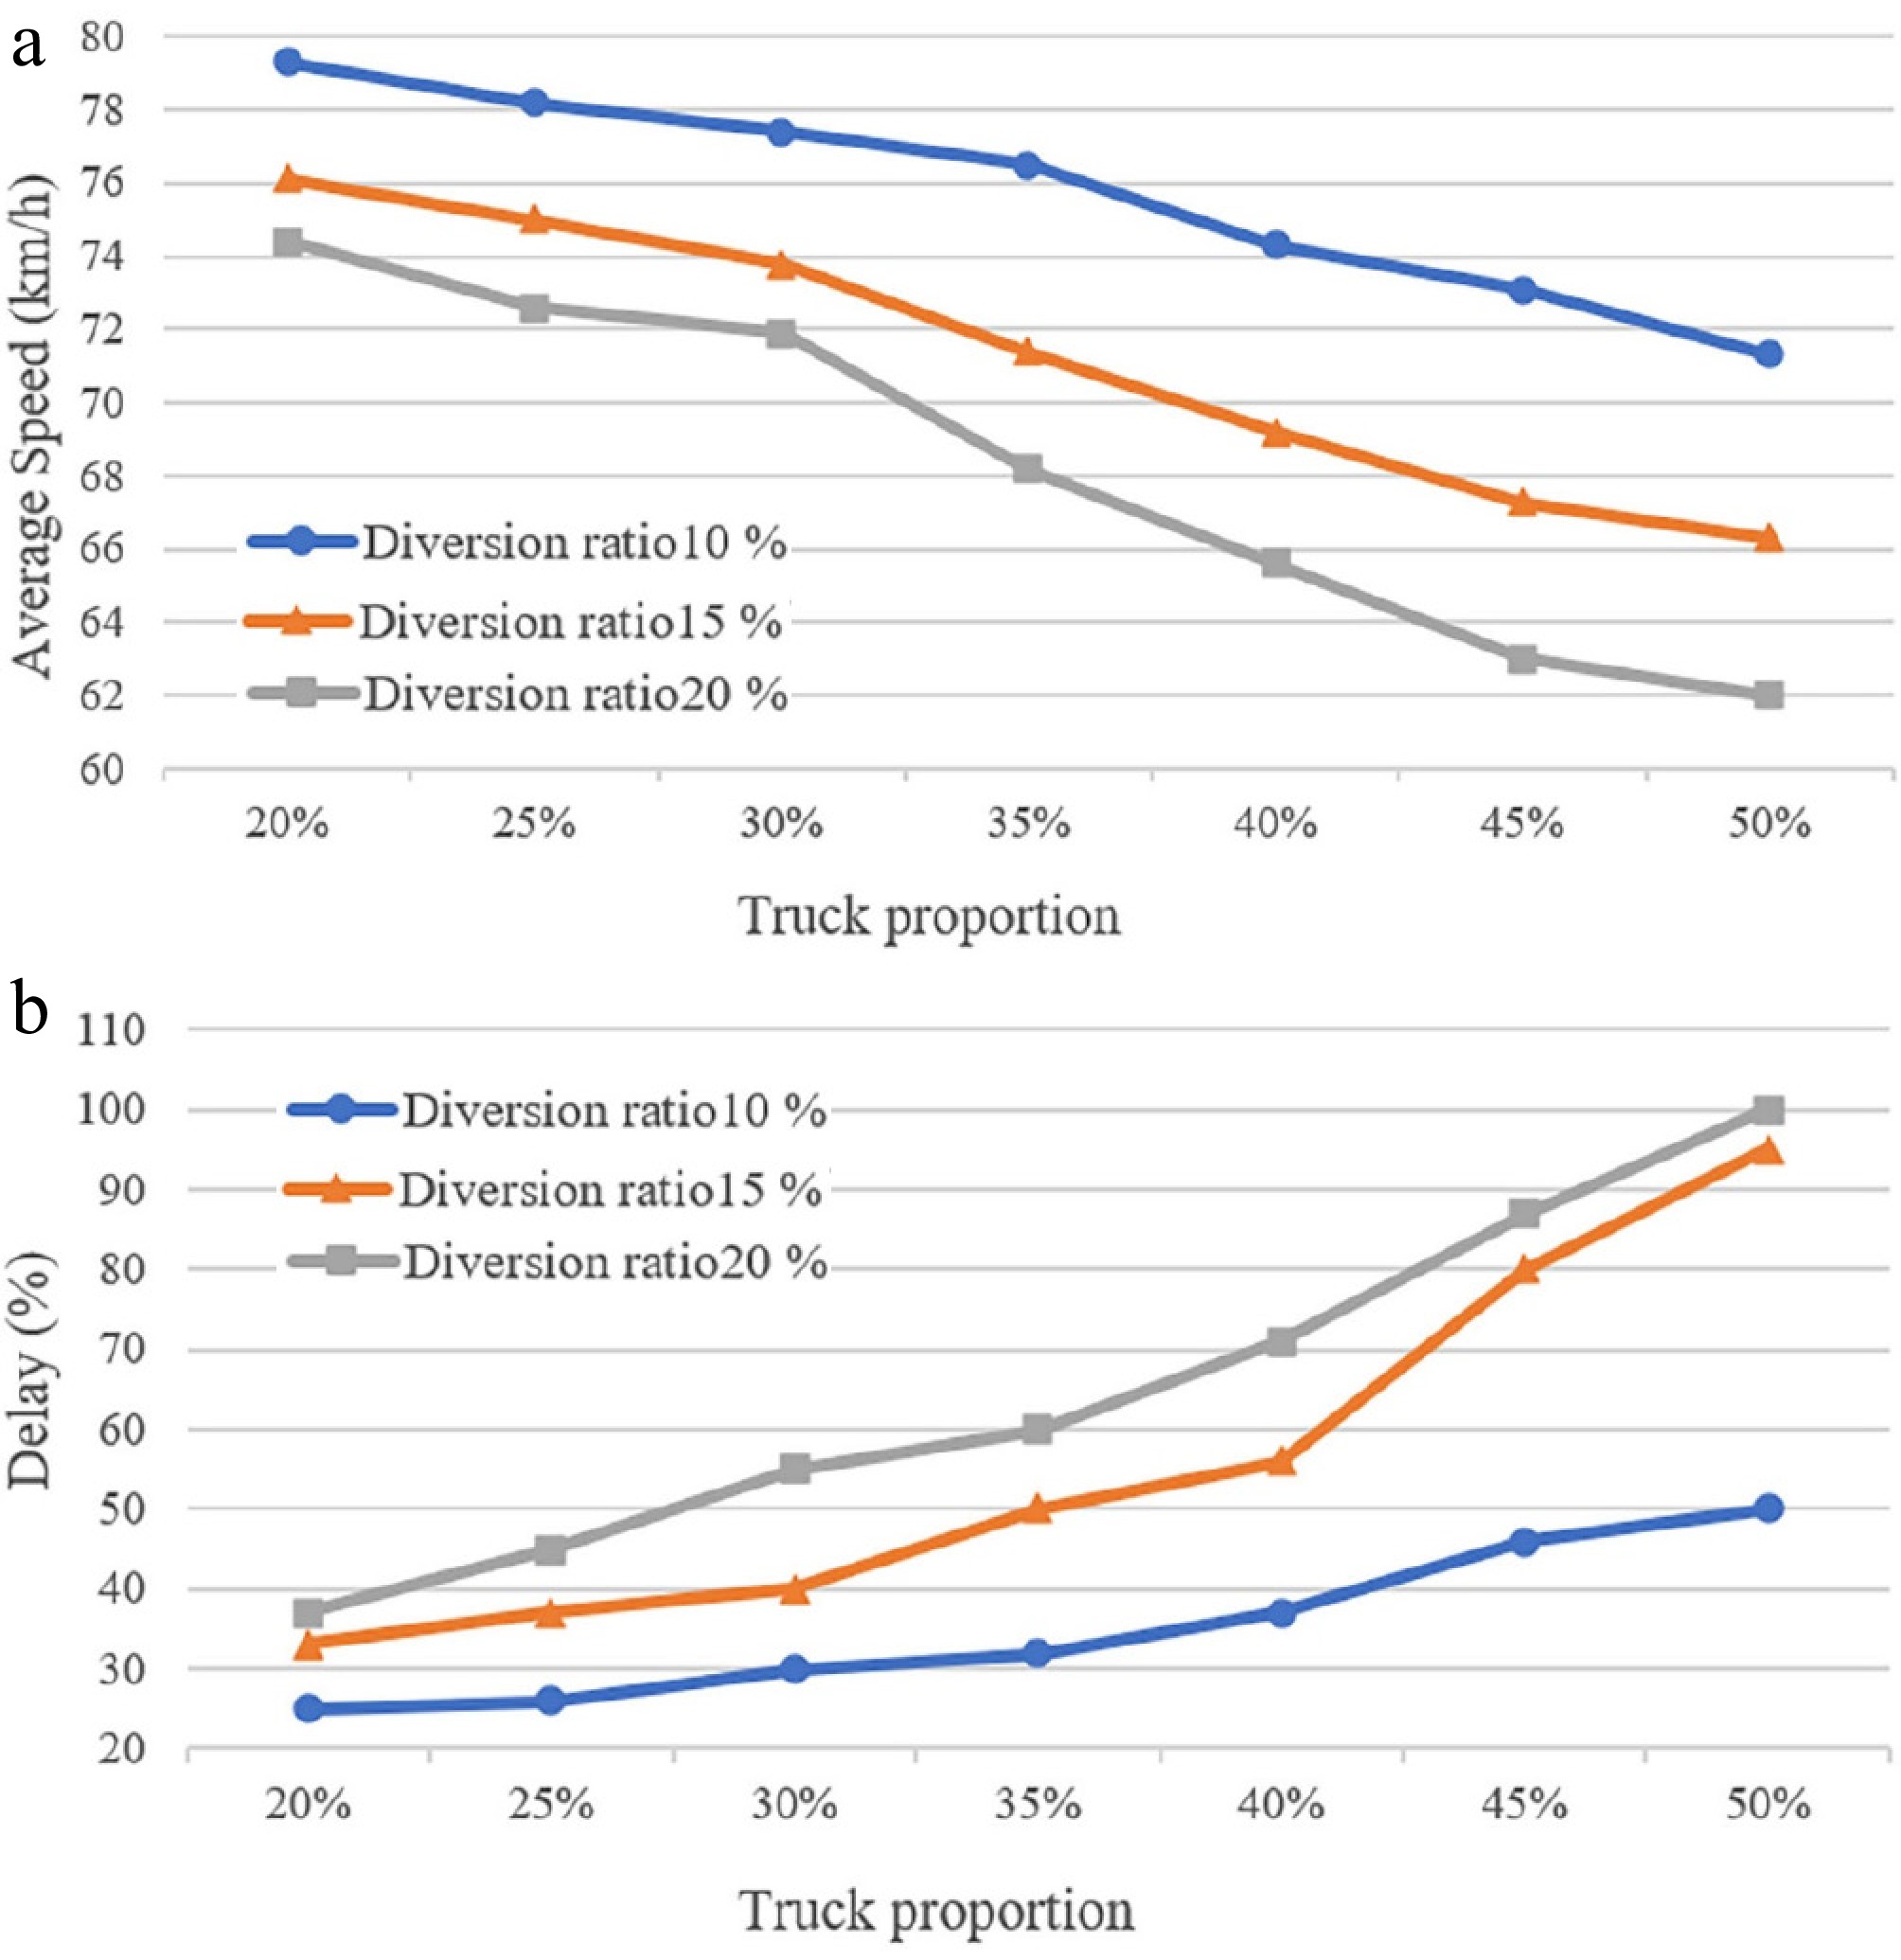
Figure 5.
Traffic operating conditions of high traffic volume. (a) Graph of speed and truck proportion, (b) Graph of delay and truck proportion.
-
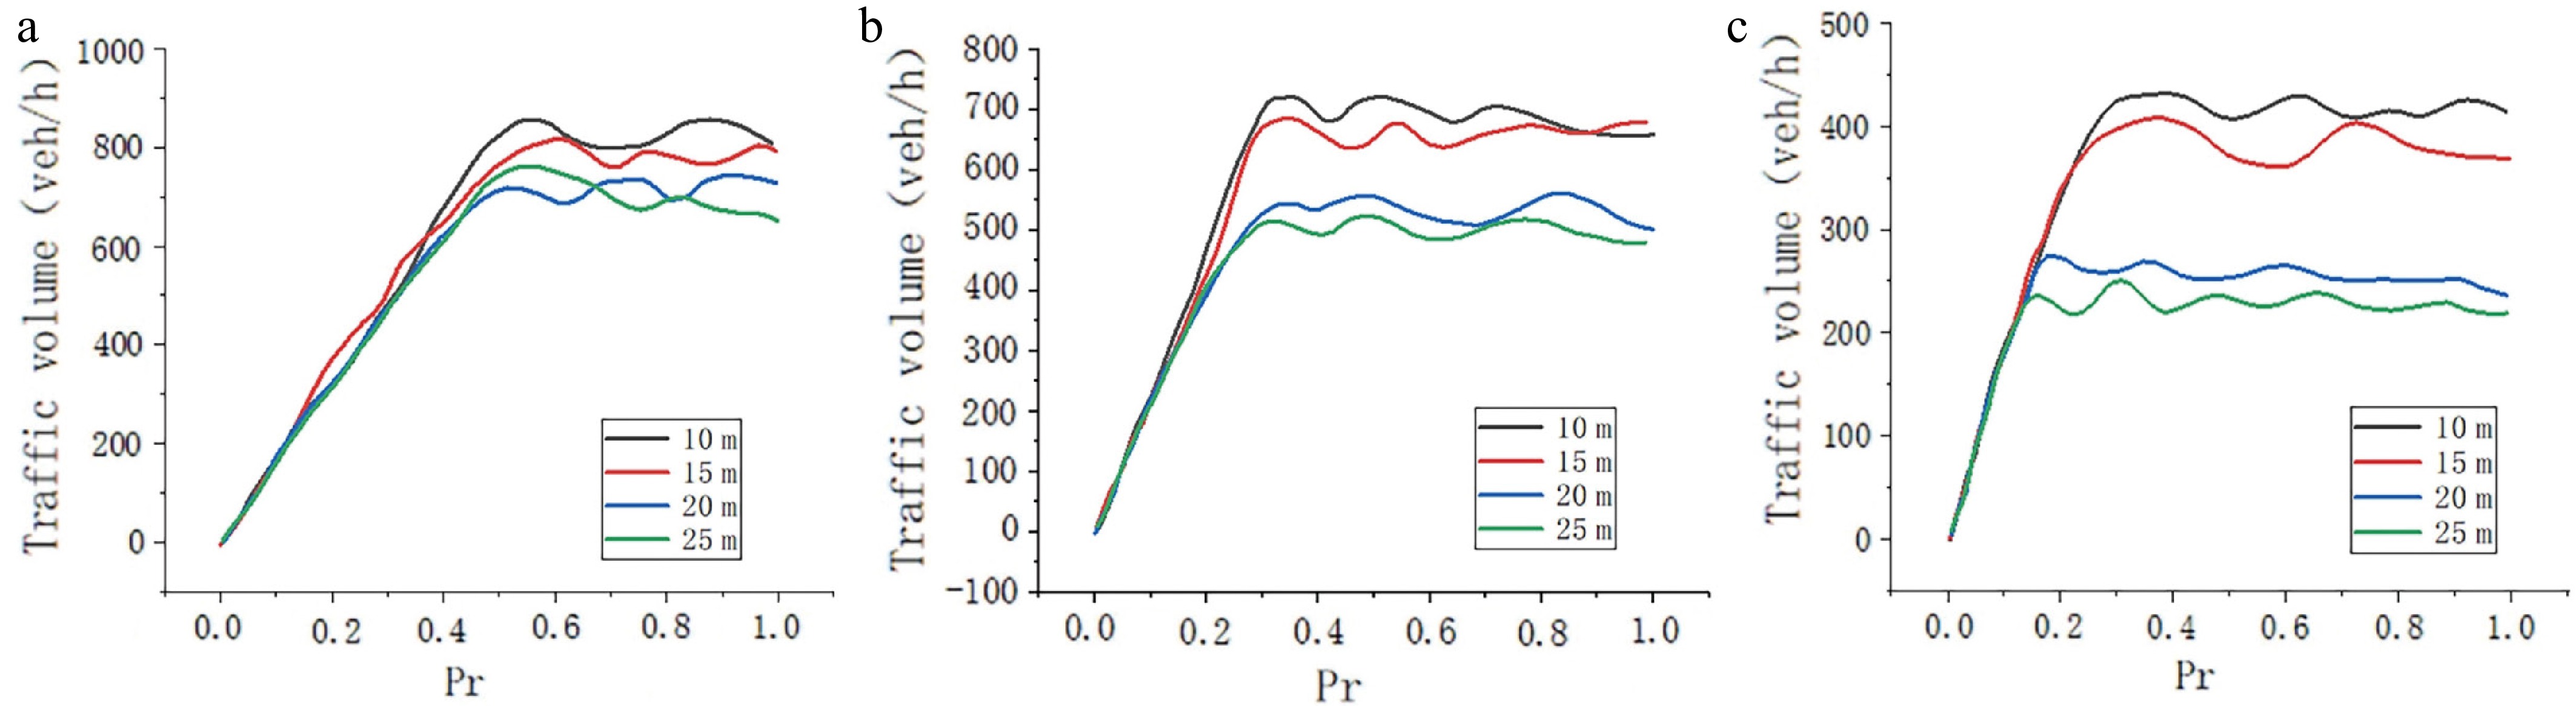
Figure 6.
Exit ramp flow vs truck length. Traffic volume: (a) low, (b) medium, and (c) high.
-
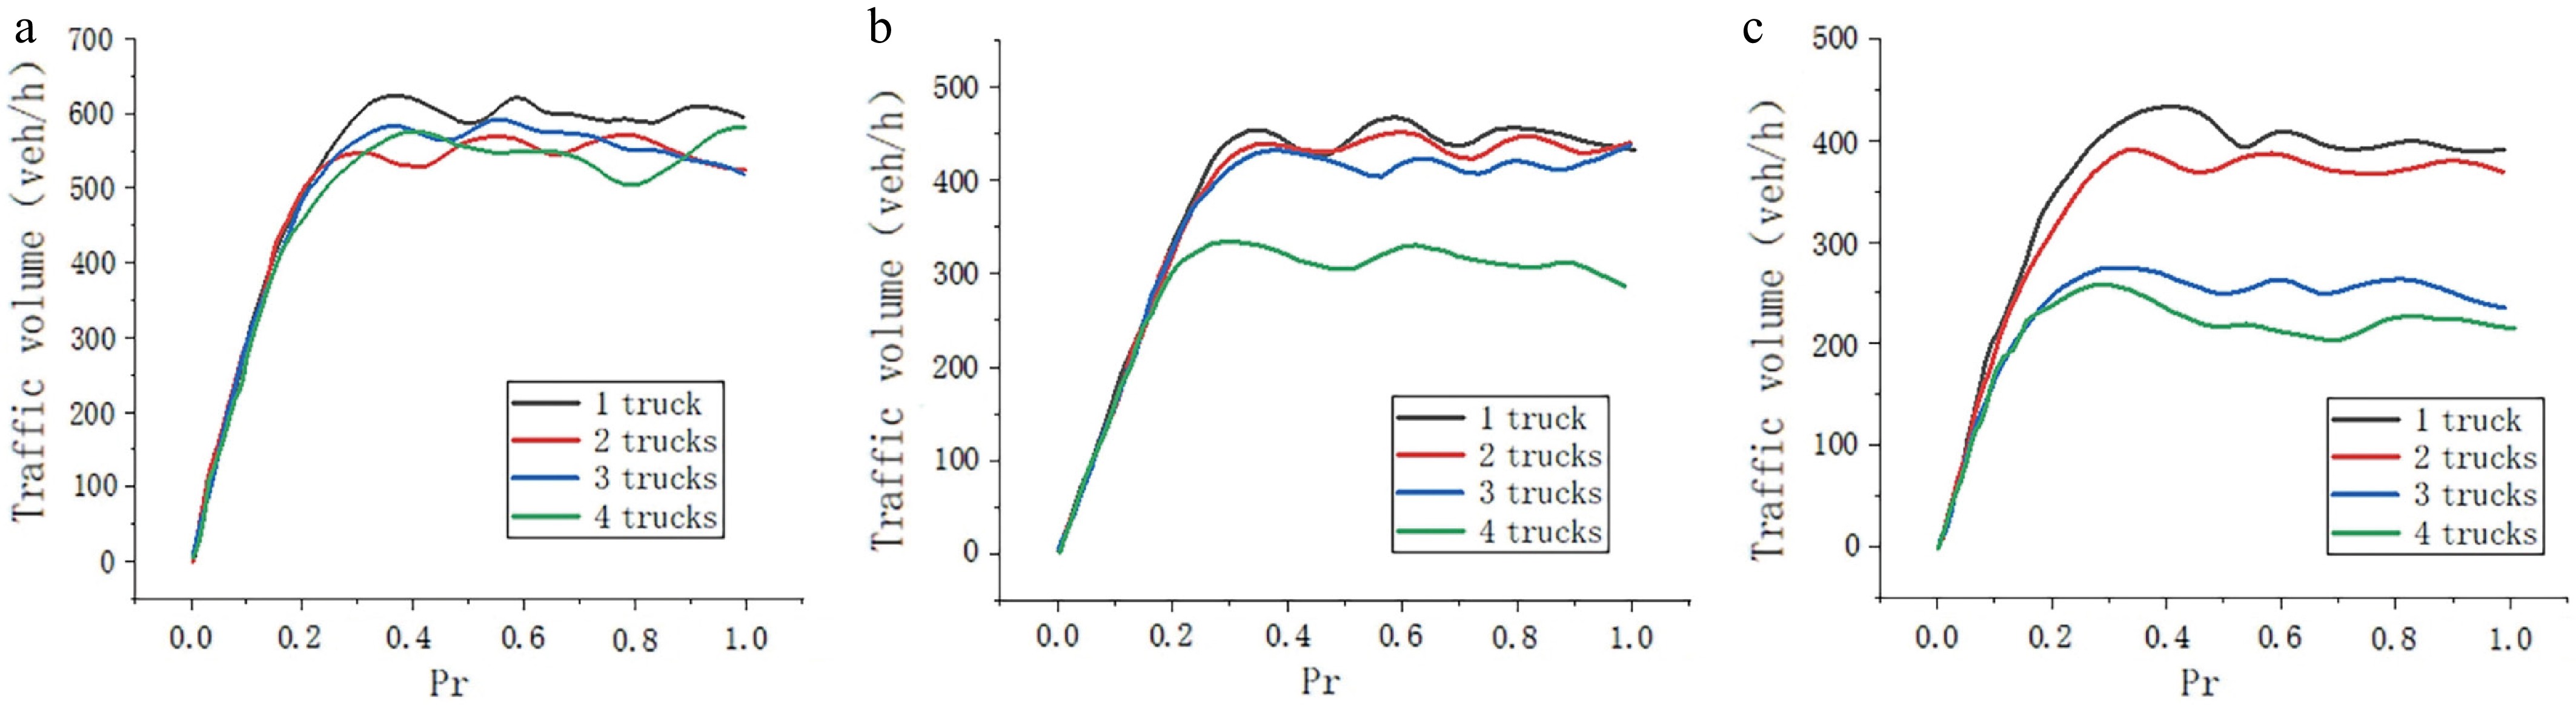
Figure 7.
Exit ramp flow vs truck platoon size. Traffic volume: (a) low, (b) medium, and (c) high.
-
Name Value Simulation length 1,000 m Maximum speed of the car 120 km/h Maximum speed for trucks 80 km/h Physical length of the car 7.5 m Physical length of the truck 15 m Regular acceleration of the car 2.5 m/s Regular acceleration of the truck 1.5 m/s Driver reaction time 0.8 s Probability of slowing down of the car-free driving 0.2 Probability of slowing down of the truck free driving 0.1 Probability of free lane-changing behavior 0.3 Probability of mandatory lane-changing behavior 1 Beginning of diverging area 500 m Regular deceleration of the car 4 m/s Regular deceleration of the truck 2.5 m/s Table 1.
Model parameters.
-
Lane type Lane-changing times Accuracy % Actual data Initial cell model simulation values Improved cell model simulation value Mandatory lane-changing behavior 1.353 1.657 1.415 95.62 Free lane-changing behavior 0.152 0.125 0.176 86.36 Table 2.
Simulation results of lane-changing times.
-
Lane type Initial cell model simulation values
(veh/h)Improved cell model simulation value (veh/h) Actual data (veh/h) Error rate Flow rate of the on-ramp Lane 1 1,589 1,477 1,430 3.18 Lane 2 1,654 1,558 1,548 0.64% Lane 3 1,054 1,123 1,112 0.98 Lane 4 956 1,048 1,029 1.81% Exit ramp − − − Flow rate of the exit ramp Lane 1 1,291 1,402 1,380 1.57% Lane 2 1,398 1,377 1,335 3.05% Lane 3 1,116 1,032 1,077 4.18% Lane 4 832 1,008 994 1.39% Exit ramp 387 439 426 2.96% Table 3.
Simulation results of hourly traffic volume.
-
Traffic volume (veh/h) The number of traffic conflicts No truck barrier (times) With truck barrier (times) Increase ratio Low traffic volume 14.1 17.4 23.4% Medium traffic volume 26.3 33.1 25.8% High traffic volume 40.2 53.2 32.3% Table 4.
Evaluation of traffic safety.
Figures
(7)
Tables
(4)