


-
Owing to their linear configuration and intricate traffic flow dynamics, freeway diverging areas frequently act as critical bottlenecks, exerting significant adverse effects on both operational efficiency and traffic safety across the freeway network. The accident statistics indicate that the traffic accident rate on exit ramps is significantly higher than that on off-ramps, approximately four to six times greater than that of the main sections of the expressway. Additionally, a considerable number of traffic accidents occur at the nose of the exit ramp[1,2]. This is primarily because, in the expressway diverging area, many through vehicles tend to shift inward to maintain speed, conflicting with vehicles attempting to exit. This leads to frequent lane changes and increased traffic conflicts in the diverging area[3]. With the increasing proportion of trucks on freeways, this traffic issue has become increasingly pronounced. Owing to the differences in size and speed between trucks and passenger cars, trucks in the diverging area often disrupt the normal car-following behavior of passenger cars and their ability to exit the ramp. Therefore, there is an urgent need to investigate the impact of trucks in expressway diverging areas, as their presence significantly affects traffic safety and operational efficiency.
In 1990, Carber et al.[4] first mentioned the concept of barrier effect of large vehicles. The barrier effect of large vehicles, which describes their impact on traffic flow at entrance and exit ramps under lane restriction strategies, has been identified but not yet fully understood, as the underlying mechanisms remain unexamined. Studies by Jo et al. and Gan et al.[5] introduced the concept of the 'barrier effect of large vehicles' to describe the phenomenon of trucks disrupting on-ramp traffic flow on expressways, providing a qualitative analysis of its defining characteristics. While Jia et al.[6] provided valuable insights into the lane-changing behavior of off-ramp vehicles and developed a cellular automata model for diverging areas, their study did not consider the presence of trucks. This omission is significant, as trucks are known to have a substantial impact on traffic flow, particularly in terms of speed reduction, lane-blocking, and increased collision risks in diverging areas. Yuan et al.[7] explored forced lane-changing behavior during continuous lane changes, with a specific focus on entrance and exit weaving areas. While the study provided valuable insights, it failed to consider the effects of different vehicle types, such as trucks and passenger cars, which are known to exhibit distinct lane-changing patterns and could substantially alter the dynamics of weaving areas.
Xu et al.[8] developed a lane-changing recognition (LCR) model using vision technology and a two-level convolutional neural network. They also proposed a novel convolutional neural network based on AlexNet for comparison. The results demonstrated that the LCR model outperformed the AlexNet-based model. However, both models were designed for basic road sections and did not incorporate the vehicle type factor, which could significantly impact lane-changing behavior. Duan[9] employed the fuzzy C-means clustering method to classify the headway of large vehicles and proposed discriminant conditions for the barrier effect of large vehicles from a microscopic perspective. Kong[10] constructed a cellular automata model considering the difference in vehicle types and studied the influencing factors and formation conditions of large vehicle barriers in the merging area. Building on this, Bai[11] studied the influence of large vehicle barriers on vehicle lane-changing and obtained the identification boundary and combination type of large vehicle barrier by processing the headway through the binary classification method. However, both studies were confined to merging areas of expressways, overlooking diverging areas, which are known to experience higher accident rates due to their complex traffic dynamics. Through a statistical analysis of diverging vehicles at multi-lane expressway exit ramps, Zhou[12] established models for truck and passenger car divergence behavior at exit ramps, along with a cooperative lane-changing model for upstream sections in a connected and automated vehicle (CAV) environment. Gao et al.[13] refined existing models to examine car-following behavior in mixed traffic flows of passenger cars and trucks on basic expressway segments. However, the study's reliance on a fixed passenger car-truck ratio in the mixed flow constrained the investigation, leaving the influence of varying ratios on car-following behavior in mixed traffic unexplored.
Compared to the wealth of research on basic sections and merging areas of expressways, studies on diverging areas are still limited. Among them, few have considered vehicle type factors, and even fewer have specifically examined the influence of trucks in these areas. This paper presents a novel perspective by incorporating the microscopic behavioral characteristics of trucks into the analysis of diverging areas. The proposed improved cellular automata model not only refines traditional approaches but also offers a robust framework for evaluating the dynamic interactions between trucks and other vehicles. Using this model, the study quantifies the impact of trucks on diverging vehicles and assesses their effects on overall traffic efficiency and safety in diverging areas. The findings provide actionable insights for optimizing traffic management strategies in diverging areas, ultimately contributing to safer and more efficient expressway operations.
-
Cellular automata consists of a series of rules, and any model that satisfies the proposed rules can be called a cellular automata model[14]. Among the commonly used traffic flow models, the cellular automata model is a discrete microscopic model, which is simple in form and easy to simulate. It can not only express the microscopic motion of vehicles under different road conditions and traffic conditions but also reflect the macroscopic characteristics of traffic flow[15]. This study employs a cellular automata model to simulate traffic dynamics in expressway diverging areas. The model initializes road and vehicle parameters, which are then precisely calibrated using field-measured data and insights from relevant references. Central to the model is the formulation of car-following and lane-changing rules. These rules are meticulously designed to replicate realistic traffic interactions and enhance the accuracy of the simulation results.
Modeling assumptions
-
(1) The driver is highly skilled, and the road is straight.
(2) By default, the driver is only affected by vehicles in the same lane during the following process, ignoring the impact of vehicles in adjacent lanes[16].
(3) The lane-changing process is simplified to immediate lane changes once the driver decides, assuming constant longitudinal speed during lane changes.
Cell application mechanism
-
In order to ensure the accuracy of the model, the length of a cell is set as 0.5 m in this paper. For different vehicle types, the required cell space length (L) is defined as L = l/0.5, where l represents the actual physical length of the vehicle.
Car-following rules
-
In the car-following model, the rear vehicle follows three rules: following requirements, speed conditions, and spacing conditions. It tends to stay close to the front vehicle to avoid falling too far behind while maintaining a safe distance for braking time in case of sudden deceleration. The rear vehicle's speed cannot exceed the front vehicle's speed for long periods and usually fluctuates around it. In diverging areas, vehicles often wait for an acceptable gap in the adjacent lane to execute a lane change for diversion rather than maintaining a minimum headway during car-following.
The classical cellular automata traffic flow model's deceleration rule neglects the driver's reaction time. Drawing on the Gipps safety model, this study acknowledges the impact of a vehicle's physical properties, speed, acceleration, and deceleration capabilities, and the driver's reaction time on the vehicle's state. In order to ensure driving safety, the minimum safe distance and maximum safe speed required by the vehicle n in the process of following the preceding vehicle are shown by Eqs (1) and (2), respectively.
$ {\text{ga}}{{\text{p}}_{safe}} = {X_{n + 1}}(t) - {X_n}(t) - {l_{n + 1}} = {V_n}(t){\tau _n} + \dfrac{{{V_n}{{(t)}^2}}}{{2{b_n}}} - \dfrac{{{V_{n + 1}}{{(t)}^2}}}{{2{b_n}}} $ (1) $ {V_{safe,n}}(t) = - {b_n}{T_n} + \sqrt {b_n^2{\tau _n}^2 + {b_n}\left[ {2ga{p_{safe}} - {V_n}(t){\tau _n} + \dfrac{{{V_{n + 1}}{{(t)}^2}}}{{{b_{n + 1}}}}} \right]} $ (2) gapsafe represents the safe distance between the vehicle n and the preceding vehicle n + 1. Xn+1(t) represents the position of the vehicle in front of the target vehicle n at time t. Xn(t) represents the position of the target vehicle n at time t. ln+1(t) represents the length of the vehicle in front of the target vehicle n. Where bn(t) denotes the conventional deceleration of the vehicle in the system. τn(t) represents the driver reaction time of the target vehicle, which is taken as 0.8 s[17]. Vn(t) and Vn+1(t) represent the speeds of the target vehicle n and the preceding vehicle at time t, respectively. Vsafe,n(t) is the safe speed of vehicle n to avoid a rear-end collision with the preceding vehicle at time t. This speed is derived from critical factors, including the gapsafe, vehicle deceleration capabilities, and driver reaction time. In the simulation framework, during each time step, every vehicle dynamically computes its current Vsafe(t) based on the real-time state of the preceding vehicle (position and speed) and its intrinsic parameters (deceleration rate and reaction time). The vehicle then adjusts its speed accordingly to maintain compliance with the required safety distance.
The model defines the deceleration used in the safe distance as the vehicle's conventional deceleration. There are two reasons for choosing conventional deceleration as the safety distance control variable: (1) It can effectively reduce the deceleration threshold in the deceleration rule of the classical NS model, which is closer to the actual traffic flow; and (2) It can effectively address the safety issues in the variable safety distance model mentioned above, and avoid the collision phenomenon between front and rear vehicles.
Acceleration rules (gapn > gapsafe):
$ {V_n}(t + 1) = \min \left[ {\begin{array}{*{20}{c}} {{V_n}(t) + {a_n},{V_{\max }}} \end{array},{V_{safe,n}}(t),ga{p_n}(t)} \right] $ (3) Uniform velocity rules (gapn = gapsafe):
$ {V_n}(t + 1) = \min \left[ {{V_n}(t),ga{p_n}(t)} \right] $ (4) Deceleration rules (gapn < gapsafe):
$ {V_n}(t + 1) = \max \left\{ {\min \left[ {{V_{safe,n}}(t),ga{p_n}(t)} \right],0} \right\} $ (5) Probability of slowing down:
$ {V_n}(t + 1) = \max \left[ {{V_n}(t + 1) - {b_n},0} \right],{\text {probability p}} $ (6) Location updating rules:
In order to truly reflect the car-following behavior characteristics and motion continuity between vehicles, the existence of decimals is allowed when calculating vehicle speed and acceleration and deceleration, the integer part is updated when calculating vehicle displacement, and the decimal part is updated cumulatively to improve the accuracy of simulation results[18]. The auxiliary margin update process is as follows:
$ {Y_n}(t + \Delta t) = {Y_n}(t + \Delta t) - fix({Y_n}(t + \Delta t)) $ (7) $ {Y_n}(t + \Delta t) = {Y_n}(t) + {V_n}(t)\Delta t $ (8) Yn(t) is the auxiliary margin when the position of vehicle n is updated at time t (the initial value is 0). The fix (x) function implements rounding toward zero, decomposing displacement values into integer updates and fractional residuals. If x ≥ 0, fix (x) = ⌊x⌋, which truncates the fractional part (downward rounding). If x < 0, fix (x) = ⌈x⌉, which discards the fractional part toward zero (upward rounding for negative values). This residual accumulation preserves motion continuity by preventing truncation errors, which is critical for realistic car-following behavior simulation.
The position of the vehicle is updated according to its speed, and the auxiliary margin is updated first when Yn(t + Δt) ≥ 1:
$ {Y_n}(t + 1) = {Y_n}(t + 1) - fix({Y_n}(t + 1)) $ (9) Then, the location is updated:
$ {X_n}(t + 1) = {X_n}(t) + fix({Y_n}(t + 1)) $ (10) Equations (3)−(5) explain the acceleration and deceleration rules in the process of the vehicle following, and Eq (6) takes into account the phenomenon of sudden deceleration and stopping in the process of a vehicle traveling, so it introduces random slowing down probability. Equation (10) explains the change of position in the process of vehicle traveling. Vn(t) is the speed of vehicle n at moment t. Vn(t+1) is the speed of vehicle n at moment t+1. Vmax is the maximum traveling speed. gapn(t) is the headway between vehicle n and the vehicle in front of it at moment t. Xn(t) is the position of vehicle n at moment t. Vn(t+1) is the position of vehicle n at moment t+1. The acceleration in the time interval is set to 1 cell length, and according to the acceleration characteristics of the vehicle,
$ \Delta $ During the car-following process, four distinct vehicle interaction types can occur: car-car (C-C), car-truck (C-T), truck-car (T-C), and truck-truck (T-T) in the process of vehicle car-following. Large vehicles will cause the change of psychological characteristics and driving habits of vehicle drivers. As a result, the random slowing probability of C-T and T-T is dynamically affected by large vehicles rather than constant. When the target vehicle follows behind a large vehicle, the probability of random slowing probability will change with the distance between the two vehicles and the relative speed. Therefore, this paper considers the influence of large trucks to improve the random slowing probability in the above vehicle car-following rules.
$ {{\text{p}}^*} = p + \left( {\dfrac{{ga{p_{impact}} - ga{p_n}\left( t \right)}}{{ga{p_{impact}}}}} \right)\left( {\dfrac{{{V_{\max }} + \Delta {V_n}\left( t \right)}}{{{V_{\max }}}}} \right) \times {p_{impact}} $ (11) In Eq. (11), p is the random slowing probability when the vehicle is driving freely, and gapimpact is the influence distance of trucks. This paper, referencing relevant literature and field survey data on the influence distance of trucks, selects 80 m as the threshold for distinguishing between free-flow and car-following conditions[19]: when the spacing between the target vehicle and the preceding vehicle is not less than 80 m, the target vehicle is considered to be in free-flow conditions, unaffected by the preceding vehicle. When the spacing between the target vehicle and the preceding vehicle is less than 80 m, the target vehicle is considered to be influenced by the preceding vehicle and, thus, in car-following conditions.
$ \Delta $ Since the truck impact coefficient pimpact cannot be directly obtained from the data, this paper uses MATLAB for K-S testing and RMSE analysis, using vehicle speed as the evaluation index, to select the pimpact that best fits the vehicle operation situation[10]. In the K-S test, if p-value > 0.05, the null hypothesis is accepted; if p-value ≤ 0.05, the null hypothesis is rejected. As shown in Fig. 1, for the C-T following combination when the pimpact = 0.1, p = 0.62 and RMSE = 3.1 km/h; for the T-T following combination, when pimpact = 0.4, p = 0.71 and RMSE = 4.5 km/h. At this point, the simulation and actual measurement data distributions are basically consistent, and the RMSE is minimized. Therefore, the pimpact for the C-T and T-T following combinations are 0.1 and 0.4, respectively.
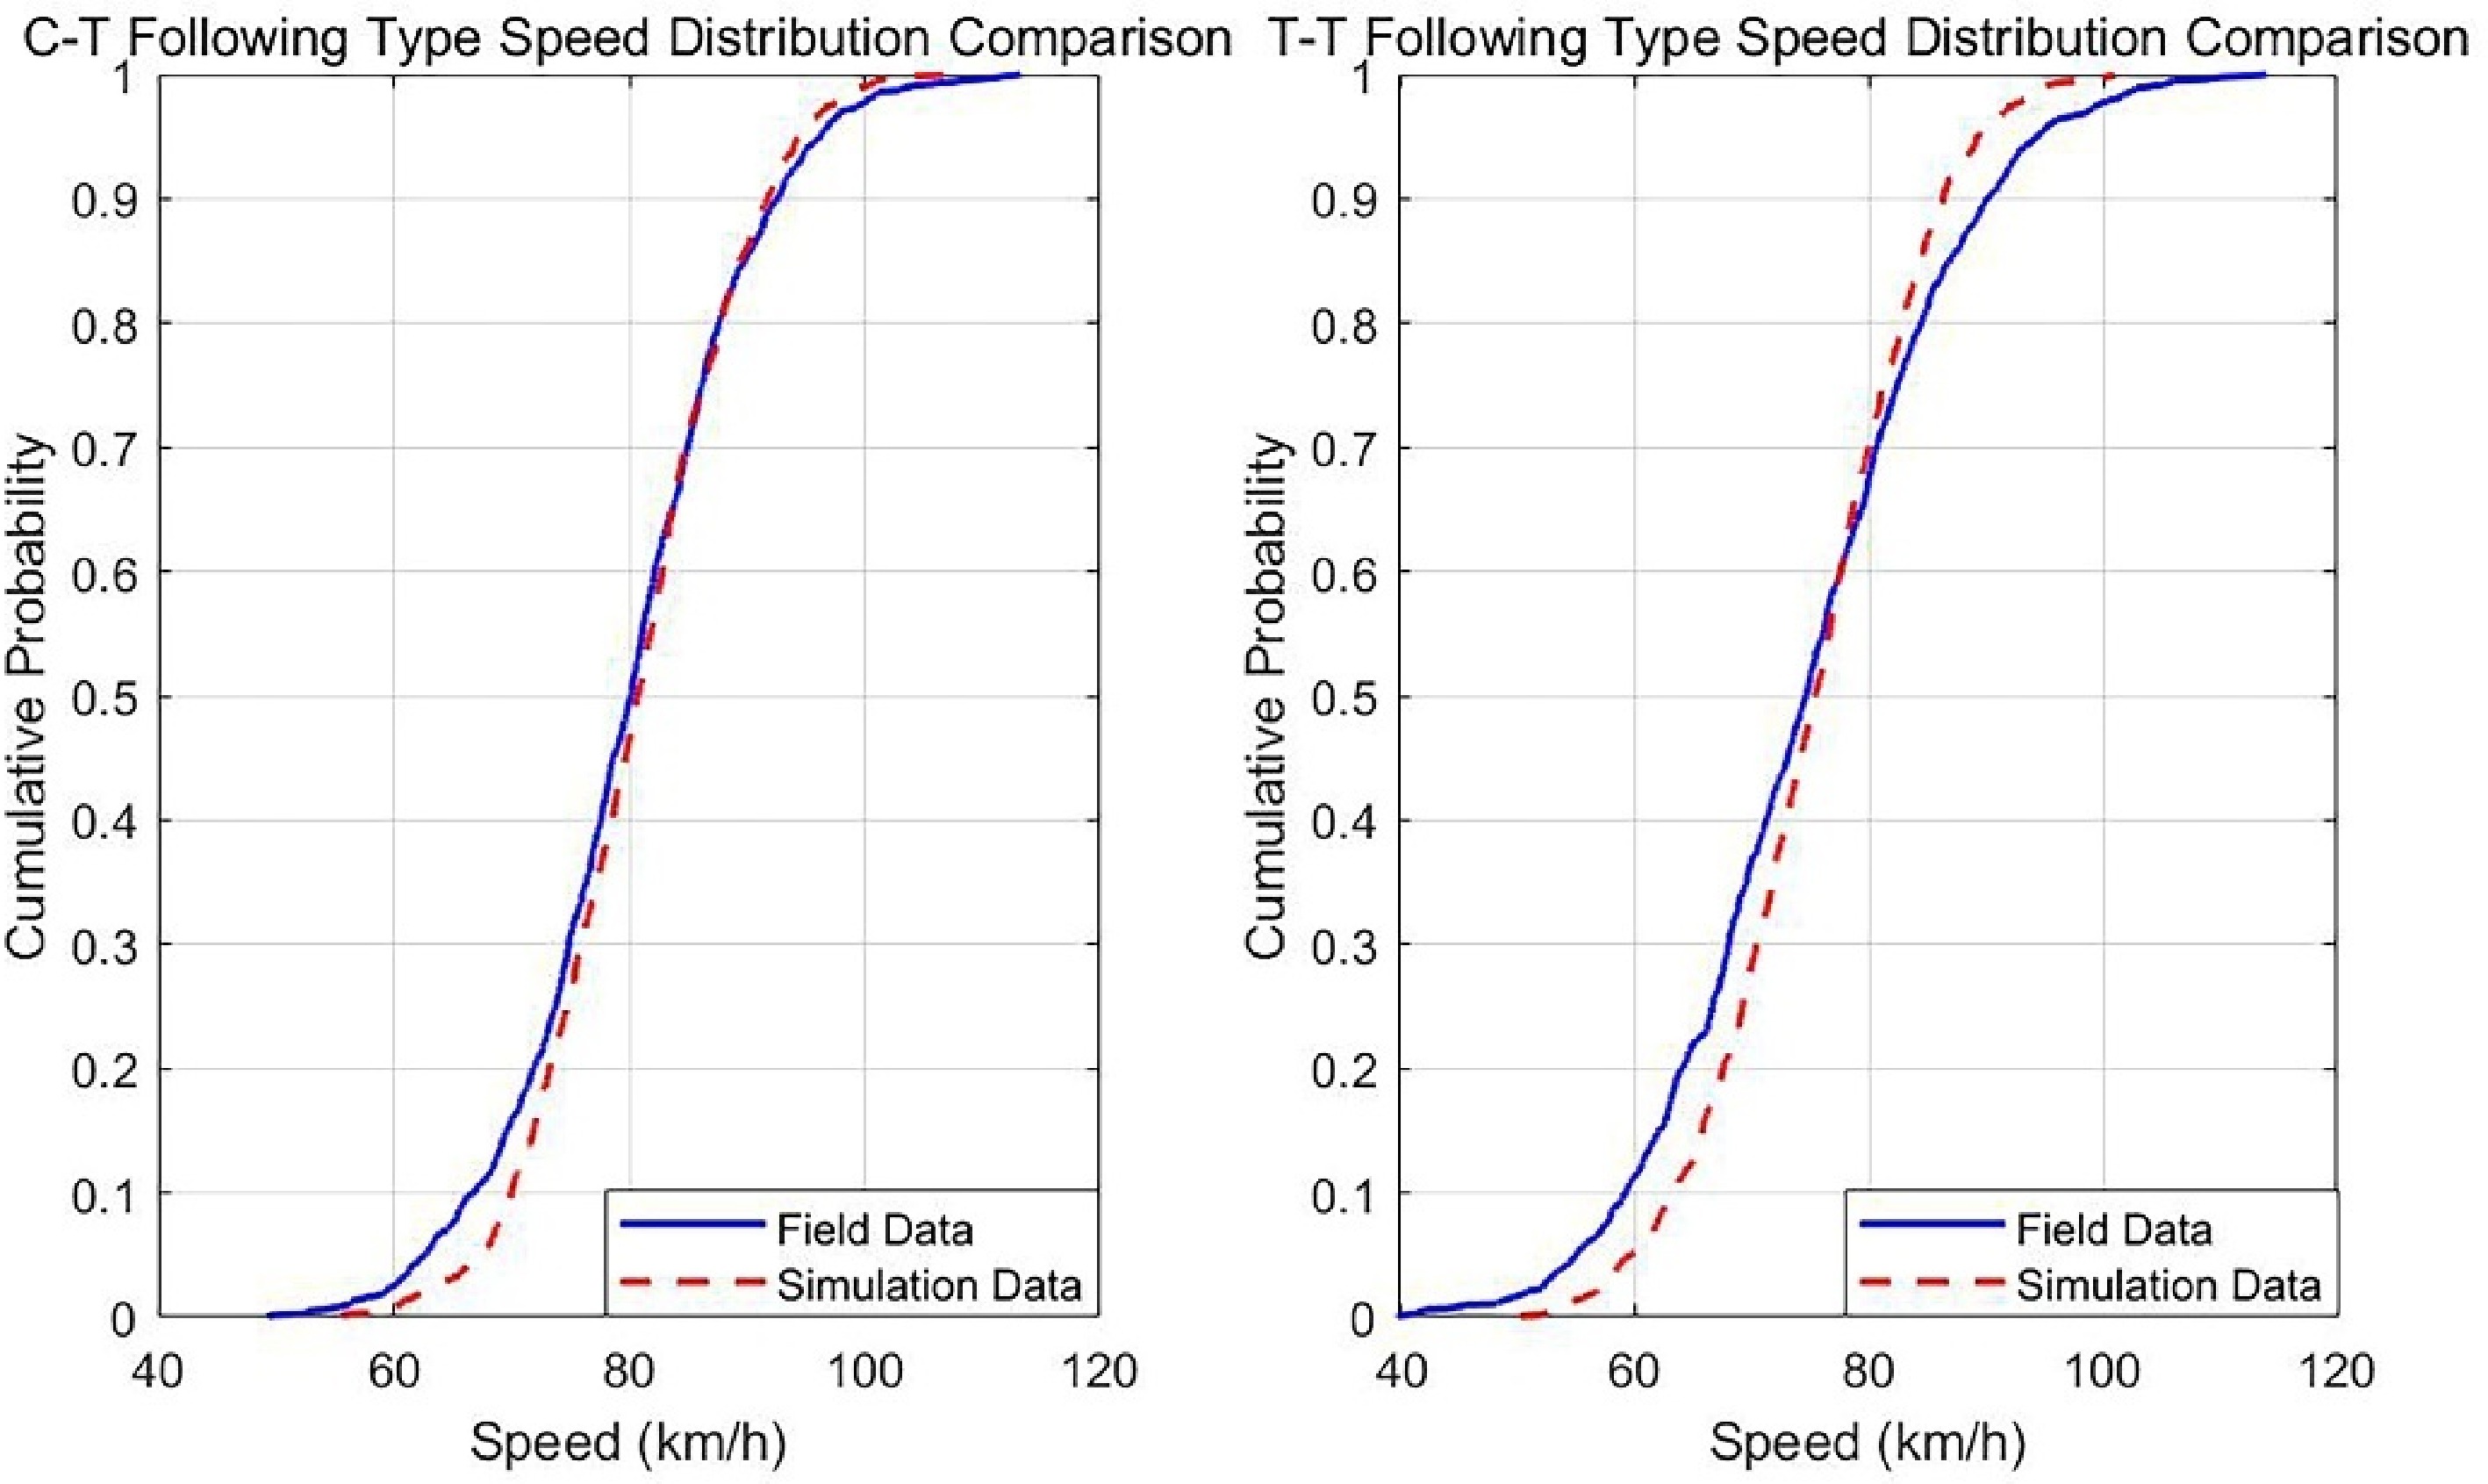
Figure 1.
Comparison of vehicle speed simulation and field data.
Lane-changing rules
-
Lane-changing behavior falls into two types: free and mandatory. Free lane-changing happens when drivers evaluate surrounding traffic to enhance their driving environment. It is mainly based on two factors: (1) the adjacent lane's average speed seems higher than the current lane's; and (2) the current lane's headway is considered insufficient, reducing vehicle speed and maneuverability. In contrast, mandatory lane-changing in diverging areas is prompted by the need to diverge. The presence of diverging vehicles is a key factor differentiating traffic flow in diverging areas from that in basic road sections. These vehicles must switch to the outer lane before the latest diverging point to exit smoothly.
Free lane-changing rules
-
$ \left\{ {\begin{array}{*{20}{l}} {ga{p_n}\left( t \right) \lt \min \left( {{v_n}\left( t \right) + 1,{v_{\max }}} \right)} \\ {ga{p_{n,other}}\left( t \right) \gt ga{p_n}\left( t \right)} \end{array}} \right.\qquad\qquad\quad $ (12) $ \left\{ {\begin{array}{*{20}{l}} {ga{p_{n,back}}\left( t \right) \gt ga{p_{safe}}} \\ {ga{p_{safe}} = {v_{\max }}} \end{array}} \right. \qquad\qquad\qquad\qquad$ (13) $ \left\{ {\begin{array}{*{20}{l}} {ga{p_{n,back}} \gt ga{p_\partial } + {\nu _{\max }} - \min \left( {{\nu _n} + 1,{\nu _{\max }}} \right)} \\ {ga{p_\partial } \geqslant 1} \end{array}} \right. $ (14) In this paper, the STCA model is selected as the lane-changing model, Eq (12) is the motivation for lane-changing in the model, and Eqs (13) and (14) are the safety conditions for lane-changing in the STCA-I and STCA-II models, respectively. gapn,other(t) denotes the headway between vehicle n and the vehicle in front of it in the target lane at time t. gapn,back(t) denotes the headway between vehicle n and the rear vehicle in the target lane at moment t. gapsafe is the safety distance without collision after the vehicle changes lanes. In the simulation process, in order to avoid rear-end collision, this paper set gap
$ {_\partial } $ Mandatory lane-changing rules
-
In the section before the diverging area, drivers might change lanes to the left, even if they know they need to diverge later. This happens when the left lane has better traffic conditions, as drivers want to avoid disruptions from vehicles ahead changing lanes to the right for diversion. Within the diverging area, vehicles not already in the outer lane often change lanes. After the diverging point, mainline vehicles focus on maintaining higher speeds safely and may change lanes left or right based on traffic conditions. The basic rules of mandatory lane changes are as follows:
$ ga{p_{n,back}} \gt ga{p_{safe}}' $ (15) $ ga{p_{n,other}} \gt l $ (16) Equation (15) represents the safety distance between vehicle n and the rear vehicle of the target lane. Equation (16) means that the distance between vehicle n and the front vehicle driving in the target lane should be at least greater than the body length of the vehicle. Considering the emergency of mandatory lane-changing in the diverging area,
$ ga{p_{safe}}' $ Simulation scheme
-
This study examines the diverging areas of a two-way eight-lane expressway. The simulation environment comprises four mainline lanes (near the median, two middle lanes, and near the exit ramp) and a direct exit ramp (Fig. 2). Based on field investigations and literature reviews, MATLAB simulations are used to model the freeway diverging environment. For research purposes, vehicles are categorized into trucks and cars. The length of the truck is 15 m, which is 30 cells, and the length of the car is 7.5 m, which is 15 cells. The maximum driving speed of the car is 120 km/h (67 cells/s), and the driving speed of the truck is 80 km/h (44 cells/s). The acceleration of a car is 2.5 m/s2 ( 5 cells/s), and the acceleration of a heavy-duty truck is 1.5 m/s2 ( 3 cells/s). The deceleration of cars is 4 m/s2 (8 cells/s), and that of heavy-duty trucks is 2.5 m/s2 (5 cells/s). The number of cells per lane is 2000, and the length of the lane is 1,000 m.
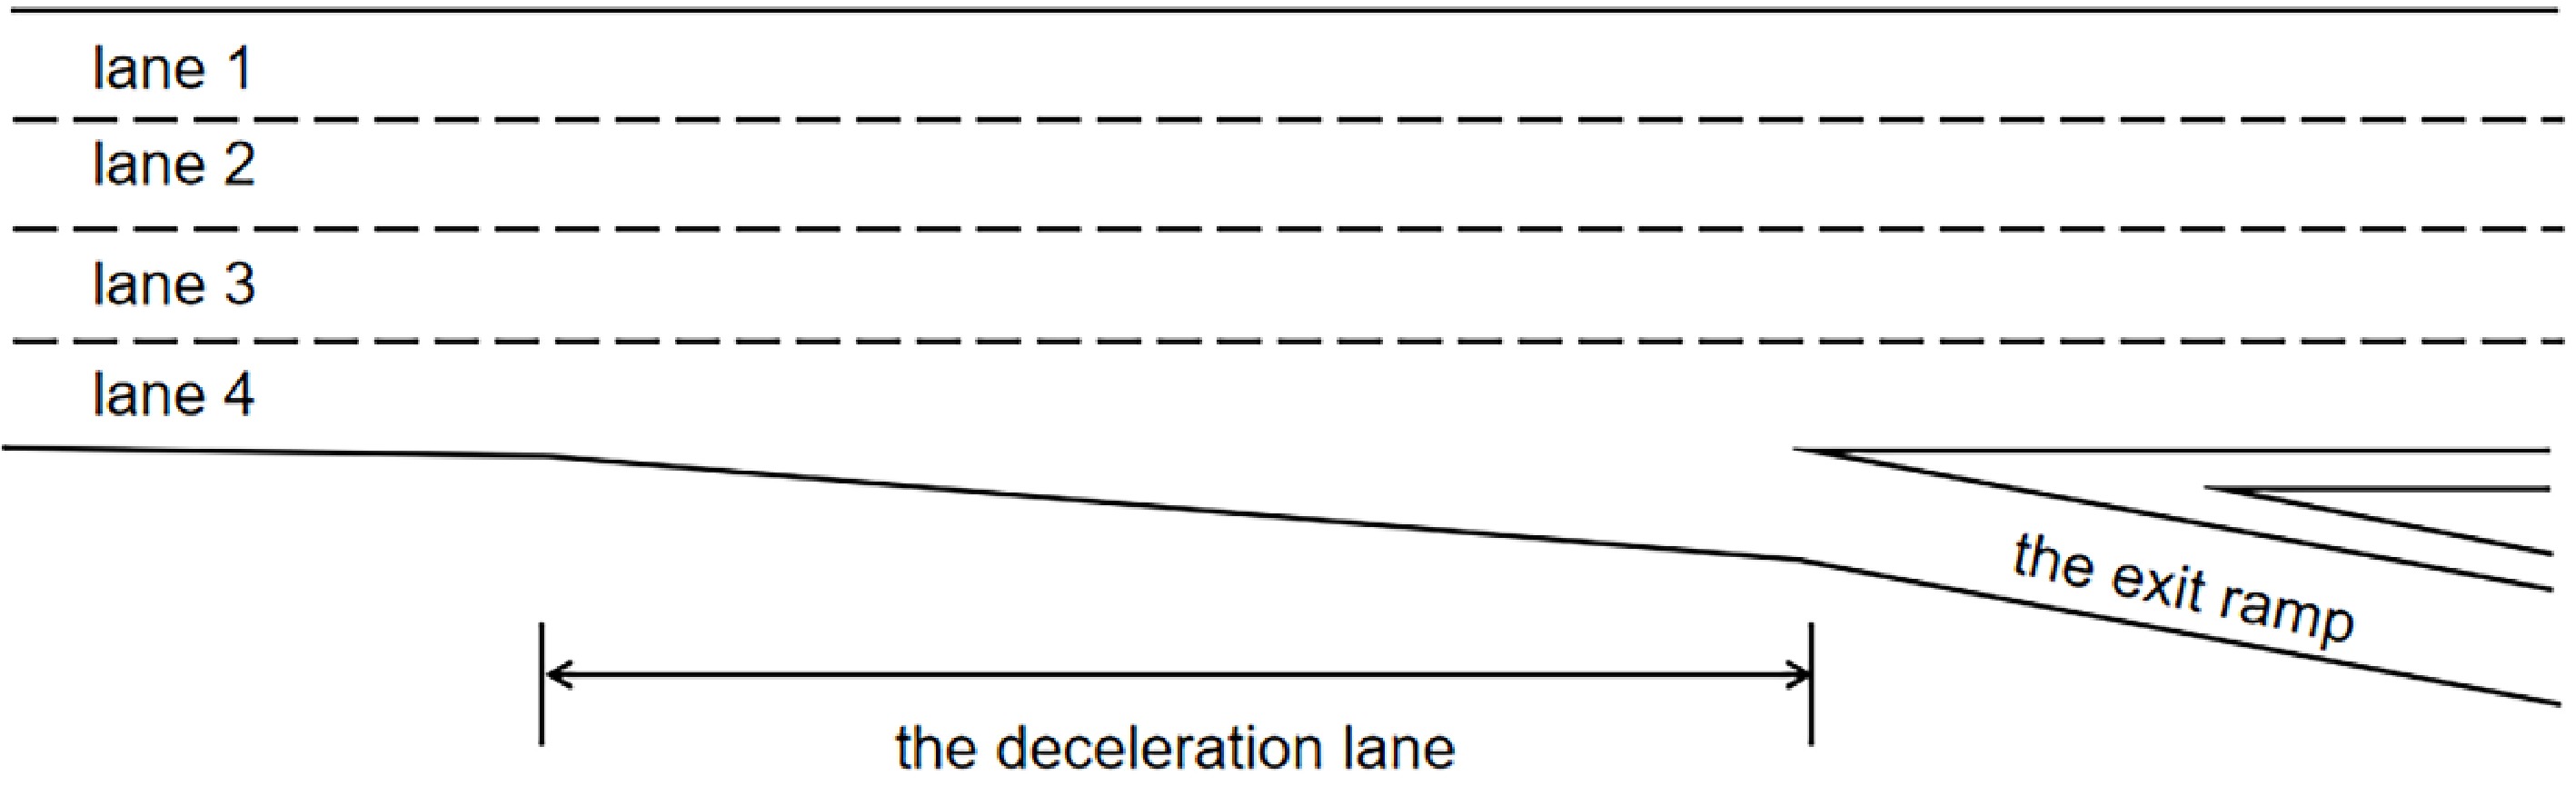
Figure 2.
Schematic diagram of the diversion area.
An open boundary condition is applied in the simulation, meaning that when the first vehicle exits the right boundary, the next vehicle assumes the role of the new leading vehicle. The simulation duration is 6,000 time steps, with each step equivalent to 1 s. To exclude transient effects, data from the last 2,000 steps—including vehicle position, speed, and flow—are utilized for parameter calculation. In this paper, the random deceleration probabilities are defined as 0.2 for cars and 0.1 for trucks under free-flow conditions. Furthermore, to reduce the influence of randomness, the average of five simulation runs is adopted as the final result.
This paper selects average speed as the efficiency index, as it sensitively reflects truck impacts on traffic flow, particularly under high traffic volume, mixed vehicle types, and a significant number of trucks. Delay time is another efficiency metric derived from simulated detector data. Specifically, the delay is defined as the ratio of the vehicle's travel time loss divided by the time it would take to pass the diverging area at the maximum desired speed. The travel time loss is the difference between the actual travel time and the ideal travel time through the diverging area. In Eq (17), L represents the delay time, D denotes the travel time loss, tideal is the ideal travel time and tactual is the actual travel time.
$ \left\{ \begin{gathered} {\text{L}} = \dfrac{{\text{D}}}{{{t_{{\text{ideal}}}}}} \\ {\text{D}} = {t_{{\text{actual}}}} - {t_{{\text{ideal}}}} \\ {t_{{\text{ideal}}}} = \dfrac{s}{{{v_{{\text{max}}}}}} \\ \end{gathered} \right. $ (17) For safety assessment, traffic conflict techniques are used due to their ability to comprehensively assess near-miss events and facilitate rapid safety improvements[21,22]. Traffic conflict analysis based on Time-to-Collision (TTC) helps accurately identify potential risks in diverging areas. Specifically, the time difference between vehicles arriving in the diverging conflict area is calculated. A value below 3.8 s is recorded as a conflict[23]. The specific model parameter values are provided in the Table 1.
Table 1. Model parameters.
Name Value Simulation length 1,000 m Maximum speed of the car 120 km/h Maximum speed for trucks 80 km/h Physical length of the car 7.5 m Physical length of the truck 15 m Regular acceleration of the car 2.5 m/s Regular acceleration of the truck 1.5 m/s Driver reaction time 0.8 s Probability of slowing down of the car-free driving 0.2 Probability of slowing down of the truck free driving 0.1 Probability of free lane-changing behavior 0.3 Probability of mandatory lane-changing behavior 1 Beginning of diverging area 500 m Regular deceleration of the car 4 m/s Regular deceleration of the truck 2.5 m/s -
To verify whether the cellular automata model of the expressway diverging area is consistent with the actual traffic flow operation, this paper uses two indexes: vehicle lane-changing times and hourly traffic volume for evaluation.
Verification of vehicle lane-changing times
-
This study examines free and mandatory lane-changing behaviors in expressway diverging areas. Vehicle trajectories are tracked using manual sampling and counting methods to quantify the frequency of mandatory and free lane-changing events. The effectiveness of the proposed cellular automata model is then evaluated by comparing these statistical results with simulation outcomes. The results show that the simulated lane-changing times are slightly higher than the actual statistical situation because the factors considered in the simulation process are more ideal than the actual situation, and the lane-changing behavior in real life often considers more complex factors, such as weather and driver's driving proficiency.
It can be seen from the table below that the accuracy rate of free lane-changing times is 81.72% and that of mandatory lane-changing times is as high as 92.99%, so the model can better reflect the lane-changing behavior of vehicles in the diverging area.
Verification of hourly traffic volume
-
Due to lane functionality, lane restrictions, and the distinct driving purposes of vehicles in the diverging area, traffic volumes between the upstream and downstream sections exhibit significant differences. In this study, the actual vehicle arrival rate is set upstream of the diverging area, and the hourly traffic volumes for both upstream and downstream lanes are derived through multiple simulations. By comparing the simulation results with the measured data, the average error rate of traffic flow rate is 2.20%, and the maximum error rate is 4.18%, so the model can effectively reflect the traffic volume level in the diverging area.
Referring to the lane-changing model without zoning, the STCA lane-changing model with zoning, and the multi-stage lane-changing decision model of weaving area constructed in related studies, the average lane-changing error rates are 33.34%, 97.75%, and 11.85%, and the average traffic flow error rates are 38.69%, 5.14% and 1.64%[24]. As shown in Tables 2 and 3, the simulation values of the improved cell model are significantly improved compared with the simulation values of the initial cell model. The average lane-changing error rates of the cellular automata model in the diverging area constructed in this paper are 9.01% and 2.20%. Thus, the proposed model is deemed to effectively capture the actual traffic dynamics in diverging areas.
Table 2. Simulation results of lane-changing times.
Lane type Lane-changing times Accuracy % Actual data Initial cell model simulation values Improved cell model simulation value Mandatory lane-changing behavior 1.353 1.657 1.415 95.62 Free lane-changing behavior 0.152 0.125 0.176 86.36 Table 3. Simulation results of hourly traffic volume.
Lane type Initial cell model simulation values
(veh/h)Improved cell model simulation value (veh/h) Actual data (veh/h) Error rate Flow rate of the on-ramp Lane 1 1,589 1,477 1,430 3.18 Lane 2 1,654 1,558 1,548 0.64% Lane 3 1,054 1,123 1,112 0.98 Lane 4 956 1,048 1,029 1.81% Exit ramp − − − Flow rate of the exit ramp Lane 1 1,291 1,402 1,380 1.57% Lane 2 1,398 1,377 1,335 3.05% Lane 3 1,116 1,032 1,077 4.18% Lane 4 832 1,008 994 1.39% Exit ramp 387 439 426 2.96% -
Compared with the merging area, the proportion of the diverging vehicle in the diverging area is also an important factor affecting the formation of the truck barrier effect. Therefore, this paper explores the impact of trucks on traffic operation efficiency by simulating three aspects: different main road flow, different proportions of the truck, and different diversion proportions.
Traffic volume
-
For traffic volume settings, this study references the design service levels for expressways with a design speed of 120 km/h, as outlined in the Technical Standard for Highway Engineering. To minimize the number of simulations, traffic volumes of 2,000, 3,500, and 4,000 veh/h are selected to represent low, medium, and high traffic levels, respectively (Figs 3−5). The influence of trucks under these three traffic volumes is then systematically analyzed.
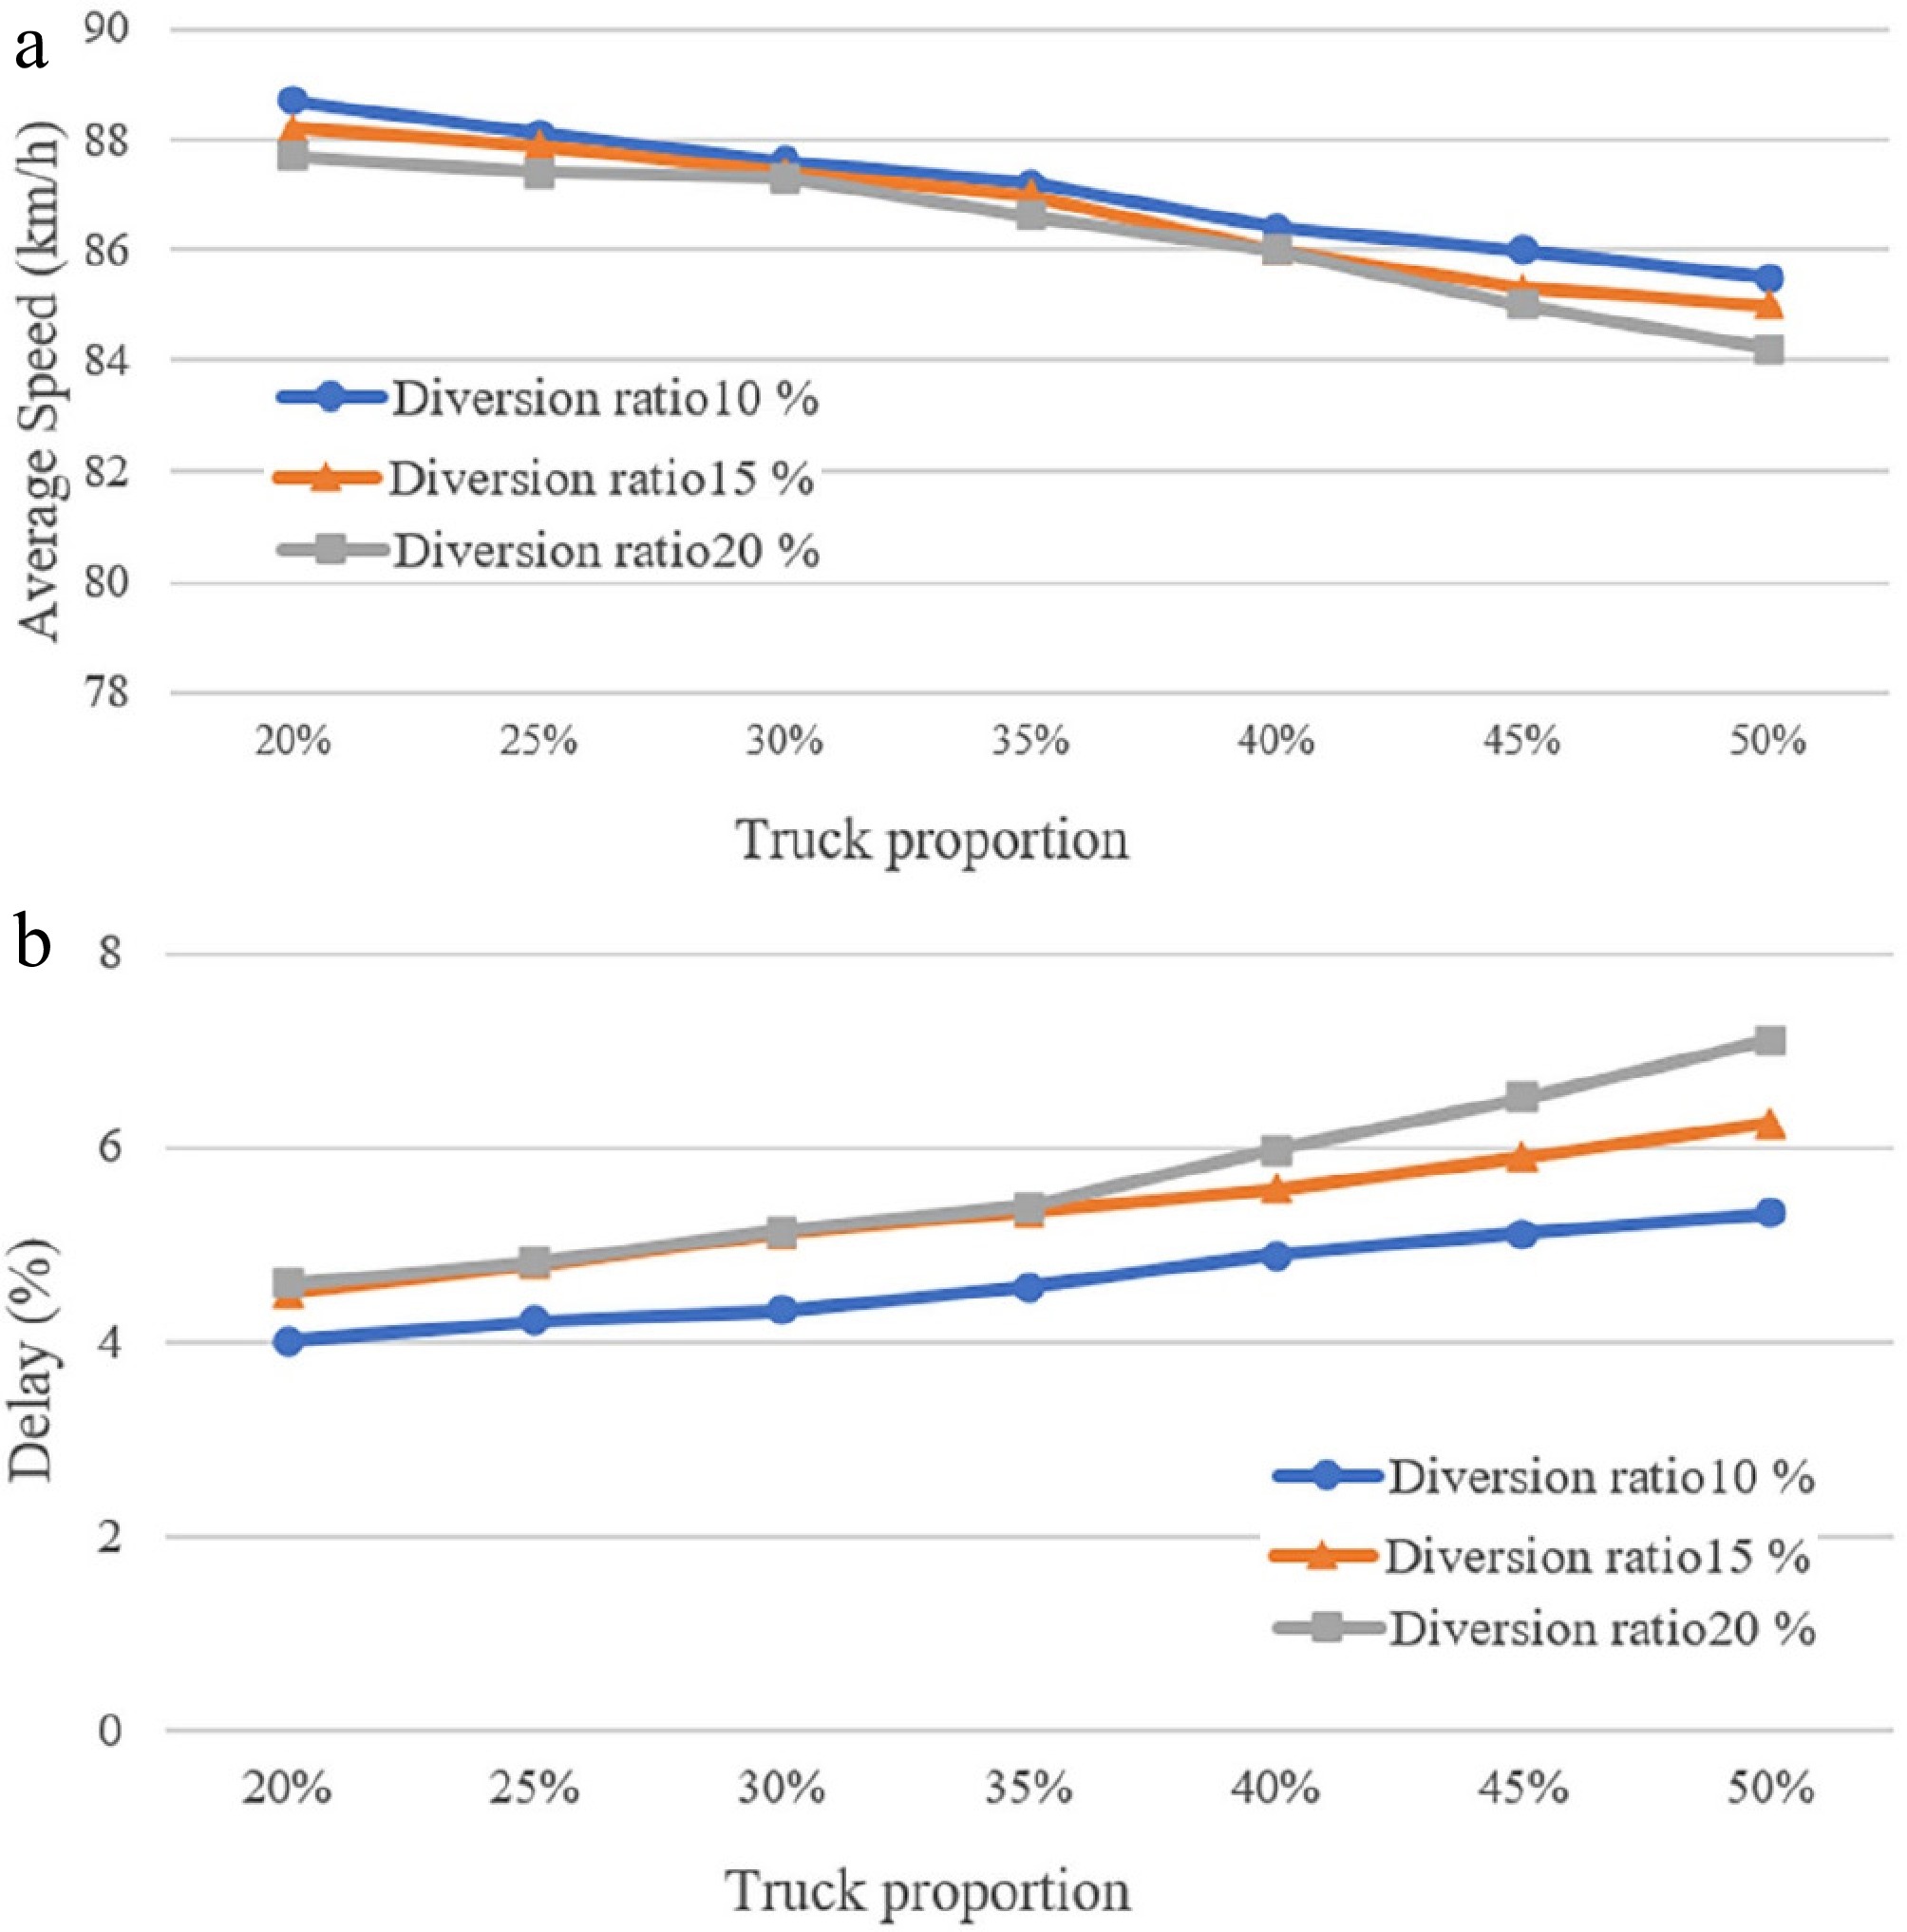
Figure 3.
Traffic operating conditions of low traffic volume. (a) Graph of speed and truck proportion, (b) Graph of delay and truck proportion.
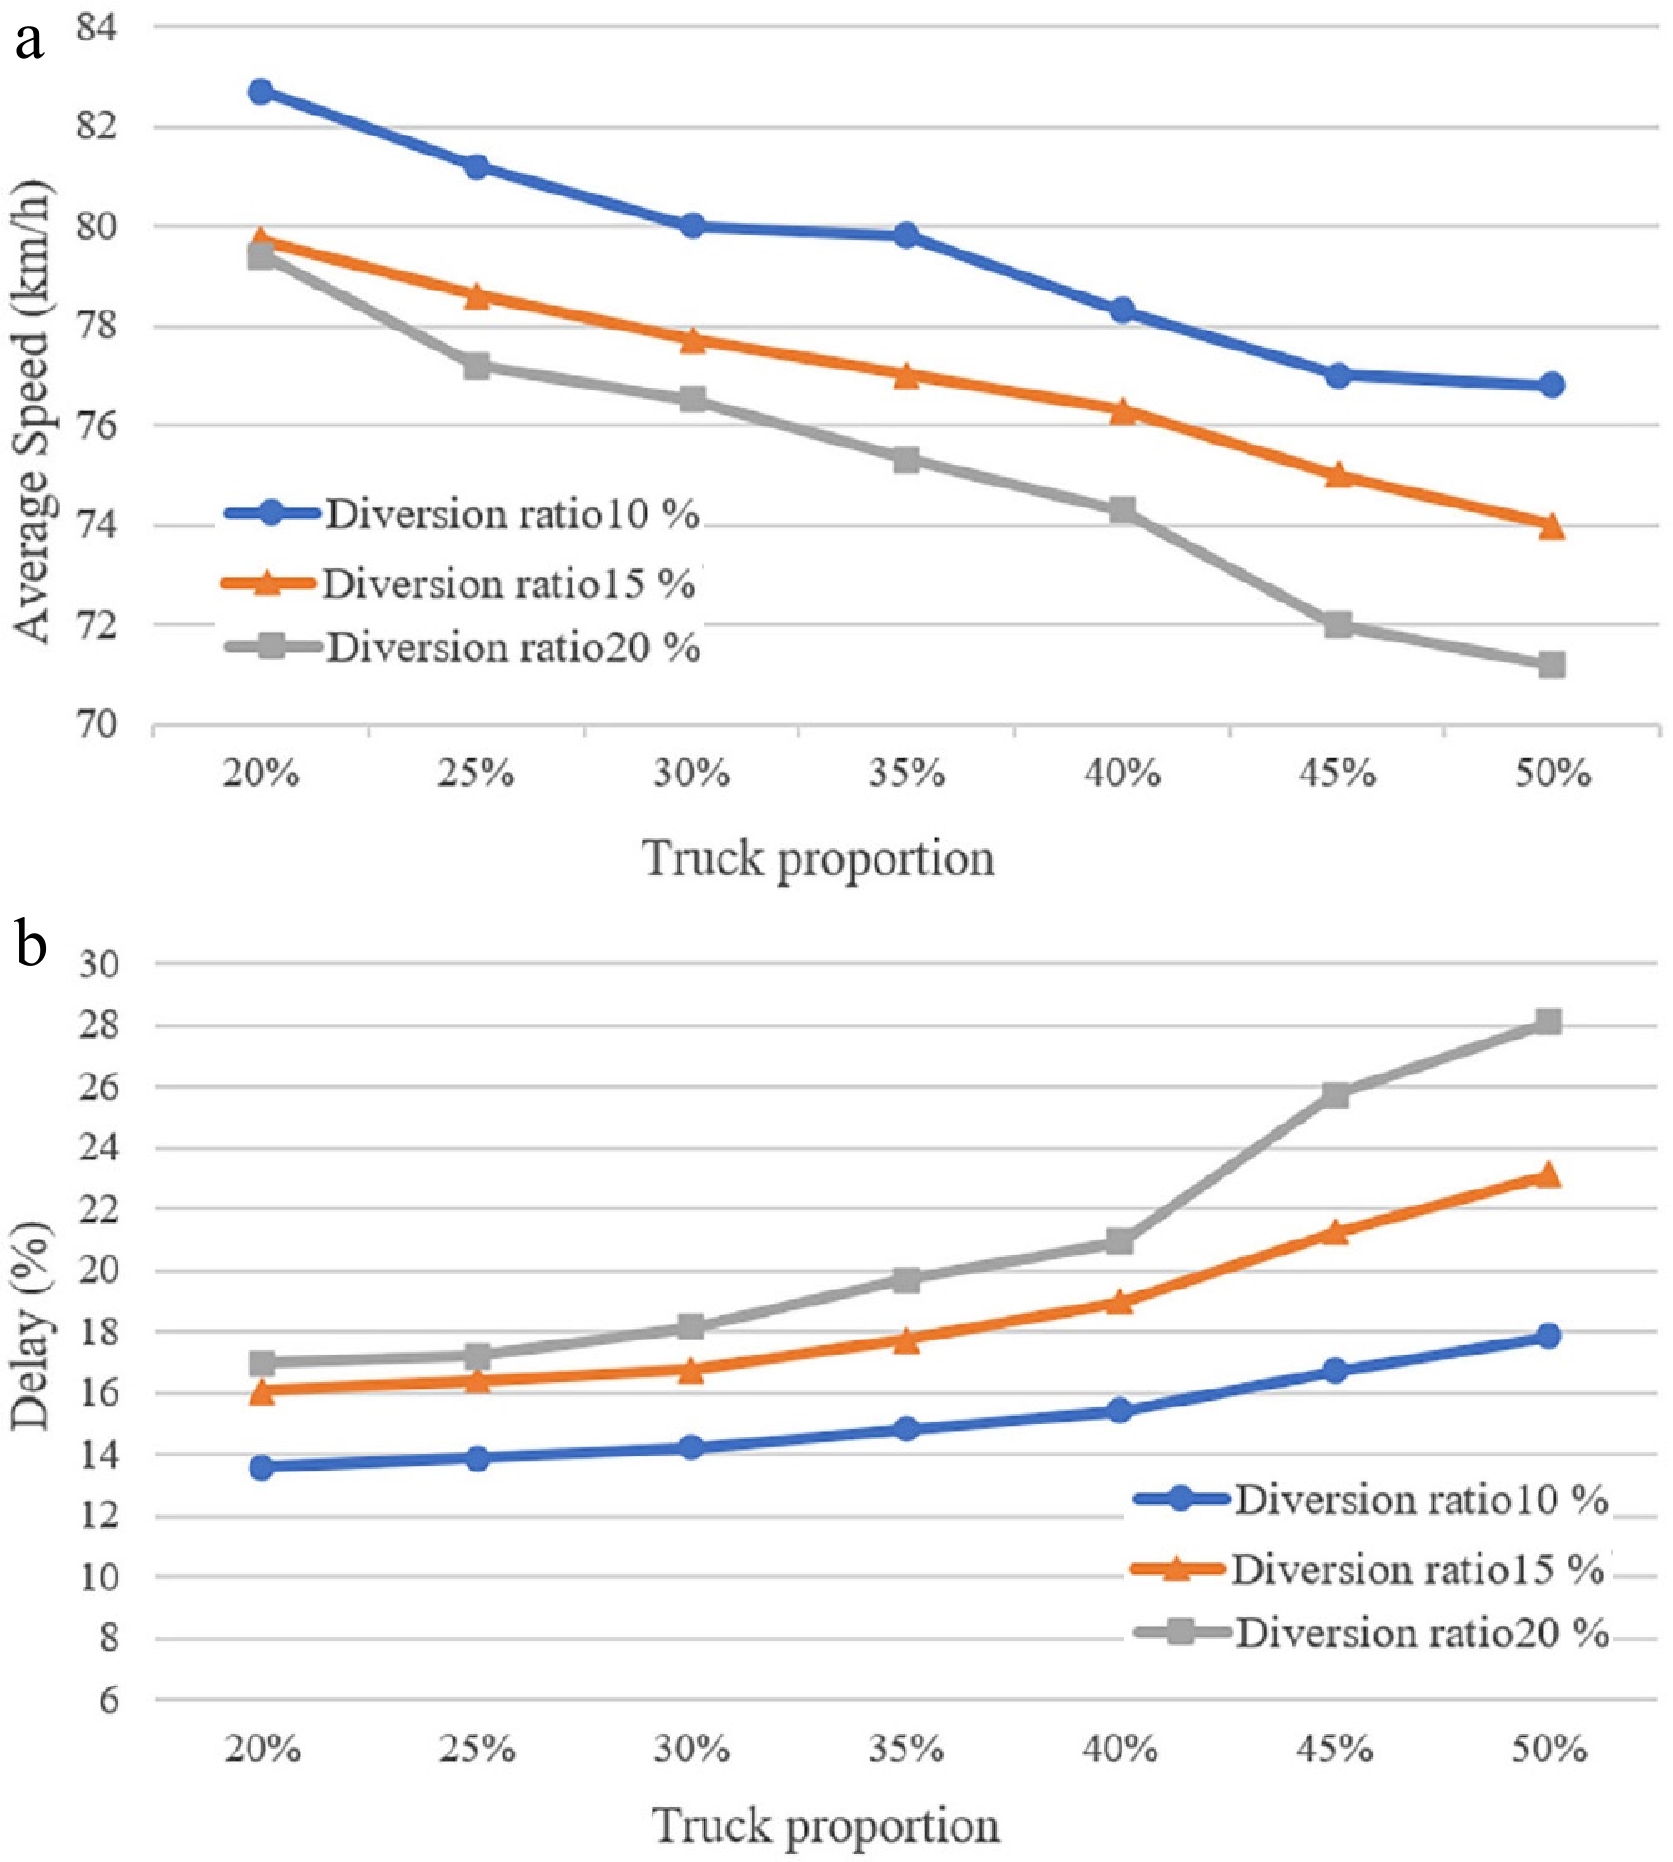
Figure 4.
Traffic operating conditions of medium traffic volume. (a) Graph of speed and truck proportion, (b) Graph of delay and truck proportion.
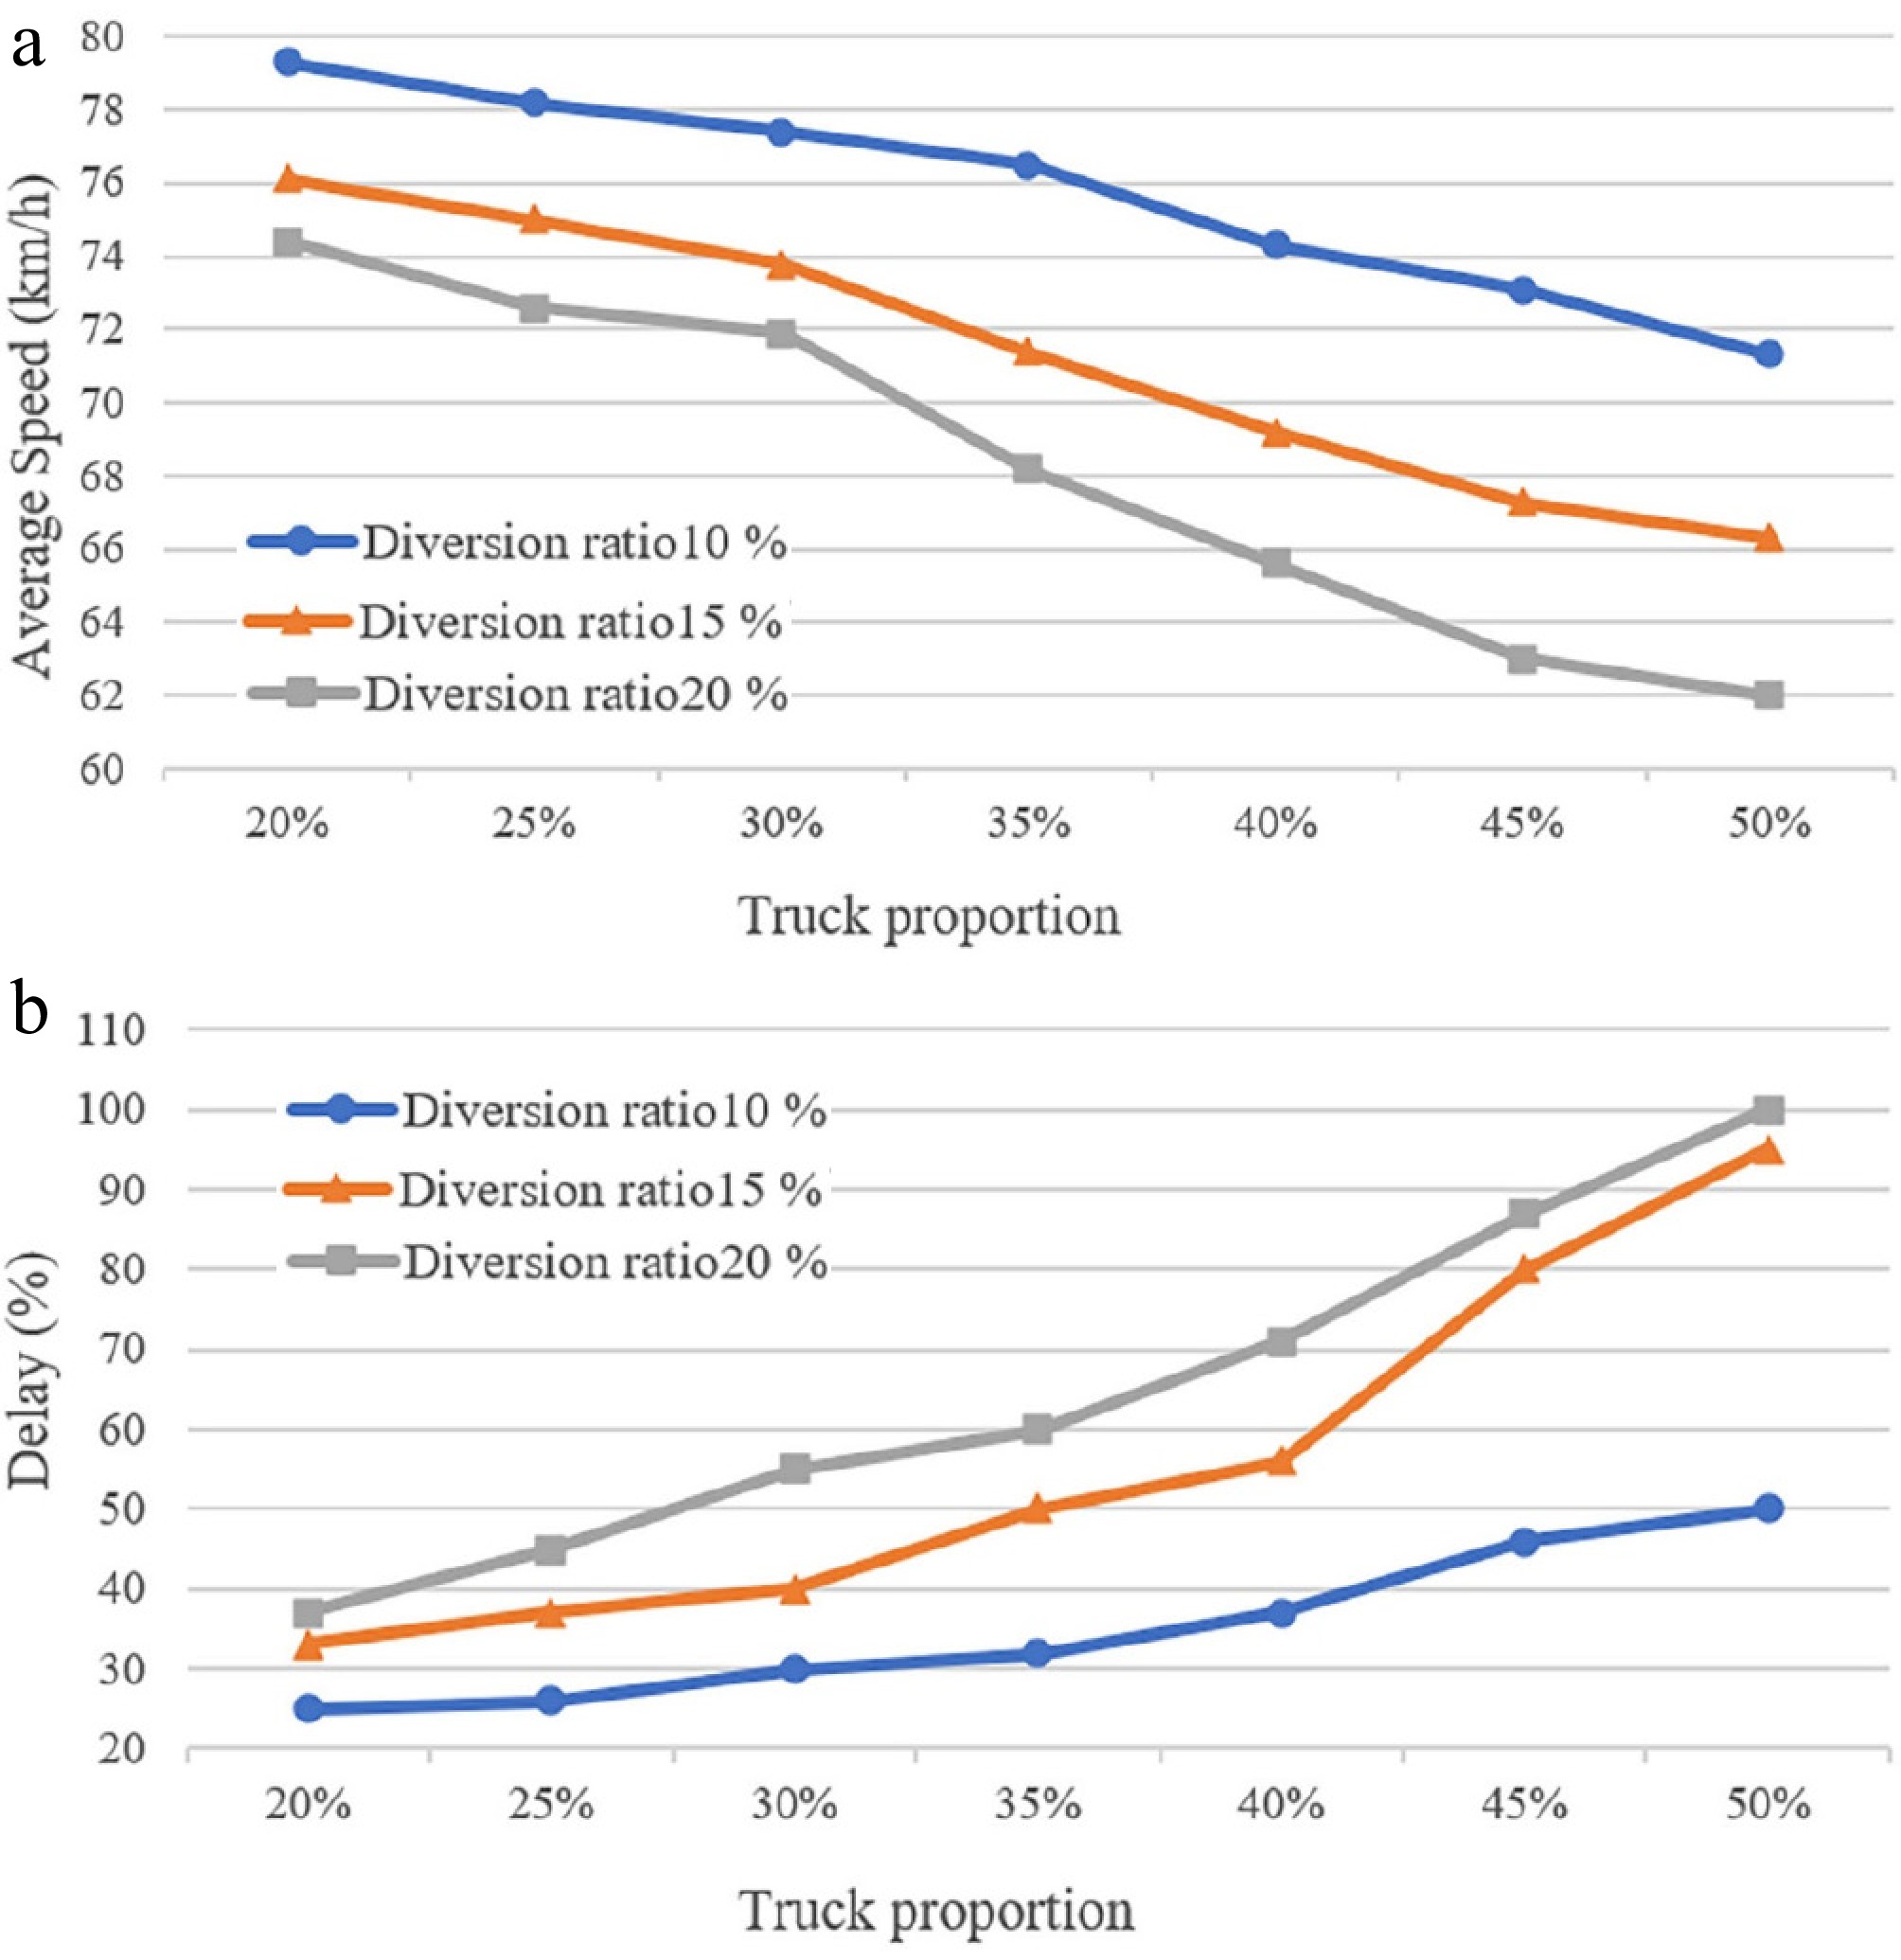
Figure 5.
Traffic operating conditions of high traffic volume. (a) Graph of speed and truck proportion, (b) Graph of delay and truck proportion.
Proportion of trucks
-
For the proportion of trucks in the simulation, referring to the actual investigation, this paper selects the range of the proportion of trucks on the main section to be 20%-50%, and the step length is 5%.
Vehicle diversion ratio
-
Cars are mainly in the inner lane due to lane management restrictions, with trucks restricted to the outer lane. When vehicles in the inner lane need to diverge, they must find a suitable gap for lane changes. Under high mainline traffic volumes and continuous truck platoons, inner-lane diverging vehicles often decelerate to find gaps, disrupting upstream traffic flow. Therefore, the diverging ratio of inner-lane vehicles and the traffic volume of trucks are critical factors in the simulation. Keep the truck diverging ratio at 10%, the car diverging ratio at 10%−20%, and the step size at 5%.
The simulation results indicate that the impact of trucks on traffic flow efficiency becomes more pronounced as traffic volume increases. Furthermore, a higher diverging ratio amplifies the effect of trucks on traffic flow efficiency across different scenarios.
At low traffic volumes, variations in the diverging ratio and truck ratio have negligible effects on traffic flow delay. Increasing the truck proportion from 20% to 50% reduces the average speed by approximately 5 km/h and increases delay by about 3%. Likewise, raising the diverging ratio from 10% to 20% results in minimal differences among the three curves, which nearly coincide at lower truck proportions. This phenomenon occurs because, under low traffic volumes and densities, vehicles operate in a free-flow state with limited interactions. Even with a high truck proportion, their influence on surrounding vehicles can be avoided through overtaking and lane changes. Furthermore, as the diverging ratio increases, inner-lane vehicles can flexibly select their timing to change lanes and diverge from the mainline.
Under medium traffic volumes, as depicted in the figure, the average speed of traffic flow decreases by approximately 8 km/h, and the delay increases by about 14% compared to low traffic volumes. At this stage, the adverse effects of trucks on surrounding vehicles can no longer be entirely offset by overtaking and lane changes due to increased traffic volume and density. When the truck proportion increases from 20% to 50%, the average speed declines by about 10 km/h and the delay rises by approximately 14%. Likewise, when the diverging ratio increases from 10% to 20%, the slope of the curve exhibits a notable increase. At this point, vehicles are no longer operating in a free-flow state, and their interactions magnify the impact of trucks. Vehicles struggle to maintain desired speeds, resulting in frequent acceleration and deceleration and a gradual reduction in speed. Nonetheless, the overall traffic flow remains stable. Vehicles requiring diversion must identify appropriate gaps to change lanes and exit the mainline.
At high traffic volumes, average speed and delay curves differ greatly from those at low and medium volumes. Here, traffic volume and density are extremely high, often with traffic oscillations and pronounced vehicle interactions. In the upstream section of the diverging area, the heavy traffic makes it hard for many vehicles to find suitable gaps to change lanes to the outer lane. This lane-changing and diverging behavior gradually moves downstream toward the exit ramp. When the mainline truck proportion exceeds 0.4, and the diverging ratio surpasses 0.15, mandatory lane-changing in the diverging area becomes very obvious, with average speed and delay curves rising sharply. This shows a truck barrier has formed in the diverging area. Large truck platoons in the outer lane stop inner-lane vehicles from finding good conditions to change lanes, severely hindering their diversion. At this point, trucks greatly impact traffic operations in the diverging area.
Micro-level impact of trucks
-
The micro-level impact of trucks during vehicle diverging is mainly shown in the willingness of vehicles with diverging intentions to leave the main road when they find themselves behind a truck and choose the right time to enter the exit ramp. The greater the impact of the truck, the lower the willingness of diverging vehicles to leave the main road. In the simulation, the probability of vehicles exiting the ramp (Pr) is adjusted to simulate different levels of diverging demand. Under natural driving conditions, the length of trucks in the outer lane and the presence of multiple consecutive trucks can influence the diverging behavior of vehicles in the inner lane towards the exit ramp. This paper explores the micro-level impact of trucks on traffic operations through simulation analysis, focusing on two factors: truck body length and the number of vehicles in a truck platoon.
Length of the truck body
-
From the perspective of truck performance itself, compared to smaller vehicles, trucks have longer bodies, which occupy more road space near exit ramps, thereby reducing the available lane-changing space for vehicles attempting to exit. Therefore, the length of trucks on the main road may also be a factor influencing vehicle diverging and the formation of a 'truck barrier effect' at exit ramps. In this simulation, since changes in truck length alter the available space on the main road, typical truck lengths of 10, 15, 20, and 25 m were set, referencing the existing truck lengths in China. As shown in the Fig. 6, low, medium, and high main road traffic volumes were also configured. The impact of main road truck length on vehicle diverging was observed based on changes in exit ramp traffic volume.
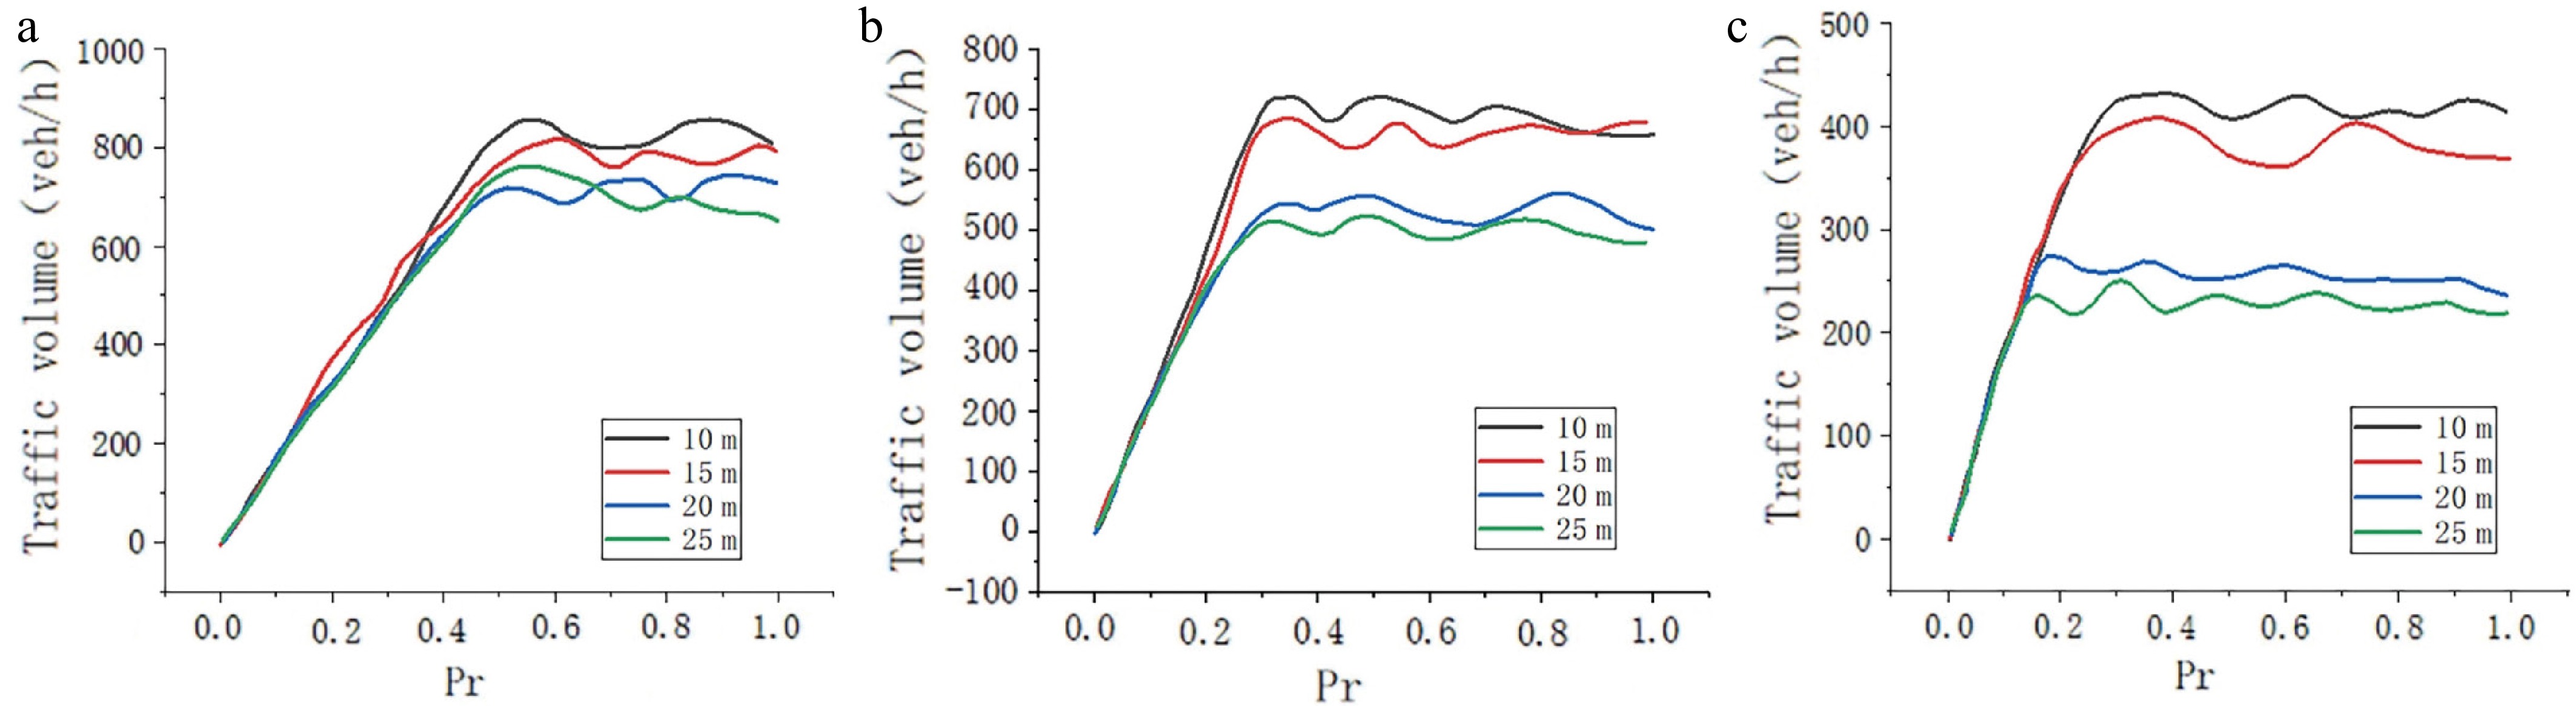
Figure 6.
Exit ramp flow vs truck length. Traffic volume: (a) low, (b) medium, and (c) high.
As shown in the Fig. 6, under low traffic volume, different truck lengths have little impact on vehicle diverging, as the limited traffic allows sufficient road space for vehicles to diverge easily. However, under moderate traffic volume, exit ramp traffic volume shows clear stratification due to truck length variations, a phenomenon that becomes more pronounced under high traffic volume. It is evident that when truck length reaches 20 m, and traffic volume is moderate, the influence of trucks becomes more noticeable, indicating the formation of a truck barrier. Furthermore, the simulation results reveal that as the length of large vehicles on the main road increases, the probability of vehicles exiting the ramp decreases when the truck barrier effect is present.
The number of vehicles in a truck platoon
-
Considering that the impact of trucks in the outer lane primarily manifests in the form of platoons affecting vehicles attempting to change lanes and exit the ramp, this section selects the number of vehicles constituting a truck platoon to quantify the influence of trucks. In the simulation, truck platoons consisting of one to four large vehicles are configured. During the simulation analysis, the truck platoons will circulate in the outer lane of the main road, and changes in exit ramp traffic volume will be observed under different vehicle combinations (Fig. 7).
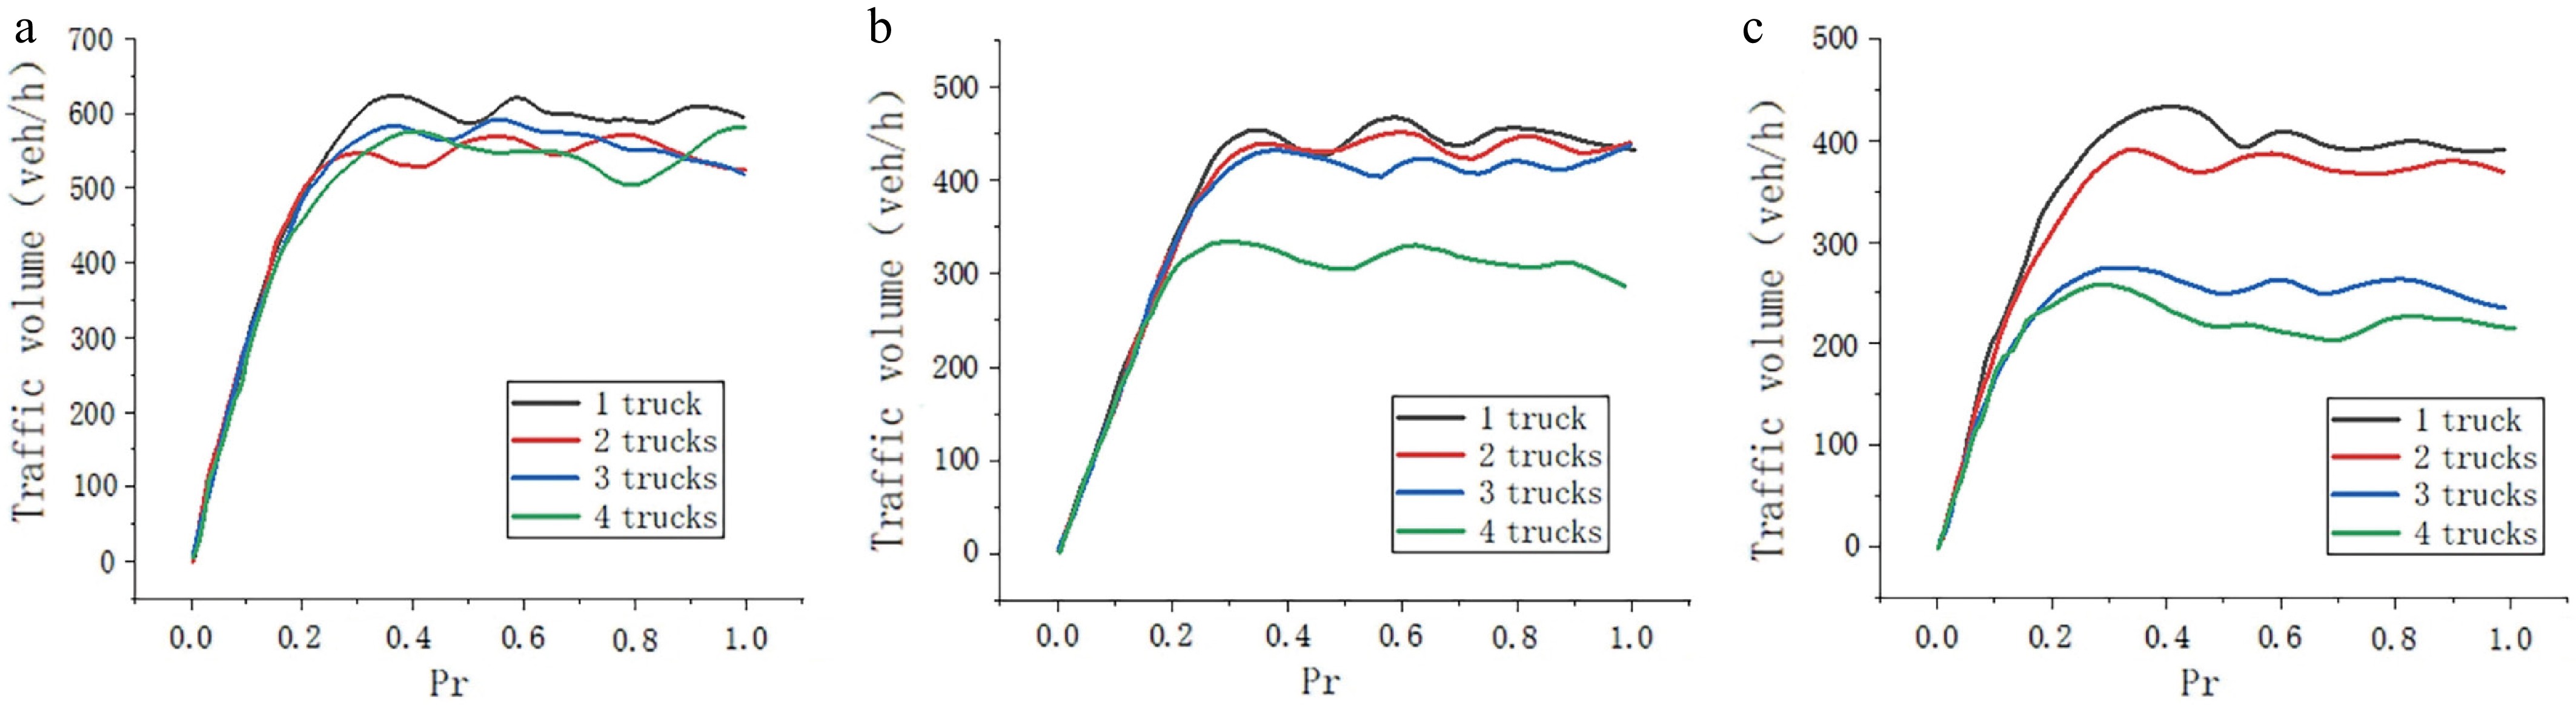
Figure 7.
Exit ramp flow vs truck platoon size. Traffic volume: (a) low, (b) medium, and (c) high.
The simulation shows that under moderate traffic, exit ramp volume drops significantly when four trucks are in a platoon. Under heavy traffic, with three trucks in a platoon, exit ramp volume decreases greatly compared to moderate traffic. This means as main road traffic rises, fewer trucks are needed to form a truck barrier. Thus, a truck barrier forms under heavy traffic when three trucks travel in a platoon.
Safety impact analysis
-
Based on the above macro and micro analyses of the impact of trucks, this paper conducts a safety impact analysis of trucks in the diverging area under two scenarios: whether a truck barrier is formed or not.
Table 4. Evaluation of traffic safety.
Traffic volume (veh/h) The number of traffic conflicts No truck barrier (times) With truck barrier (times) Increase ratio Low traffic volume 14.1 17.4 23.4% Medium traffic volume 26.3 33.1 25.8% High traffic volume 40.2 53.2 32.3% From the simulation results in Table 4, it can be seen that the number of traffic conflicts has increased by 23.4%, 25.8%, and 32.3%, respectively. The formation of truck barriers reduces the available gaps for vehicles to exit, making it more difficult for vehicles to diverge onto the ramp. Consequently, the number of traffic conflicts increases, significantly impacting the safety of road traffic flow.
-
In this paper, the improved cellular automata model is constructed, which considers the motion characteristics, position characteristics, and the influence of the vehicle in more detail. MATLAB is used to simulate the traffic operation and the influence of the truck in the expressway diverging area, and the vehicle lane-changing times and the hourly traffic volume are selected to verify the model, which shows that the model can well reflect the traffic conditions in the diverging area. In the subsequent analysis, this paper selects three macro-level factors—main road traffic volume, truck proportion, and diverging ratio—along with two micro-level factors—truck length and the number of vehicles in a truck platoon—to further investigate the impact of trucks on the efficiency and safety of the diverging area. The analysis reveals that, at the macro level, the influence of trucks is most significant when the main road traffic volume is high, the truck proportion exceeds 40%, and the diverging ratio surpasses 15%. At the micro level, the impact is most pronounced when the truck length exceeds 20 m, and the number of vehicles in a truck platoon exceeds three. These conditions lead to the formation of a truck barrier, causing decreased traffic flow speed, increased delay, and more traffic conflicts, severely affecting road efficiency and safety. Additionally, the study offers a theoretical basis for formulating truck management and control strategies in freeway-diverging areas.
-
The authors confirm their contribution to the paper as follows: study conception and design: He YL, Liu C; analysis and interpretation of results: Liu C, Liu FH, Chen YF; draft manuscript preparation: Liu C, Liu FH. All authors reviewed the results and approved the final version of the manuscript.
-
Data sharing is not applicable to this article as no datasets were generated or analyzed during the current study.
-
This research received no external funding.
-
The authors declare that they have no conflict of interest.
- Copyright: © 2026 by the author(s). Published by Maximum Academic Press, Fayetteville, GA. This article is an open access article distributed under Creative Commons Attribution License (CC BY 4.0), visit https://creativecommons.org/licenses/by/4.0/.
-
About this article
Cite this article
Liu C, He YL, Liu FH, Chen YF. 2026. Impact of trucks on traffic flow in expressway diverging areas. Digital Transportation and Safety 5(1): 1−9 doi: 10.48130/dts-0025-0019 

Impact of trucks on traffic flow in expressway diverging areas
- Received: 16 September 2024
- Revised: 07 April 2025
- Accepted: 09 May 2025
- Published online: 31 March 2026
Abstract: To explore the impact of trucks in freeway diverging areas, this paper presents an enhanced cellular automaton model. The model refines vehicle acceleration, deceleration, and position update rules while integrating truck-specific factors to better analyze their effects on traffic safety and efficiency in diverging areas. At the macro level, this paper primarily considers three factors: main road traffic volume, diverging ratio, and truck proportion. At the micro level, it focuses on two factors: truck length and the number of vehicles in a truck platoon. Results show that, at the macro level, when the main road truck proportion exceeds 40%, and the diverging ratio surpasses 15%, and at the micro level, when truck length exceeds 20 m, and the number of vehicles in a truck platoon exceeds three, trucks significantly impact traffic operations of diverging areas, indicating the formation of truck barriers. Subsequently, this paper further examines the safety implications of truck barriers in freeway-diverging areas. The results demonstrate that the formation of truck barriers leads to a significant increase in traffic conflicts within diverging areas, posing substantial safety risks to normal traffic operations.
-
Key words:
- Influence /
- Trucks /
- Diverging area /
- Expressway