-
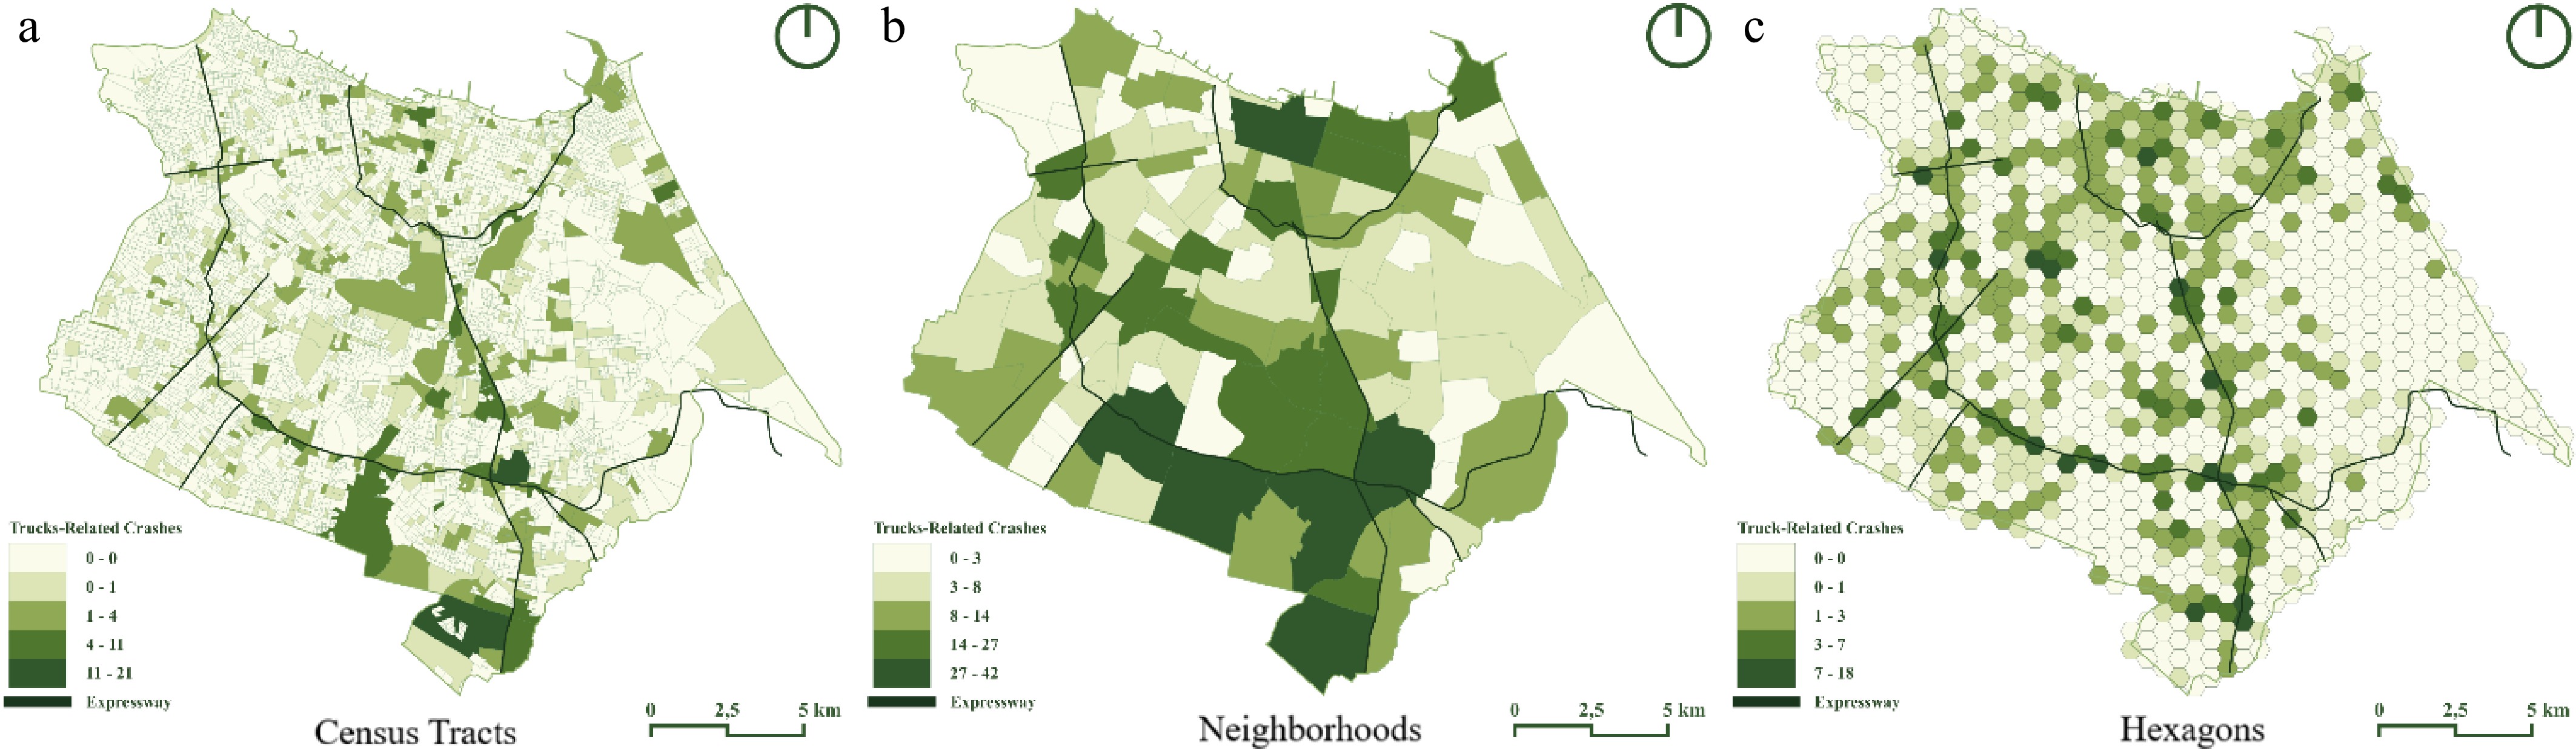
Figure 1.
The selected study area. Source: Authors' own elaboration based on study area boundary, road network, and crash data processed in GIS.
-
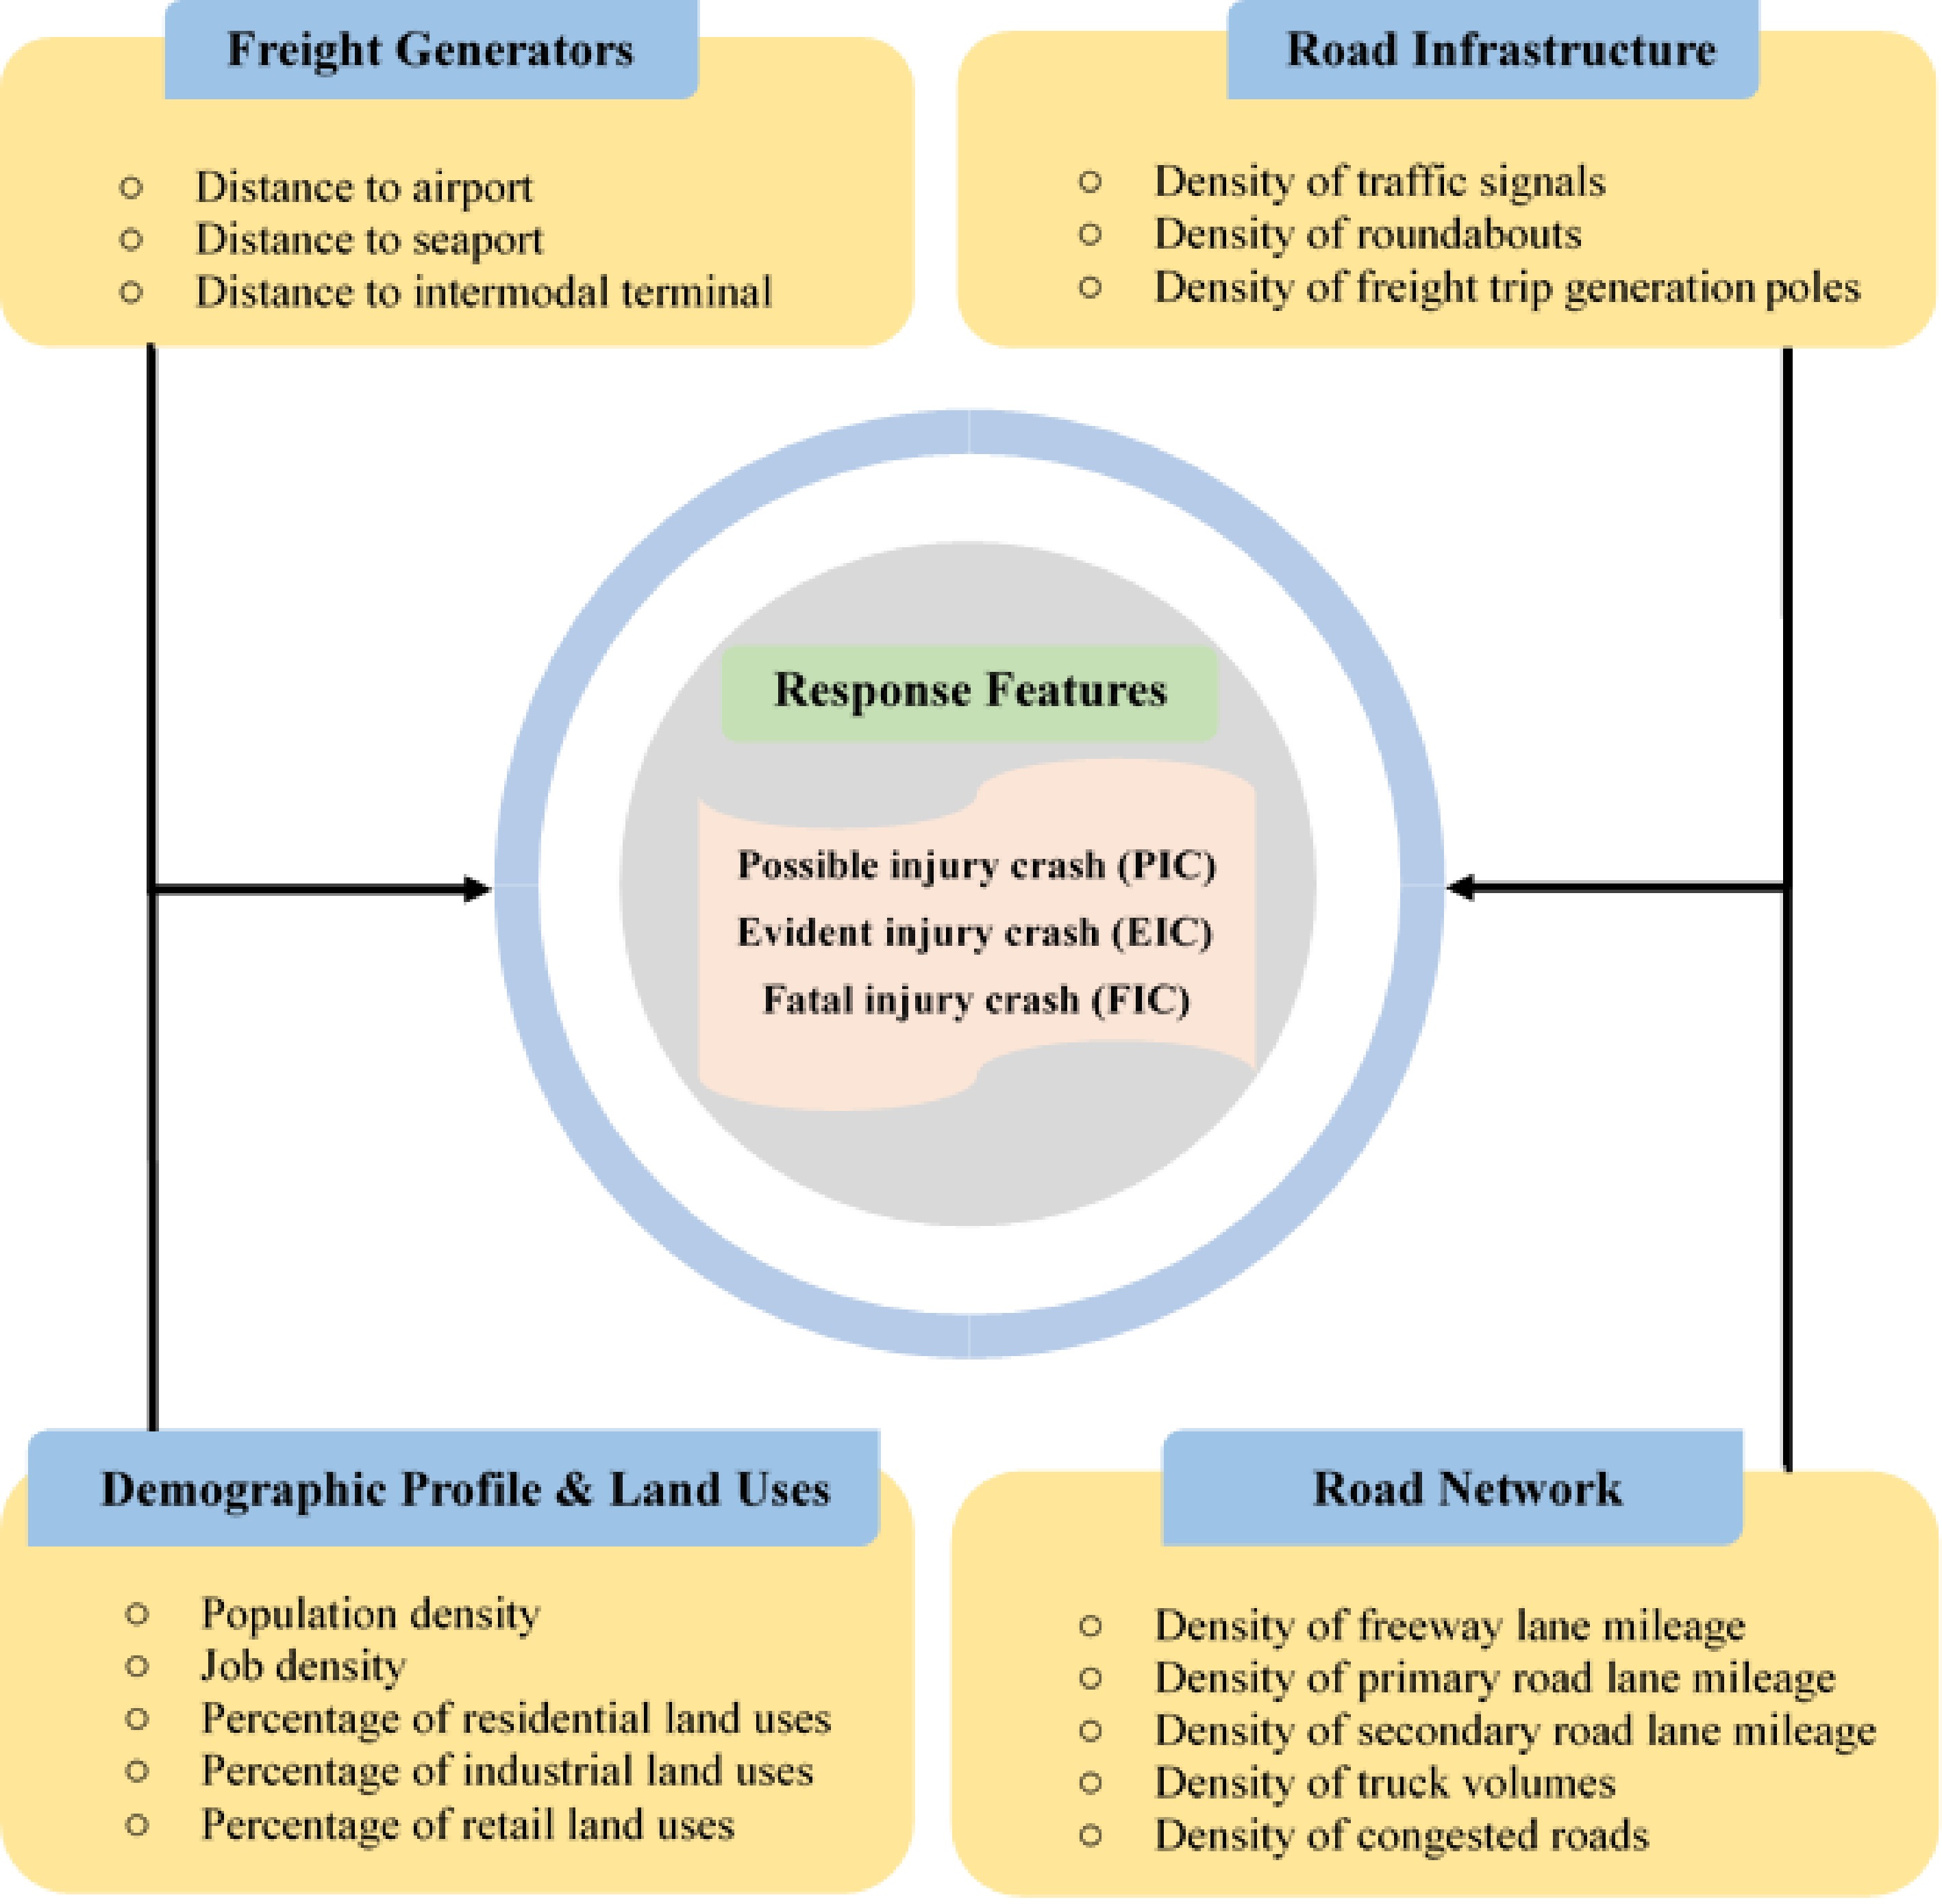
Figure 2.
Conceptual framework of the variables.
-
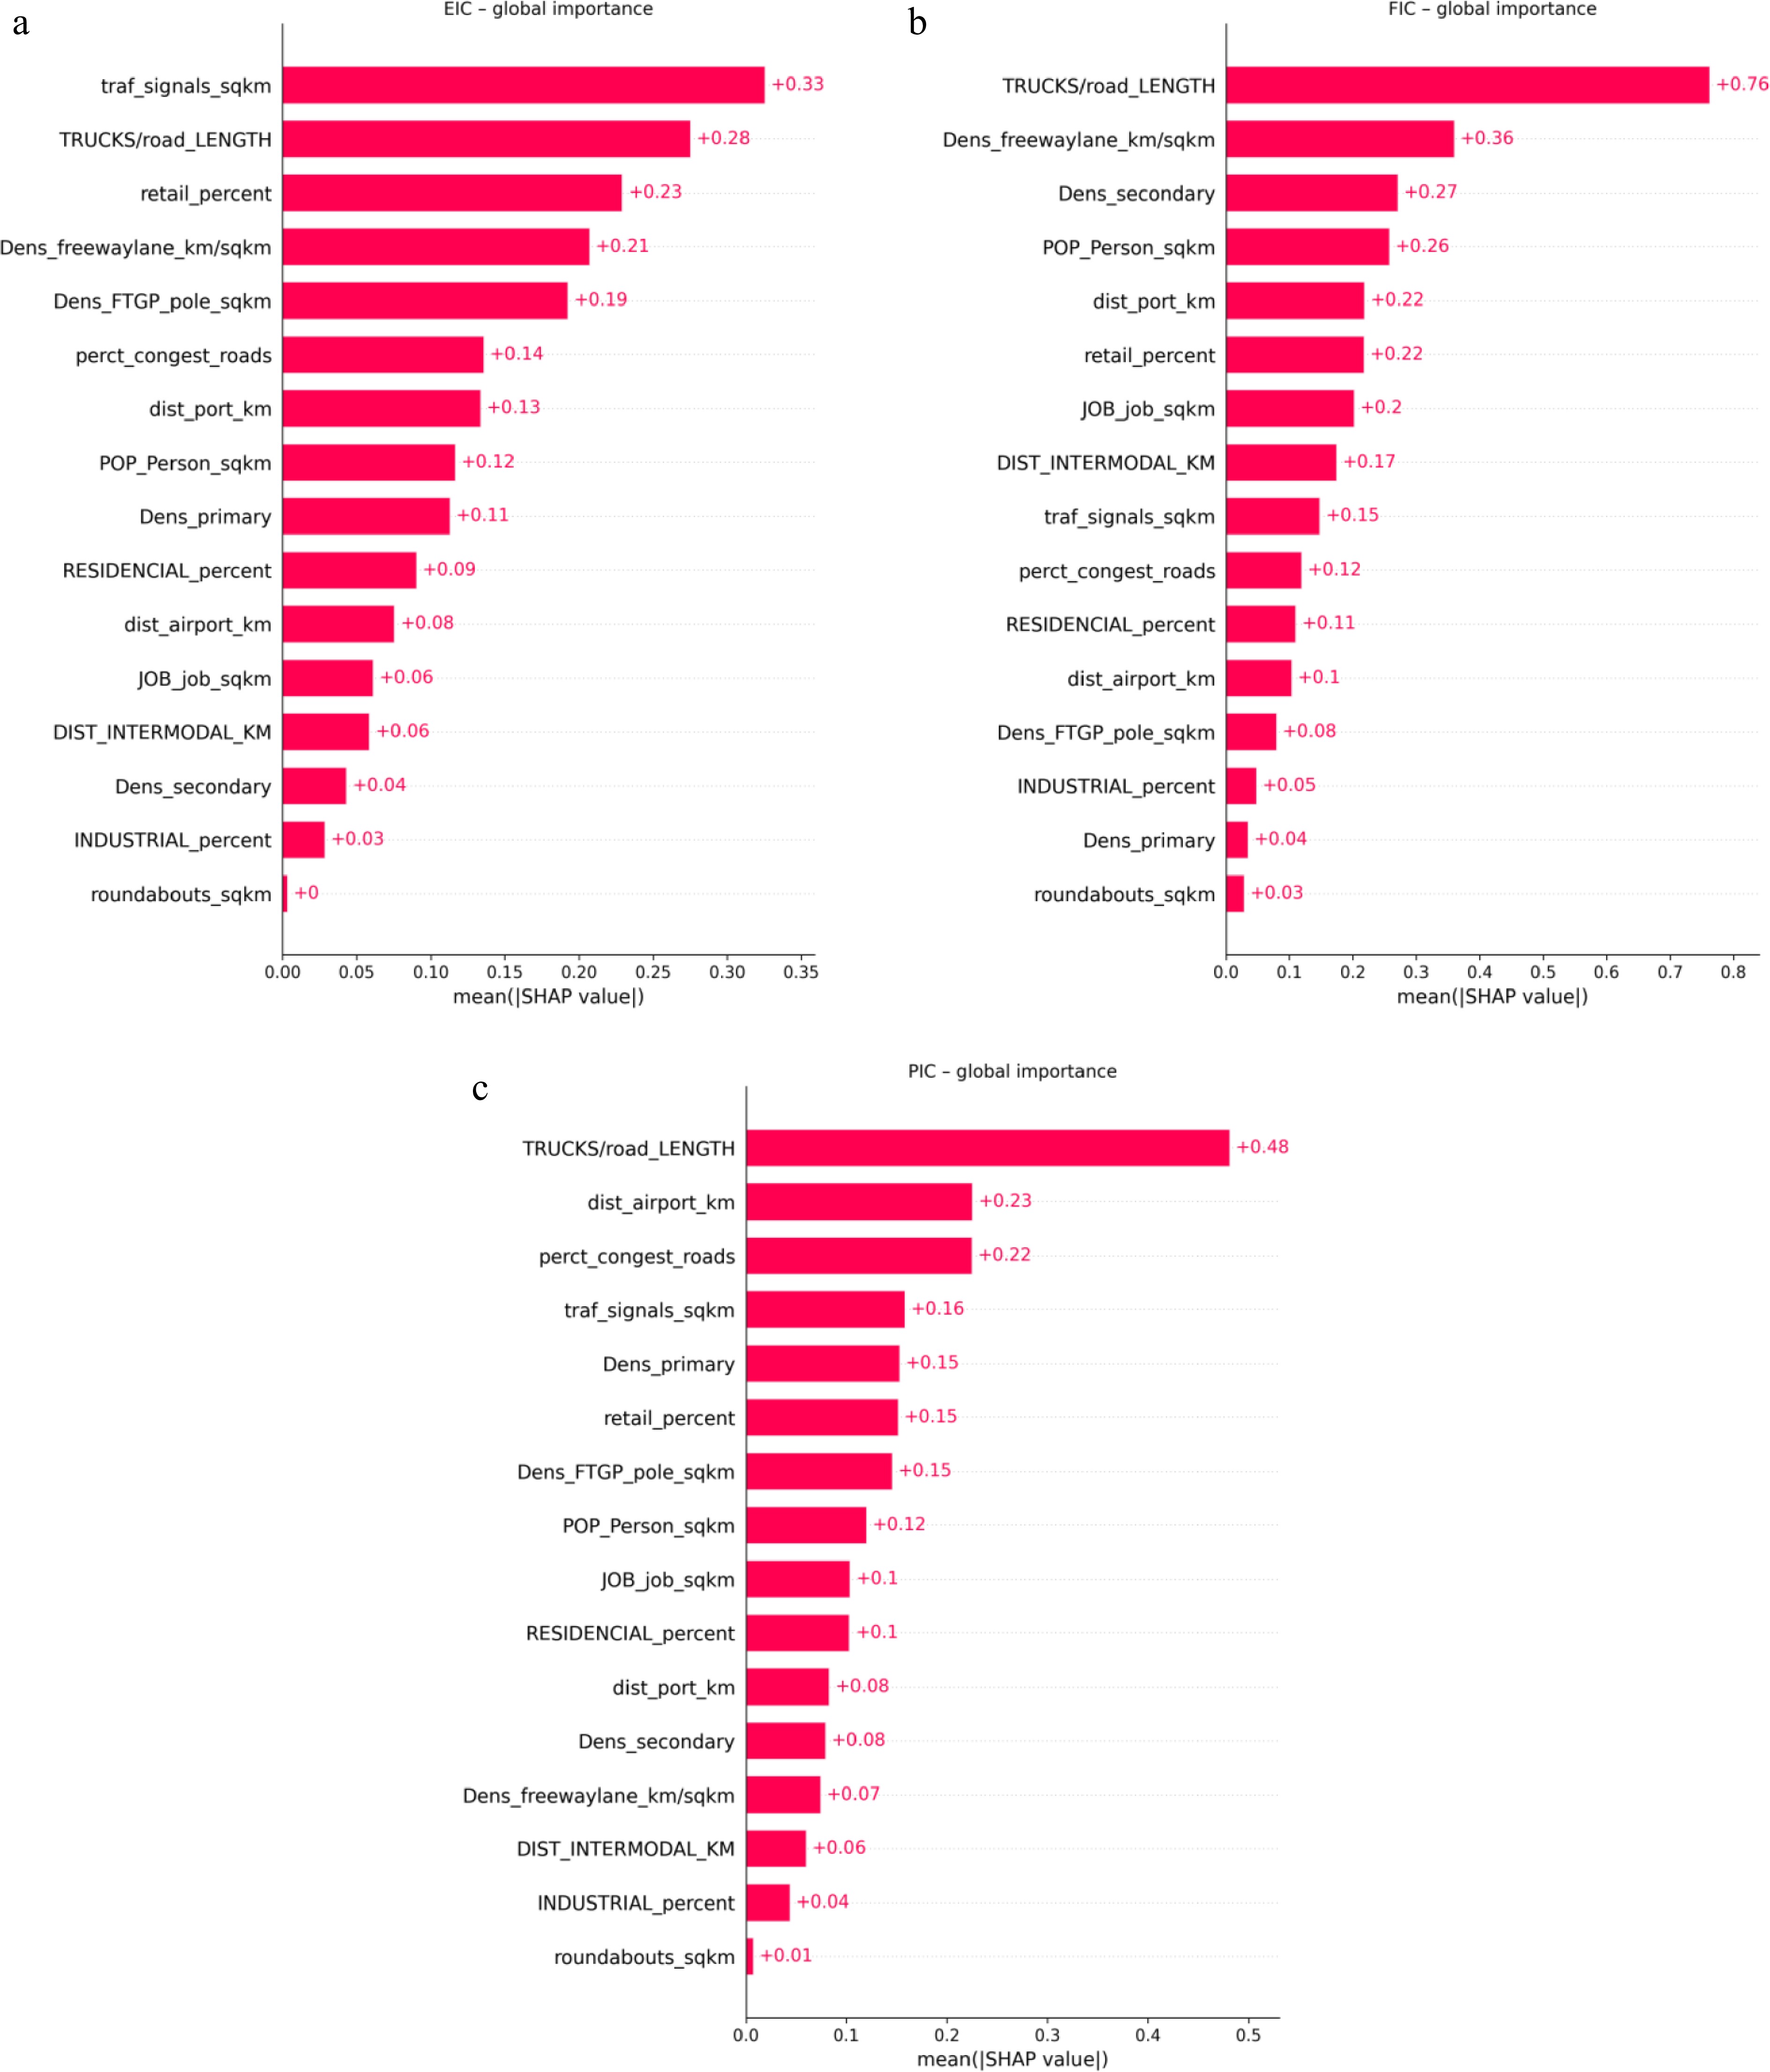
Figure 3.
Mean absolute SHAP value.
-
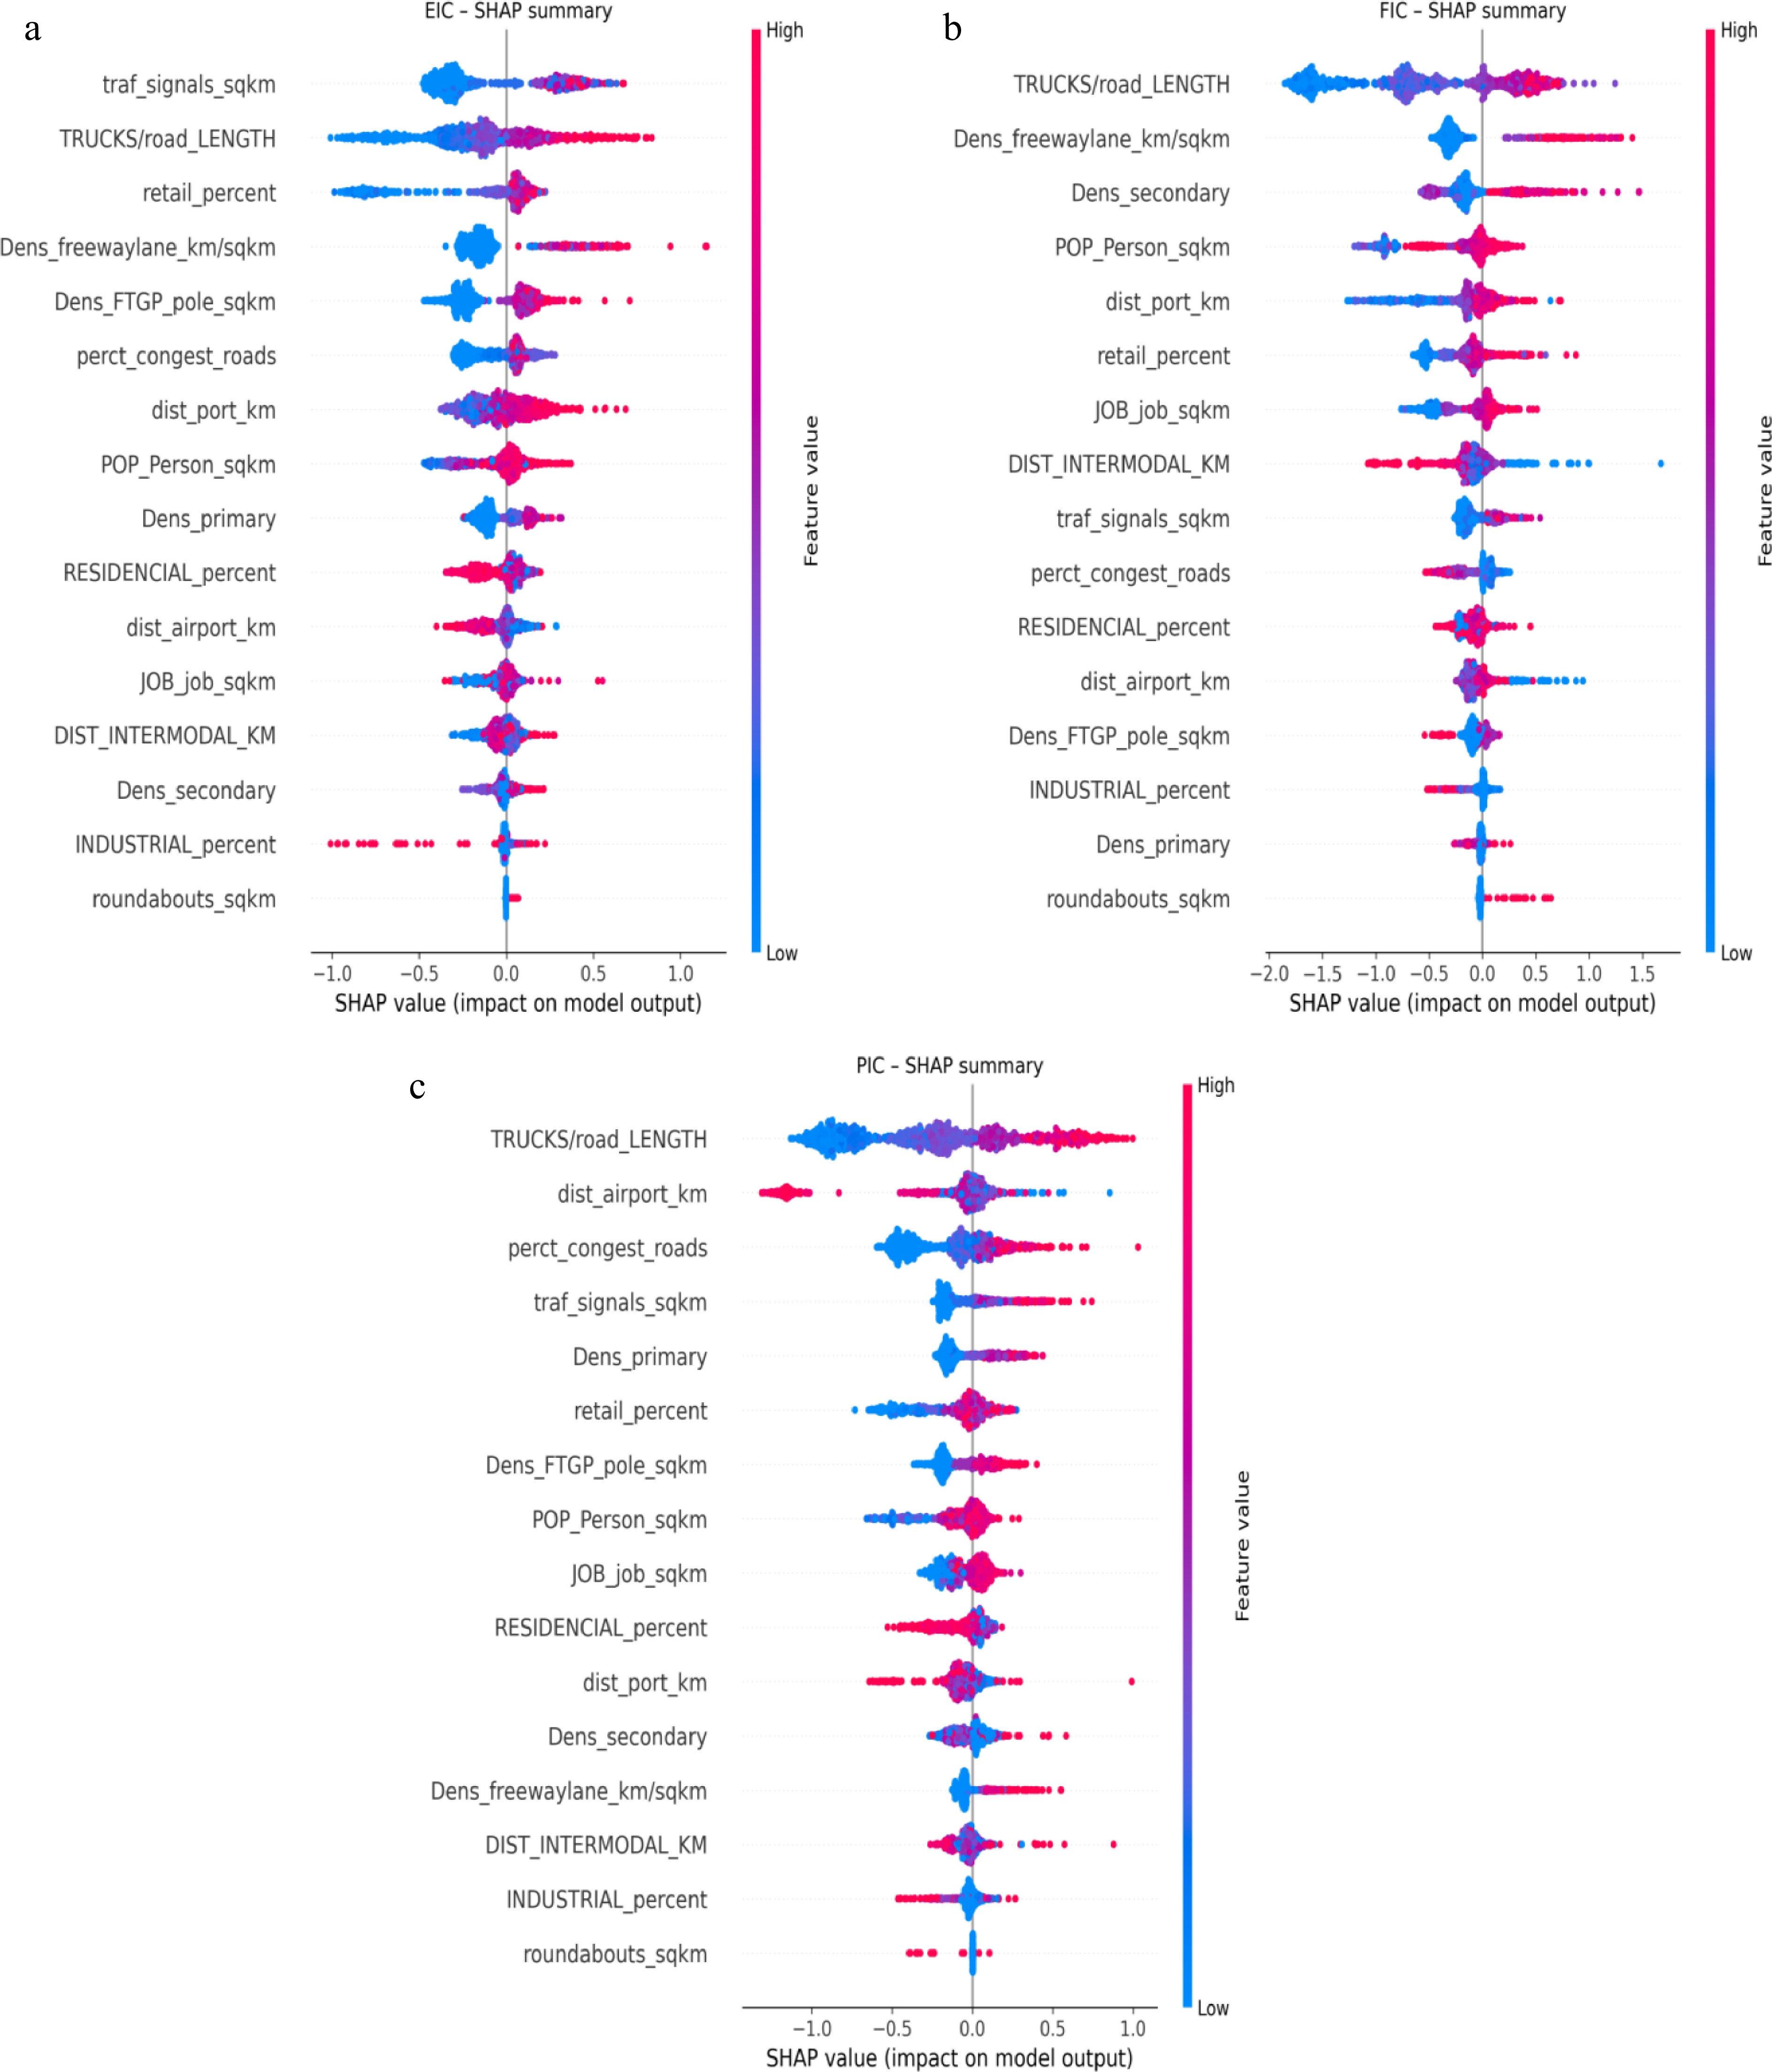
Figure 4.
Global SHAP summary plot.
-
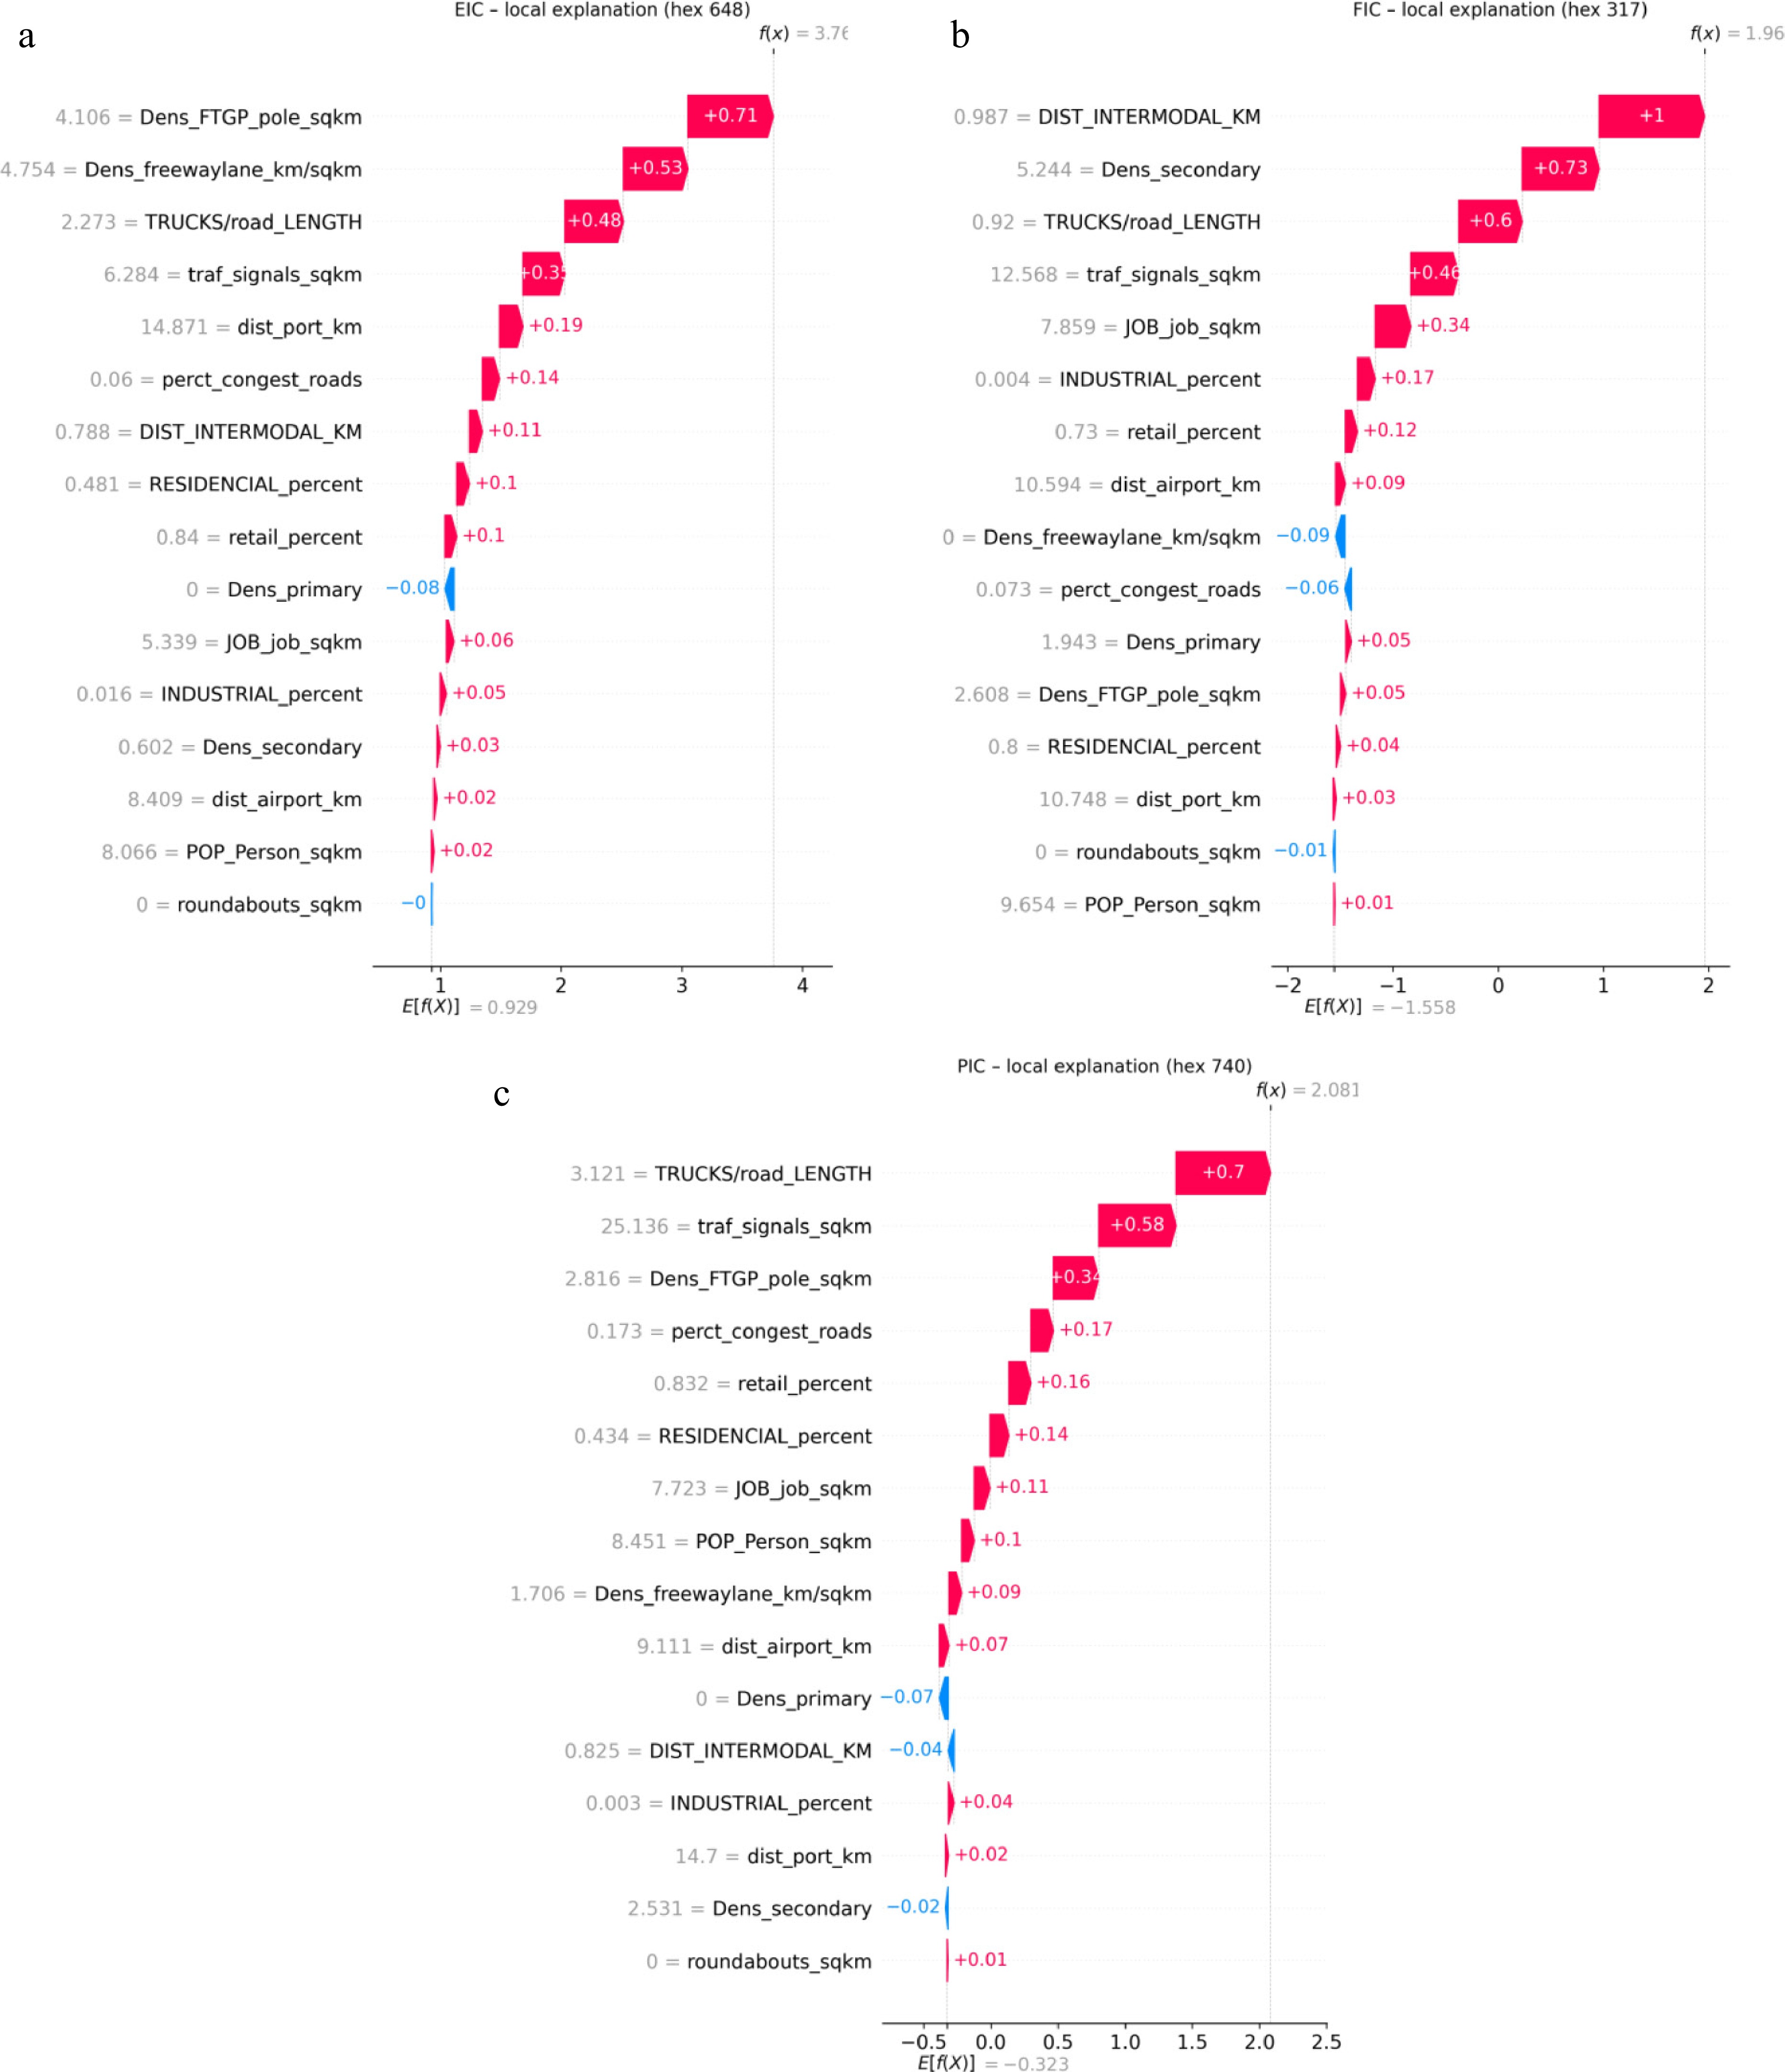
Figure 5.
SHAP waterfall plot.
-
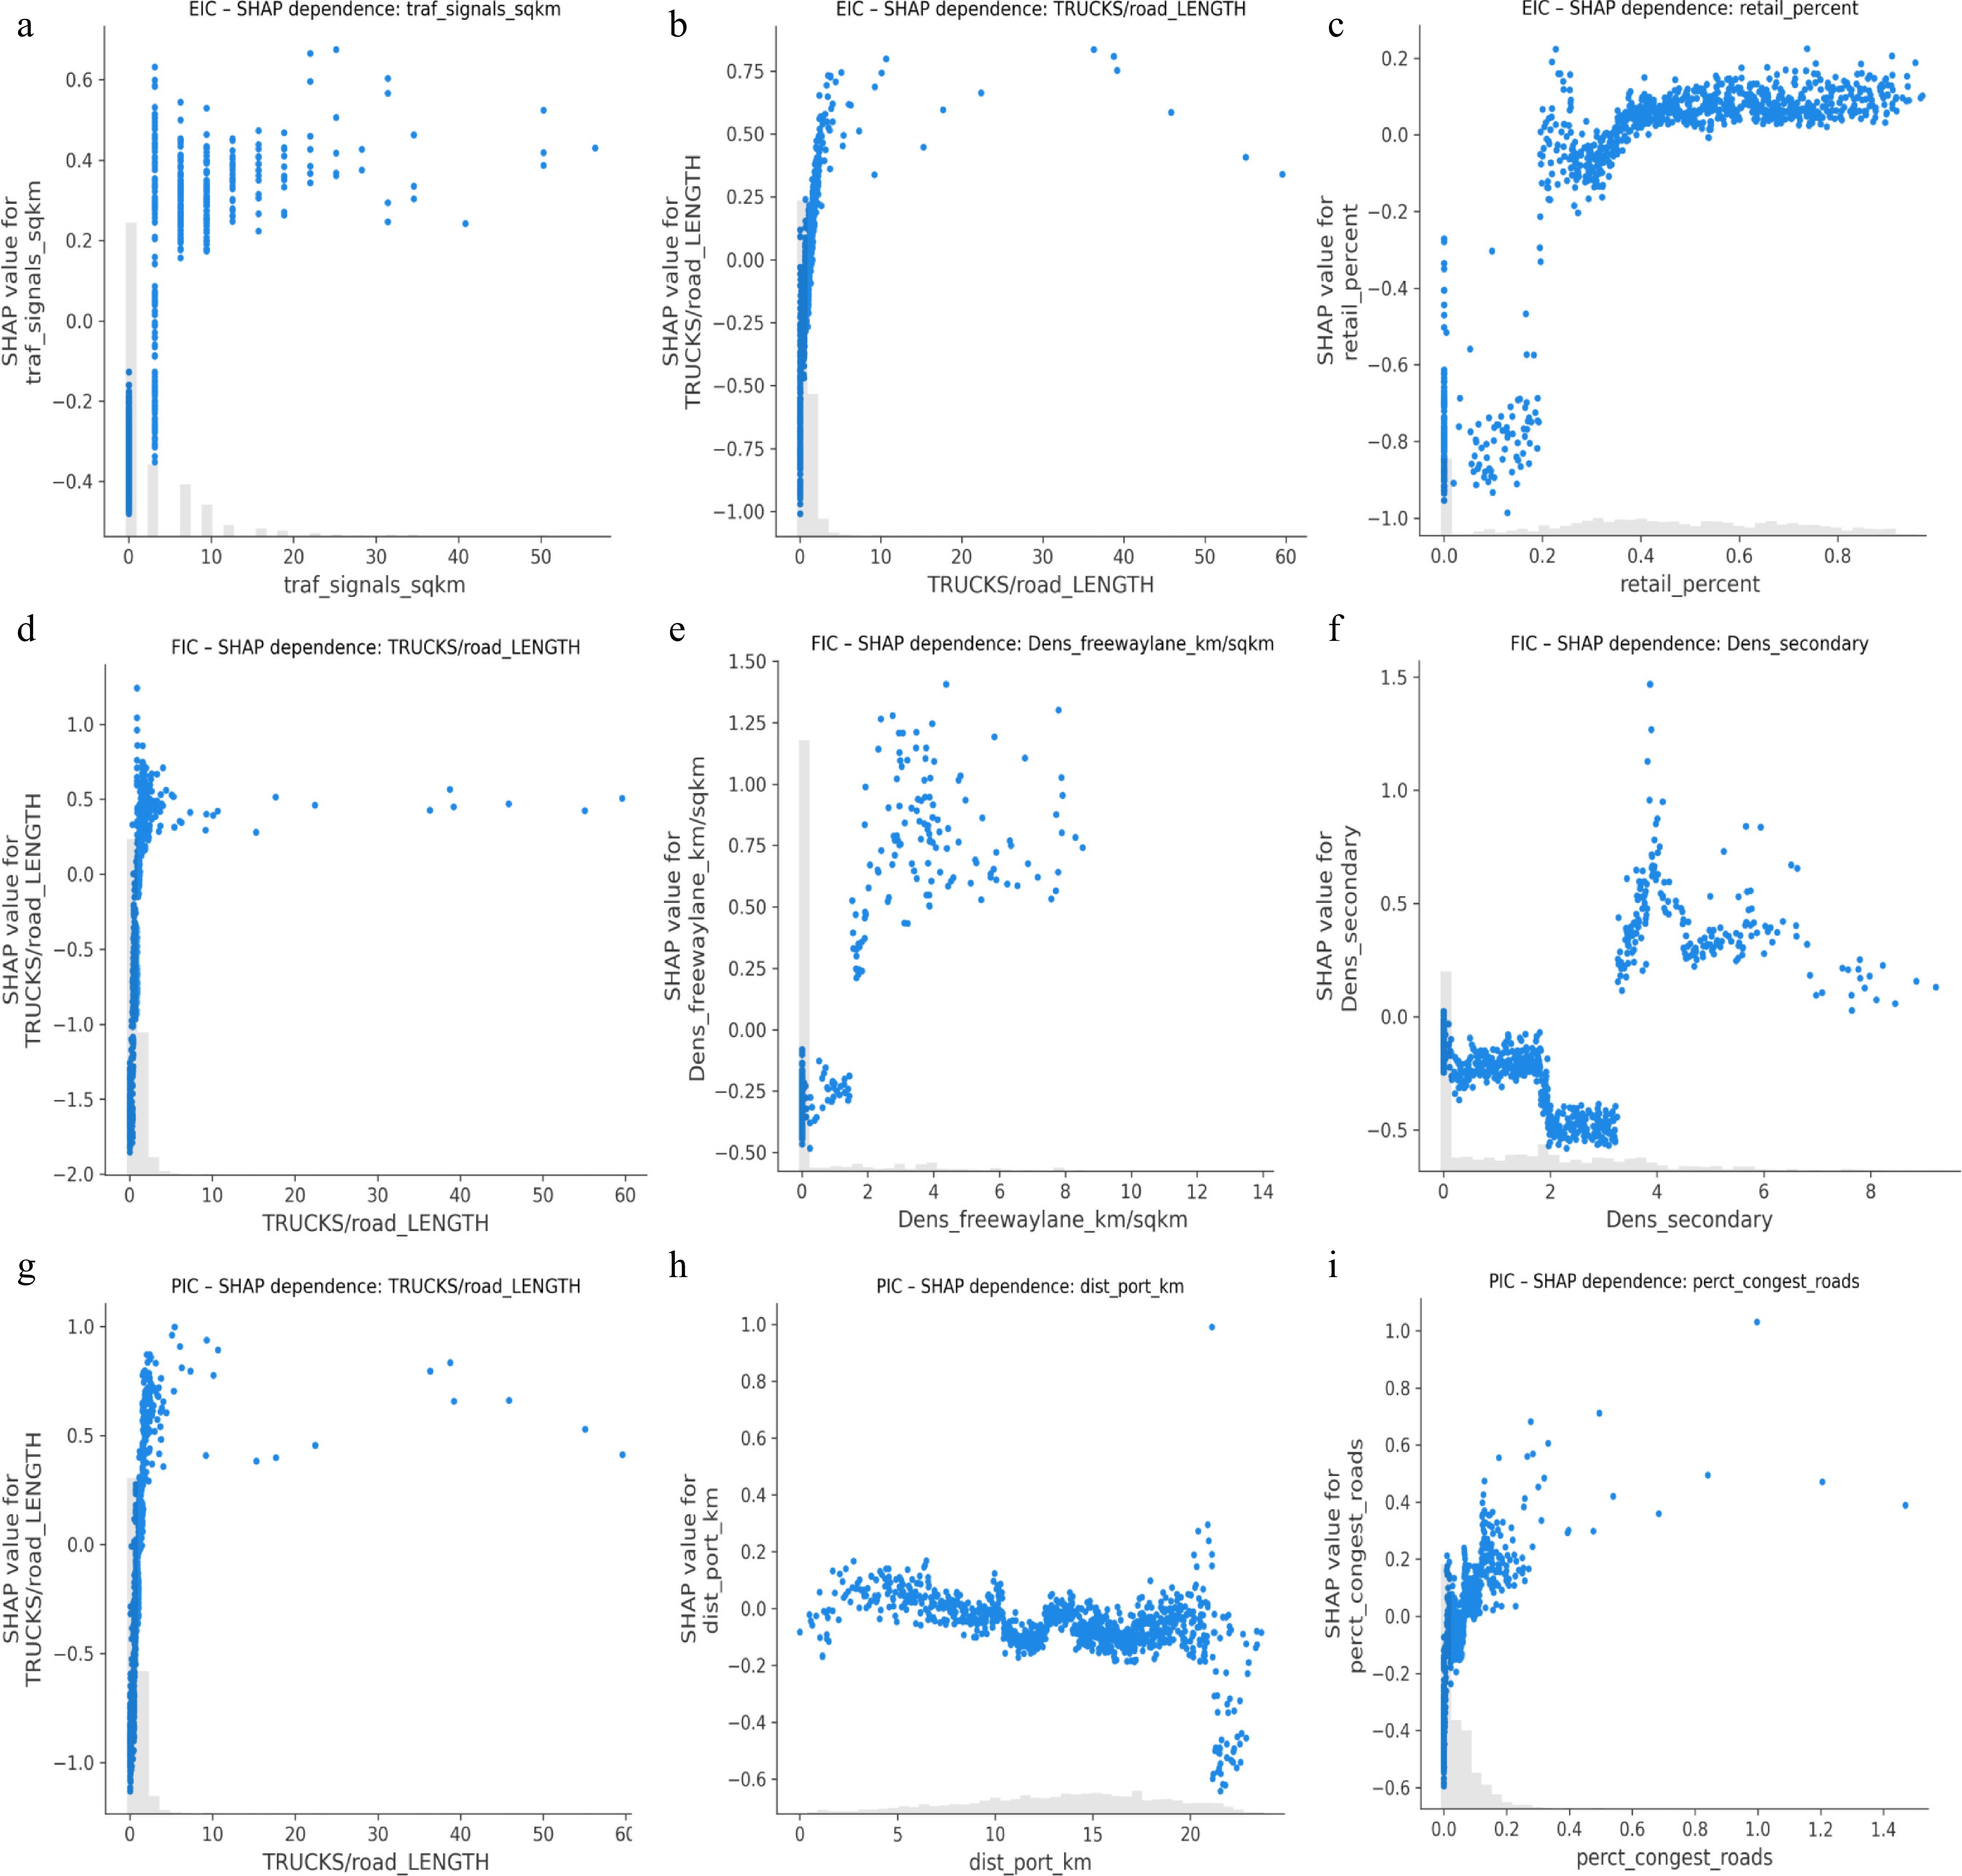
Figure 6.
SHAP dependence plot.
-
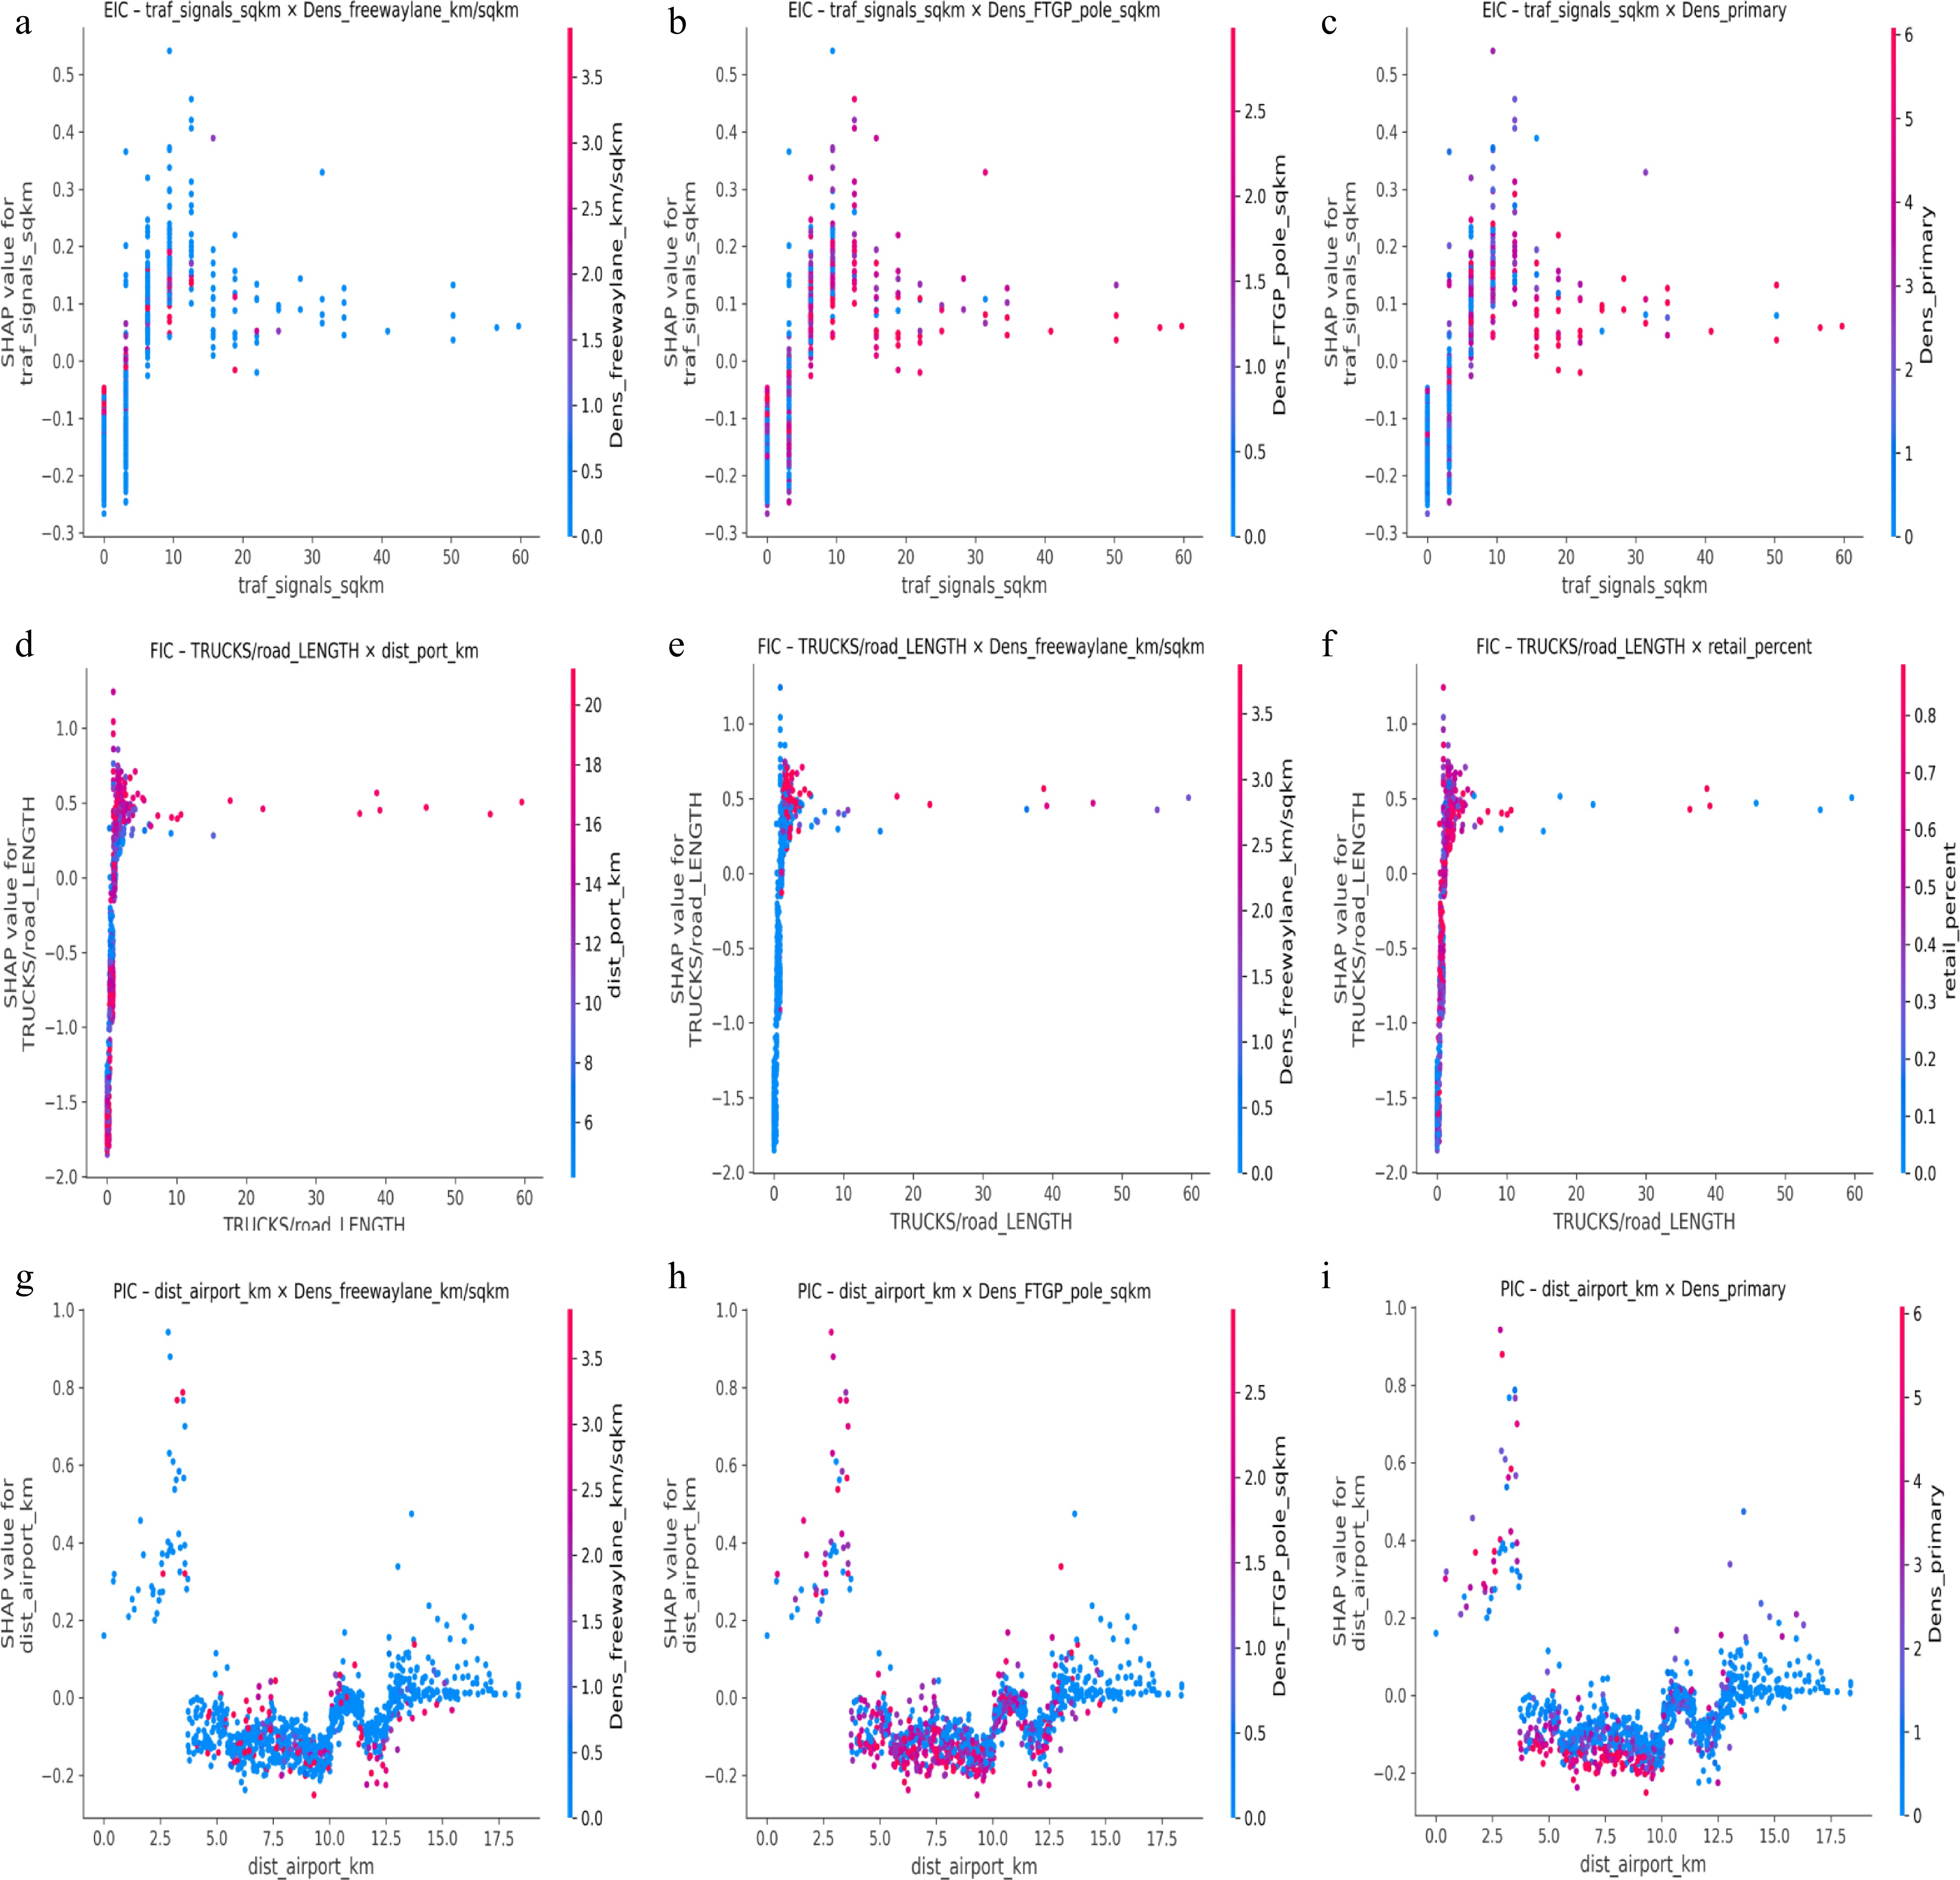
Figure 7.
SHAP interaction plot.
-
Response variables Hexagonal-based analysis Neighborhood-based analysis Census tracts-based analysis Mean S.D. Min. Max. Mean S.D. Min. Max. Mean S.D. Min. Max. PIC 0.68 1.65 0.00 9.43 0.88 1.01 0.00 6.29 0.73 4.83 0 127.4 EIC 2.44 4.26 0.00 50.27 2.97 2.55 0.00 12.67 2.63 10.09 0 186.17 FIC 0.17 0.81 0.00 9.43 0.2 0.42 0.00 2.96 0.23 3.02 0 96.77 Predictors Freight generators Distance to airport (km) 9.38 3.36 0.00 18.37 8.46 2.8 1.48 15.48 8.61 2.74 0 17.32 Distance to seaport (km) 13.46 5.13 0.00 23.63 12.64 4.9 0.36 21.83 13.33 5.07 0 23.4 Distance to intermodal terminal (km) 4.76 2.24 0.09 10.89 4.36 2.18 0.25 9.74 4.23 2.25 0.06 10.27 Demographics & land uses Population density (persons/km2) 7,338.51 5,696.26 0.00 29,802.4 16,813.09 8,190.26 737.16 38,948.43 17,056.7 17,351.8 0 629,596.41 Job density (jobs/km2) 2,352.61 11,661.82 0.00 301,277.1 2,953.44 5,575.33 1.98 34,015.25 298.01 6,566.02 0 293,390.21 % age of residential land uses 64% 32% 0% 100% 76% 10% 30% 95% 69% 33% 0 100% % age of industrial land uses 1% 7% 0% 100% 1% 3% 0% 18% 1% 6% 0 100% % age of retail land uses 43% 28% 0% 100% 51% 15% 22% 85% 39% 31% 0 100% Road infrastructure Density of traffic signals (per km2) 3.32 6.59 0.00 59.7 4.63 5.17 0.00 27.79 4 12.57 0 255.36 Density of roundabouts (per km2) 0.07 0.45 0.00 3.14 0.08 0.29 0.00 2.21 0.04 0.89 0 40.19 Density of freight trip generation
poles (per km2)4.24 8.32 0.00 103.69 5.45 4.98 0.00 32.9 4.03 12.63 0 152.74 Road network Density of freeway lane mileage
(km/km2)0.52 1.49 0.00 14.64 0.65 0.99 0.00 5.14 0.79 26.58 0 1,615.21 Density of primary road lane
mileage (km/km2)1.37 2.09 0.00 11.77 1.98 1.84 0.00 9.43 1.54 3.43 0 32.75 Density of secondary road lane
mileage (km/km2)1.59 1.86 0.00 9.22 2.10 1.53 0.00 7.83 2.16 3.89 0 56.57 Density of truck volumes
(vehicle/km2)1.18 3.72 0.00 59.56 1,032.56 796.99 288.08 6,653.61 1.47 9.31 0 589.1 Density of congested roads
(km/km2)0.05 0.10 0 1.47 0.06 0.04 0.00 0.19 0.06 0.19 0 6.22 Table 1.
Descriptive statistics.
-
Category Variable PIC EIC FIC ZIP XGBoost ZIP XGBoost ZIP XGBoost Co.eff S.E RI (%) Rank Co.eff S.E RI (%) Rank Co.eff S.E RI (%) Rank Freight generators Distance to airport −0.081*** 0.02 4.23 9 −0.044*** 0.009 2.91 13 0.007 0.038 4.82 12 Distance to seaport 0.031* 0.013 3.76 13 0.035*** 0.006 4.02 8 0.011 0.025 6.15 5 Distance to intermodal terminal −0.055* 0.025 3.33 15 −0.046*** 0.011 2.56 16 −0.014 0.055 6.05 6 Demographics and land uses Population density 0.045 0.079 3.69 14 −0.024 0.041 3.4 12 0.492** 0.157 3.87 16 Job density 0.056** 0.021 4.19 10 0.006 0.009 2.76 15 0.103* 0.044 7.19 4 %age of residential land uses 0.194 0.303 4.18 11 0.012 0.139 3.53 11 0.409 0.496 4.18 14 %%age of industrial land uses 0.888 1.847 3.93 12 0.691 0.386 2.9 14 0.017 4.833 5.19 9 %age of retail land uses 0.811** 0.265 4.47 8 0.12 0.125 5.49 7 1.412** 0.535 4.76 13 Road infrastructure Density of traffic signals 0.010* 0.005 19.89 1 0.014*** 0.003 14.3 2 0.004 0.026 5.98 8 Density of roundabouts −0.009 0.076 2.56 16 0.041 0.03 5.65 6 0.295 0.156 8.21 2 Density of freight trip generation poles −0.024 0.043 10.45 2 0.070** 0.022 8.71 4 0.104 0.11 5.09 10 Road network Density of freeway lane mileage 0.079*** 0.02 8.07 4 0.089*** 0.011 16.96 1 0.018 0.068 15.66 1 Density of primary road lane mileage 0.037 0.021 7.12 5 0.012 0.013 3.75 9 −0.058 0.083 4.04 15 Density of secondary road lane mileage 0.062* 0.026 4.6 7 −0.001 0.014 3.72 10 −0.003 0.068 6 7 Density of truck volumes −0.002 0.012 8.91 3 −0.001 0.006 12.93 3 0.009 0.038 7.96 3 Density of congested roads 1.336** 0.46 6.62 6 1.441*** 0.323 6.38 5 −1.424 3.126 4.87 11 PSEUDO-R2 0.042 0.167 0.074 0.349 0.044 −0.024 RMSE 1.559 1.561 3.923 3.608 0.803 0.784 MAE 0.955 0.861 2.562 2.152 0.300 0.223 *, **, and *** indicate statistical significance at the 10%, 5%, and 1% levels, respectively. Table 2.
Model comparison based on hexagonal-level analysis.
-
Category Variable PIC EIC FIC ZIP XGBoost ZIP XGBoost ZIP XGBoost Co.eff S.E RI (%) Rank Co.eff S.E RI (%) Rank Co.eff S.E RI (%) Rank Freight generators Distance to airport −0.139** 0.053 3.03 13 −0.091** 0.028 3.8 12 −0.1 0.103 5.98 7 Distance to seaport −0.009 0.036 2.79 15 −0.011 0.019 6.4 7 0.023 0.073 5.37 9 Distance to intermodal terminal −0.111 0.075 2.8 14 −0.076* 0.037 1.98 16 −0.175 0.136 6.63 6 Demographics and land ues Population density 0.089 0.295 3.66 11 0.233 0.162 3.73 13 0.384 0.547 4.14 16 Job density 0.118 0.130 6.19 4 −0.219*** 0.057 3.56 14 −0.289 0.273 4.39 14 % of residential land uses 0.126 1.478 3.07 12 0.059 0.791 4.44 9 −0.329 3.133 7.2 4 % of industrial land uses −0.019 5.259 2.64 16 −0.017 2.374 8.07 5 0.112 8.479 12.8 1 % of retail land uses −0.271 1 4.93 8 −0.097 0.526 7.42 6 0.015 1.954 5.44 8 Road infrastructure Density of traffic signals 0.076* 0.037 24.62 1 0.041 0.025 8.43 4 0.049 0.092 4.94 12 Density of roundabouts 0.084 0.345 5.89 5 0.036 0.213 3.45 15 −0.035 0.952 4.18 15 Density of freight trip generation poles −0.048 0.204 5.6 7 0.365** 0.133 11.55 3 0.537 0.423 8.43 2 Road network Density of freeway lane mileage 0.101 0.103 6.89 3 0.140* 0.055 12.24 1 0.212 0.209 7.06 5 Density of primary road lane mileage −0.115 0.091 3.82 10 −0.075 0.056 5.33 8 −0.376 0.236 4.92 13 Density of secondary road lane mileage −0.185 0.103 5.73 6 −0.128* 0.060 3.81 11 −0.382 0.248 4.97 11 Density of truck volumes 0 0 4.71 9 0 0 11.77 2 0 0 8.35 3 Density of congested roads 0.077 4.802 13.64 2 −0.012 2.434 4.01 10 −0.025 9.565 5.21 10 PSEUDO-R2 0.153 0.080 0.122 0.106 0.099 −0.386 RMSE 0.818 0.920 2.059 2.336 0.388 0.411 MAE 0.558 0.628 1.529 1.630 0.234 0.230 *, **, and *** indicate statistical significance at the 10%, 5%, and 1% levels, respectively. Table 3.
Model comparison based on neighborhood-level analysis.
-
Category Variable PIC EIC FIC ZIP XGBoost ZIP XGBoost ZIP XGBoost Co.eff S.E RI (%) Rank Co.eff S.E RI (%) Rank Co.eff S.E RI (%) Rank Freight generators Distance to airport −0.085 nan 7.22 5 −0.008 nan 5.45 11 0.012 nan 5.74 12 Distance to seaport −0.019 nan 6.36 7 −0.003 nan 6.93 7 0.038 nan 6.92 6 Distance to intermodal terminal −0.074 nan 5.23 11 −0.055 nan 6.17 9 −0.032 nan 10.18 2 Demographics and land uses Population density 0.625 nan 5.66 9 0.381 nan 5.57 10 −0.022 nan 6.09 9 Job density 0.032 nan 2.49 14 −0.002 nan 2.54 14 −0.011 nan 16 % of residential land uses −0.469 nan 6.07 8 −0.198 nan 4.88 13 −0.018 nan 9.12 4 % of industrial land uses 1.176 nan 3.75 12 1.408 nan 5 12 0.001 nan 3.51 13 % of retail land uses −0.912 nan 9.76 3 0.008 nan 7.8 5 0.011 nan 6.53 7 Road infrastructure Density of traffic signals 0.004 nan 14.93 1 0.004 nan 11.83 1 0.075 nan 5.87 11 Density of roundabouts −0.081 nan 1.22 16 −0.109 nan 1.69 15 0.001 nan 0.73 15 Density of freight trip generation poles −0.086 nan 3.25 13 −0.073 nan 7.12 6 0.028 nan 9.38 3 Road network Density of freeway lane mileage 0.004 nan 1.48 15 0.006 nan 1.54 16 −0.014 nan 0.95 14 Density of primary road lane mileage 0.017 nan 8.52 4 0.017 nan 8.12 3 0.052 nan 7.62 5 Density of secondary road lane mileage 0.004 nan 5.5 10 0.018 nan 7.97 4 −0.01 nan 6.04 10 Density of truck volumes 0.1 nan 7.19 6 0.051 nan 11.09 2 0.24 nan 15.12 1 Density of congested roads 1.176 nan 11.36 2 −0.107 nan 6.31 8 0.001 nan 6.21 8 PSEUDO-R2 0.302 0.028 0.192 0.055 −2.392 −0.047 RMSE 4.659 9.742 2.825 MAE 1.18 3.951 0.319 Table 4.
Model comparison based on census tracts-level analysis.
Figures
(7)
Tables
(4)