-
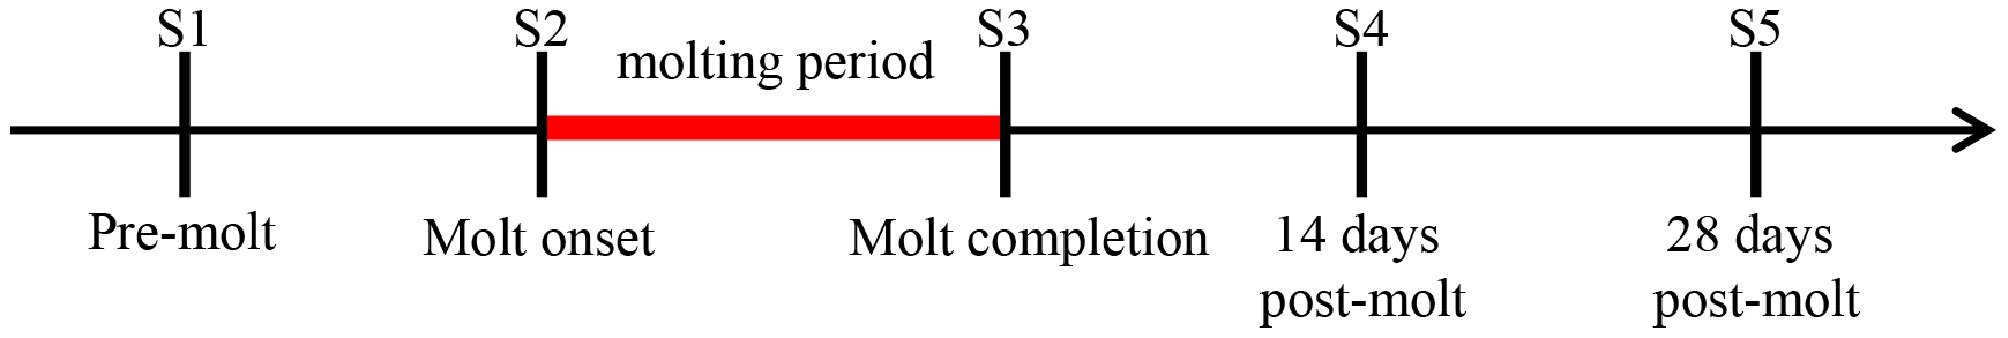
Figure 1.
Experimental design of molting schedule and sample collection (blood sampling) schedule. To monitor the physiological changes associated with molting, five sampling points were defined: pre-molting (S1), the first day of feather shedding (S2, defined as onset of the molt), the day the last feather fell out (S3, defined as completion of the molt), and two post-molting stages at 14 days (S4) and 28 days (S5) after the molt's completion.
-
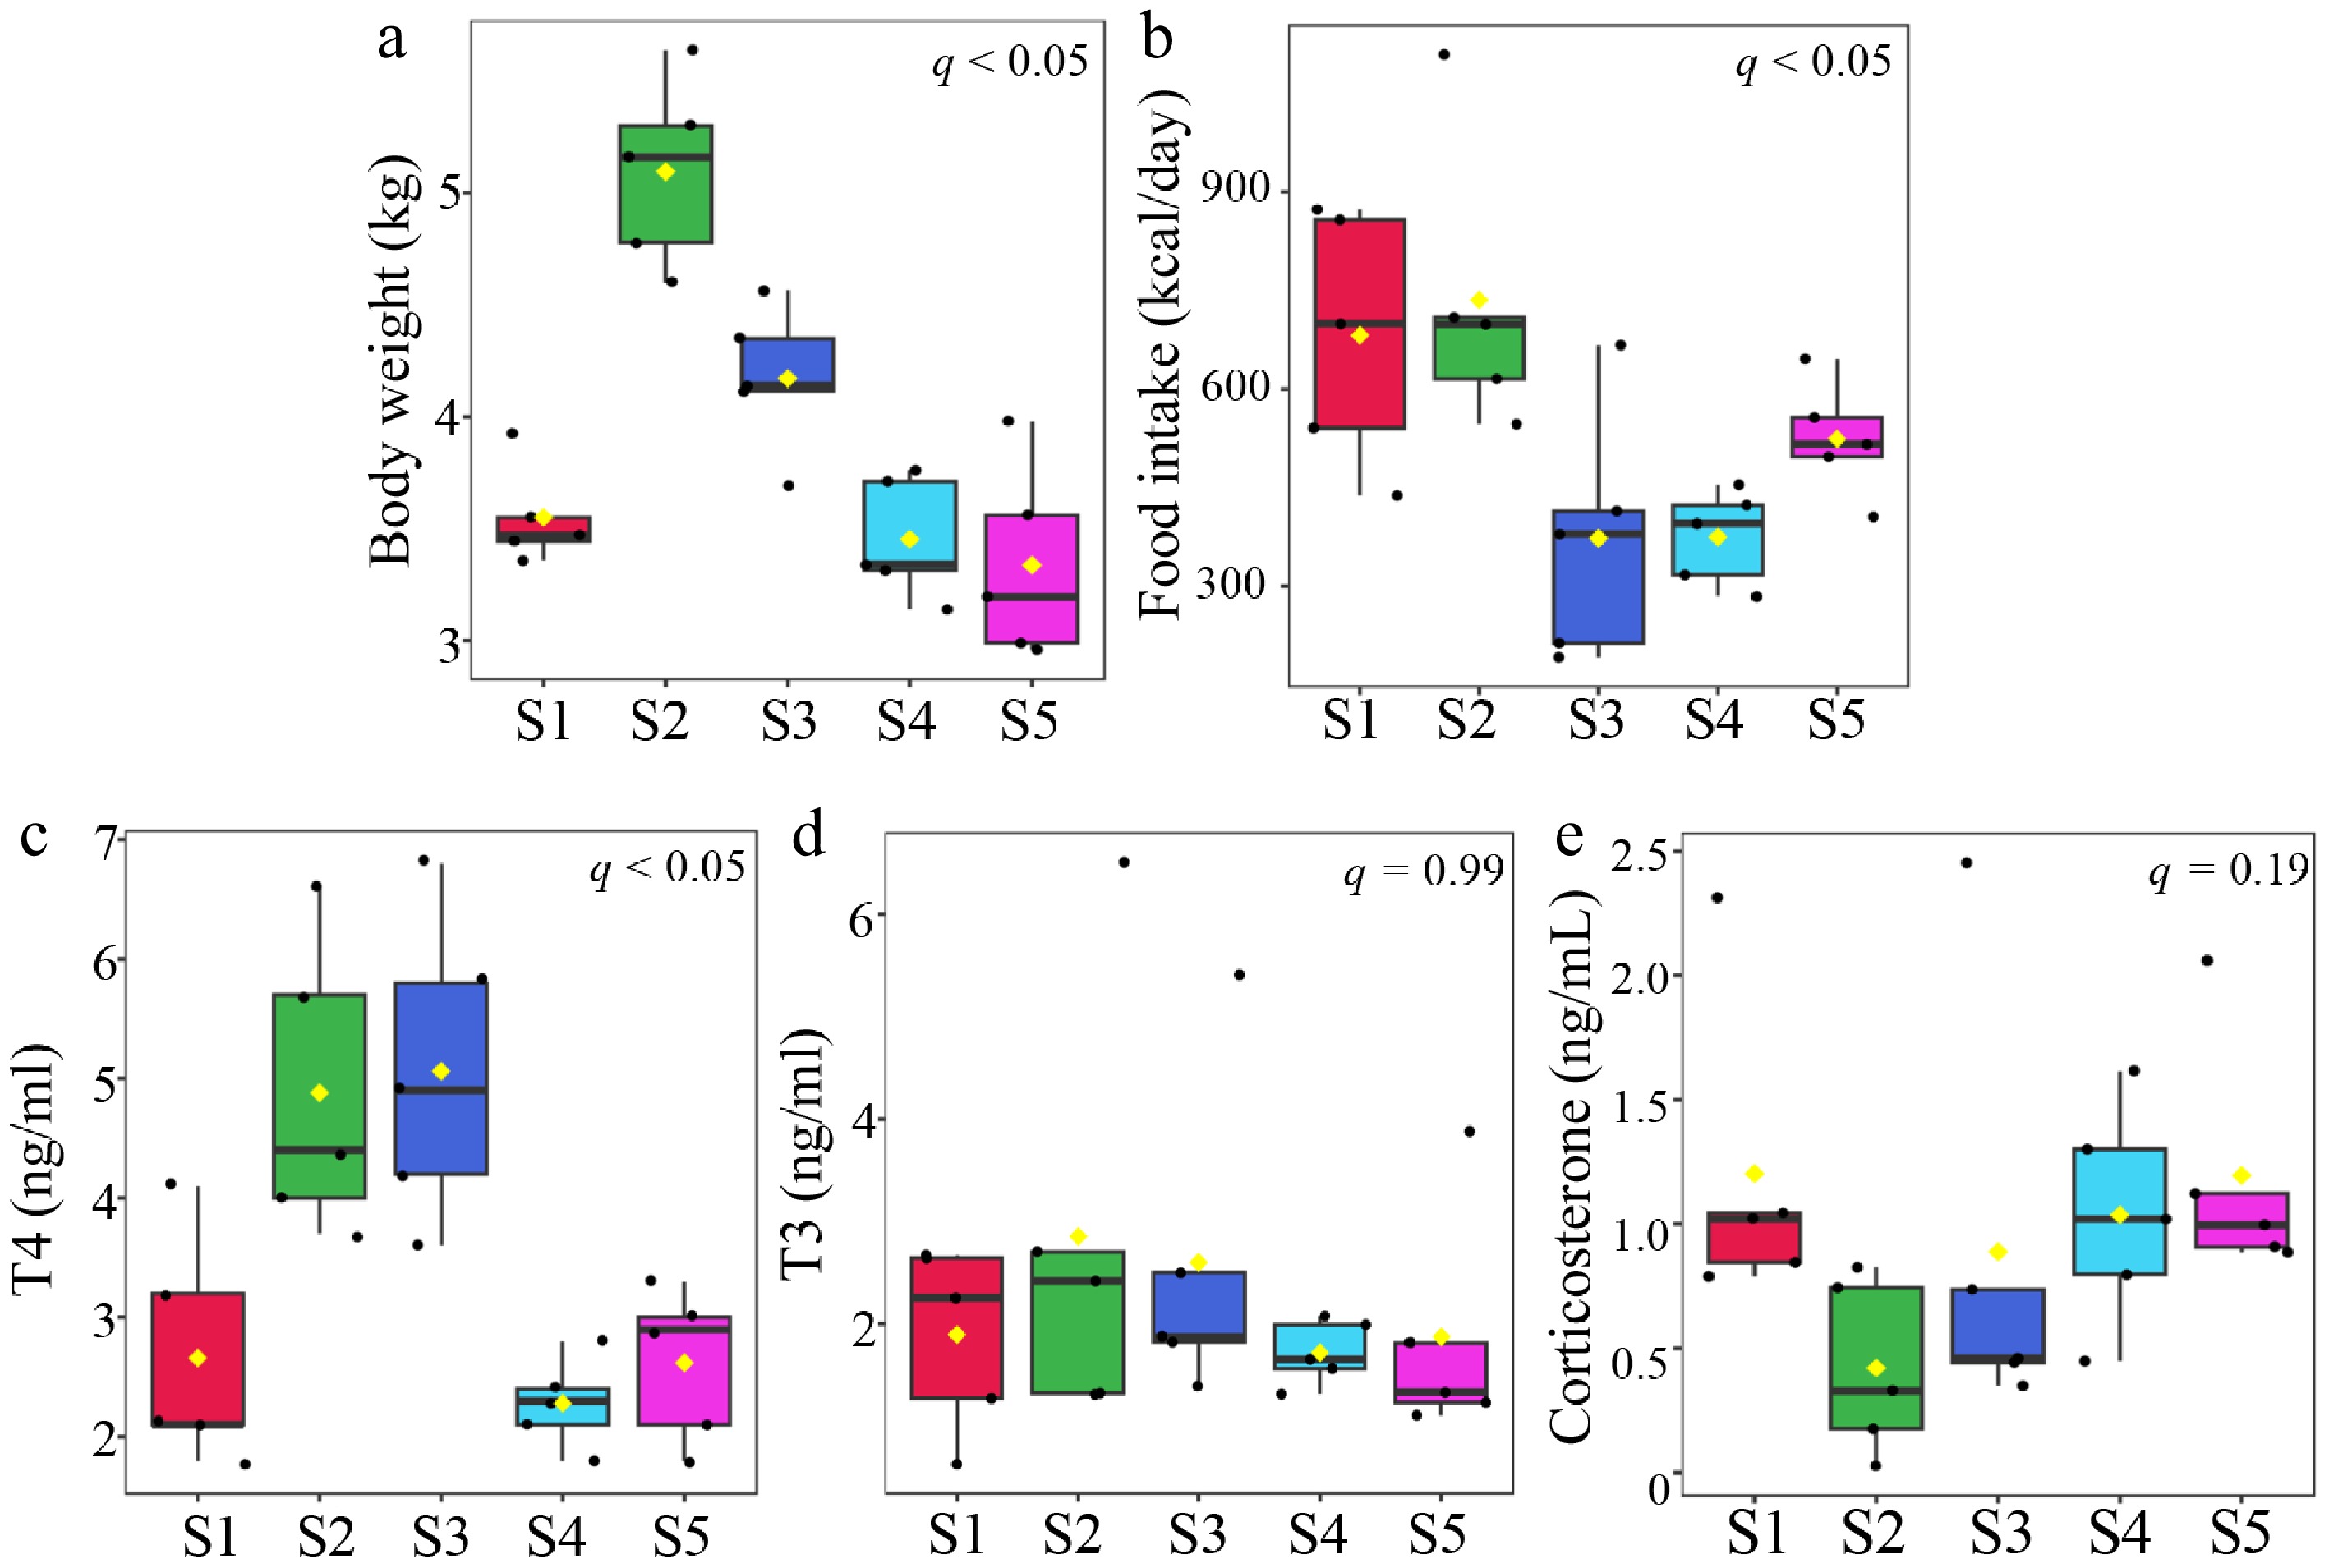
Figure 2.
Changes in body weight, food intake, and key hormone concentrations across sampling points. (a) Body weight and (b) food intake measured across sampling points. Serum concentrations of the three hormones (c) T4, (d) T3, and (e) corticosterone, assessed at the same time points. Data are presented as box plots. Statistical differences among time points were evaluated using ANOVA, and significant differences are indicated in the figures (q < 0.05).
-
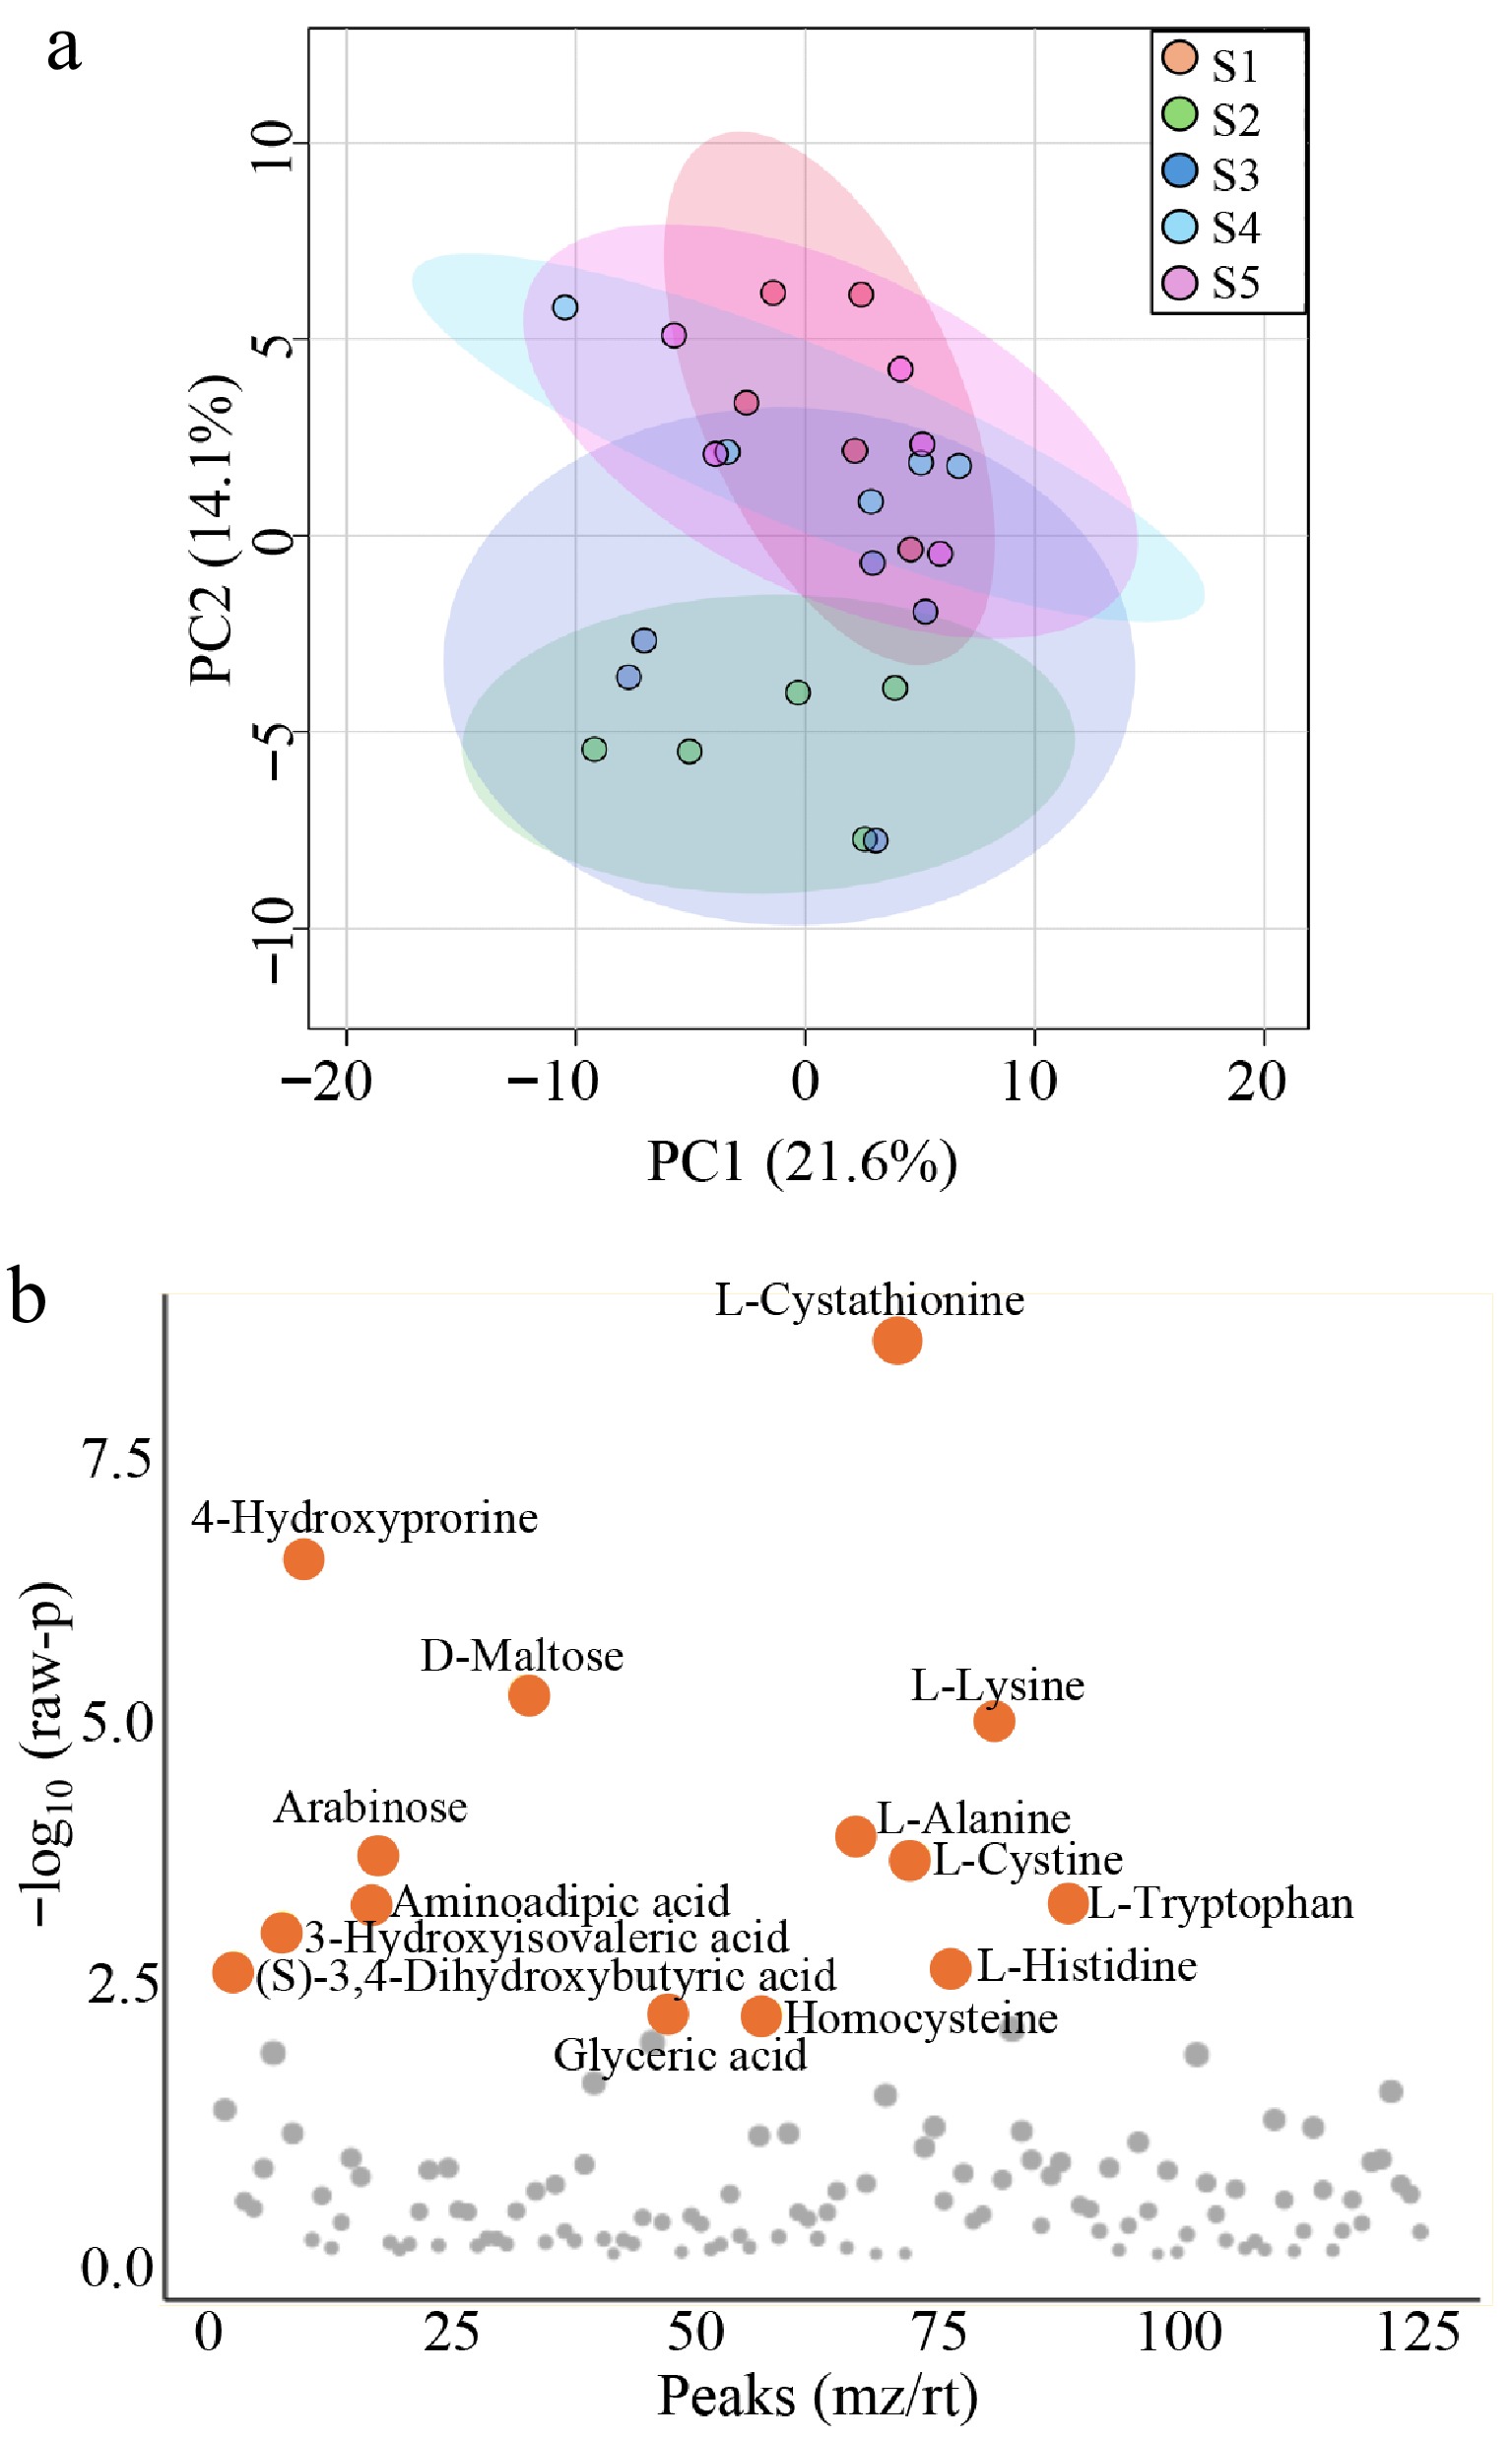
Figure 3.
Multivariate and univariate analysis of metabolomic profiles. (a) PCA score plot showing the overall metabolic profiles between groups of sampling points. The scatter plot displays the first two principal components (PC1 and PC2), with each point representing an individual sample. Red, green, blue, light blue, and pink points indicate S1, S2, S3, S4, and S5, respectively. (b) Result of ANOVA identifying metabolites with significant differences between groups of sampling points. Orange dots indicate significant differences, q < 0.05.
-
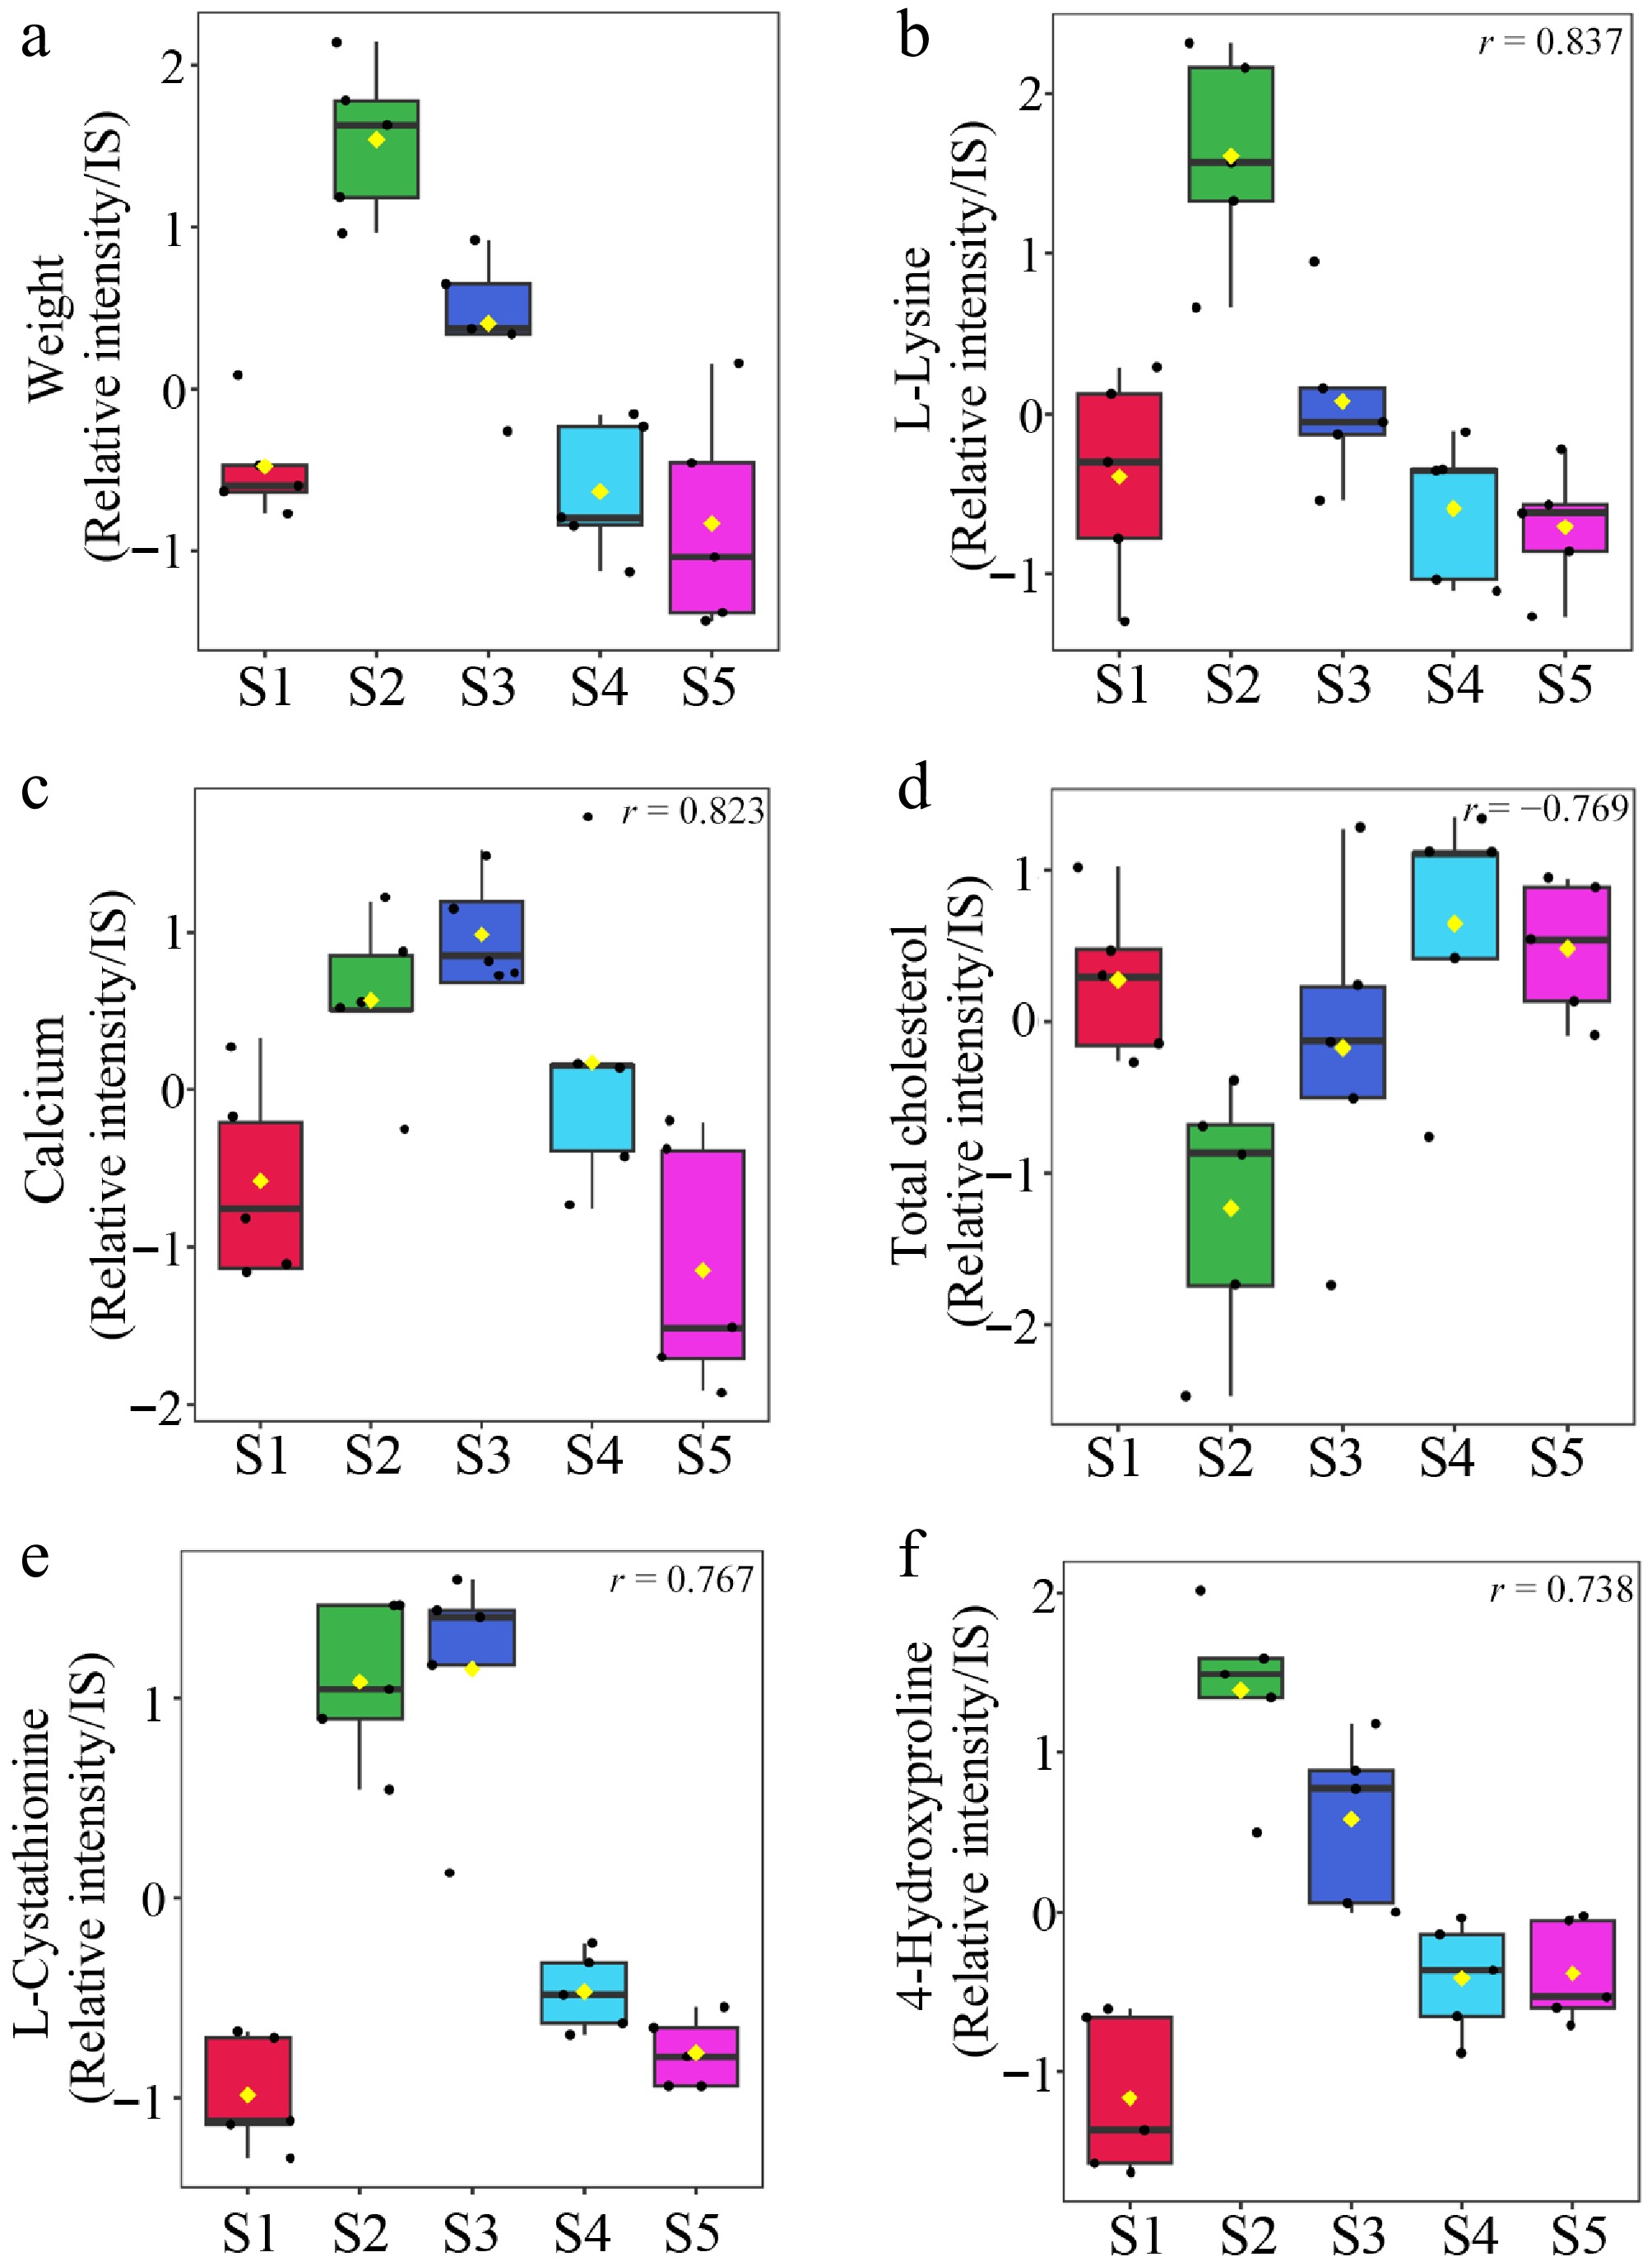
Figure 4.
Changes in body weight-associated metabolites across sampling points. The five metabolites most strongly correlated with body weight changes were selected. (a) Body weight measured across sampling points. Serum metabolites (b) L-lysine, (c) calcium, (d) total cholesterol, (e) L-cystathionine, and (f) 4-hydroxy proline assessed at the same time points. Data are presented as box plots, and each value is represented as a relative value normalized to the internal standard peak intensity. Significant differences (p < 0.05) in all five selected substances are shown in the figure.
-
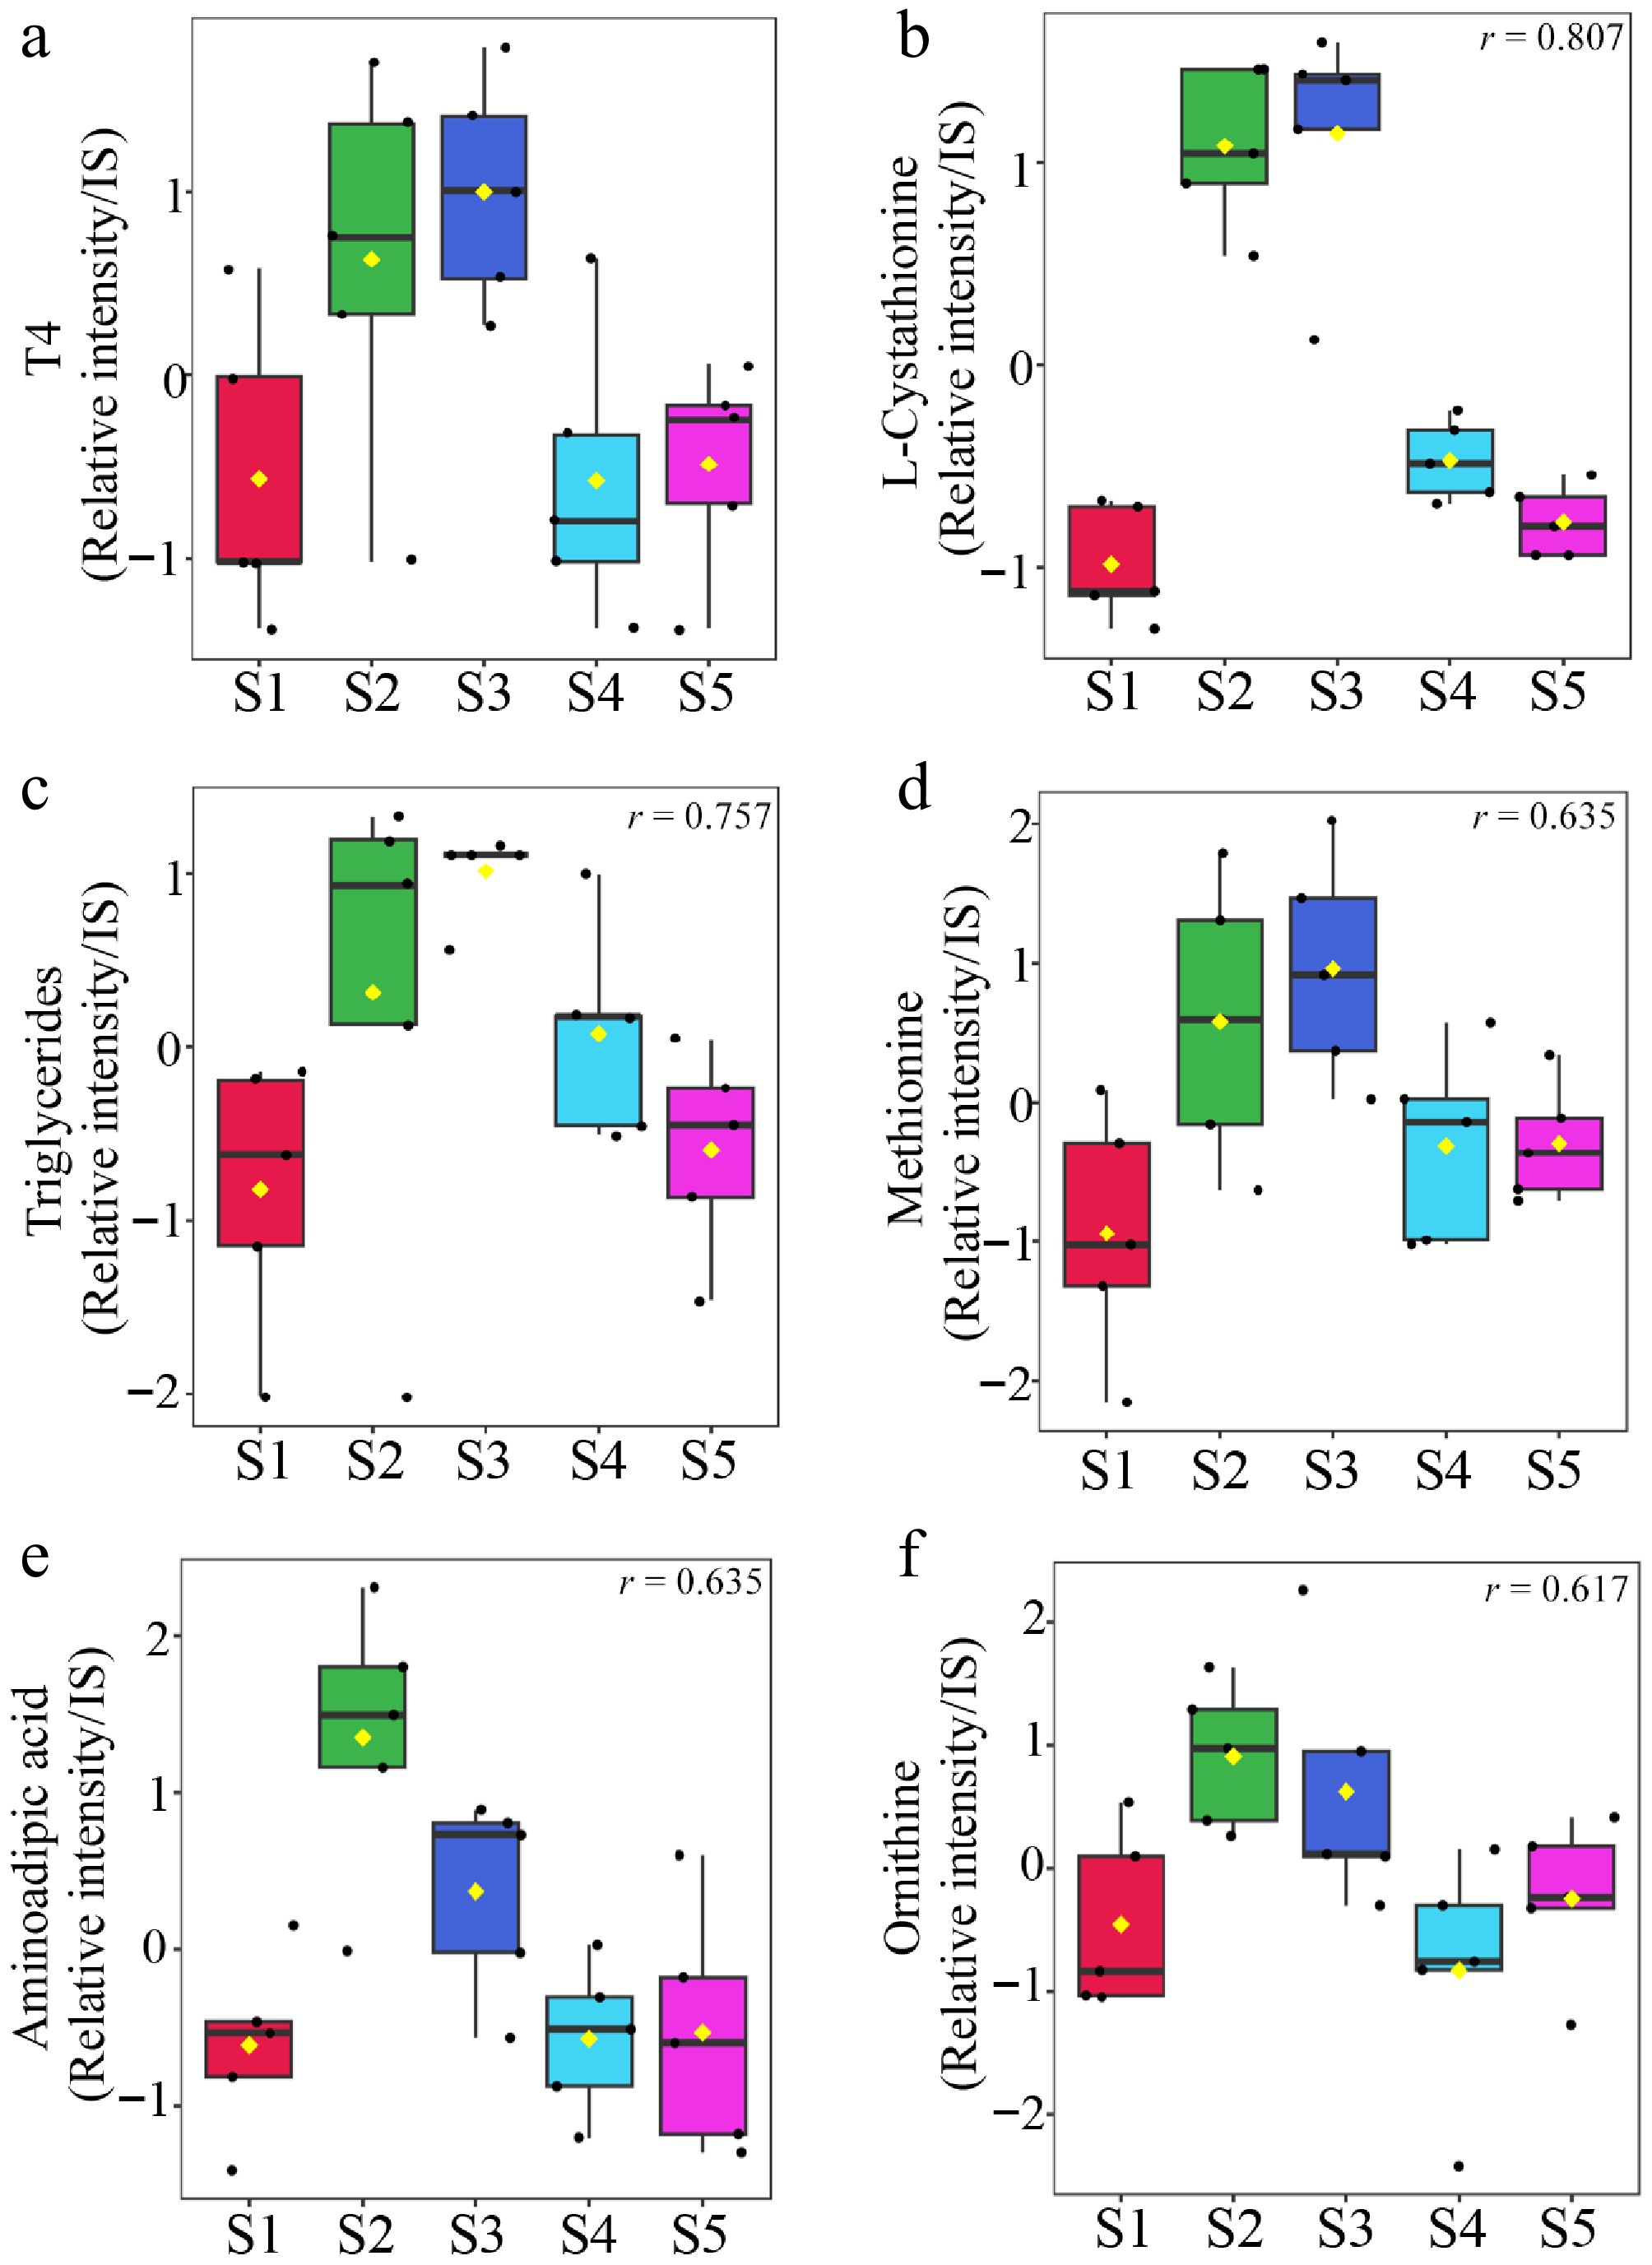
Figure 5.
Changes in T4-associated metabolites across sampling points The five metabolites most strongly correlated with changes in T4 levels were selected. (a) T4 measured across sampling points. Serum metabolites (b) L-cystathionine, (c) triglycerides, (d) methionine, (e) aminoadipic acid, and (f) ornithine assessed at the same time points. Data are presented as box plots, and each value is represented as a relative value normalized to the internal standard peak intensity. Significant differences (p < 0.05) in all five selected substances are shown in the figure.
-
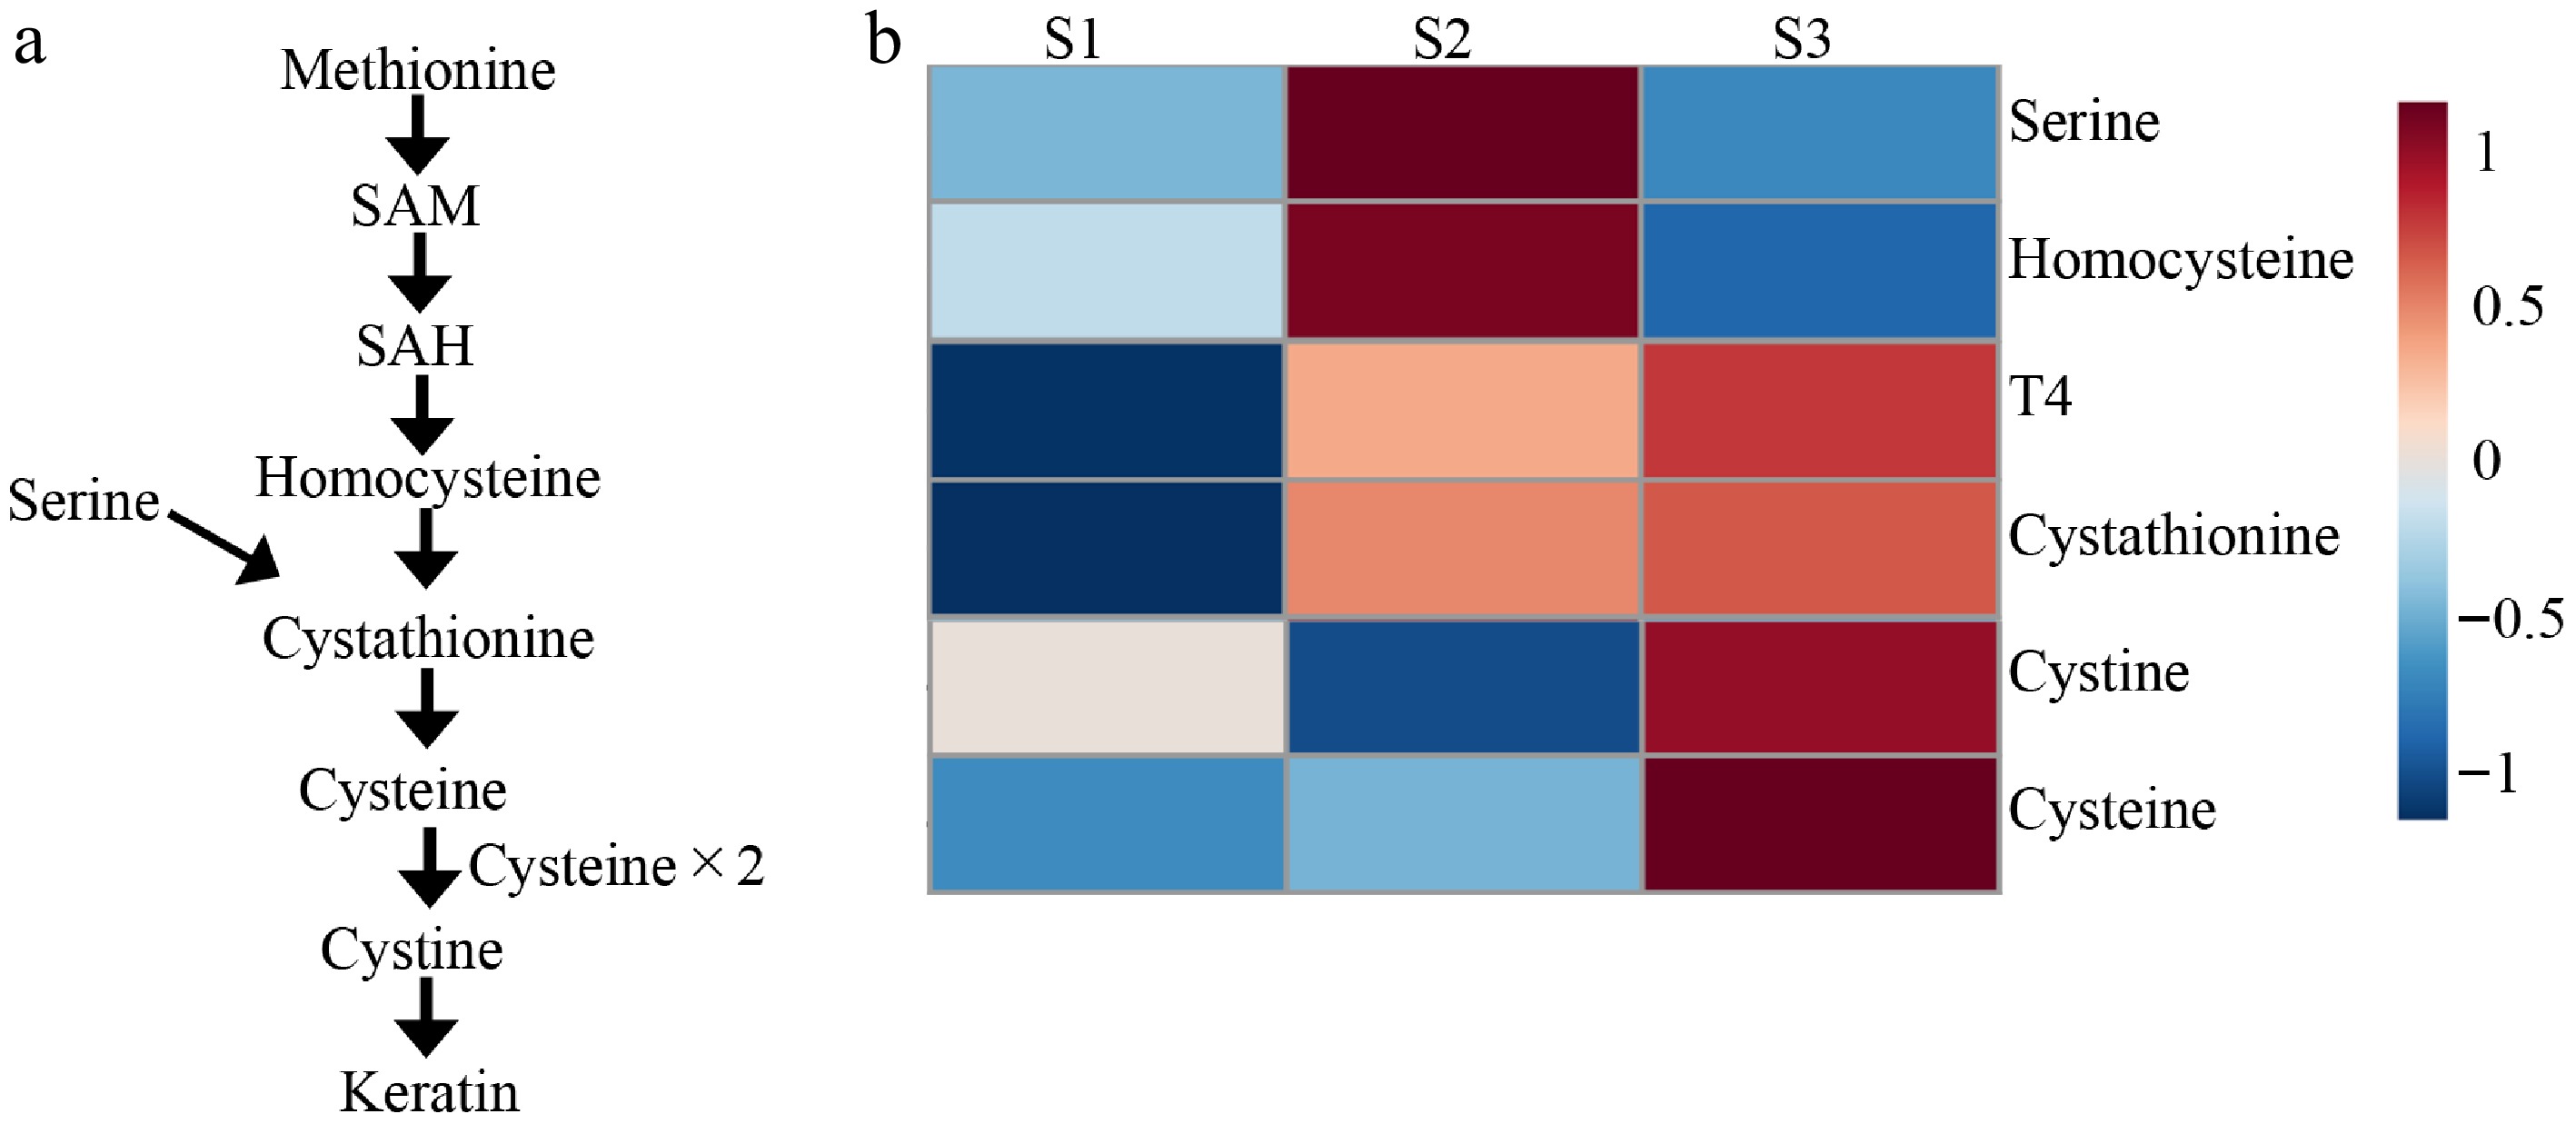
Figure 6.
Overview of the trans-sulfuration pathway and quantitative changes in associated hormone and metabolites across sampling points. (a) Flowchart of the trans-sulfuration pathway. (b) Heatmap showing the relative abundances of metabolites and hormones involved in the trans-sulfuration pathway across sampling points (S1–S3). Red colors indicate high values and blue colors indicate lower values.
-
Individual data Sampling date Name Age
(2021)Sex S1 S2 S3 S4 S5 P1 0 Male 2021/4/26 2021/5/15 2021/5/29 2021/6/11 2021/6/25 P2 0 Male 2021/4/26 2021/5/31 2021/6/11 2021/6/25 2021/7/12 P3 7 Male 2021/5/8 2021/8/16 2021/8/28 2021/9/11 2021/9/25 P4 8 Male 2021/4/15 2021/7/8 2021/7/19 2021/8/2 2021/8/16 P5 19 Male 2021/4/20 2021/7/27 2021/8/10 2021/8/24 2021/9/7 Table 1.
Sample information (ages indicate those at the time of the experiment in 2021).
-
Group Unit S1 S2 S3 S4 S5 Ht % 46.2 ± 0.9 41.0 ± 1.1 36.0 ± 0.9 41.4 ± 1.2 42.8 ± 0.9 Red blood cells /μL 1.9 ± 0.1 1.6 ± 0.1 1.6 ± 0.1 1.9 ± 0.0 1.8 ± 0.1 White blood cells /μL 25.4 ± 15.1 33.5 ± 17.7 30.5 ± 15.6 19.1 ± 9.3 35.4 ± 19.0 Total protein amount g/dL 5.0 ± 0.1 5.2 ± 0.2 5.3 ± 0.3 4.9 ± 0.4 4.8 ± 0.2 Albumin g/dL 1.7 ± 0.0 1.7 ± 0.0 1.7 ± 0.0 1.6 ± 0.0 1.5 ± 0.1 Albumin/Globulin ratio 0.5 ± 0.0 0.5 ± 0.0 0.5 ± 0.0 0.5 ± 0.0 0.5 ± 0.0 Creatine kinase U/I 276.6 ± 32.9 356.2 ± 65.4 335.2 ± 33.6 328.8 ± 34.6 352.4 ± 53.3 Lactate Dehydrogenase (LD) U/I 229.8 ± 19.9 279.8 ± 29.5 296.4 ± 16.6 285.4 ± 25.3 281.2 ± 11.2 Alkaline Phosphatase (ALP) U/I 105.4 ± 20.9 78.2 ± 11.3 93.2 ± 11.9 115.0 ± 13.8 111.4 ± 12.7 Gamma-glutamyl transferase U/I 2.8 ± 0.2 2.6 ± 0.2 4.0 ± 0.7 3.0 ± 0.0 3.2 ± 0.7 Amylase U/I 2,241.0 ± 152.6 2,823.4 ± 198.8 3,235.2 ± 321.1 2,633.6 ± 204.8 2,327.2 ± 173.5 Creatinine mg/dL 0.1 ± 0.1 0.1 ± 0.0 0.1 ± 0.0 0.1 ± 0.0 0.1 ± 0.0 Uric acid mg/dL 7.7 ± 1.5 6.8 ± 1.6 5.3 ± 0.7 7.2 ± 0.5 8.3 ± 0.8 Urea nitrogen mg/dL 3.1 ± 0.3 3.0 ± 0.3 2.5 ± 0.2 2.9 ± 0.2 3.1 ± 0.1 Triglycerides mg/dL 39.2 ± 4.6 67.2 ± 11.3 81.0 ± 3.1 56.2 ± 5.9 42.4 ± 3.9 Total cholesterol mg/dL 204 ± 6.8 178 ± 13.9 192 ± 13.1 212 ± 15.2 205 ± 9.0 Sodium µmol/L 155 ± 0.5 154 ± 1.0 153 ± 0.6 153 ± 1.4 154 ± 0.8 Potassium mEq/L 4.2 ± 0.2 4.3 ± 0.3 5.6 ± 1.0 5.8 ± 0.9 5.1 ± 1.2 Chloride (Cl) mEq/L 115 ± 1.1 114 ± 0.8 112 ± 0.2 113 ± 0.9 115 ± 0.8 Magnesium mEq/L 2.7 ± 0.0 3.0 ± 0.2 3.4 ± 0.2 3.5 ± 0.2 3.1 ± 0.4 Calcium mg/dL 10.5 ± 0.1 11.1 ± 0.1 11.4 ± 0.1 10.9 ± 0.2 10.2 ± 0.2 Inorganic phosphorus mg/dL 1.8 ± 0.3 3.4 ± 0.5 4.0 ± 0.7 3.4 ± 0.5 2.5 ± 0.8 Serum iron mg/dL 80.6 ± 2.8 91.6 ± 4.8 107 ± 9.5 89.8 ± 12.2 95.0 ± 13.9 T3 µg/dL 1.9 ± 0.4 2.7 ± 0.9 2.4 ± 0.7 1.9 ± 0.2 2.0 ± 0.4 T4 ng/mL 2.7 ± 0.4 4.5 ± 0.7 5.0 ± 0.5 2.6 ± 0.4 2.7 ± 0.2 Corticosterone pg/mL 1.2 ± 0.3 0.4 ± 0.2 0.9 ± 0.4 1.0 ± 0.2 1.2 ± 0.2 Table 2.
Blood biochemical analysis. Values are shown as mean ± standard error. The results, except for corticosterone, were measured by an external laboratory.
Figures
(6)
Tables
(2)