


-
Molting is a physiological process in birds involving the periodic replacement of feathers[1]. In penguins, which are highly adapted to marine life, feathers serve multiple functions, including waterproofing, insulation, and buoyancy[2]. The tightly packed, overlapping feathers provide both thermal insulation and water resistance, thereby enhancing hydrodynamic efficiency during swimming[3].
Because feathers gradually wear out over time, they must be completely replaced during the molting period. However, since feather loss temporarily compromises waterproofing and insulation, penguins typically undergo a fasting molt on land. Prior to molting, they accumulate substantial energy reserves through hyperphagia[4], enabling them to complete a full-body molt within a remarkably short period compared with most avian species. In nature, molting in many penguin species occurs during the summer following the breeding season.
The Humboldt penguin (Spheniscus humboldti) is a medium-sized penguin, measuring 67 to 72 cm in length and weighing approximately 4.2 to 5.0 kg[5]. They inhabit the coastal regions from Isla Foca in Peru to the Puñihuil Islands in Chile[6]. Although listed as an endangered species, population estimates vary widely among reports. For instance, an average of 4,425 individuals was reported in Peru in 2000[7], whereas a later survey in 2013 identified 73 breeding colonies between Isla La Foca (5°12' S, 81°12' W) and Metalqui Island (42°12' S, 74°09' W), suggesting that the total population could reach up to 60,000 individuals if the maximum colony sizes are assumed[6]. These discrepancies may reflect underestimation in earlier reports, but accurate population monitoring remains challenging. Consequently, the species continues to be classified as endangered and declining in the IUCN Red List (2020)[8].
Although wild penguin populations are declining globally, Humboldt penguins have achieved stable breeding success in captivity[3]. Among the penguin species kept in zoological institutions, S. humboldti is one of the most frequently bred species. Long-term captive populations enable controlled observations and physiological monitoring, providing valuable opportunities for research into penguin biology. Previous studies have focused primarily on reproduction under captive conditions, but physiological studies related to molting remain limited[3]. Because molting has not been directly associated with reproductive success or conservation outcomes, it has received comparatively little attention. Nevertheless, the availability of stable captive colonies allows for detailed longitudinal observations, making them ideal models for elucidating the physiological mechanisms underlying molting.
Earlier studies have reported that body weight sharply increases before molting, accompanied by a peak in thyroid hormone secretion[9]. Circulating thyroxine (T4) levels rise at the onset of molting, whereas triiodothyronine (T3) levels remain relatively constant, suggesting that T4 contributes to feather growth[3]. In contrast, increased T3 levels have been observed during periods of thermal stress when penguins' insulation is reduced, implying that T3 may be more closely involved in thermoregulation and energy metabolism than T4[3]. Additionally, corticosterone levels have been reported to rise toward the end of molting in king penguins (Aptenodytes patagonicus)[10], though follow-up studies are scarce, and the endocrine mechanisms regulating penguin molting remain largely unresolved.
The present study aimed to investigate the basic physiological and endocrine parameters associated with molting in captive Humboldt penguins in Japan. Specifically, we measured body weight and circulating concentrations of thyroid hormones (T4 and T3) and corticosterone to characterize their temporal dynamics during the molting cycle. Furthermore, by performing serum metabolomic profiling using gas chromatography–mass spectrometry (GC–MS), we sought to identify metabolic changes associated with endocrine fluctuations. This integrated approach provides new insights into the physiological regulation of molting and its implications for stress and energy metabolism in penguins.
-
Blood samples were collected from five male Humboldt penguins (Spheniscus humboldti) housed at the Enoshima Aquarium (Fujisawa, Kanagawa, Japan). The penguins were 0–19 years old and clinically healthy. The colony consisted of a single species, with both males and females maintained together in an indoor enclosure. Each individual was fitted with a colored wing tag for identification. Routine health examinations, including blood sampling, are conducted regularly by the facility's veterinary staff as part of animal health management. This study utilized residual serum samples obtained from those routine medical checkups, without performing any additional invasive procedures for research purposes.
To monitor physiological changes associated with molting, five sampling points were defined: Pre-molting (S1), the first day of feather shedding (S2, defined as the onset of the molt), the day the last feather fell out (S3, defined as completion of the molt), and two post-molting stages at 14 days (S4) and 28 days (S5) after the molt's completion (Fig. 1, Table 1). Molting occurred spontaneously and normally between May and August, lasting approximately 10–14 days. The average room temperature during the experimental period was 21.7 ± 1.7 °C, and the average water temperature was 21.8 ± 1.9 °C. Throughout the period, these temperatures were maintained between 17 and 25 °C (Supplementary Table S1).
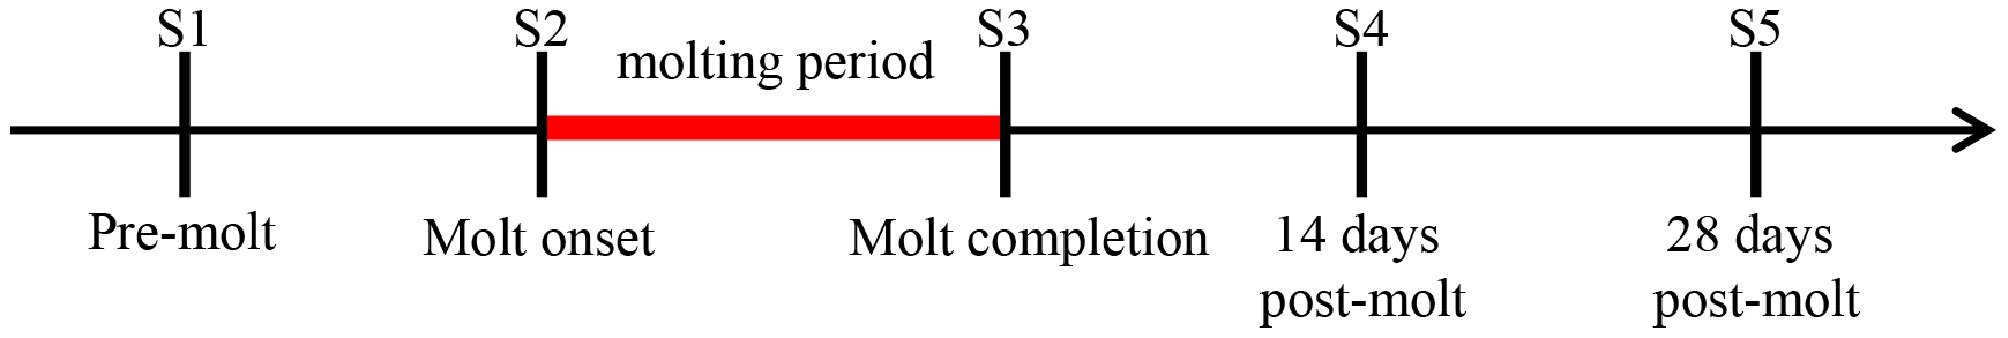
Figure 1.
Experimental design of molting schedule and sample collection (blood sampling) schedule. To monitor the physiological changes associated with molting, five sampling points were defined: pre-molting (S1), the first day of feather shedding (S2, defined as onset of the molt), the day the last feather fell out (S3, defined as completion of the molt), and two post-molting stages at 14 days (S4) and 28 days (S5) after the molt's completion.
Table 1. Sample information (ages indicate those at the time of the experiment in 2021).
Individual data Sampling date Name Age
(2021)Sex S1 S2 S3 S4 S5 P1 0 Male 2021/4/26 2021/5/15 2021/5/29 2021/6/11 2021/6/25 P2 0 Male 2021/4/26 2021/5/31 2021/6/11 2021/6/25 2021/7/12 P3 7 Male 2021/5/8 2021/8/16 2021/8/28 2021/9/11 2021/9/25 P4 8 Male 2021/4/15 2021/7/8 2021/7/19 2021/8/2 2021/8/16 P5 19 Male 2021/4/20 2021/7/27 2021/8/10 2021/8/24 2021/9/7 In wild Humboldt penguins, molting is accompanied by fasting[3]. However, in this facility, the penguins were fed according to their voluntary feeding behavior, allowing limited food intake during the molting period. Part of each blood sample was used for routine biochemical testing, and the remainder was centrifuged to obtain serum, which was then stored at −80 °C until further analysis.
Metabolomic analysis
-
Untargeted metabolomic profiling of the serum samples was conducted GC–MS), following previously established methods[11,12]. The analytical procedure was as follows. Serum samples were filtered through a 0.2-µm membrane filter (ADVANTEC®, Toyo Roshi Kaisha, Ltd., Tokyo, Japan). A 50-µL aliquot of the filtrate was mixed with 2-isopropylmalic acid (1 mg/mL) as an internal standard and 250 µL of a methanol–ultrapure water–chloroform mixture (2.5:1:1, v/v/v). The mixture was incubated in a shaker at 12,000 rpm for 30 min, followed by centrifugation at 16,000 × g for 5 min at 4 °C.
A 225-µL aliquot of the supernatant was collected, mixed with 200 µL of ultrapure water, and centrifuged again under the same conditions. The resulting supernatant (250 µL) was evaporated under a vacuum for 20 min and freeze-dried at −80 °C for 16 h. The dried residue was dissolved in 40 µL of 20 mg/mL anhydrous pyridine and shaken at 37 °C for 90 min. Subsequently, 20 µL of N-methyl-N-trimethylsilyl trifluoroacetamide (MSTFA; Thermo Fisher Scientific, Waltham, MA, USA) was added for derivatization at 37 °C for 45 min. One microliter of each derivatized sample was injected into the GC–MS system (GCMS QP2020 NX, Shimadzu Corporation, Kyoto, Japan). Metabolites were identified using MS-DIAL ver. 4.90 software, utilizing the Shimadzu Smart Metabolite Database (method file: OA_TMS_DB5_37min_V3_Scan). Identification parameters included a mass range of 45–600 Da, retention index tolerance of 20, mass tolerance of 0.5 Da, and an Electron Ionization (EI) similarity and identification score cutoff of 70%[12].
Blood biochemical analysis
-
Hematocrit values were measured by transferring blood collected in Ethylenediaminetetraacetic acid (EDTA) tubes into hematocrit tubes and centrifuging the samples at 16,000 g for 3 min[13]. Red blood cells and white blood cells were diluted using Natt–Herrick solution, stained, and counted under a microscope[14,15]. The remaining blood biochemistry tests were outsourced to a private laboratory (Showa Medical Science, Tokyo, Japan).
Hormone assay
-
Serum hormone concentrations were determined using enzyme-linked immunosorbent assays (ELISAs). Serum samples were filtered through a 0.2-µm membrane filter. Each 100 µL of serum was mixed with 300 µL of 1% bovine serum albumin (BSA) solution and extracted with 2 mL of diethyl ether by intermittent vortexing for 3 min. The organic phase was collected after rapid cooling, and residual moisture was removed by evaporation.
The dried extracts were reconstituted with 400 µL of the assay buffer, vortexed for 3 min, and allowed to stand for 5 min; this procedure was repeated twice. Hormone quantification was performed using a commercial Corticosterone ELISA kit (96 × 5; Enzo Life Sciences, Farmingdale, NY, USA).
Standard curves were prepared using seven serial dilutions (10,000–156.25 pg/mL). After equilibration to room temperature, 100 µL of the sample or control was added to each well, followed by 50 µL of the assay buffer, 50 µL of the conjugate, and 50 µL of the antibody (except in Non-Specific Binding [NSB] wells). The plate was incubated at room temperature for 2 h with shaking at 500 rpm. After incubation, the wells were washed three times with 400 µL of a wash buffer, followed by the addition of 200 µL of a p-Nitrophenylphosphate (pNPP) substrate solution and incubation for 1 h at room temperature. The reaction was terminated with 50 µL of a stop solution, and absorbance was measured using a microplate reader (AZ ONE MPR-A100, Japan).
Statistical analysis
-
Data were analyzed using MetaboAnalyst 6.0, R (v4.4.3) and GraphPad Prism 9. Log transformation and autoscaling were applied using MetaboAnalyst's normalization module. Principal component analysis (PCA) was performed to visualize sample distribution. Metabolites that were significantly different over time were defined using one-way analysis of variance (ANOVA), with a statistical significance level set at q < 0.05. Heatmap clustering was conducted using the Ward method based on the Spearman correlation index in MetaboAnalyst. Correlation analysis was performed using Pearson's correlation coefficient, and the statistical significance level for substances involved in the correlation was set at p < 0.05.
-
Temporal changes in body weight, food intake, and thyroxine (T4), triiodothyronine (T3), and corticosterone concentrations are shown in Fig. 2. These results were assessed using Bonferroni's multiple comparisons test, revealing significant differences in body weight, food intake, and T4 levels during the molting period. Additional hematological and biochemical parameters are summarized in Table 2. Body weight increased markedly until the onset of molting (S2) and then gradually decreased toward the end of the molt (S3), although complete fasting did not occur in the captive environment (Fig. 2). Serum T4 concentration also peaked at the onset of molting but, unlike body weight, remained elevated until the completion of molting. In contrast, no significant change was observed in T3 levels throughout the sampling period. Similarly, corticosterone concentration exhibited no apparent change, indicating that molting was not accompanied by a marked increase in the secretion of stress-related hormones under the conditions of this study.
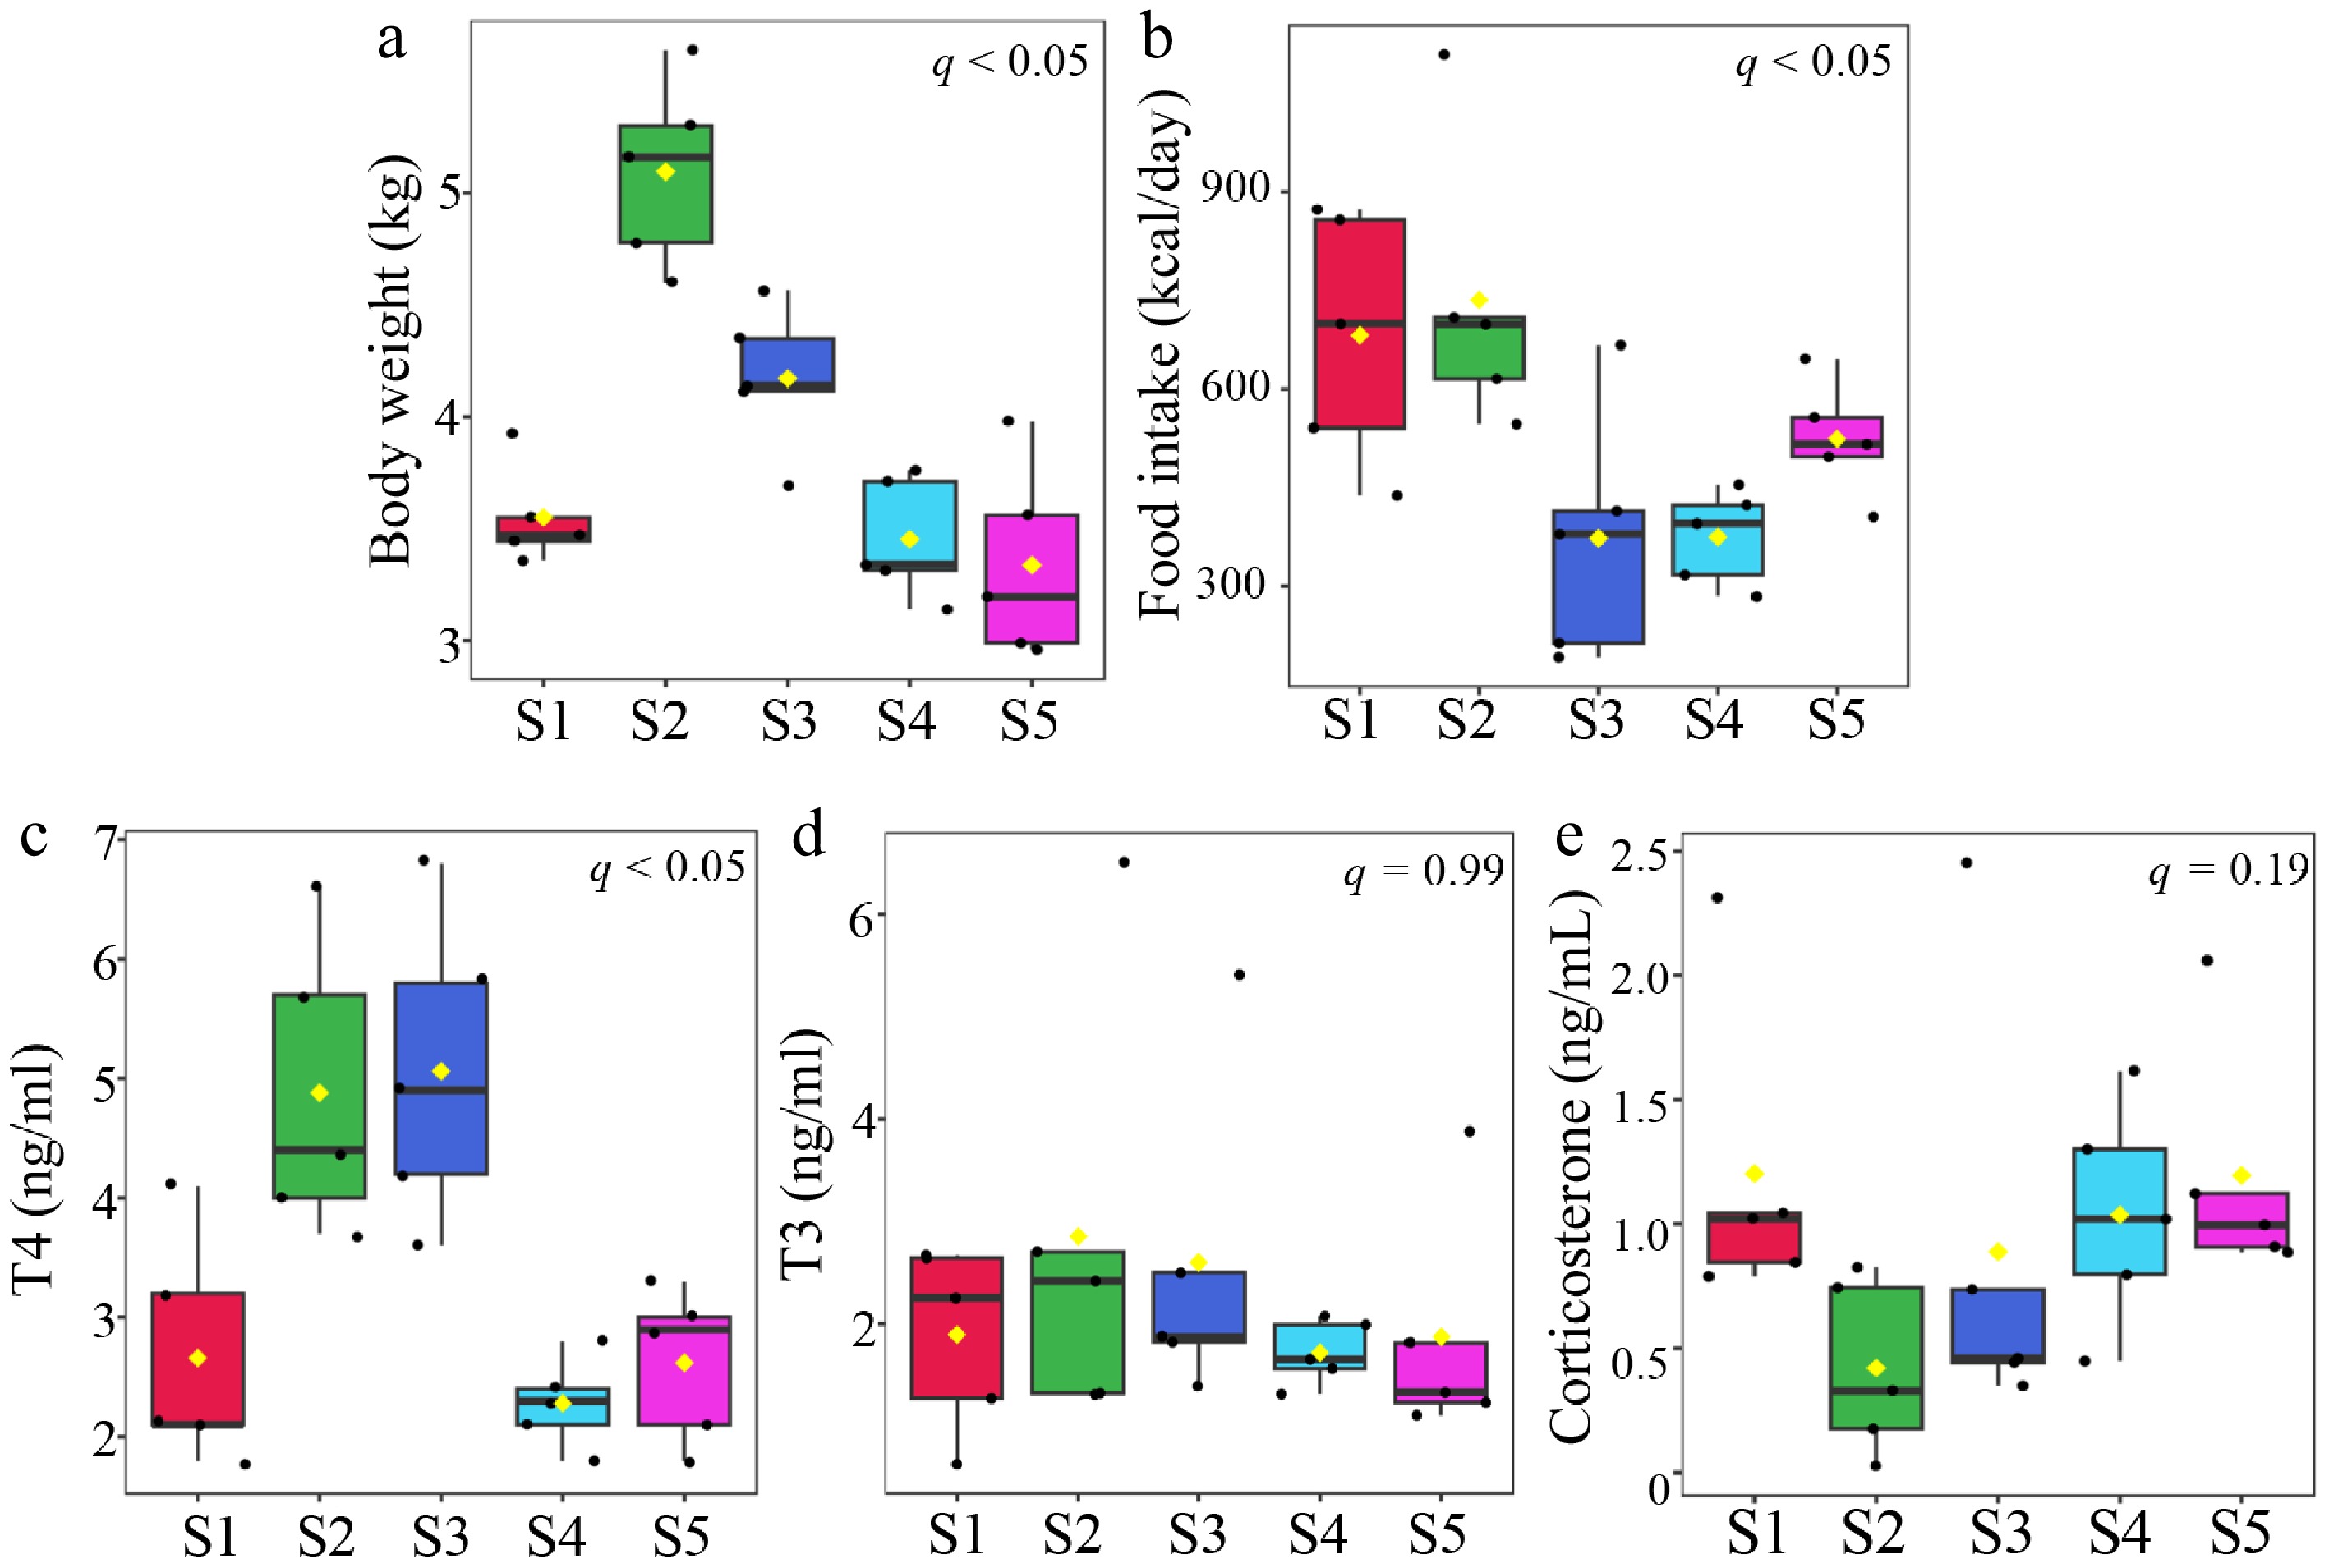
Figure 2.
Changes in body weight, food intake, and key hormone concentrations across sampling points. (a) Body weight and (b) food intake measured across sampling points. Serum concentrations of the three hormones (c) T4, (d) T3, and (e) corticosterone, assessed at the same time points. Data are presented as box plots. Statistical differences among time points were evaluated using ANOVA, and significant differences are indicated in the figures (q < 0.05).
Table 2. Blood biochemical analysis. Values are shown as mean ± standard error. The results, except for corticosterone, were measured by an external laboratory.
Group Unit S1 S2 S3 S4 S5 Ht % 46.2 ± 0.9 41.0 ± 1.1 36.0 ± 0.9 41.4 ± 1.2 42.8 ± 0.9 Red blood cells /μL 1.9 ± 0.1 1.6 ± 0.1 1.6 ± 0.1 1.9 ± 0.0 1.8 ± 0.1 White blood cells /μL 25.4 ± 15.1 33.5 ± 17.7 30.5 ± 15.6 19.1 ± 9.3 35.4 ± 19.0 Total protein amount g/dL 5.0 ± 0.1 5.2 ± 0.2 5.3 ± 0.3 4.9 ± 0.4 4.8 ± 0.2 Albumin g/dL 1.7 ± 0.0 1.7 ± 0.0 1.7 ± 0.0 1.6 ± 0.0 1.5 ± 0.1 Albumin/Globulin ratio 0.5 ± 0.0 0.5 ± 0.0 0.5 ± 0.0 0.5 ± 0.0 0.5 ± 0.0 Creatine kinase U/I 276.6 ± 32.9 356.2 ± 65.4 335.2 ± 33.6 328.8 ± 34.6 352.4 ± 53.3 Lactate Dehydrogenase (LD) U/I 229.8 ± 19.9 279.8 ± 29.5 296.4 ± 16.6 285.4 ± 25.3 281.2 ± 11.2 Alkaline Phosphatase (ALP) U/I 105.4 ± 20.9 78.2 ± 11.3 93.2 ± 11.9 115.0 ± 13.8 111.4 ± 12.7 Gamma-glutamyl transferase U/I 2.8 ± 0.2 2.6 ± 0.2 4.0 ± 0.7 3.0 ± 0.0 3.2 ± 0.7 Amylase U/I 2,241.0 ± 152.6 2,823.4 ± 198.8 3,235.2 ± 321.1 2,633.6 ± 204.8 2,327.2 ± 173.5 Creatinine mg/dL 0.1 ± 0.1 0.1 ± 0.0 0.1 ± 0.0 0.1 ± 0.0 0.1 ± 0.0 Uric acid mg/dL 7.7 ± 1.5 6.8 ± 1.6 5.3 ± 0.7 7.2 ± 0.5 8.3 ± 0.8 Urea nitrogen mg/dL 3.1 ± 0.3 3.0 ± 0.3 2.5 ± 0.2 2.9 ± 0.2 3.1 ± 0.1 Triglycerides mg/dL 39.2 ± 4.6 67.2 ± 11.3 81.0 ± 3.1 56.2 ± 5.9 42.4 ± 3.9 Total cholesterol mg/dL 204 ± 6.8 178 ± 13.9 192 ± 13.1 212 ± 15.2 205 ± 9.0 Sodium µmol/L 155 ± 0.5 154 ± 1.0 153 ± 0.6 153 ± 1.4 154 ± 0.8 Potassium mEq/L 4.2 ± 0.2 4.3 ± 0.3 5.6 ± 1.0 5.8 ± 0.9 5.1 ± 1.2 Chloride (Cl) mEq/L 115 ± 1.1 114 ± 0.8 112 ± 0.2 113 ± 0.9 115 ± 0.8 Magnesium mEq/L 2.7 ± 0.0 3.0 ± 0.2 3.4 ± 0.2 3.5 ± 0.2 3.1 ± 0.4 Calcium mg/dL 10.5 ± 0.1 11.1 ± 0.1 11.4 ± 0.1 10.9 ± 0.2 10.2 ± 0.2 Inorganic phosphorus mg/dL 1.8 ± 0.3 3.4 ± 0.5 4.0 ± 0.7 3.4 ± 0.5 2.5 ± 0.8 Serum iron mg/dL 80.6 ± 2.8 91.6 ± 4.8 107 ± 9.5 89.8 ± 12.2 95.0 ± 13.9 T3 µg/dL 1.9 ± 0.4 2.7 ± 0.9 2.4 ± 0.7 1.9 ± 0.2 2.0 ± 0.4 T4 ng/mL 2.7 ± 0.4 4.5 ± 0.7 5.0 ± 0.5 2.6 ± 0.4 2.7 ± 0.2 Corticosterone pg/mL 1.2 ± 0.3 0.4 ± 0.2 0.9 ± 0.4 1.0 ± 0.2 1.2 ± 0.2 Metabolomic changes during the molting period
-
To identify metabolites significantly associated with molting, false discovery rate (FDR) analysis was applied. Untargeted GC–MS-based metabolomic analysis and PCA revealed that samples collected during the molting period exhibited a distinct metabolic profile compared with those from nonmolting stages (Fig. 3a). This result suggests that characteristic metabolic alterations occurred specifically during molting. the ANOVA identified 14 metabolites that changed significantly (q < 0.05) across time points (Fig. 3b, Supplementary Table S2). Among these, the most pronounced variations were observed in L-cystathionine, followed by 4-hydroxyproline and D-maltose. These metabolites are mainly associated with amino acid metabolism and energy-related pathways.
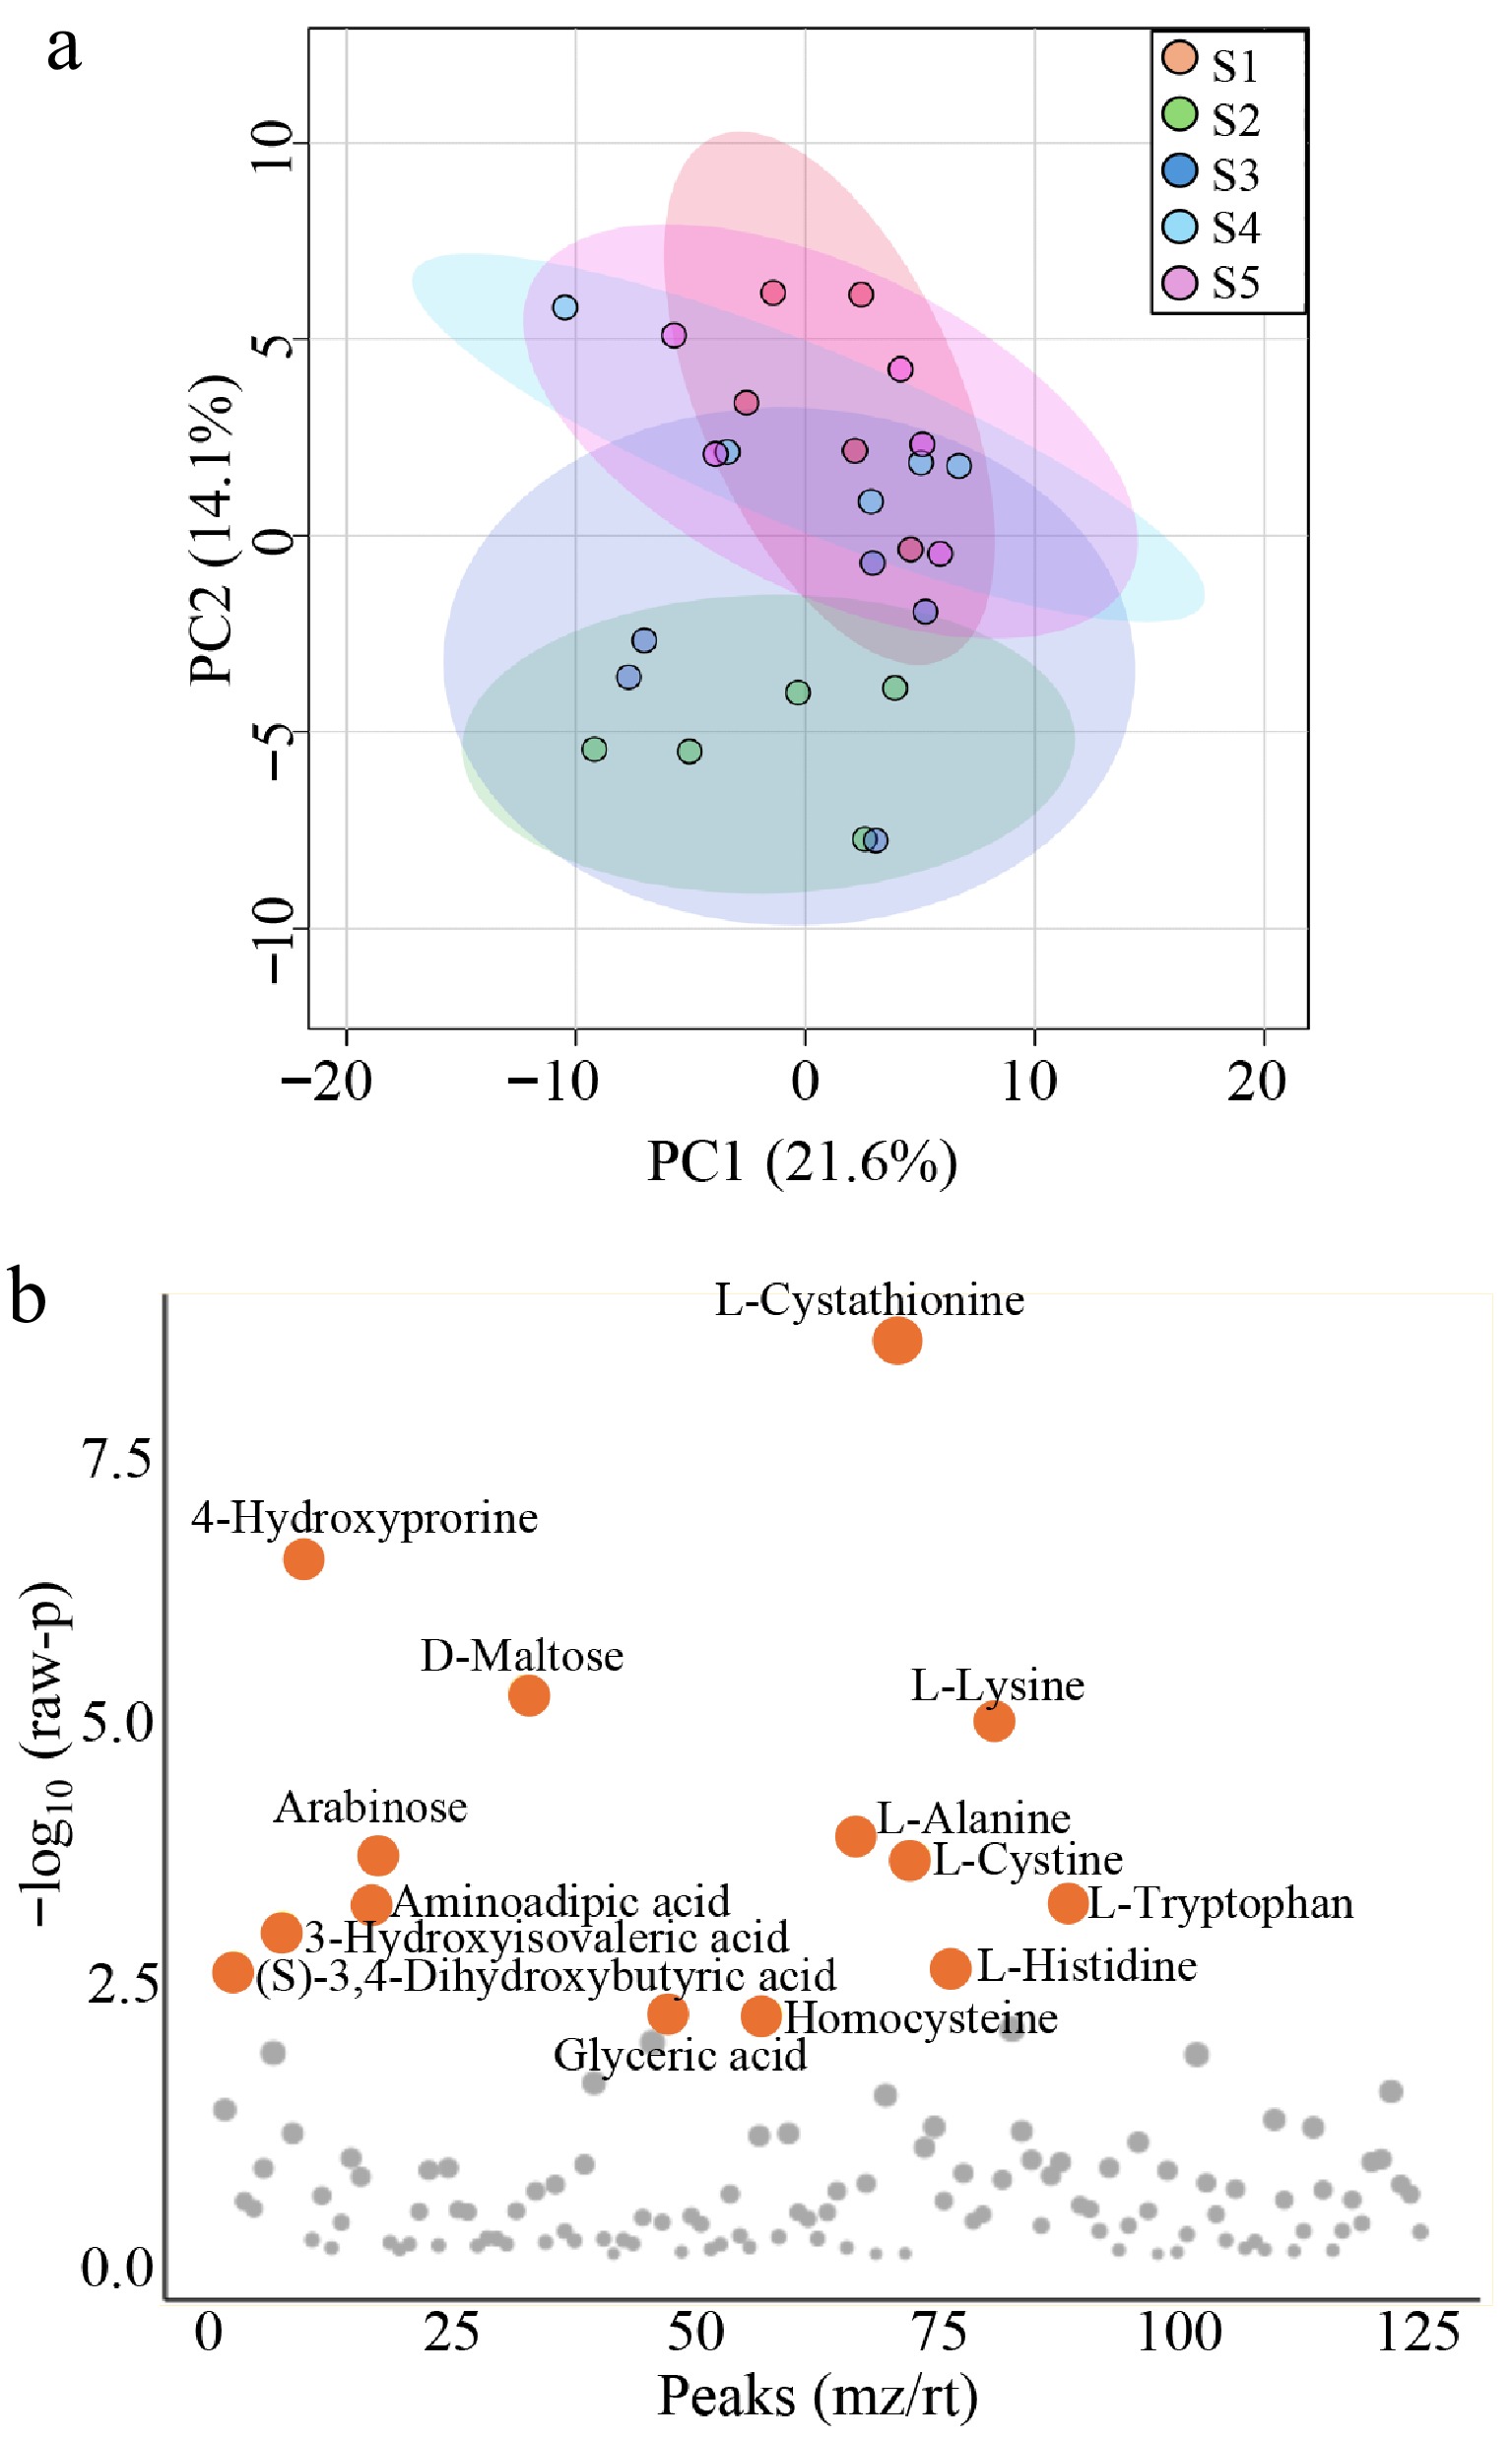
Figure 3.
Multivariate and univariate analysis of metabolomic profiles. (a) PCA score plot showing the overall metabolic profiles between groups of sampling points. The scatter plot displays the first two principal components (PC1 and PC2), with each point representing an individual sample. Red, green, blue, light blue, and pink points indicate S1, S2, S3, S4, and S5, respectively. (b) Result of ANOVA identifying metabolites with significant differences between groups of sampling points. Orange dots indicate significant differences, q < 0.05.
Correlation between body weight, T4, and serum metabolites
-
Serum metabolites that showed correlations with changes in body weight during the molting period are presented in Supplementary Table S3. The top five metabolites exhibiting the strongest correlations with body weight are shown in Fig. 4. Lysine, calcium, cholesterol, cystathionine, and hydroxyproline showed significantly strong correlations with changes in body weight.
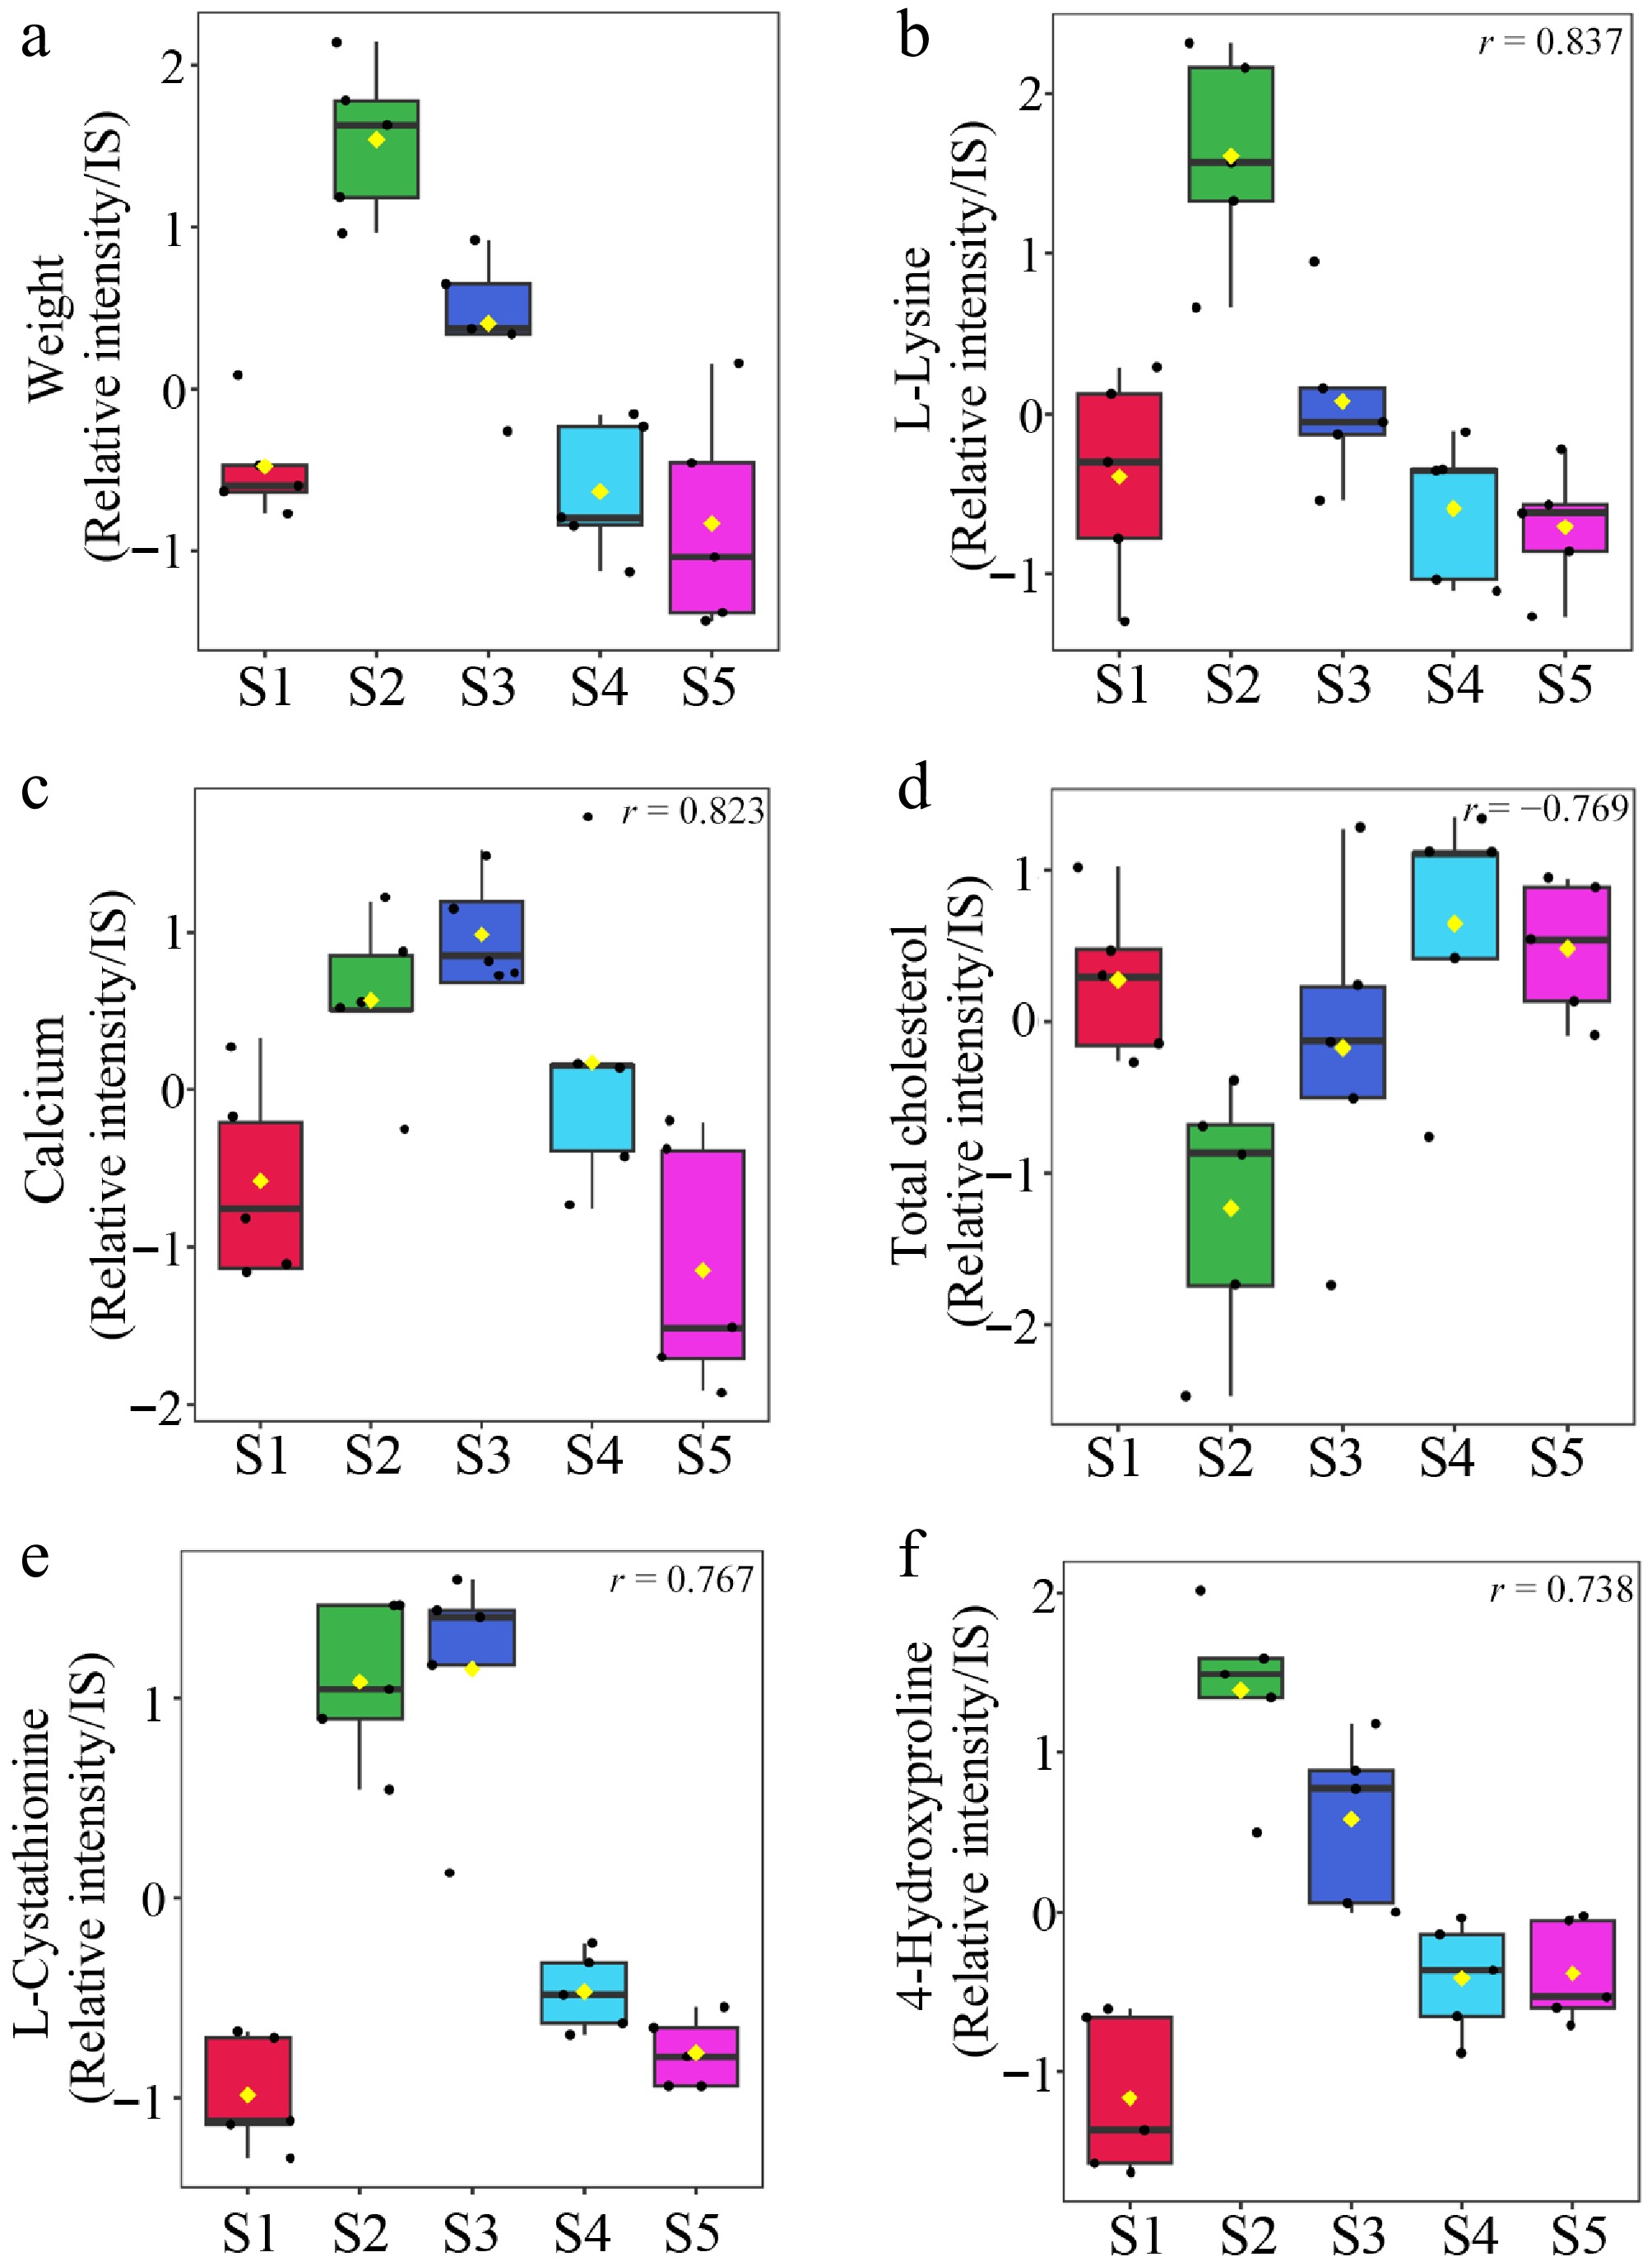
Figure 4.
Changes in body weight-associated metabolites across sampling points. The five metabolites most strongly correlated with body weight changes were selected. (a) Body weight measured across sampling points. Serum metabolites (b) L-lysine, (c) calcium, (d) total cholesterol, (e) L-cystathionine, and (f) 4-hydroxy proline assessed at the same time points. Data are presented as box plots, and each value is represented as a relative value normalized to the internal standard peak intensity. Significant differences (p < 0.05) in all five selected substances are shown in the figure.
Serum metabolites that showed correlations with changes in circulating T4 levels during the molting period are presented in Supplementary Table S4. The top five metabolites exhibiting the strongest correlations with T4 are shown in Fig. 5. Cystathionine, triglycerides, methionine, aminoadipic acid, and ornithine showed significantly strong correlations with changes in T4 levels.
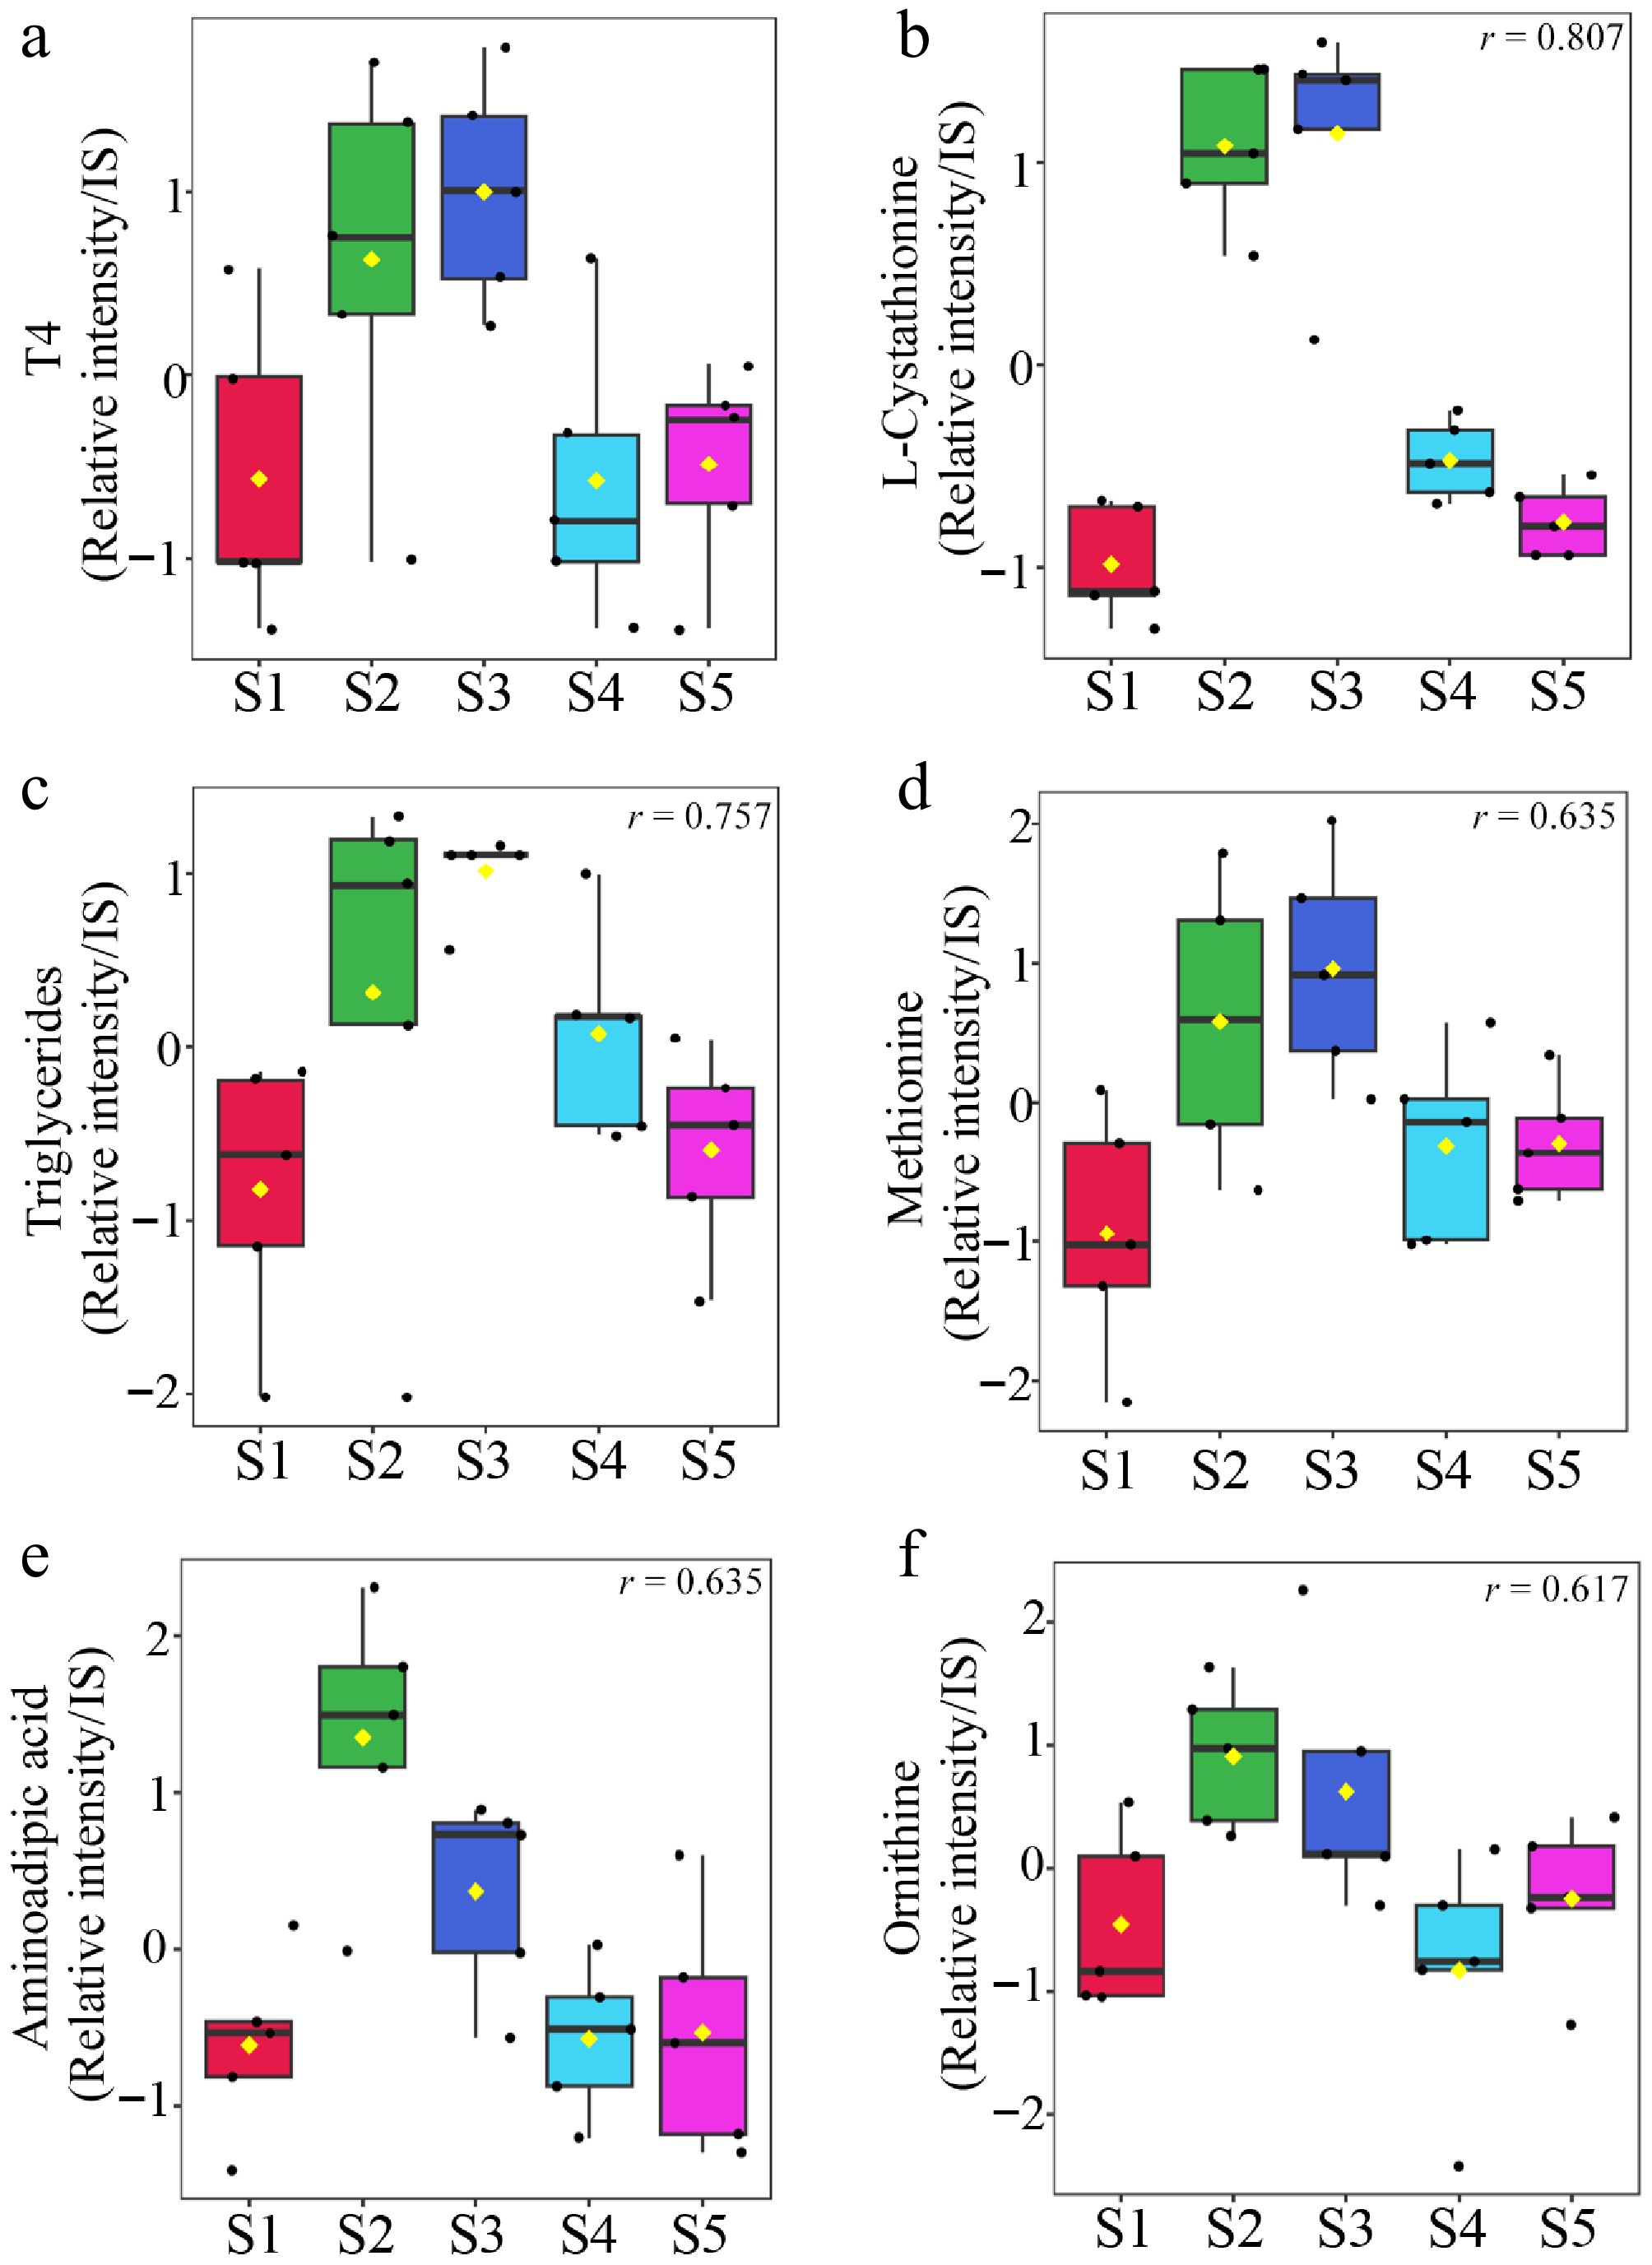
Figure 5.
Changes in T4-associated metabolites across sampling points The five metabolites most strongly correlated with changes in T4 levels were selected. (a) T4 measured across sampling points. Serum metabolites (b) L-cystathionine, (c) triglycerides, (d) methionine, (e) aminoadipic acid, and (f) ornithine assessed at the same time points. Data are presented as box plots, and each value is represented as a relative value normalized to the internal standard peak intensity. Significant differences (p < 0.05) in all five selected substances are shown in the figure.
-
In the present study, body weight and plasma thyroxine (T4) concentrations exhibited characteristic changes during the molting period, consistent with previous reports in penguins[3,9,16−18]. Body weight increased prior to the molt's onset and subsequently declined, reflecting pre-molt energy accumulation followed by energetic expenditure during feather replacement. Circulating T4 concentrations peaked at the molt's onset and remained elevated until its completion. These findings support the established view that T4 plays a central role in initiating and sustaining the molting process.
In contrast, triiodothyronine (T3) concentrations did not show significant temporal changes during the molting cycle. Previous studies describing elevated T3 during molting were primarily conducted in wild or Antarctic penguin species experiencing prolonged fasting and substantial thermal challenges[16−18]. Under such conditions, T3 is considered to facilitate thermogenesis and increased energy expenditure when feather insulation is temporarily compromised. However, the penguins in the present study were maintained in a thermally controlled indoor environment (mean room temperature: 21.7 ± 1.7 °C; water temperature: 21.8 ± 1.9 °C) and were allowed limited voluntary feeding during molting. Therefore, the physiological demand for T3-mediated thermogenic compensation was likely attenuated.
These findings suggest a functional distinction between thyroid hormones during molting. T4 may function primarily as a molt-initiating endocrine signal directly associated with feather regeneration, whereas T3 may play a context-dependent role related to environmental stress adaptation and energy balance. The absence of a significant T3 fluctuation in this study does not indicate a negligible role, but rather reflects modulation by external conditions such as ambient temperature and nutritional status. Moreover, the differential temporal patterns observed between T4 and T3 support the biological specificity of endocrine regulation during molting rather than nonspecific assay variation.
Multivariate metabolomic analysis revealed that the metabolic profile during molting differed markedly from nonmolting phases. Numerous metabolites exhibited dynamic fluctuations, with body weight showing strong correlations with multiple compounds, and T4 displaying distinct relationships, including several negative correlations. In wild penguins, molting is typically accompanied by prolonged fasting[1]; therefore, these metabolic shifts likely reflect nutritional mobilization and the consumption of stored reserves to sustain feather synthesis and thermoregulation.
Among the metabolites positively correlated with body weight, L-lysine is known to play a central role in protein metabolism and biosynthesis[19], whereas maltose has been reported to exert concentration-dependent appetite-suppressing effects in primates[20]. These findings suggest that both lysine and maltose may be actively consumed to support feather synthesis during the fasting-associated molting phase. In this study, however, the penguins were allowed to feed voluntarily, and complete fasting did not occur, implying that these changes might be even more pronounced in wild individuals. Environmental conditions such as nest structure have also been shown to influence carbohydrate metabolism[21], indicating that habitat-related factors may further modulate molting-associated metabolic patterns.
L-cystathionine, which correlated strongly with both body weight and T4, participates in the trans-sulfuration pathway that converts homocysteine to cystine[22,23]. L-cysteine, the precursor of L-cystine, plays vital roles in various biological processes[24,25], particularly in keratin synthesis through the formation of disulfide bonds that confer tensile strength and rigidity[24,25]. Because penguin feathers are keratin-based[26,27] and contain cysteine as a major component[28], these results suggest that activation of the trans-sulfuration pathway contributes to feather formation during molting.
The heatmap analysis based on this pathway (Fig. 6a, b) revealed a stepwise metabolic transition: Upstream metabolites such as homocysteine and serine peaked at S2, and the downstream products cystine and cysteine reached their highest levels at S3. This sequential activation implies that sulfur-containing amino acid metabolism is progressively upregulated as molting advances. These findings complement earlier reports suggesting that T4 promotes feather growth[3], supporting a link between T4 peaks and the keratin synthesis process. However, it remains uncertain whether the rise in T4 at the molt's onset directly triggers specific stages of keratin formation or acts indirectly through metabolic modulation. Detailed time-resolved and molecular analyses are needed to clarify this causal relationship.
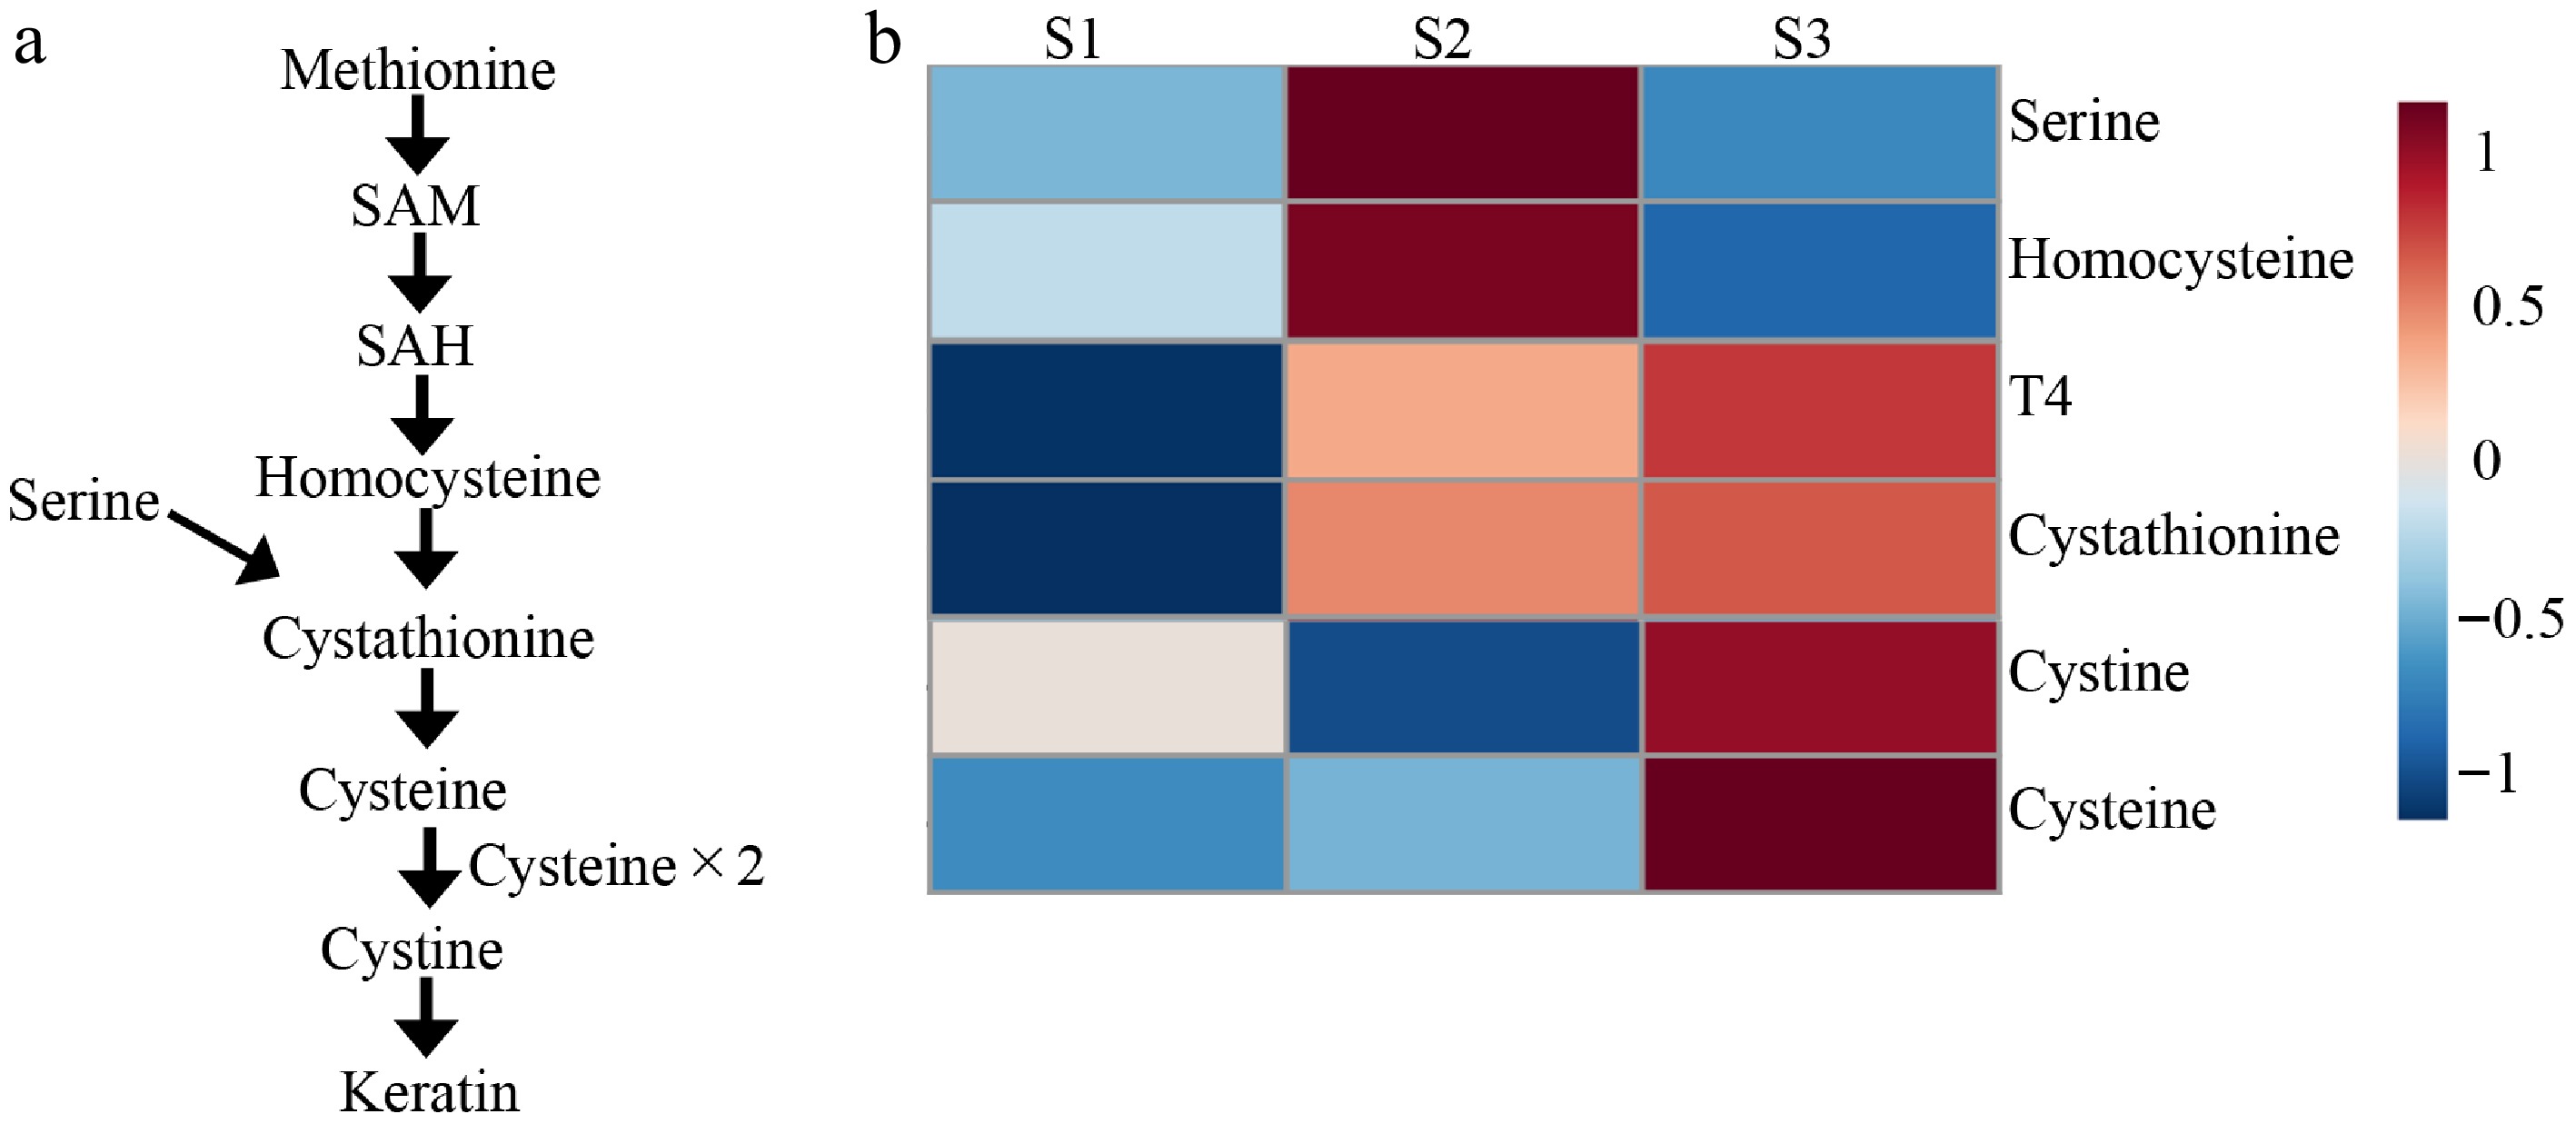
Figure 6.
Overview of the trans-sulfuration pathway and quantitative changes in associated hormone and metabolites across sampling points. (a) Flowchart of the trans-sulfuration pathway. (b) Heatmap showing the relative abundances of metabolites and hormones involved in the trans-sulfuration pathway across sampling points (S1–S3). Red colors indicate high values and blue colors indicate lower values.
Abnormal molting under captive conditions has been reported in several penguin species[29−32]. Such conditions include skipped, prolonged, or incomplete molts, representing temporary disruptions in the normal molting cycle[29−32]. Although the causes remain unclear[29], forced molting has been experimentally induced by administering levothyroxine[31] or feeding bovine thyroid tissue[32]. Considering that cysteine supplementation has been shown to prevent impaired keratin synthesis in vivo[25], providing dietary cysteine during the pre-molting fattening period could potentially stabilize feather replacement and improve molting outcomes in captive penguins.
This study demonstrated a positive correlation between T4 and triglycerides; however, interestingly, the results of previous studies show some variation. For example, studies measuring triglyceride levels in little penguins (Eudyptula minor) on Tasmania Island report a 2.5-fold increase during molting[33], whereas reports on emperor penguins (Aptenodytes forsteri) indicate a decrease in plasma lipids, including triglycerides, during the molting period[34]. King penguins also secure energy through lipid oxidation using their outer skin as a lipid source; reports indicate that during molting, fat oxidation accounted for 85% of their total energy expenditure.[35] Emperor penguins and king penguins inhabiting Antarctica undergo prolonged periods of fasting during both breeding and molting[36], suggesting they may possess unique energy storage systems. Therefore, further accumulation of information and comprehensive consideration accounting for species differences will be necessary regarding the relationship linking fasting, molting, and triglycerides.
Several limitations should be acknowledged. First, the sample size was relatively small (n = 5), reflecting the ethical and logistical constraints of sampling captive penguins. Second, the study population consisted exclusively of males maintained under stable indoor conditions, and extrapolation to wild populations should be approached with caution. Third, although feeding was allowed ad libitum, reduced intake during molting may partially influence metabolic outcomes. Fourth, thyroid hormone measurements were performed using commercially available immunoassays primarily developed for human diagnostics and analyzed by an external clinical laboratory. Although these assays have been used consistently for long-term veterinary monitoring at the facility, species-specific validation (e.g., parallelism testing) was not conducted. Therefore, the absolute hormone concentrations should be interpreted with caution. However, because this study focused on longitudinal within-individual changes across defined molting stages, the relative temporal patterns are considered to be biologically meaningful. Finally, as this was an observational study, causal relationships between endocrine changes and feather synthesis cannot be definitively established.
-
This study provides an integrated view of endocrine and metabolic dynamics during molting in Humboldt penguins. The results indicate that distinct metabolic alterations occur throughout the molting process, many of which are associated with body weight changes and thyroid hormone levels. In particular, T4 appears to play a central role in regulating molting, potentially through modulation of amino acid metabolism, including the trans-sulfuration pathway essential for keratin synthesis.
These findings offer new insights into the physiological mechanisms underlying molting in penguins and highlight potential applications for improving husbandry and nutritional strategies in captive management. Further studies combining molecular, behavioral, and ecological perspectives are warranted to expand our understanding of this critical life history stage.
-
This study was conducted using residual serum samples obtained during routine veterinary health examinations of captive Humboldt penguins at the Enoshima Aquarium. No additional invasive procedures were performed specifically for research purposes. All sampling and animal care were carried out in accordance with the facility's animal welfare policy and under the supervision of the attending veterinarians.
-
The authors confirm their contributions to the paper as follows: conceptualization: Nagaoka K, Shirakata C; resources: Shirakata C; investigation: Ishii N, Terajima T, Miyata S; data curation: Ishii N, Terajima T, Kambe J, Miyata S; supervision: Nagaoka K, Yamamoto Y; writing − original draft: Ishii N; writing − review and editing: Ishii N, Shirakata C, Terajima T, Kambe J, Miyata S, Yamamoto Y, Nagaoka K. All authors reviewed the results and approved the final version of the manuscript.
-
The datasets generated during and analyzed during the current study are available from the corresponding author on reasonable request.
-
We sincerely thank the staff of Enoshima Aquarium for their assistance with animal handling and sample collection. We are also grateful to the members of the Veterinary Physiology Laboratory for their technical support and helpful discussions.
-
The authors declare that they have no conflict of interest.
- Supplementary Table S1 Temperature and feed intake records.
- Supplementary Table S2 Detailed list of one-way ANOVA analysis of variance.
- Supplementary Table S3 List of correlations and p-values with weight.
- Supplementary Table S4 List of colleration and p-value with T4.
- Copyright: © 2026 by the author(s). Published by Maximum Academic Press on behalf of Nanjing Agricultural University. This article is an open access article distributed under Creative Commons Attribution License (CC BY 4.0), visit https://creativecommons.org/licenses/by/4.0/.
-
About this article
Cite this article
Ishii N, Shirakata C, Terajima T, Kambe J, Miyata S, et al. 2026. Endocrine and metabolic dynamics associated with molting in captive male Humboldt penguins (Spheniscus humboldti). Animal Advances 3: e013 doi: 10.48130/animadv-0026-0005 

Endocrine and metabolic dynamics associated with molting in captive male Humboldt penguins (Spheniscus humboldti)
- Received: 25 December 2025
- Revised: 28 February 2026
- Accepted: 16 March 2026
- Published online: 16 April 2026
Abstract: Molting is an energetically demanding physiological process in penguins, requiring substantial metabolic adjustments to replace feathers, which are essential for waterproofing and thermoregulation. This study aimed to elucidate the endocrine and metabolic dynamics associated with molting in captive male Humboldt penguins (Spheniscus humboldti). Five healthy males were serially sampled at five time points from pre- to post-molting. Body weight, serum thyroid hormones (thyroxine, T4; triiodothyronine, T3), and corticosterone were measured, and untargeted metabolomic profiling was performed using gas chromatography–mass spectrometry (GC–MS). Body weight and T4 concentrations peaked at the onset of molt and decreased thereafter, whereas T3 and corticosterone showed no significant changes under the present captive conditions. Principal component and variance analyses revealed distinct metabolic profiles during molting, characterized by significant alterations in amino acid-related metabolites, particularly L-cystathionine, 4-hydroxyproline, and L-lysine. Correlation analysis indicated strong associations between T4 and metabolites involved in the trans-sulfuration pathway, suggesting a potential role of sulfur-containing amino acid metabolism in supporting keratin synthesis during feather regeneration. These findings demonstrate that T4 appears to play a central role in coordinating endocrine and metabolic adaptations during molting, whereas T3 may be influenced by environmental and energetic context. The sequential activation of amino acid metabolism observed in this study provides new insights into the physiological regulation of feather formation in penguins. This integrative approach establishes a foundation for improving captive management and understanding molting biology in endangered seabirds.
-
Key words:
- Metabolome /
- Molting