-
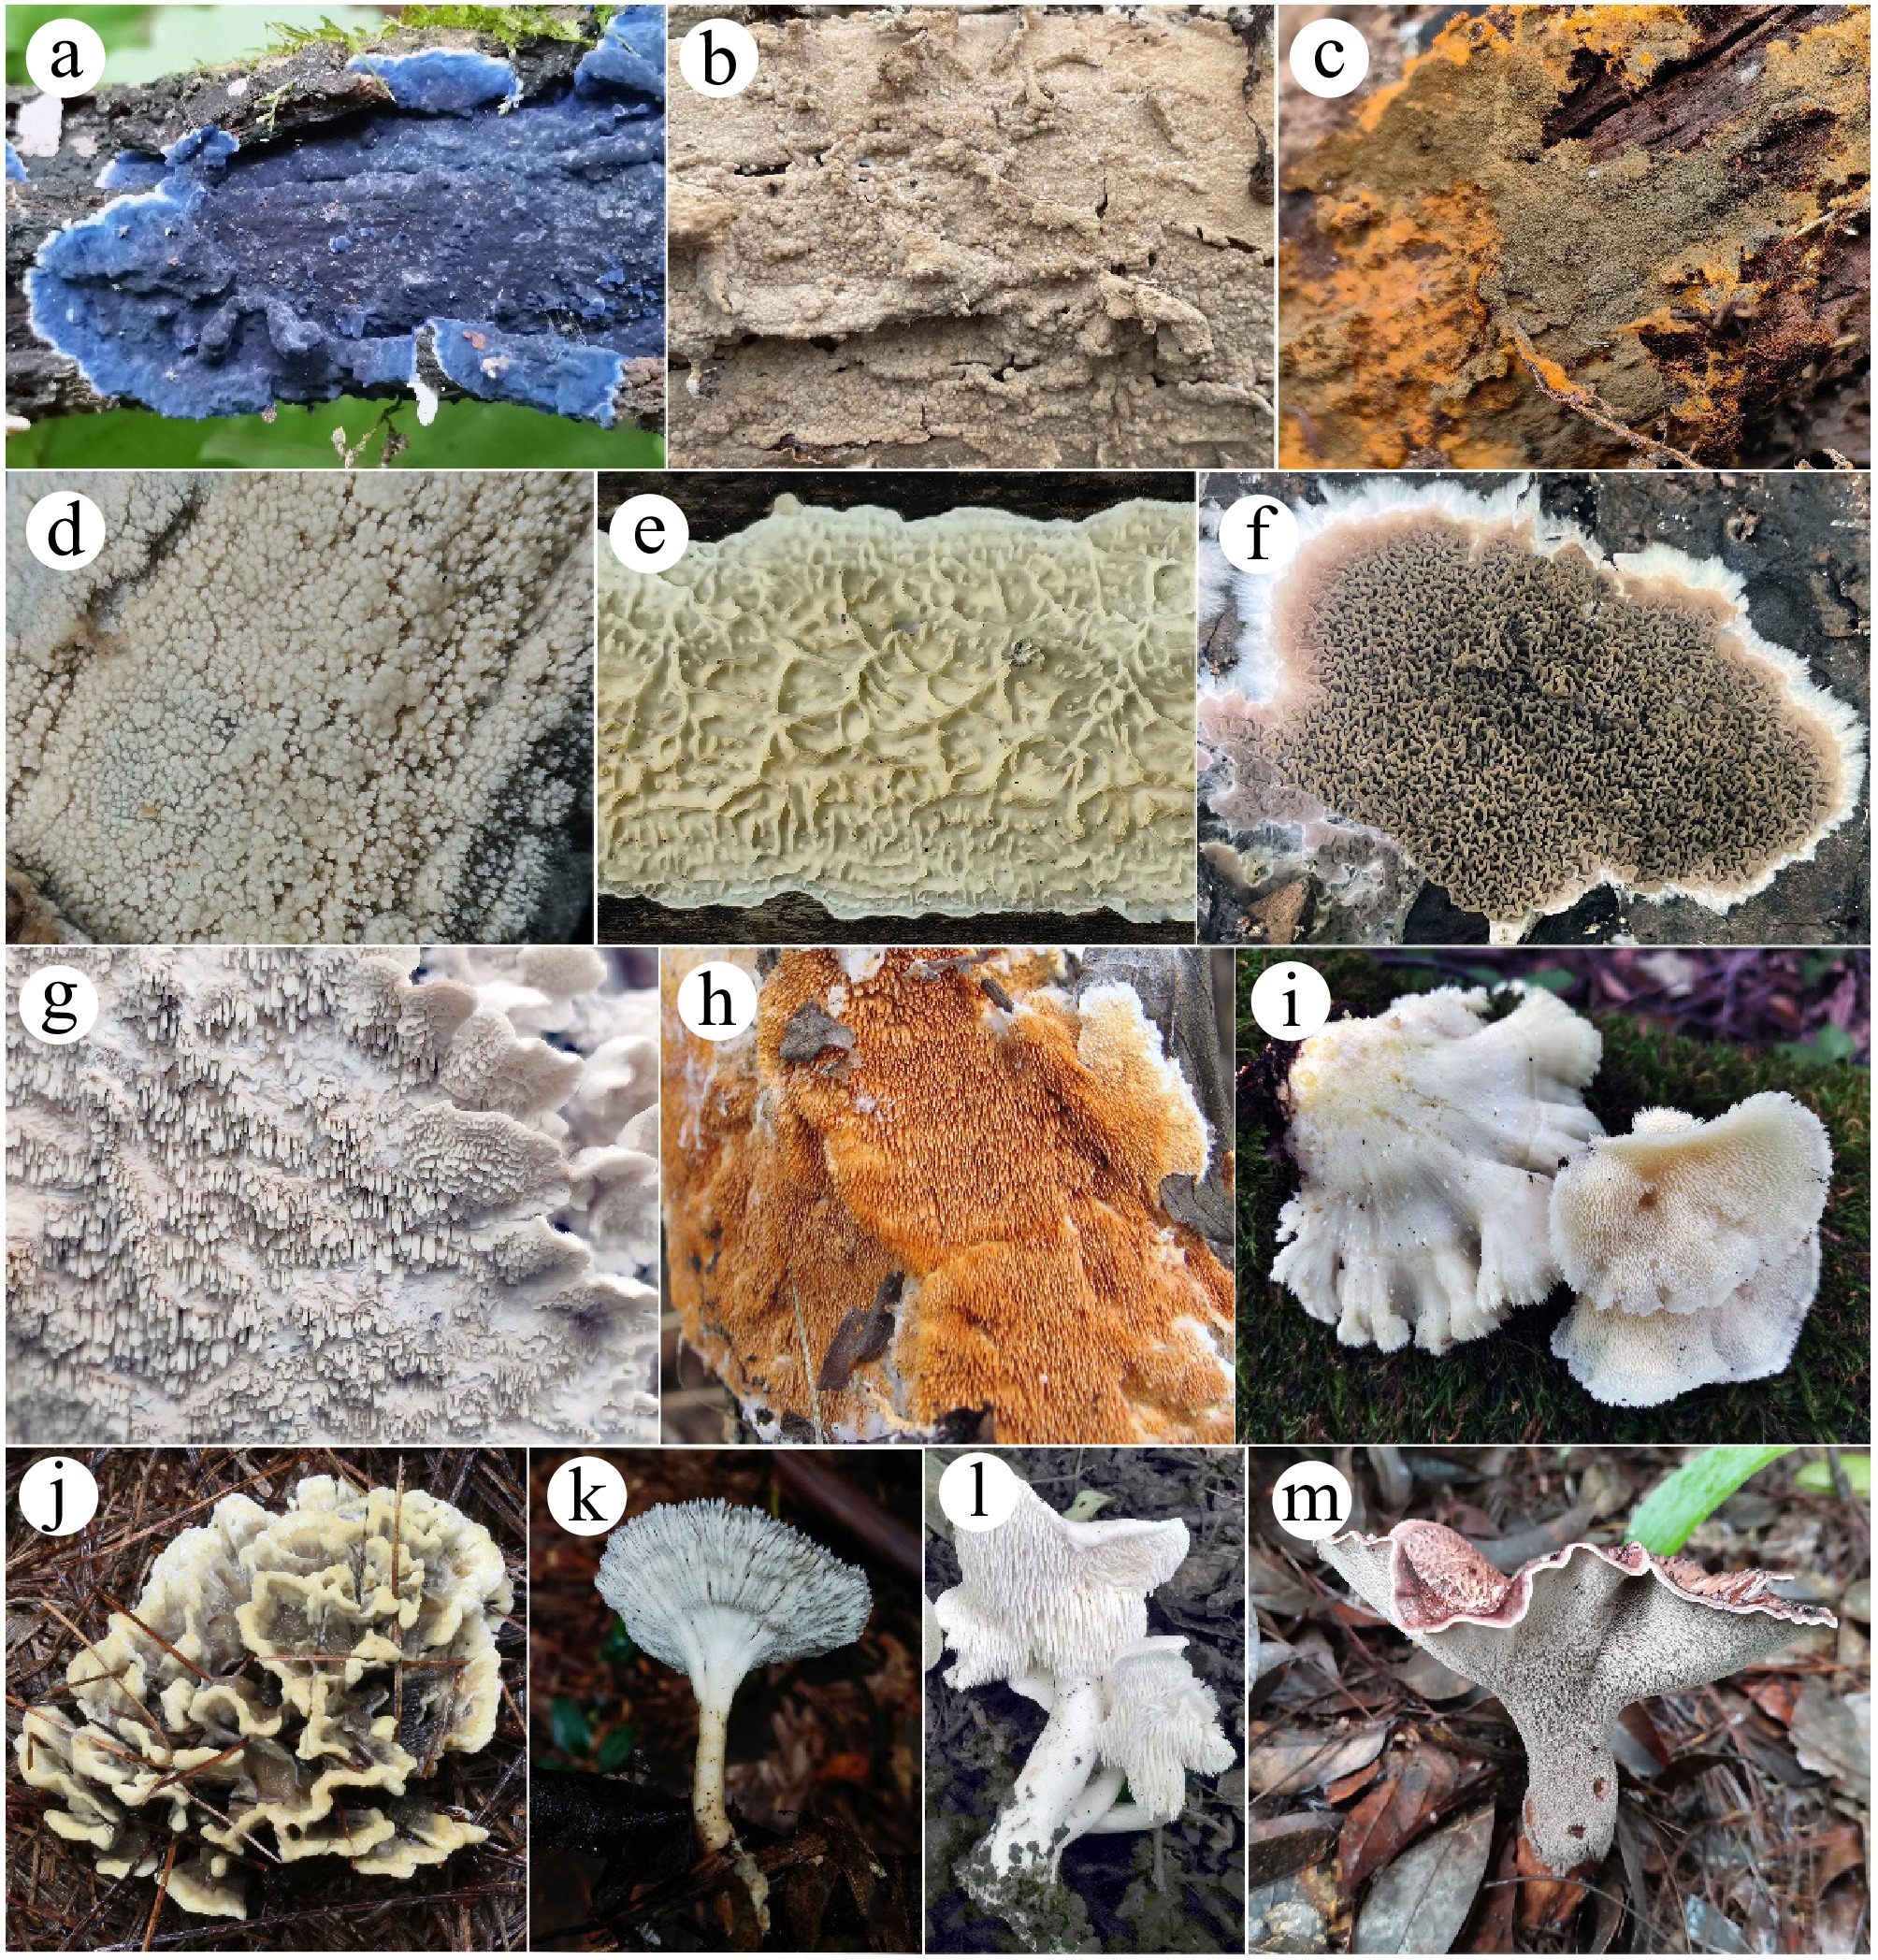
Figure 1.
Variation in the hymenophoral surfaces and basidiomes of corticioid and hydnoid fungi. (a) Terana coerulea; (b) Gloeopeniophorella convolvens; (c) Tomentella olivacea; (d) Peniophorella rude; (e) Lopharia cinerascens; (f) Serpula himantioides; (g) Irpex lacteus; (h) Steccherinum laeticolor; (i) Mycoleptodonoides aitchisonii; (j) Thelephora ganbajun; (k) Cymatoderma elegans; (l) Hydnum albopallidum; (m) Hydnellum grosselepidotum.
-
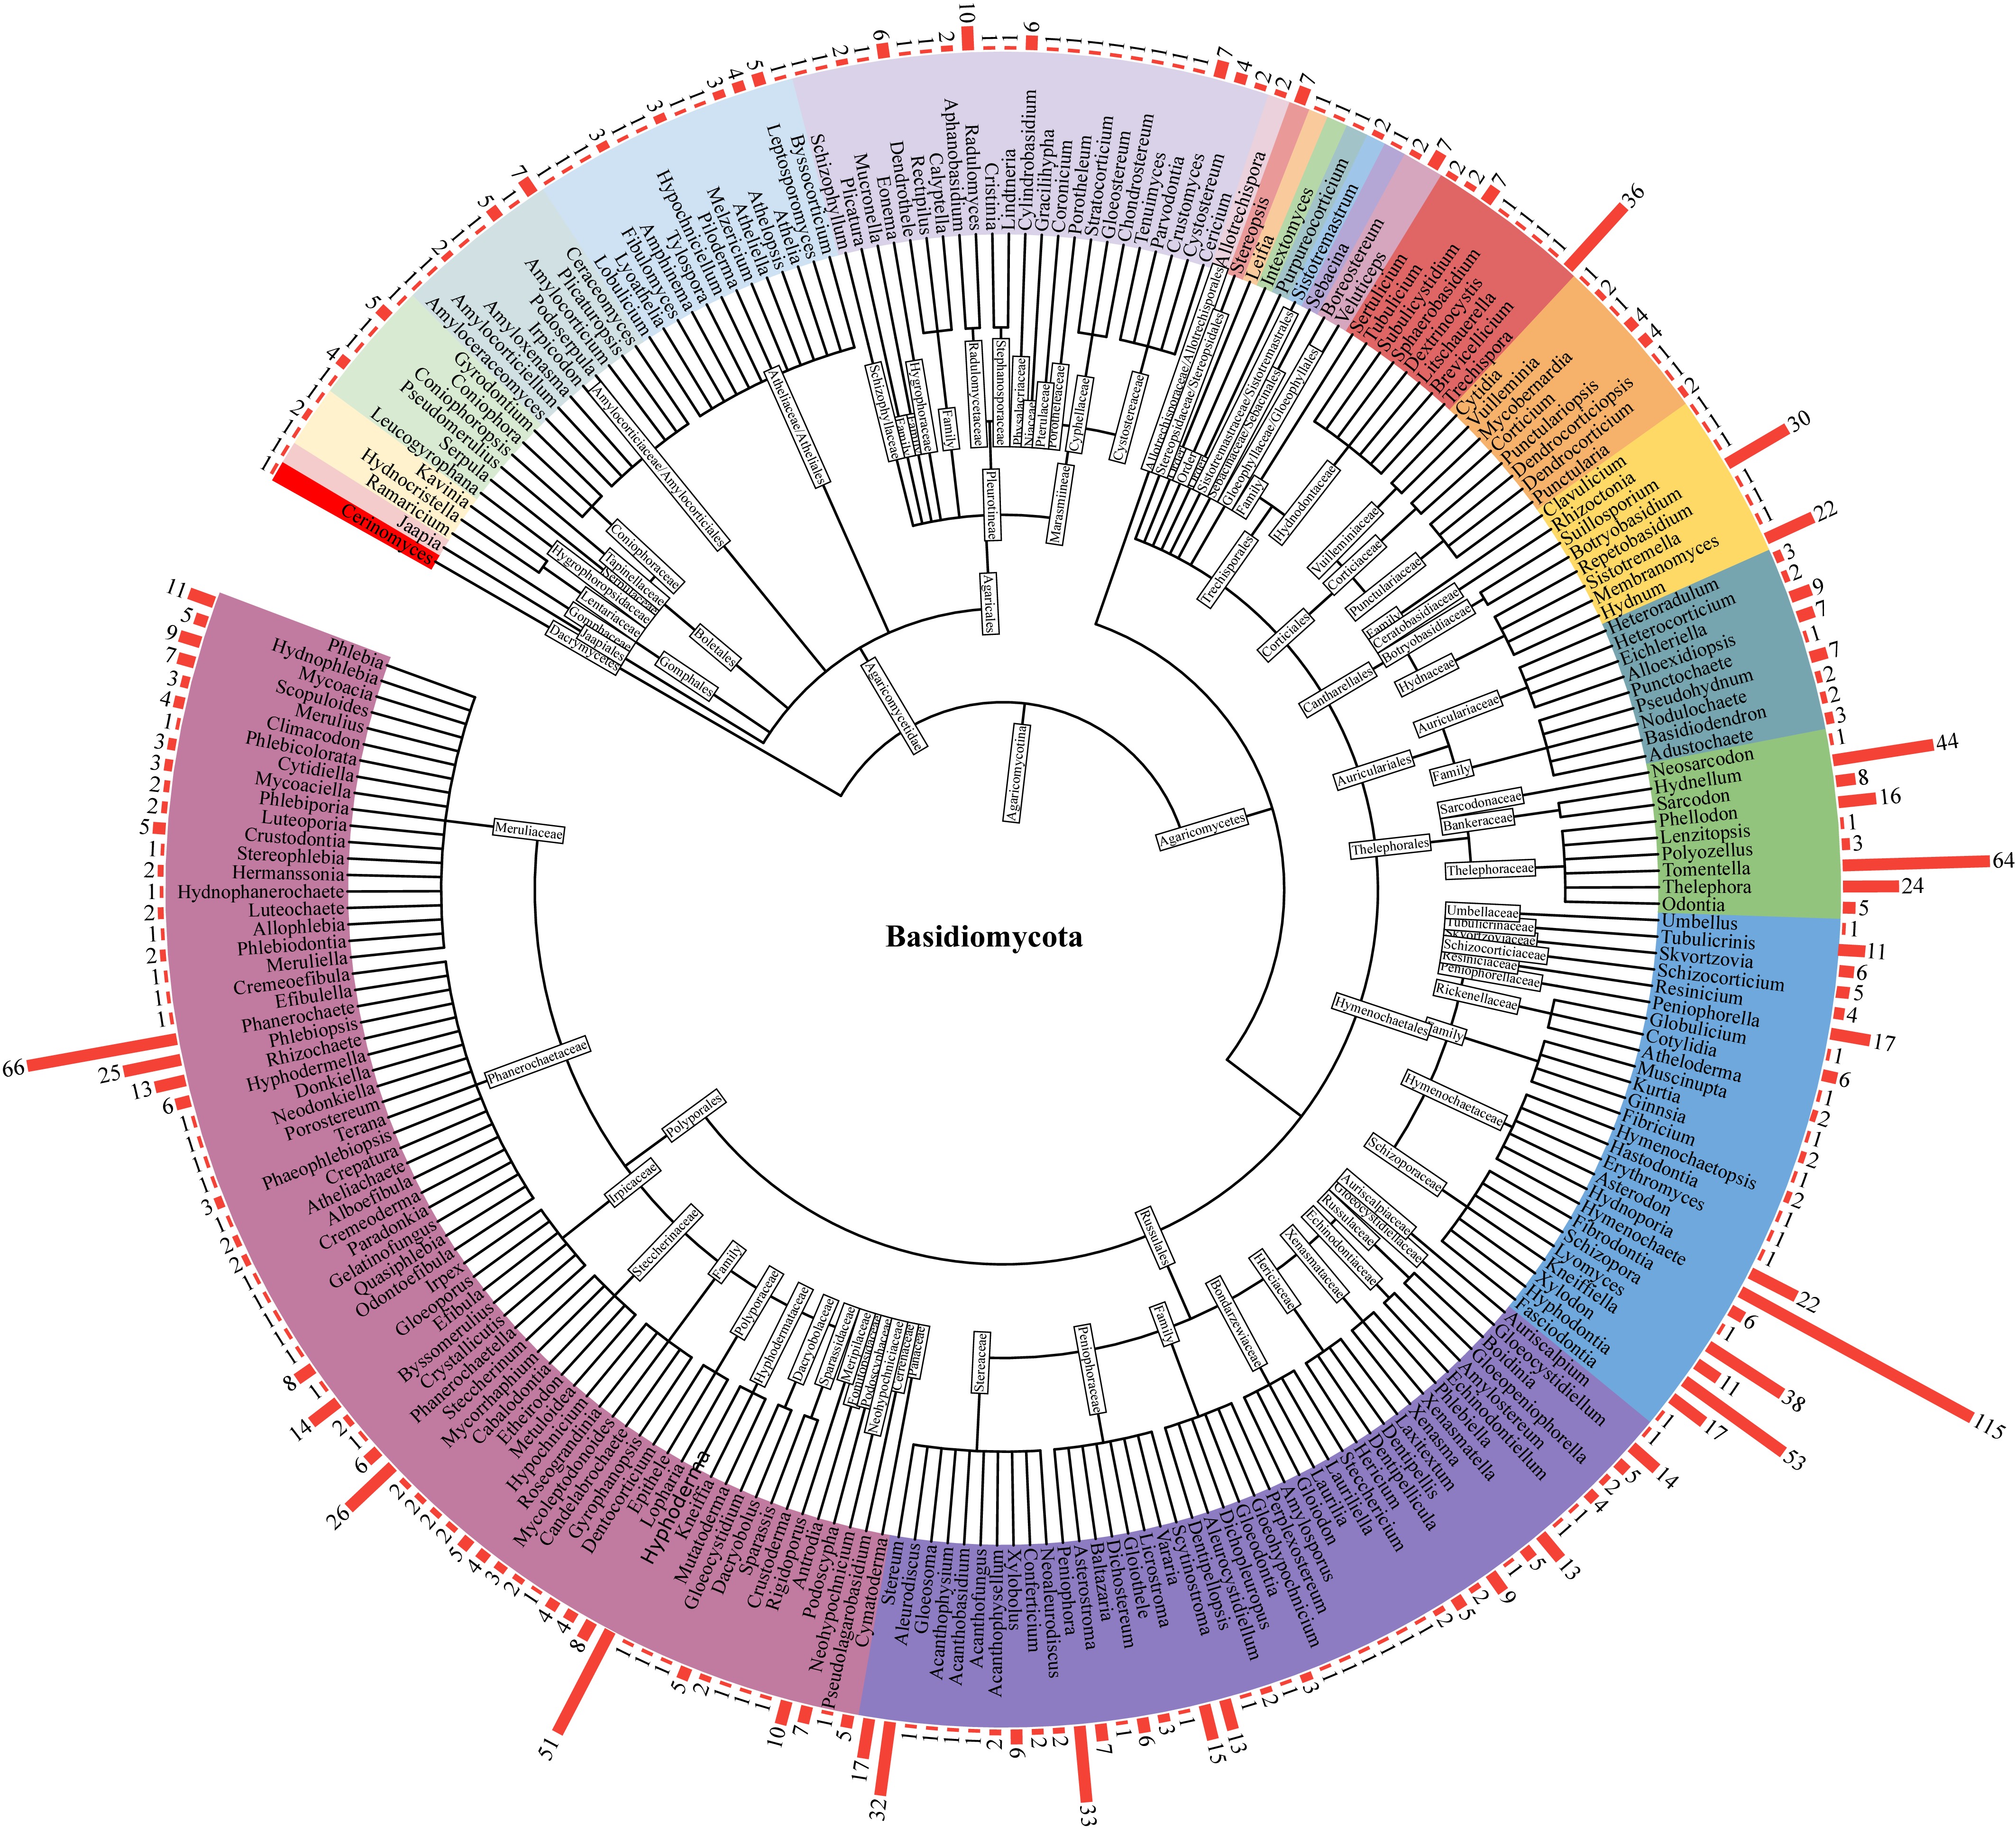
Figure 2.
Diagram showing the classification hierarchy and species abundance of corticioid and hydnoid fungi in China. The red bar on the outer circle represents the number of species in the corresponding genus.
-
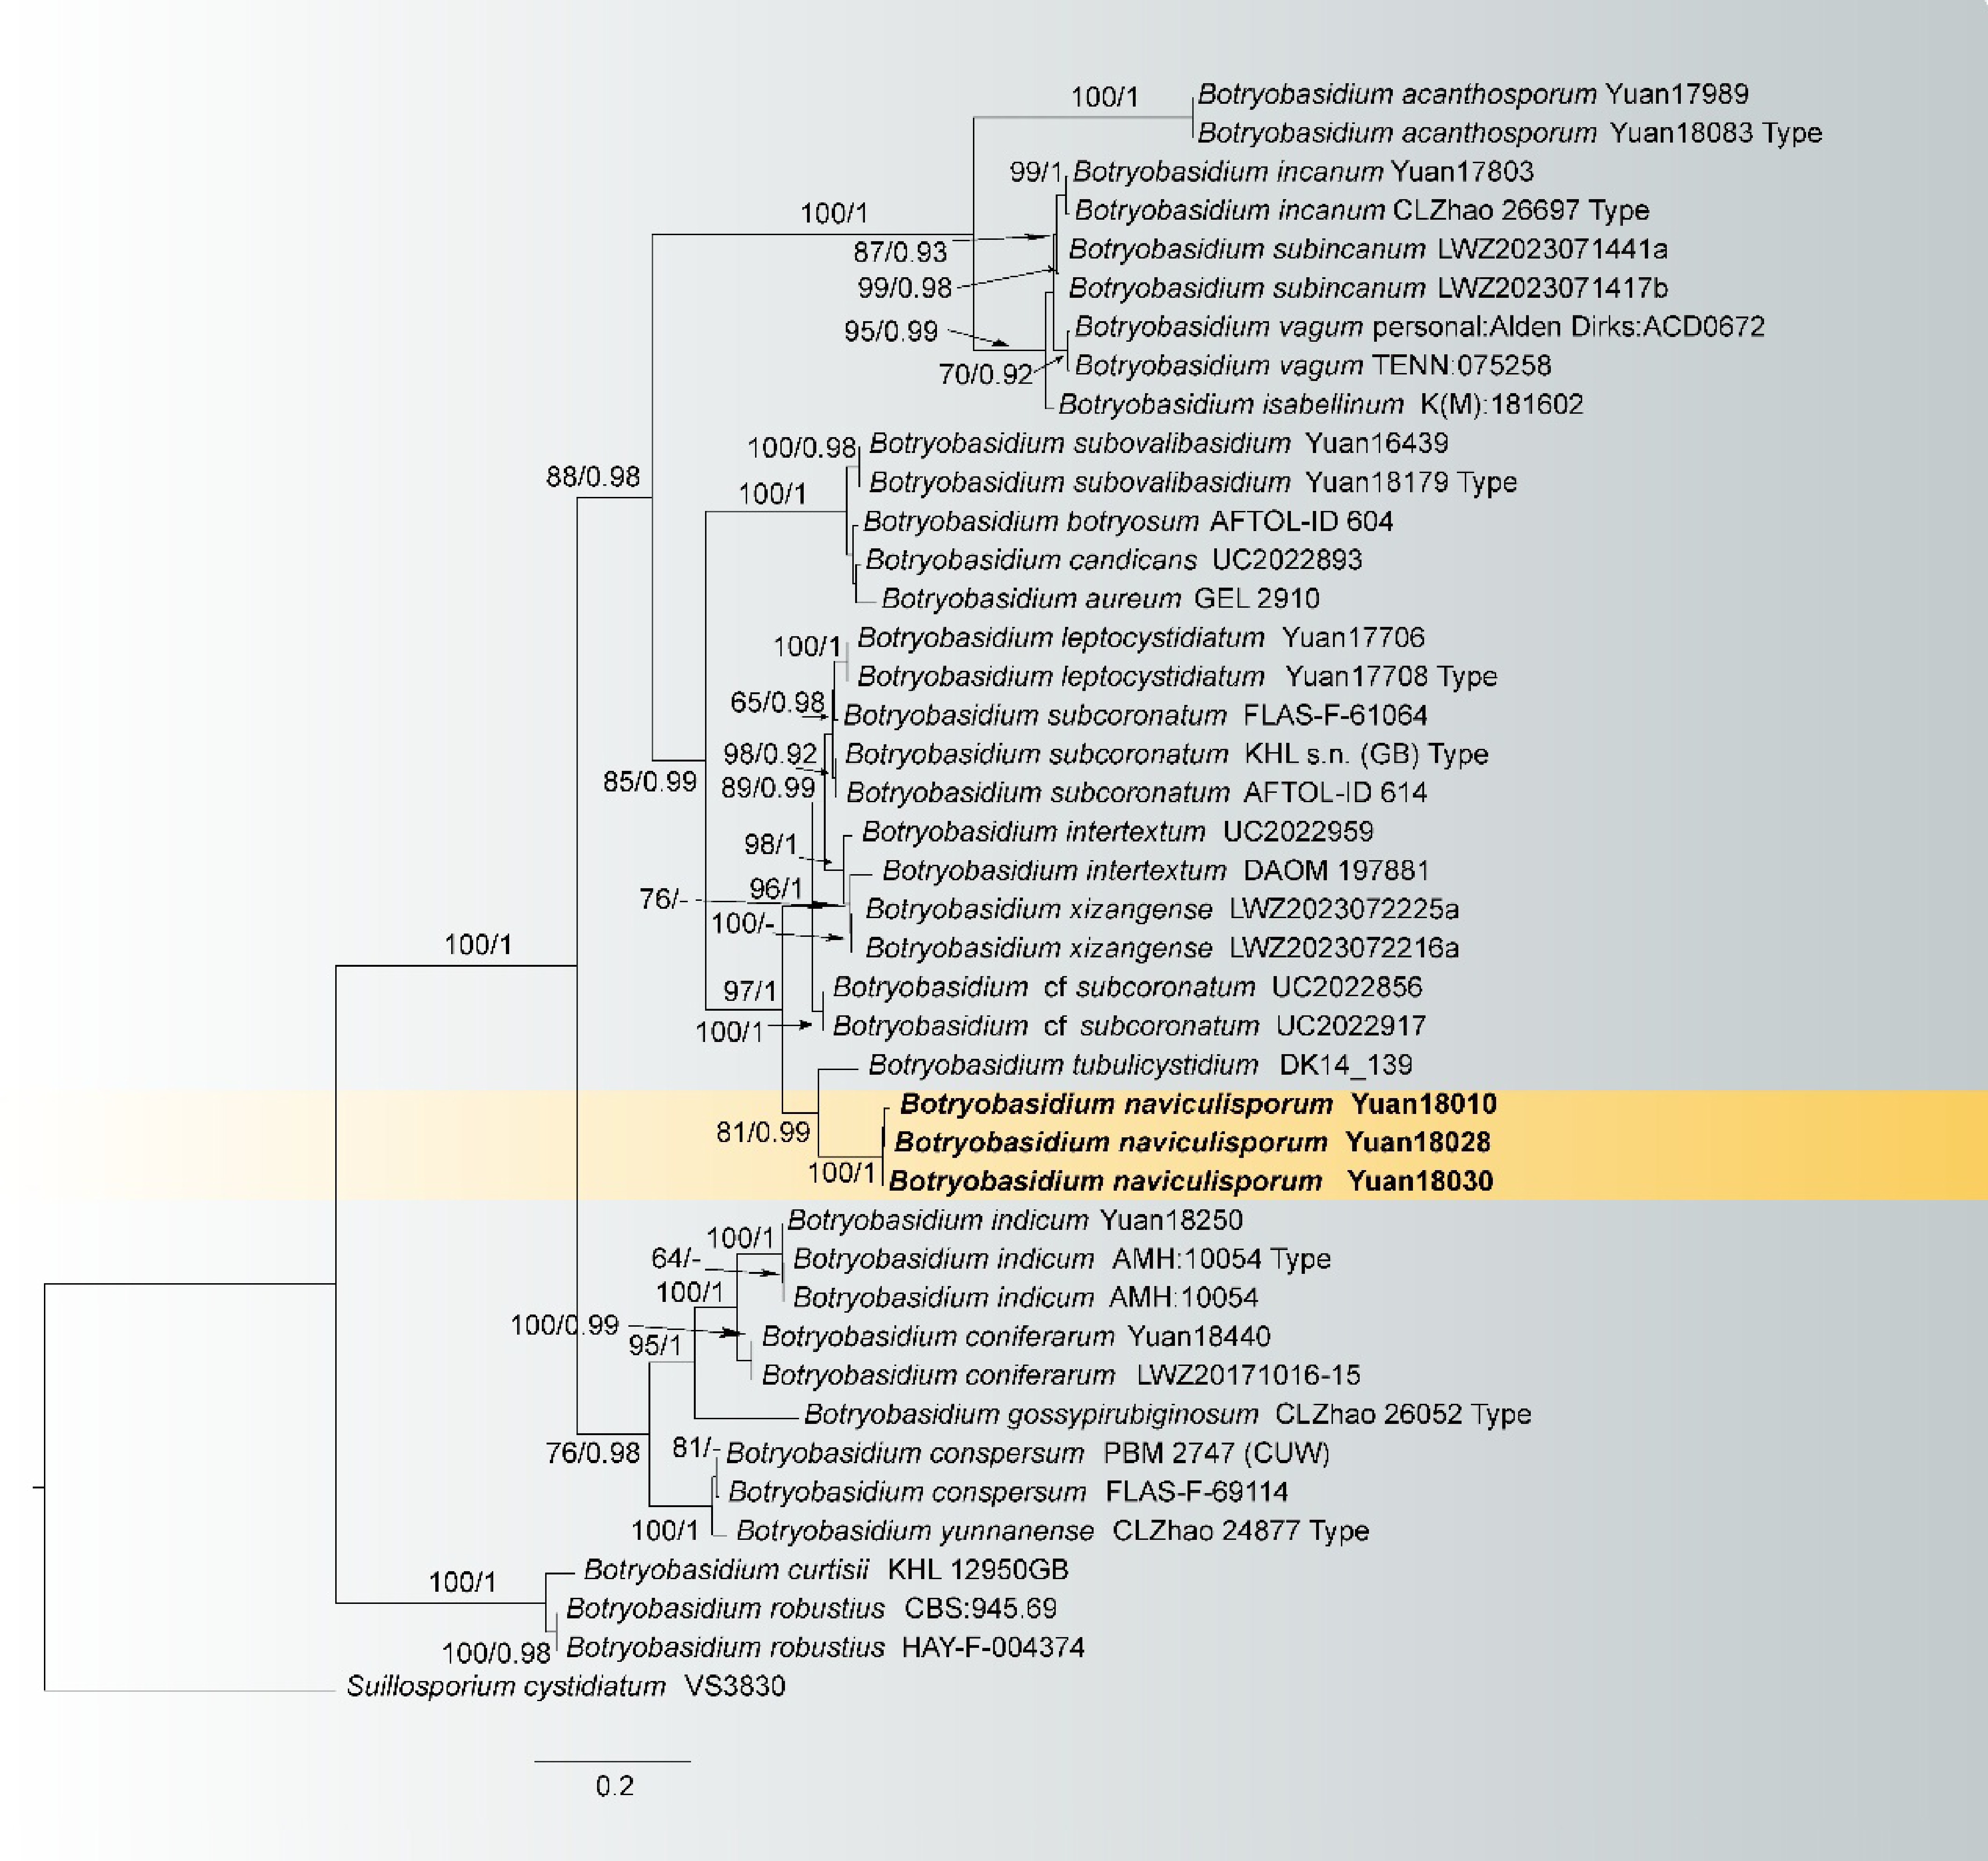
Figure 3.
Maximum likelihood tree illustrating the phylogeny of Botryobasidium naviculisporum related taxa based on ITS + LSU nuclear rDNA sequences dataset. Branches are labeled with Maximum likelihood bootstrap equal to or higher than 60%, and Bayesian posterior probabilities equal to or higher than 0.9. Vouchers are indicated after the species names. New species in bold (black).
-
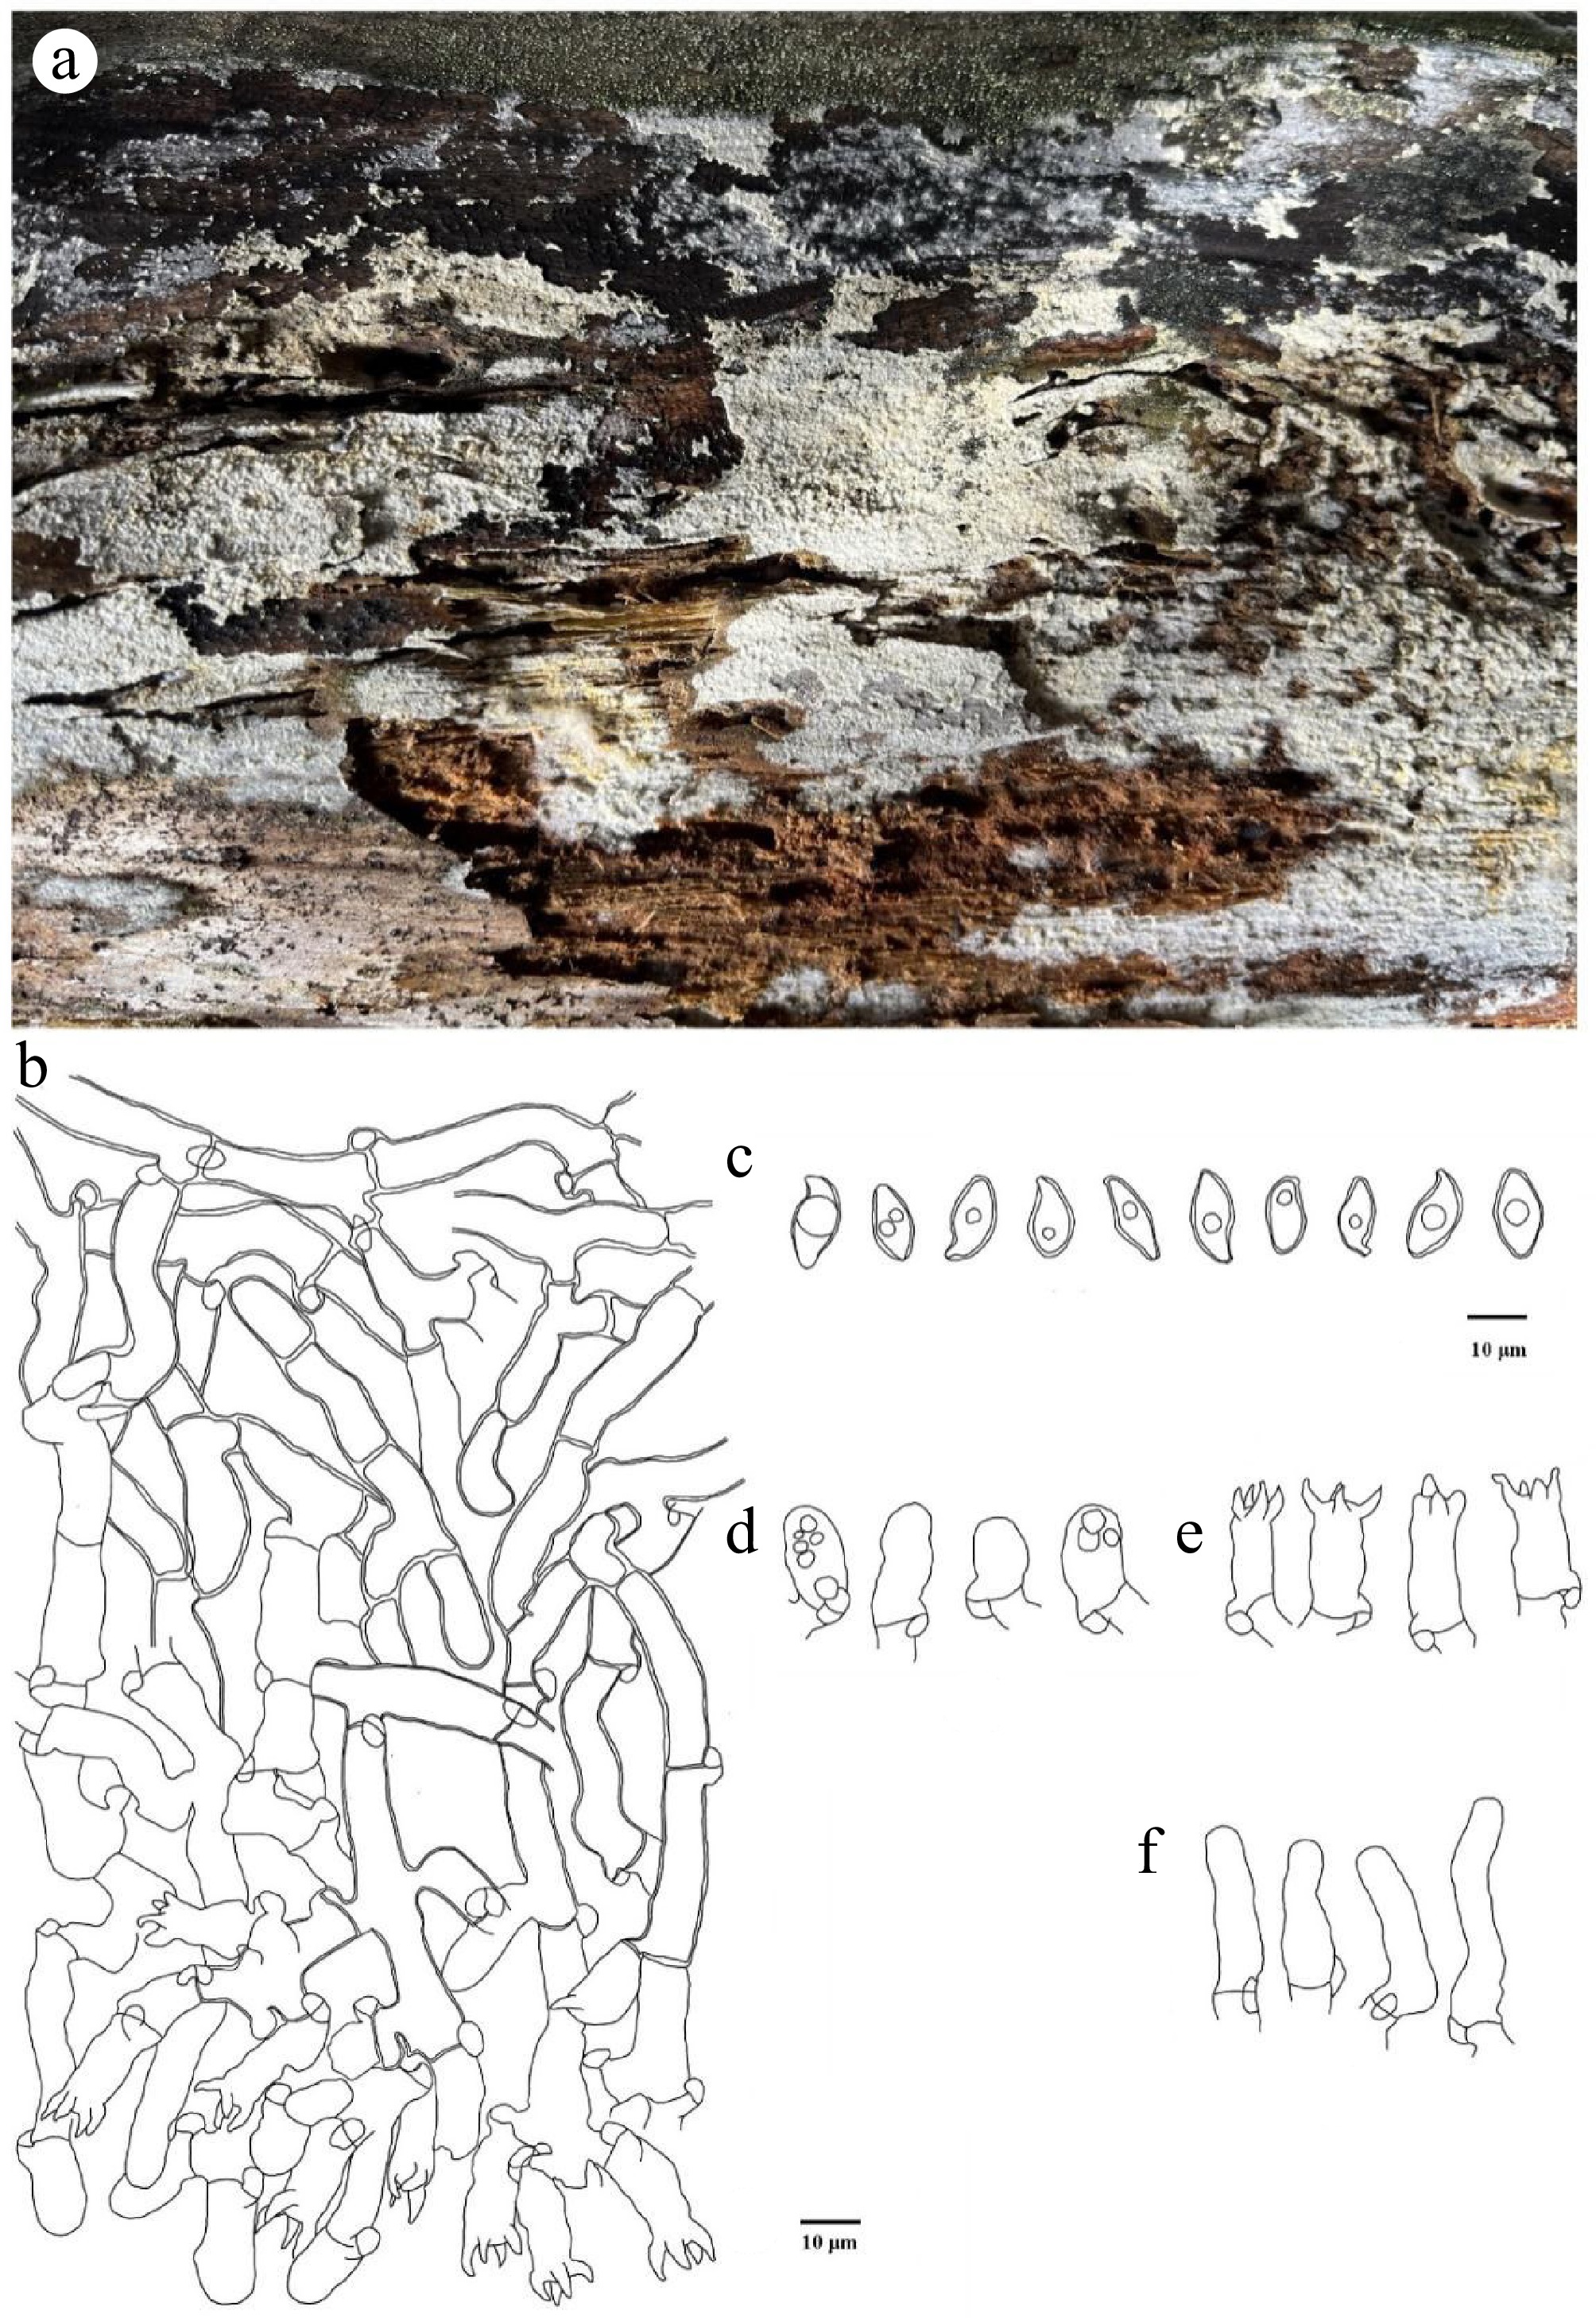
Figure 4.
Botryobasidium naviculisporum (holotype Yuan 18030). (a) A basidiocarp. Microscopic structures: (b) section through basidiocarp; (c) Basidiospores; (d) Basidioles; (e) Basidia; (f) Cystidia.
-
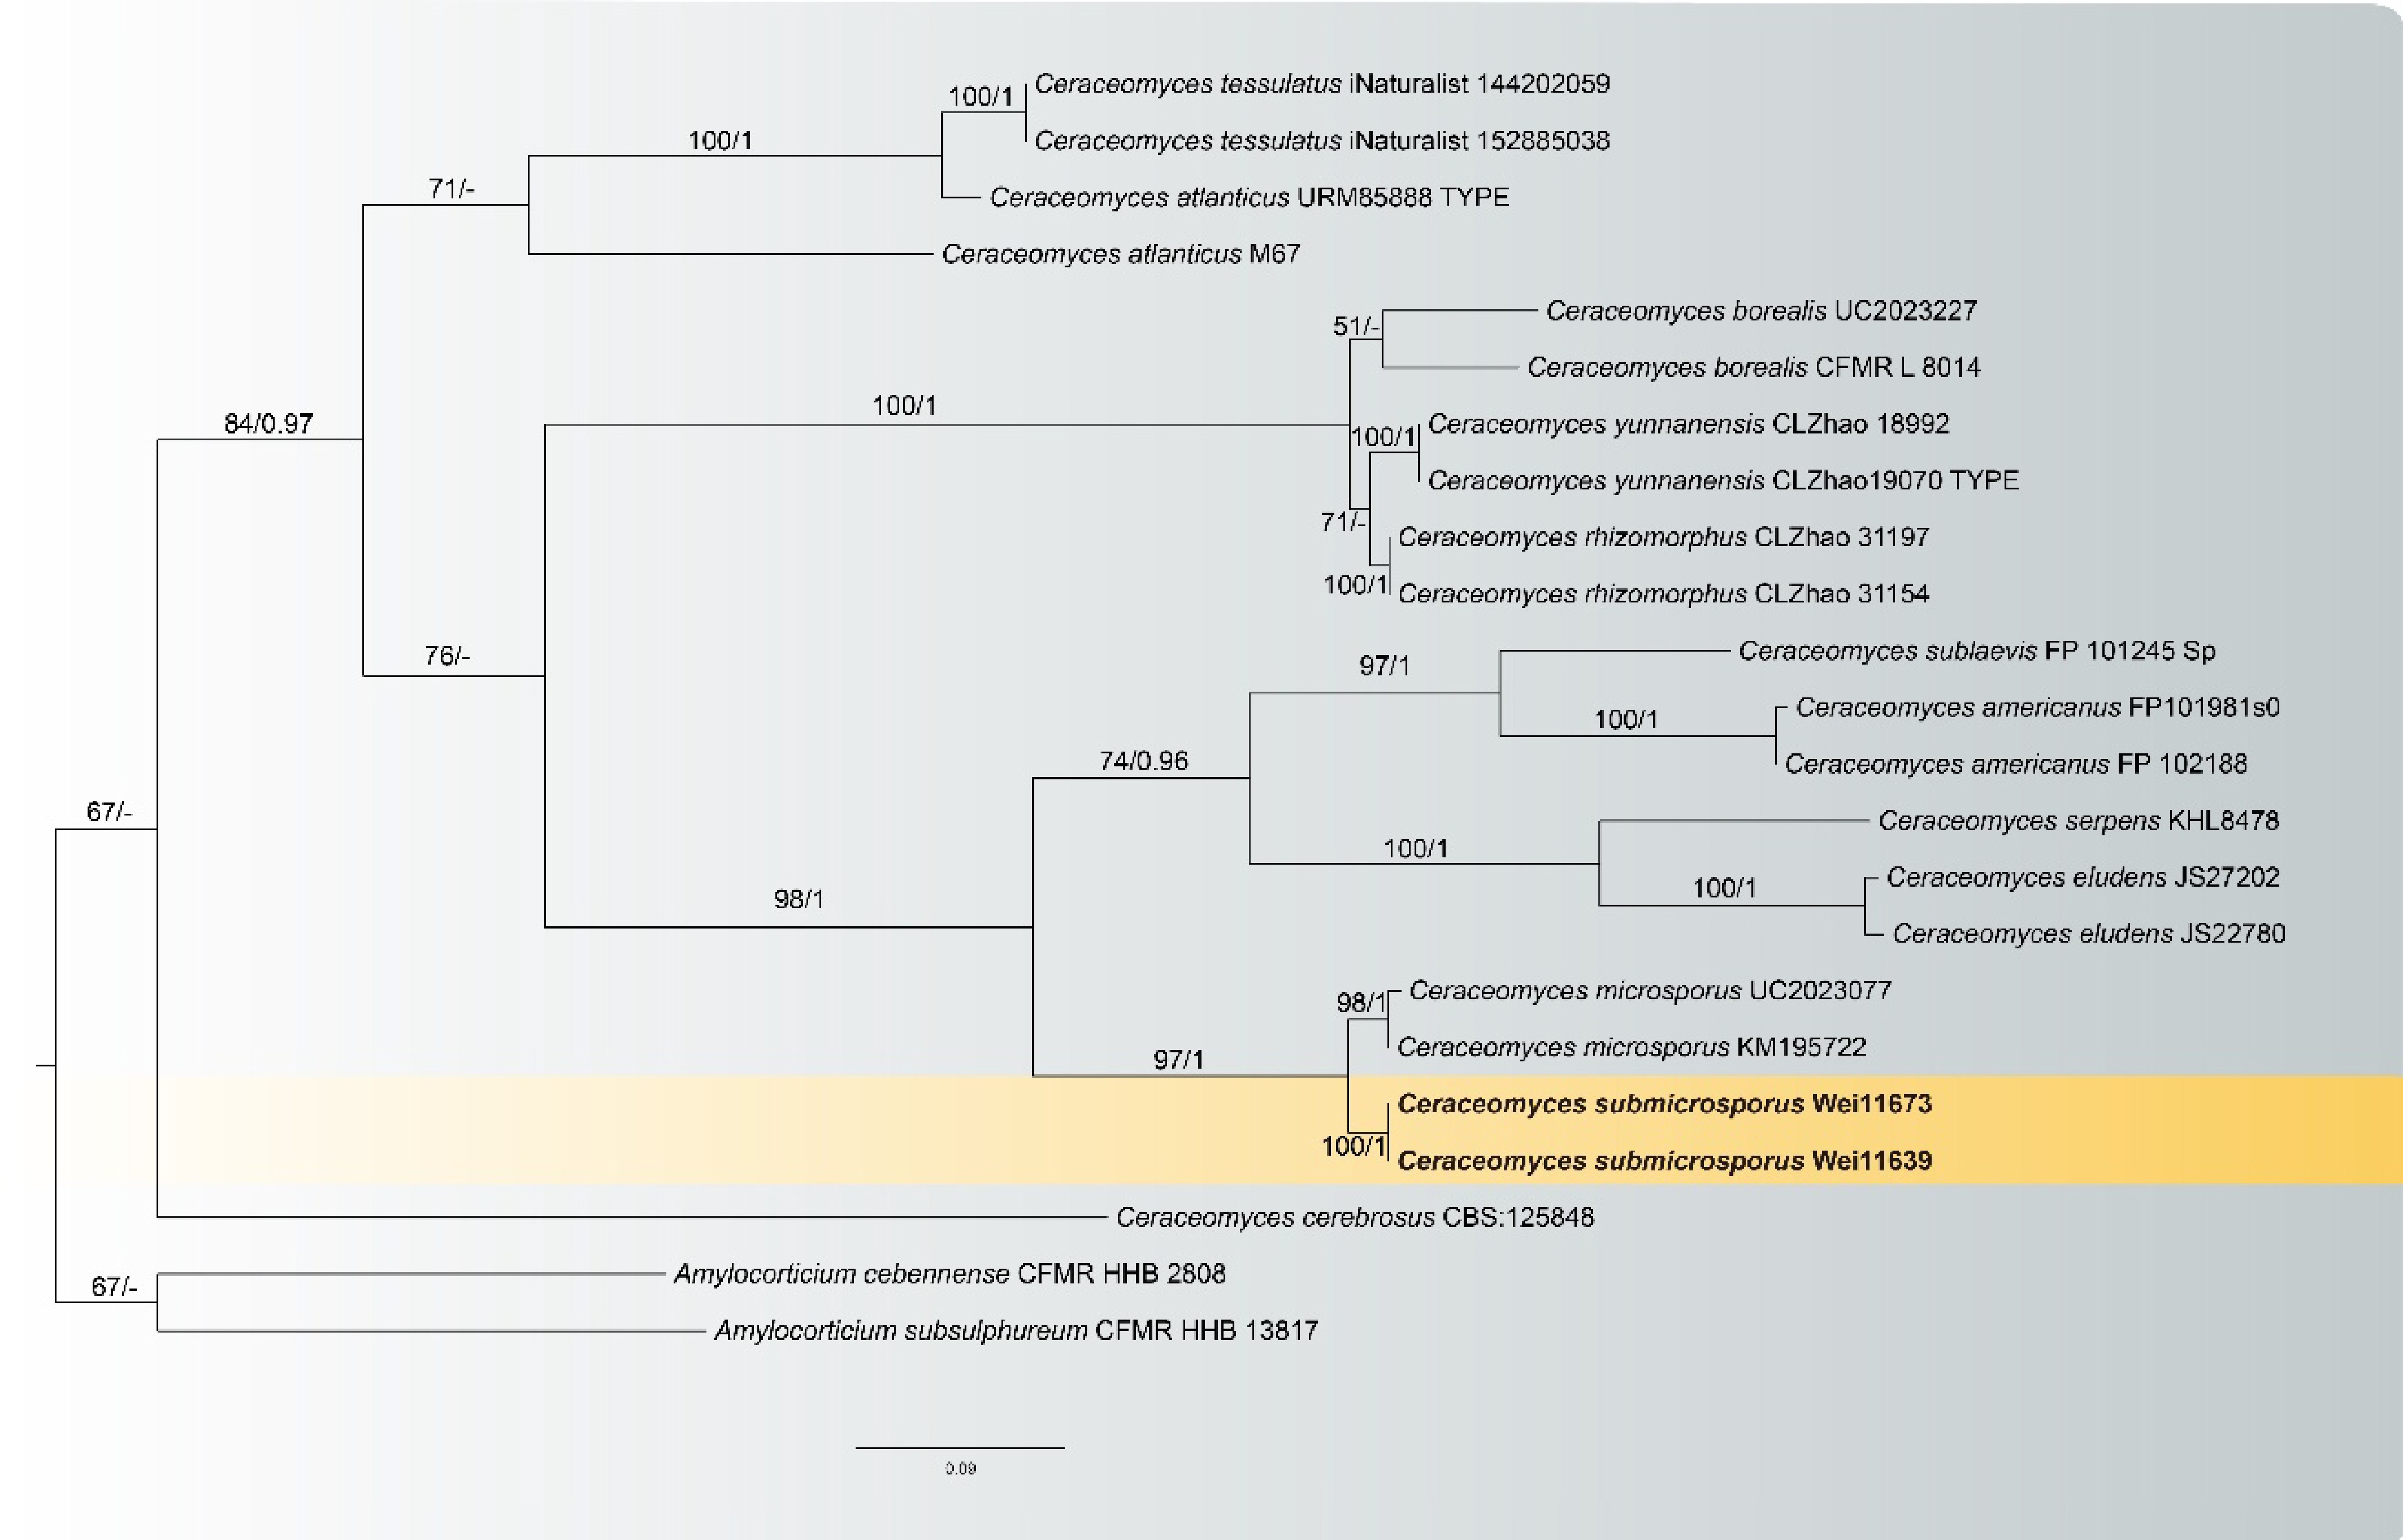
Figure 5.
Maximum likelihood tree illustrating the phylogeny of Ceraceomyces submicrosporus related taxa based on ITS + LSU nuclear rDNA sequences dataset. Branches are labeled with Maximum likelihood bootstrap equal to or higher than 60%, and Bayesian posterior probabilities equal to or higher than 0.9. Vouchers are indicated after the species names. New species in bold (black).
-
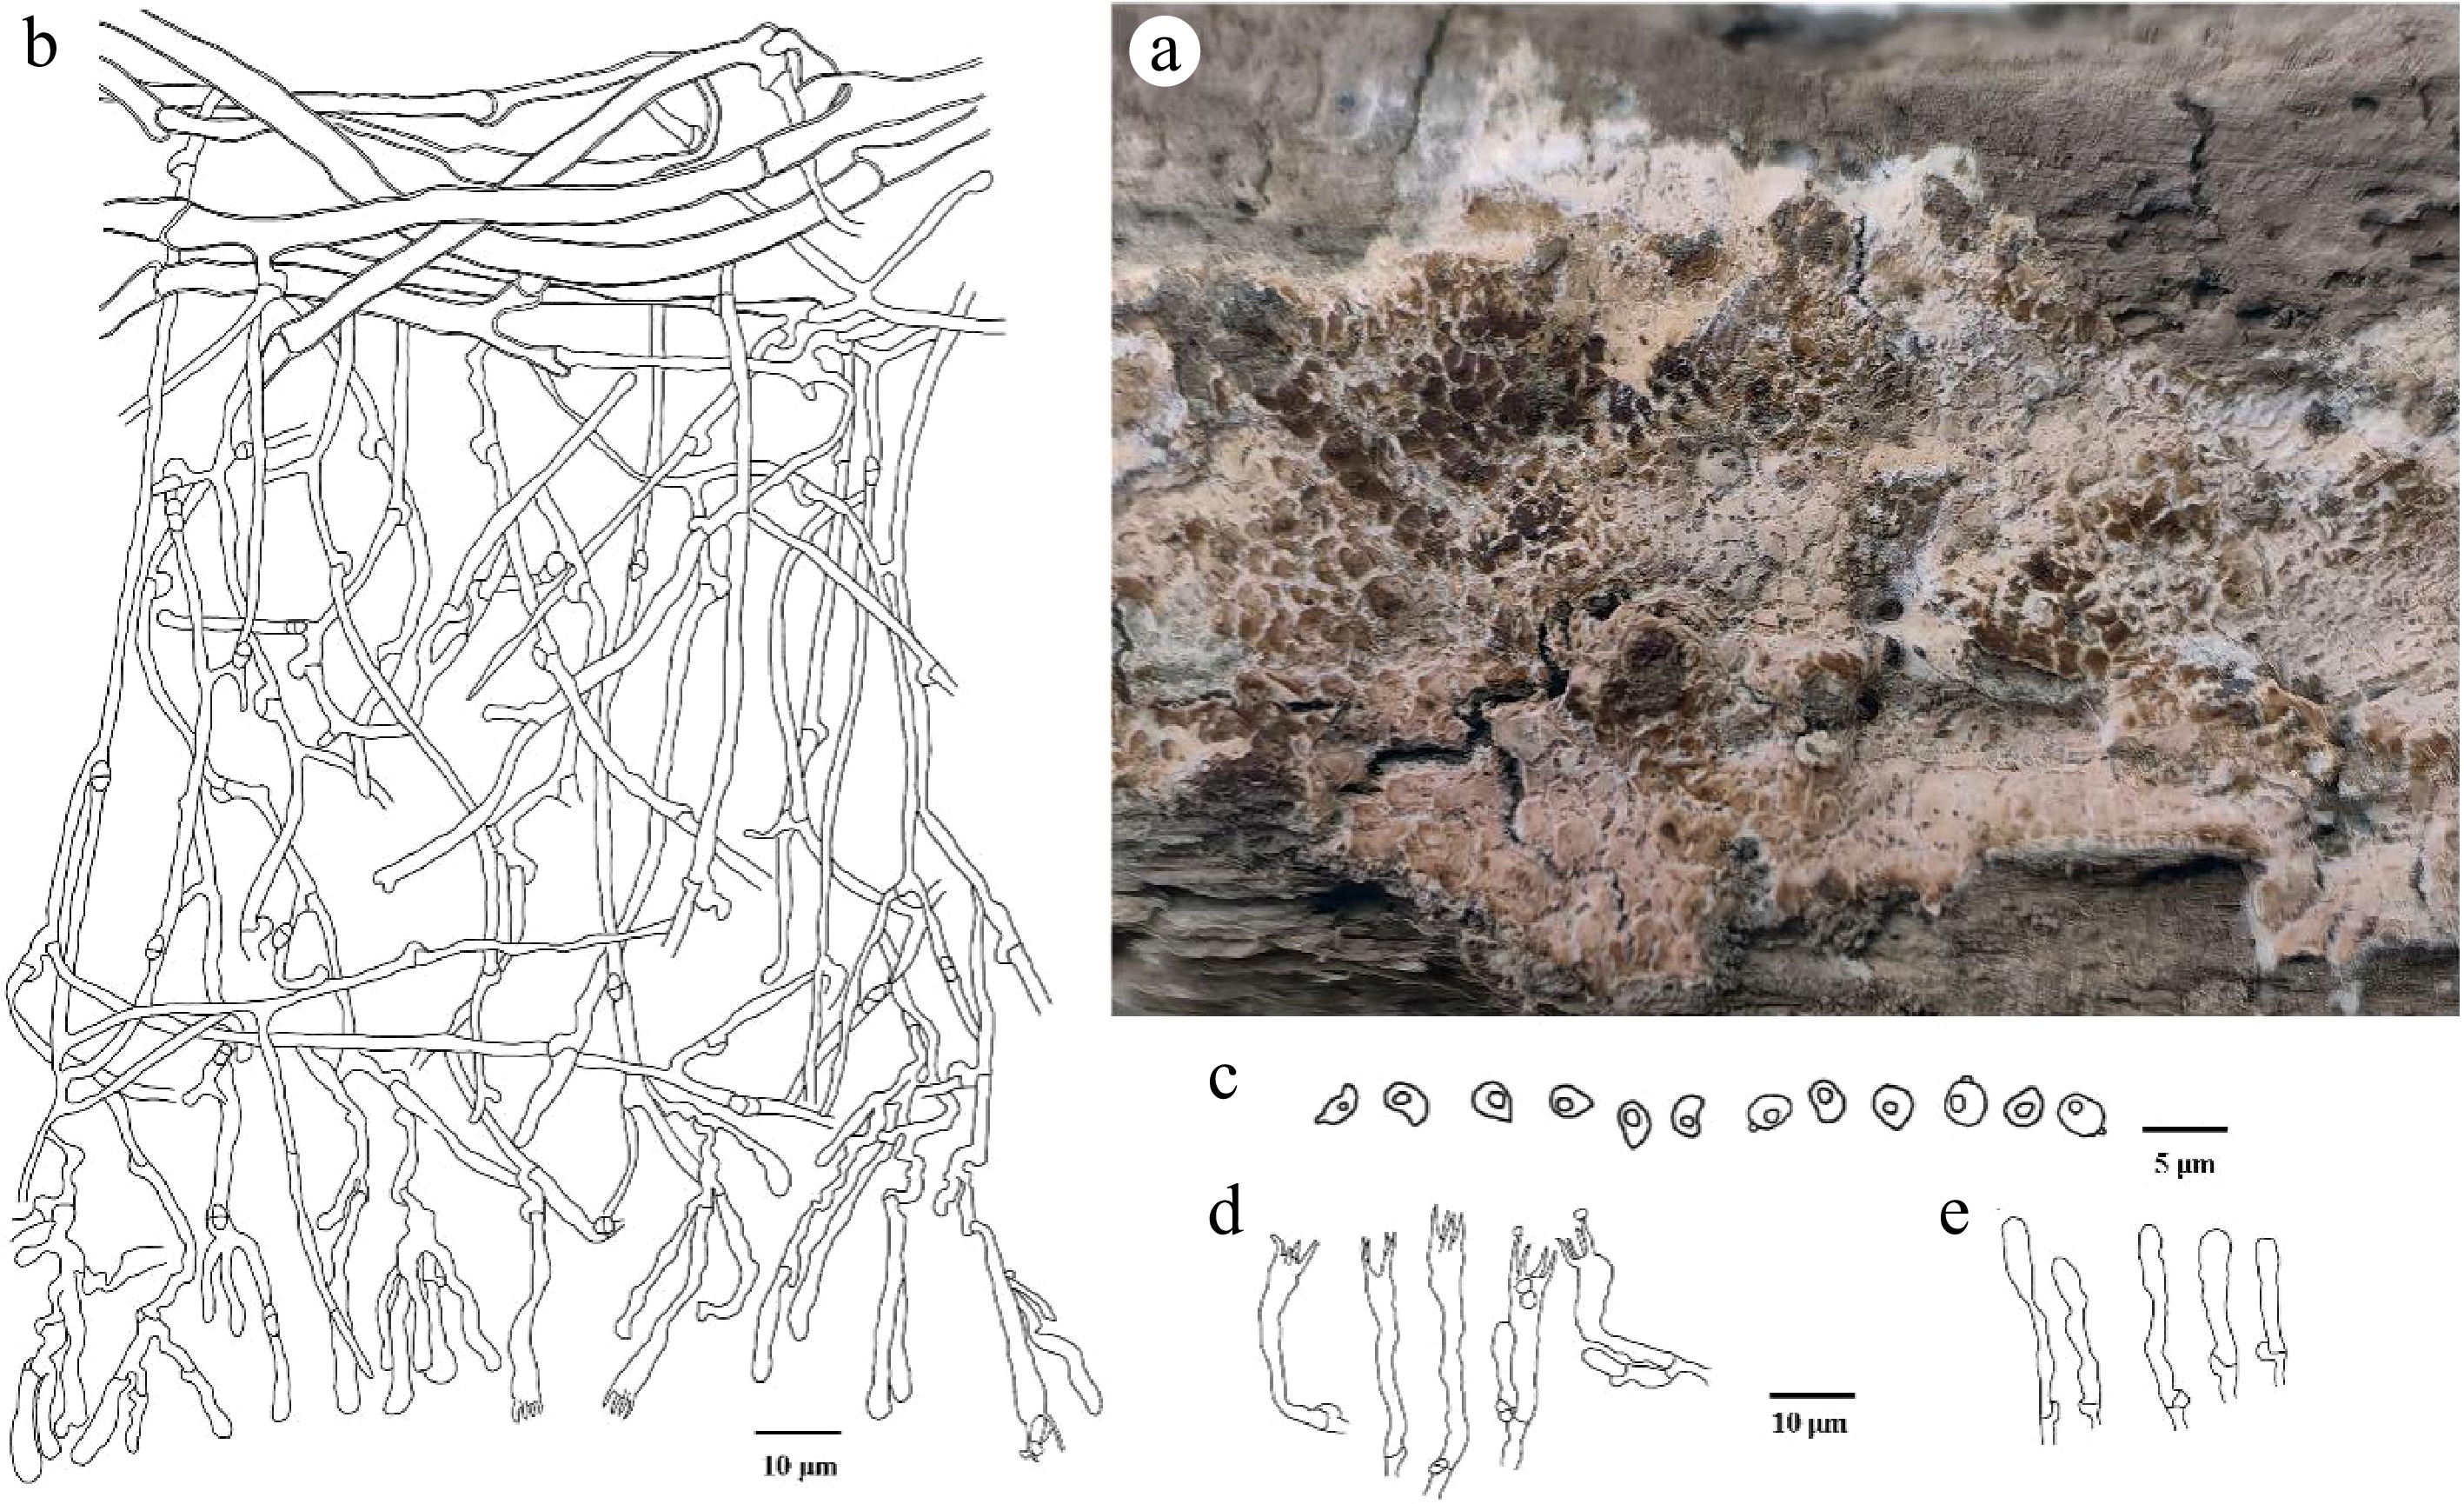
Figure 6.
Ceraceomyces submicrosporus (holotype Wei 11639). (a) Basidiocarp. Microscopic structures: (b) section through basidiocarp; (c) Basidiospores; (d) Basidia; (e) Basidioles.
-
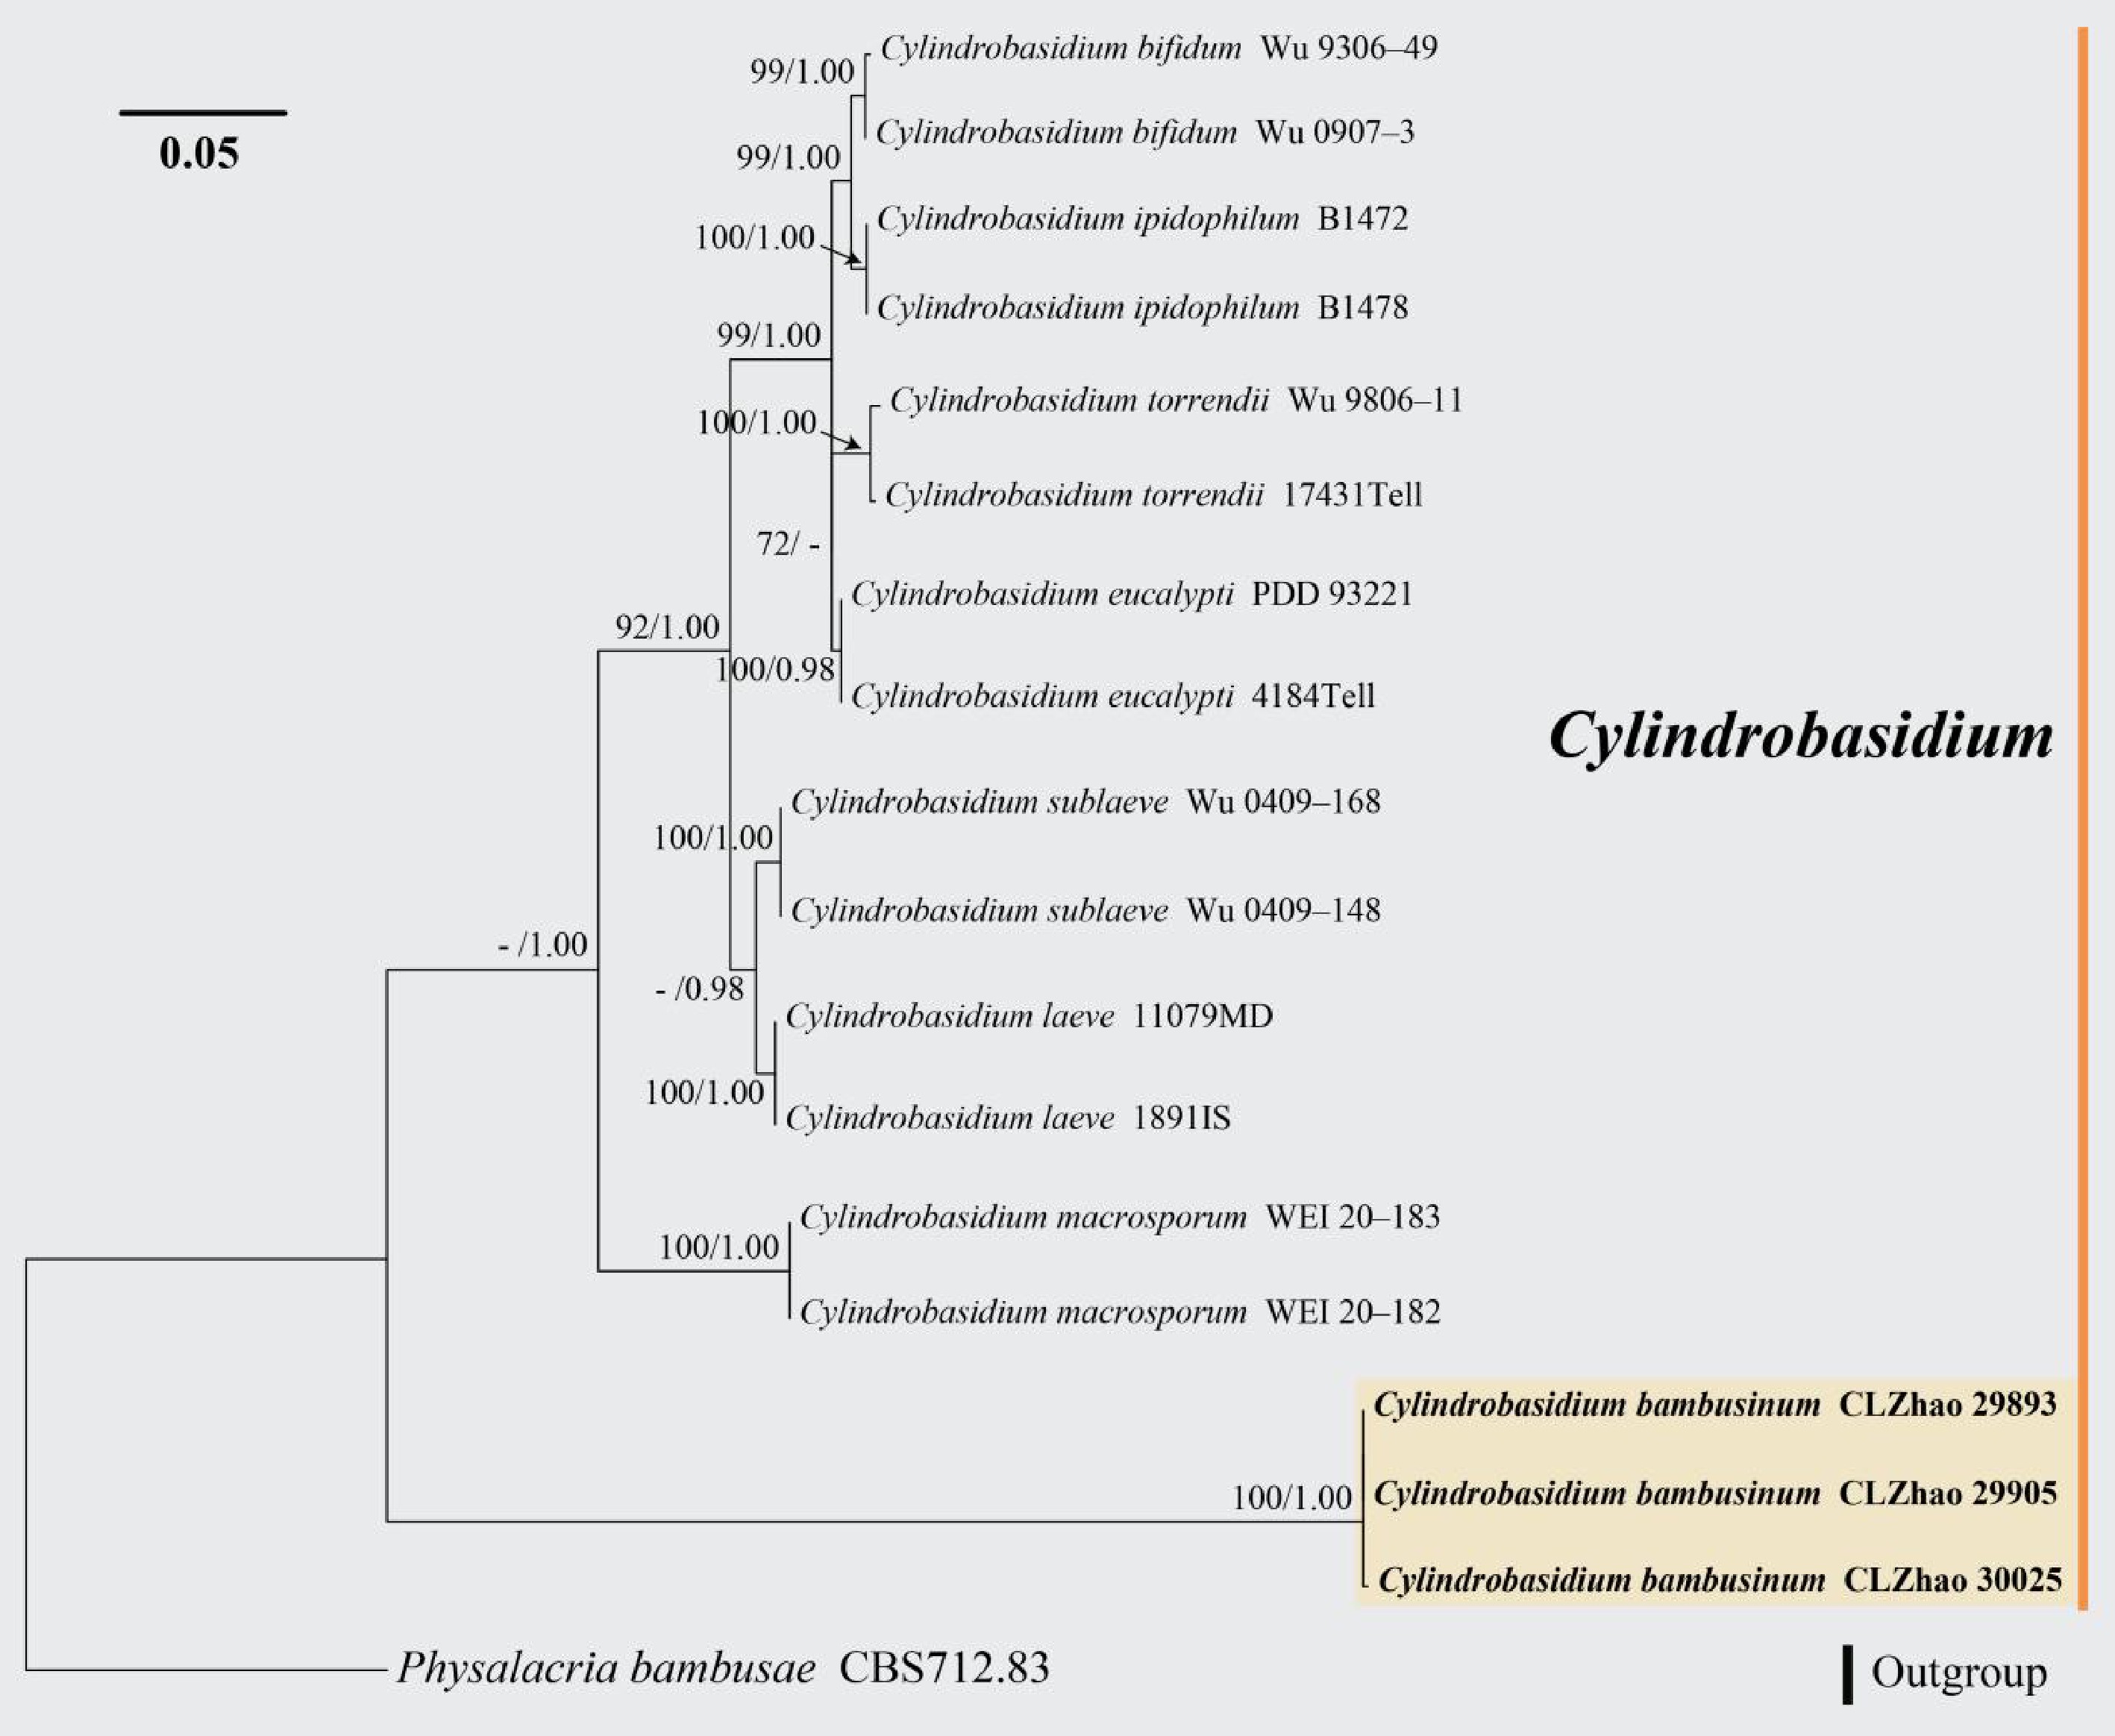
Figure 7.
Maximum likelihood tree illustrating the phylogeny of Cylindrobasidium bambusinum related taxa based on ITS nuclear rDNA sequences dataset. Branches are labeled with Maximum likelihood bootstrap equal to or higher than 60%, and Bayesian posterior probabilities equal to or higher than 0.9. Vouchers are indicated after the species names. New species in bold (black).
-
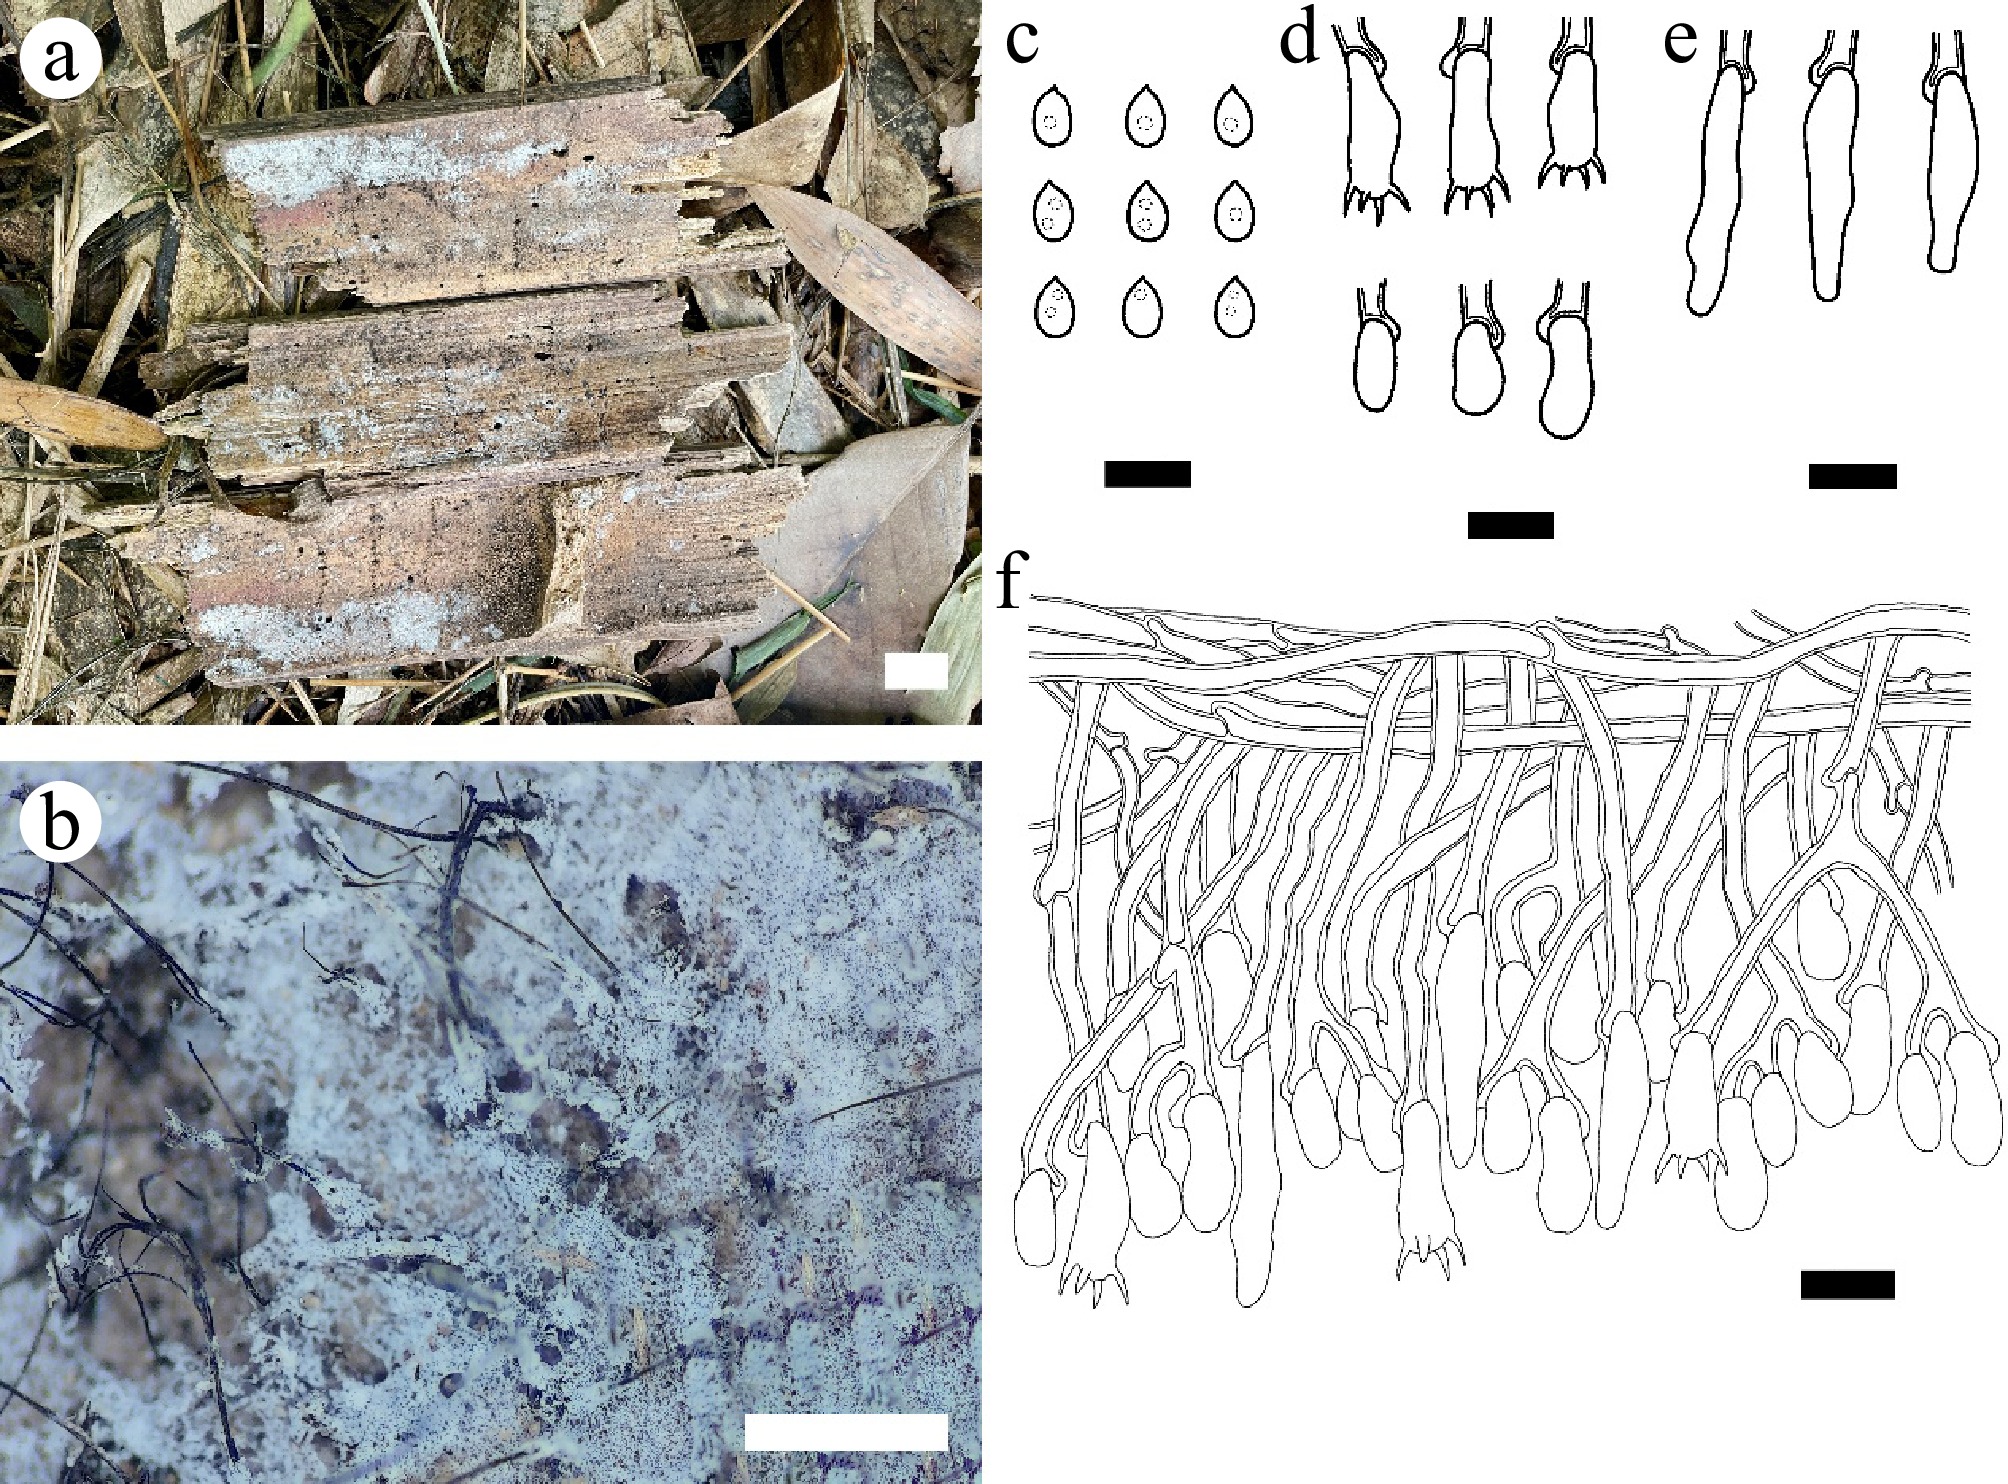
Figure 8.
Cylindrobasidium bambusinum (holotype CLZhao 29905). (a), (b) Basidiocarp. Microscopic structures: (c) Basidiospores; (d) Basidia and basidioles; (e) Cystidioles; (f) Section through basidiocarp. Scale bars: (a) = 1 cm; (b) = 1 mm; (c)–(f) = 10 µm.
-
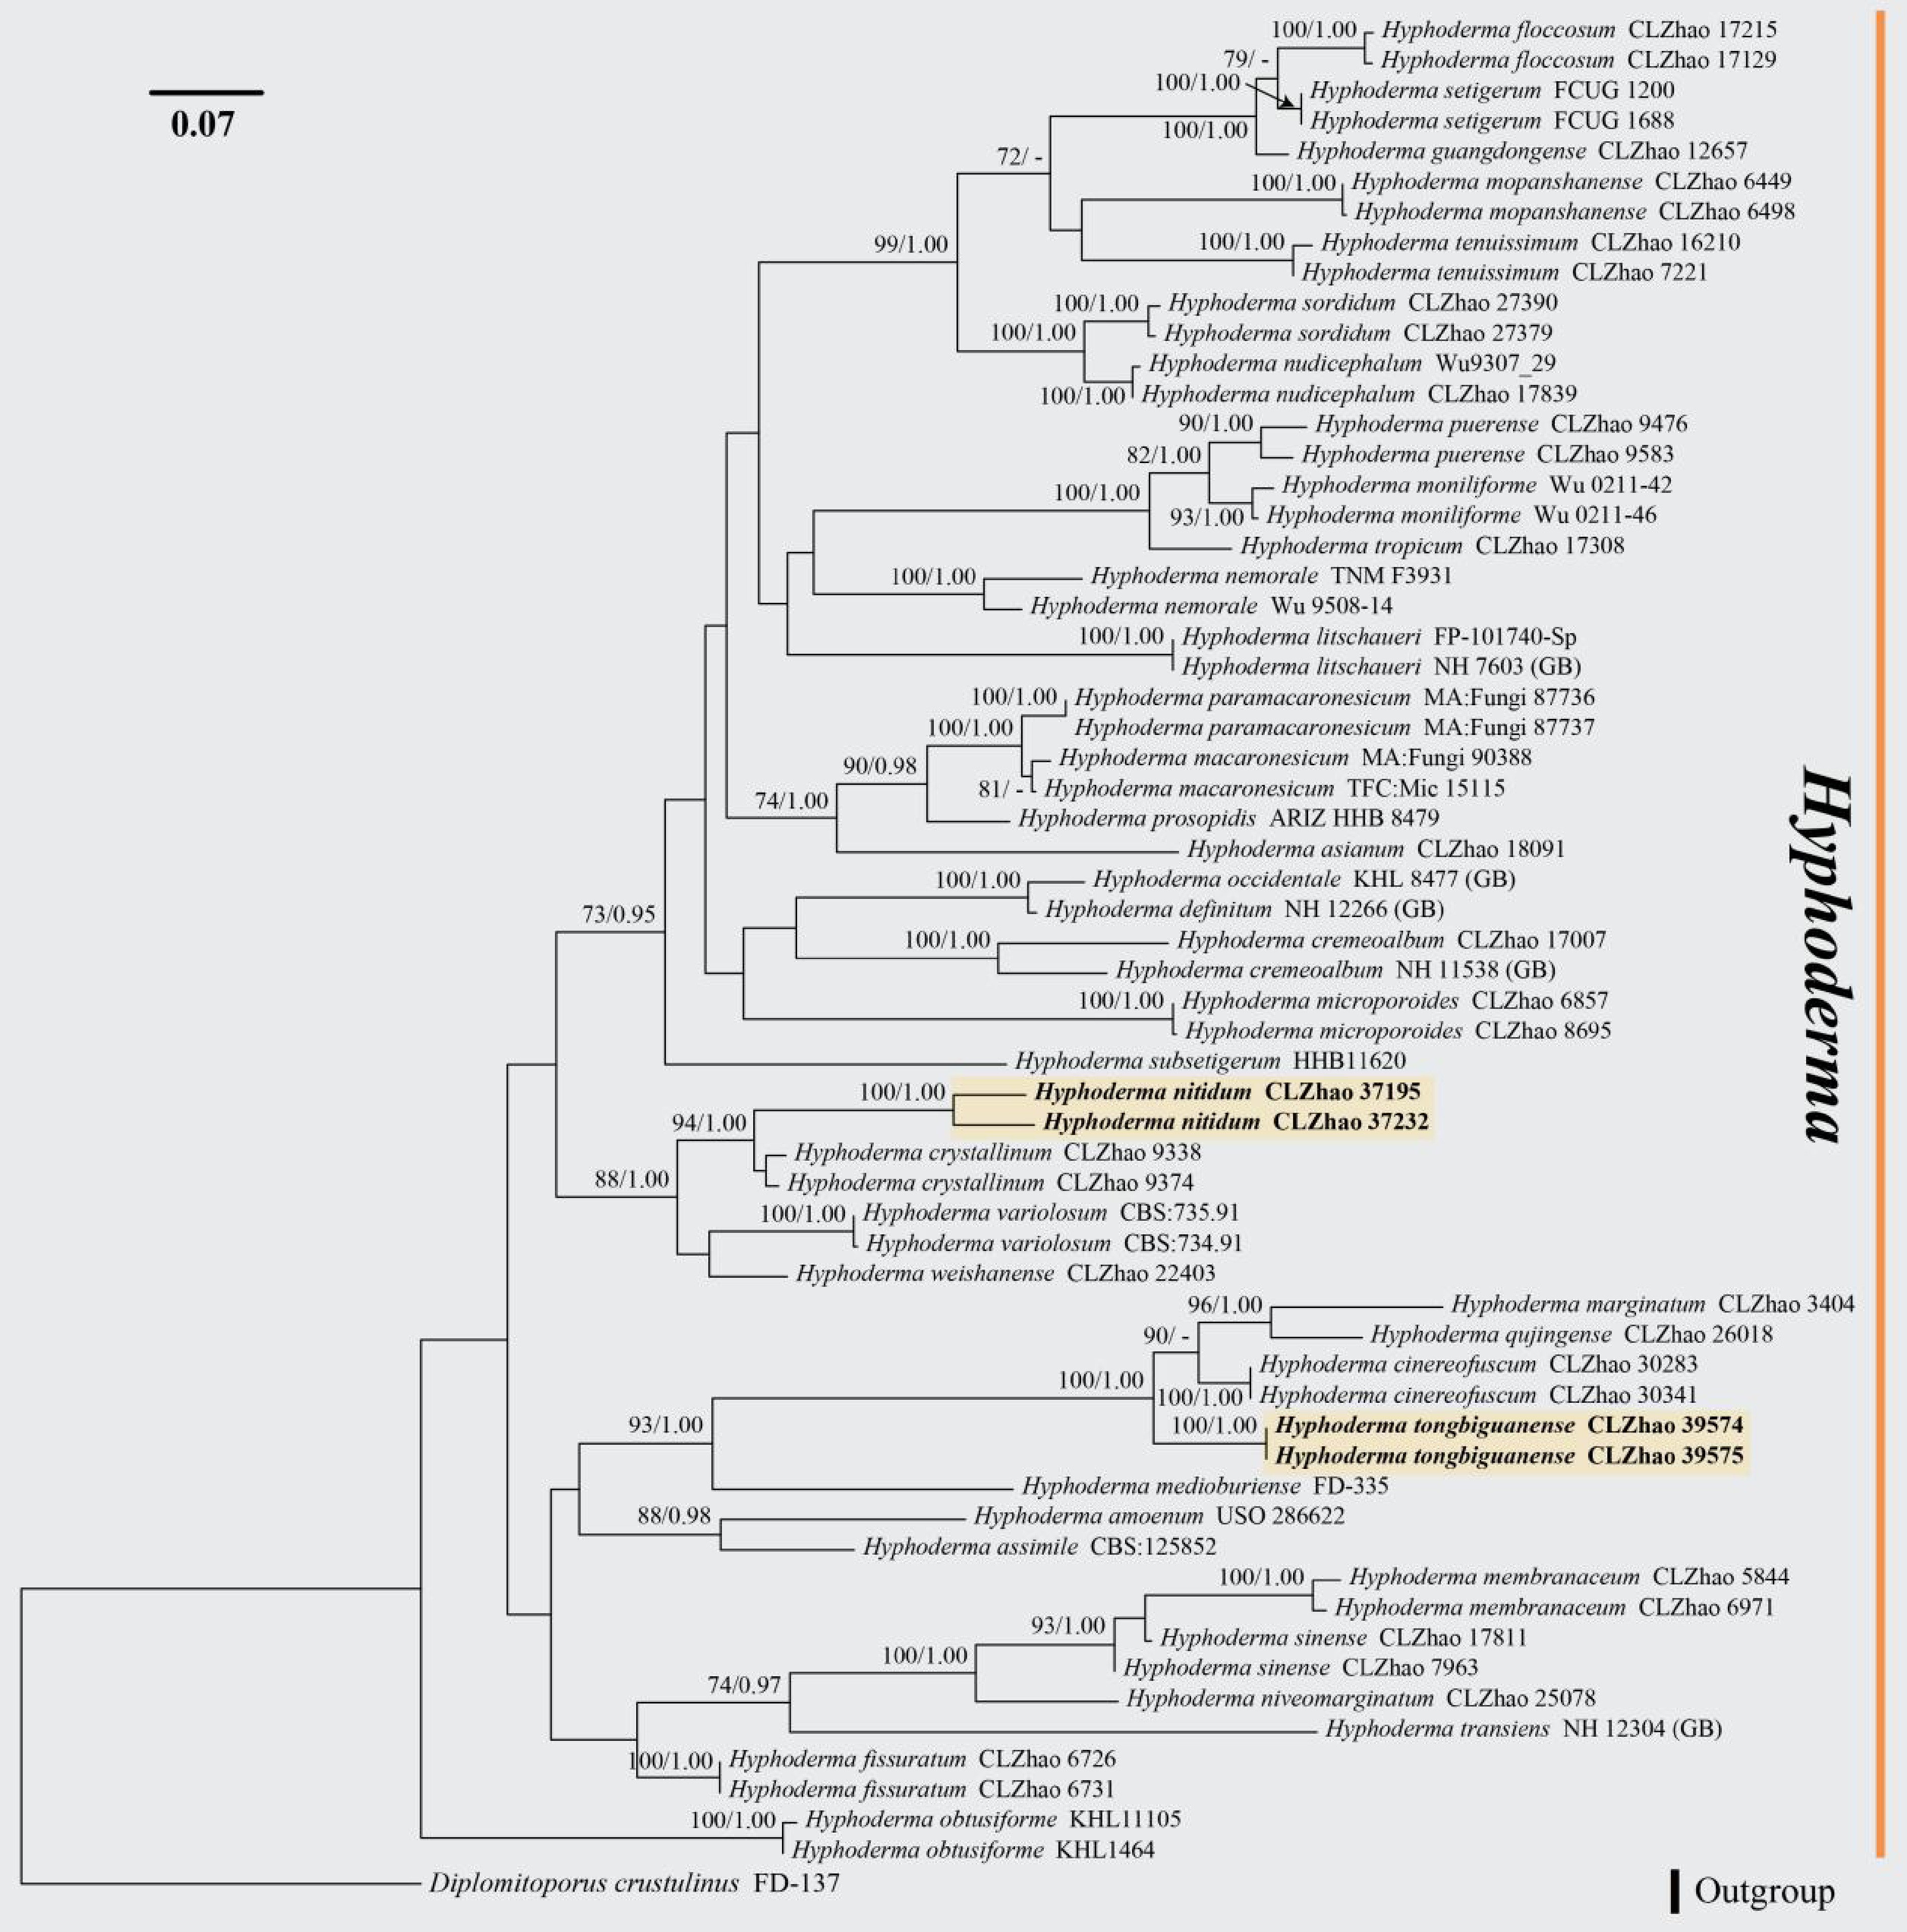
Figure 9.
Maximum likelihood tree illustrating the phylogeny of Hyphoderma nitidum and H. tongbiguanense related taxa based on ITS nuclear rDNA sequences dataset. Branches are labeled with Maximum likelihood bootstrap equal to or higher than 60%, and Bayesian posterior probabilities equal to or higher than 0.9. Vouchers are indicated after the species names. New species in bold (black).
-
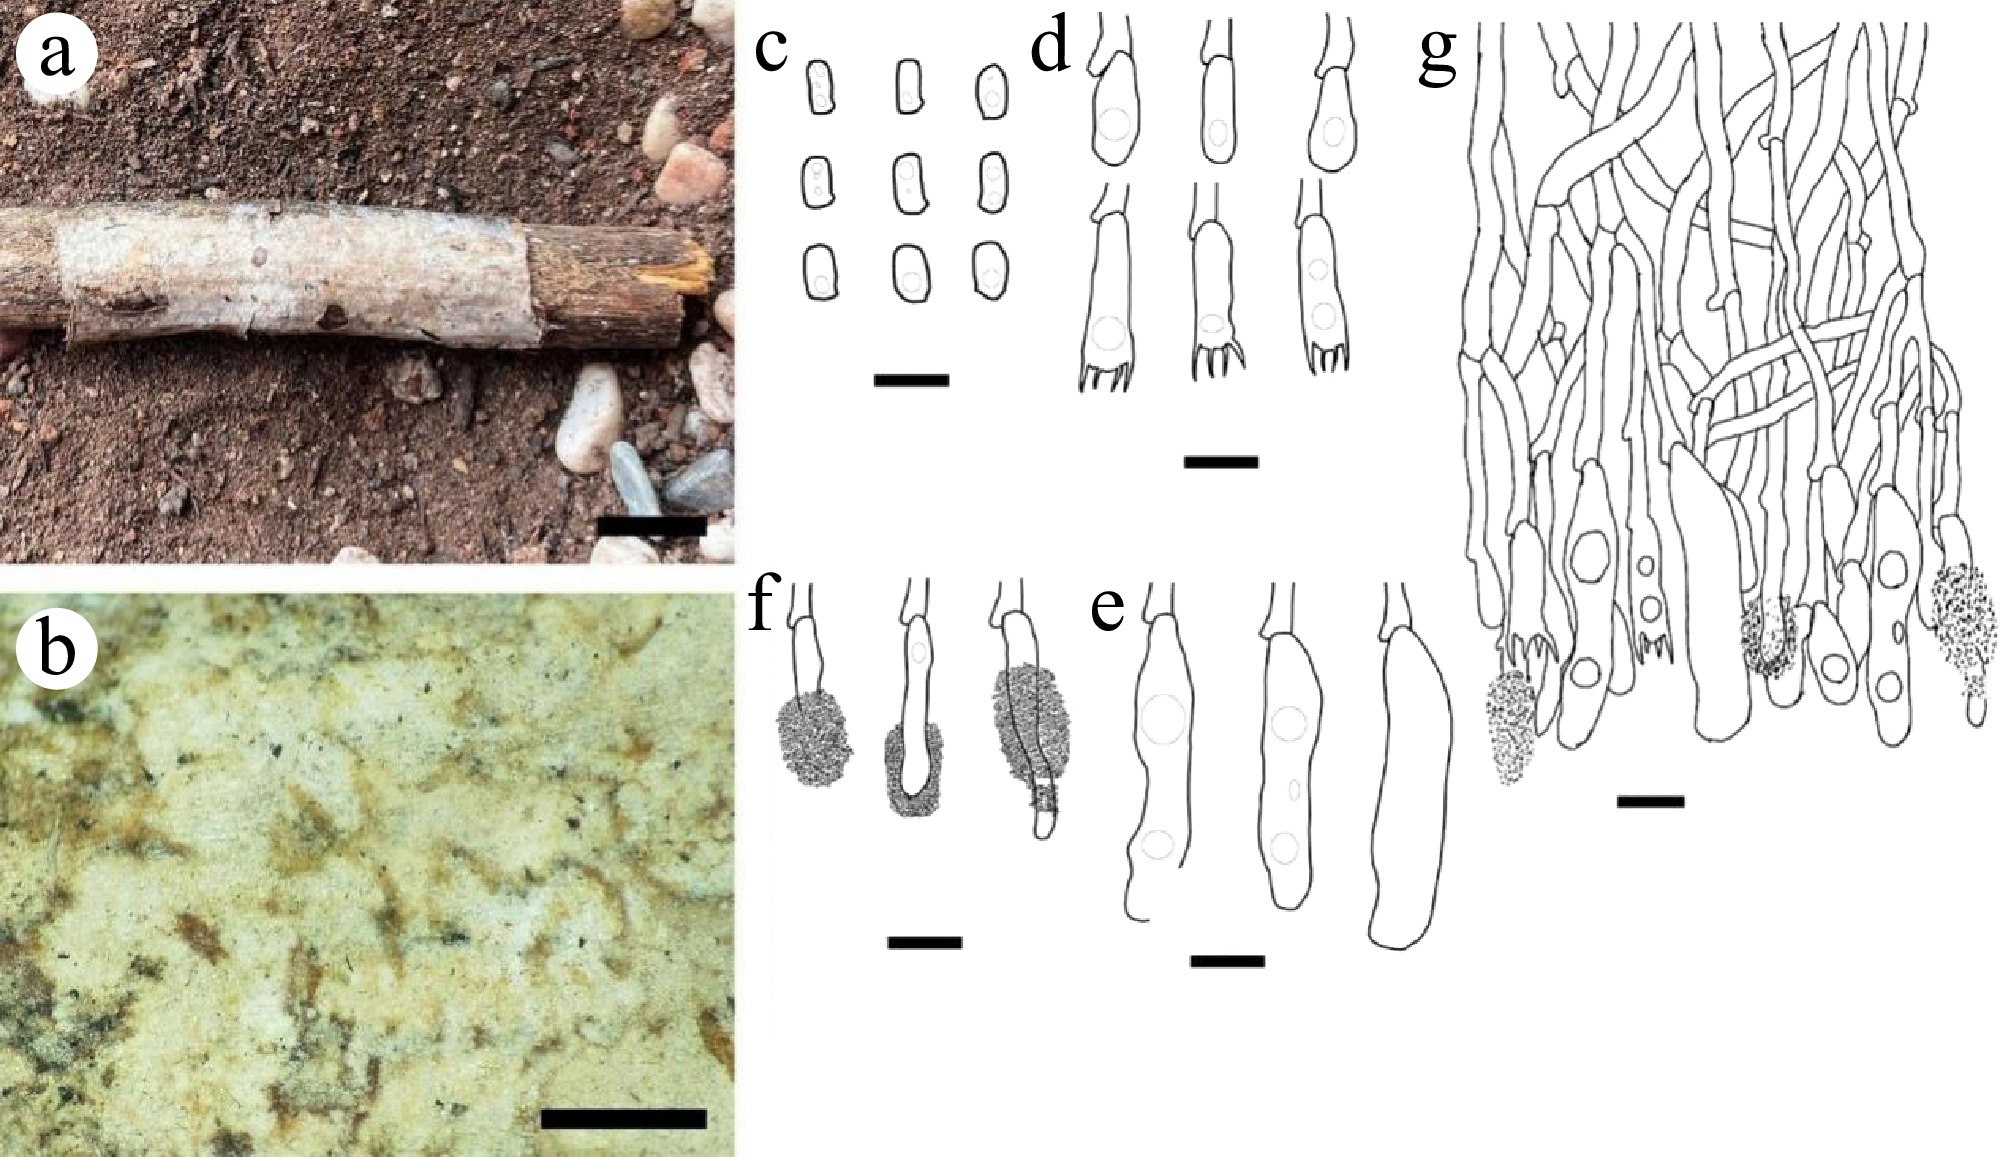
Figure 10.
Hyphoderma nitidum (holotype CLZhao 37195). (a), (b) Basidiocarp. Microscopic structures: (c) Basidiospores; (d) Basidia and basidioles; (e) Tubular cystidia; (f) Pseudocystidia; (g) Section through basidiocarp. Scale bars: (a) = 1 cm; (b) = 1 mm; (c)–(g) = 10 µm.
-
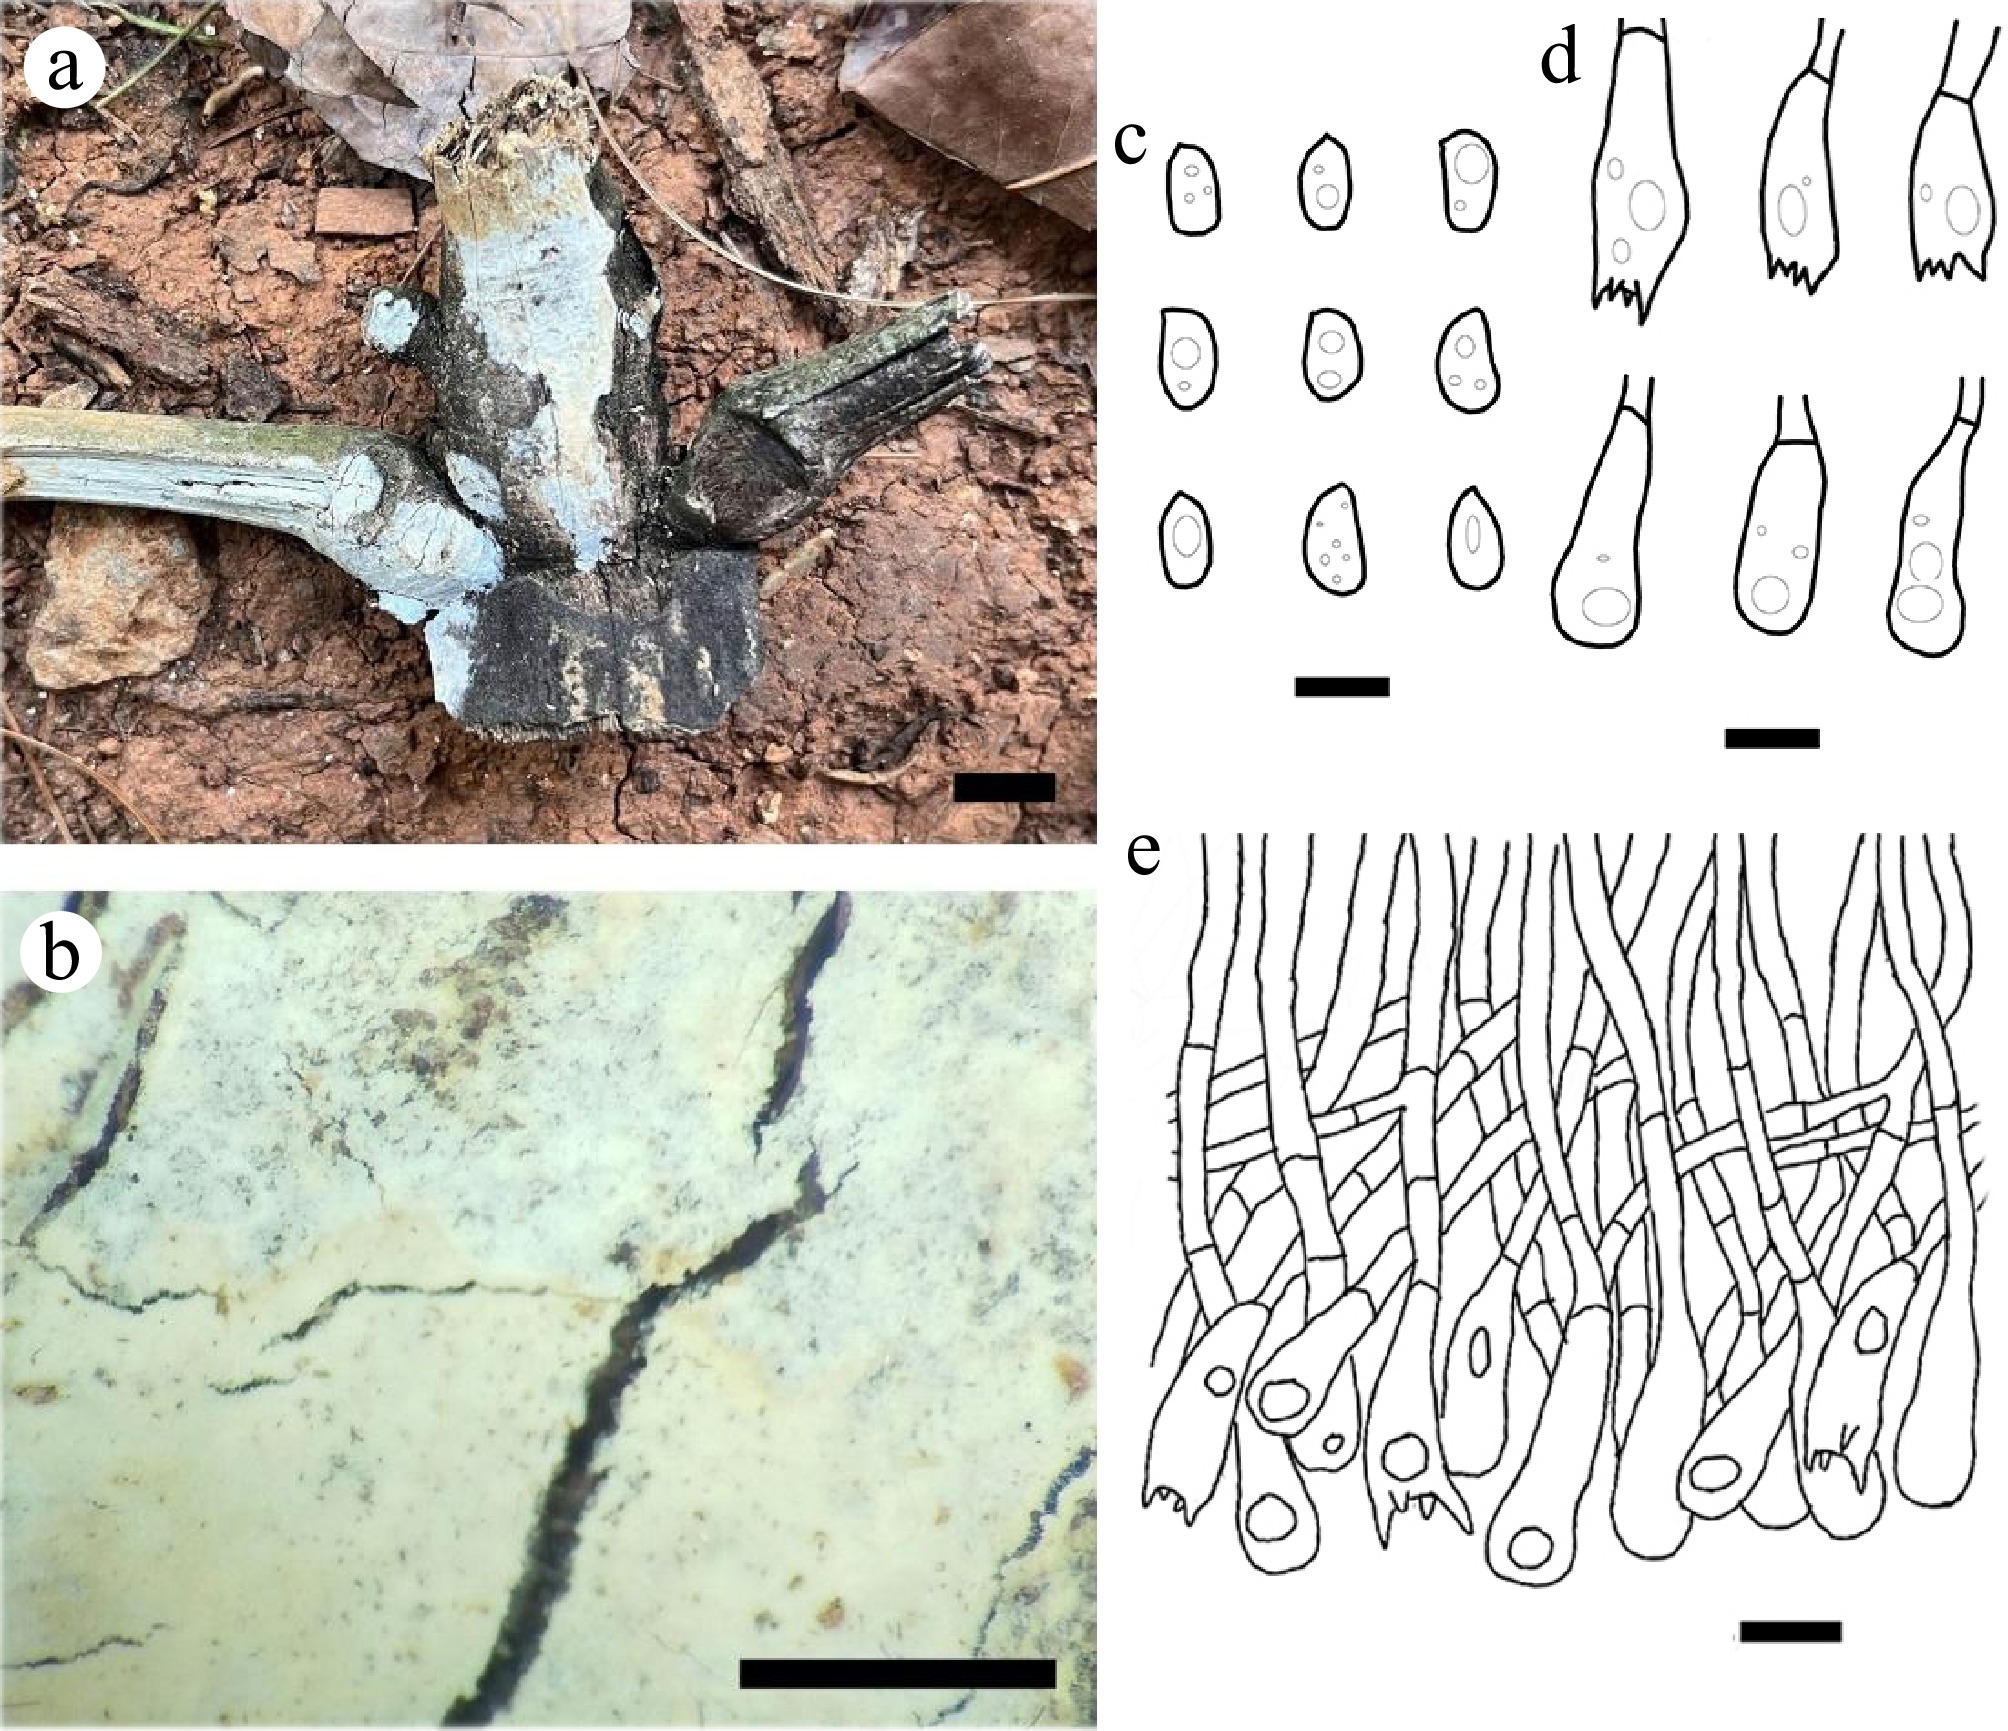
Figure 11.
Hyphoderma tongbiguanense (holotype CLZhao 39575). (a), (b) Basidiocarp. Microscopic structures: (c) Basidiospores; (d) Basidia and basidioles; (e) Section through basidiocarp. Scale bars: (a) = 1 cm; (b) = 1 mm; (c)–(e) = 10 µm.
-
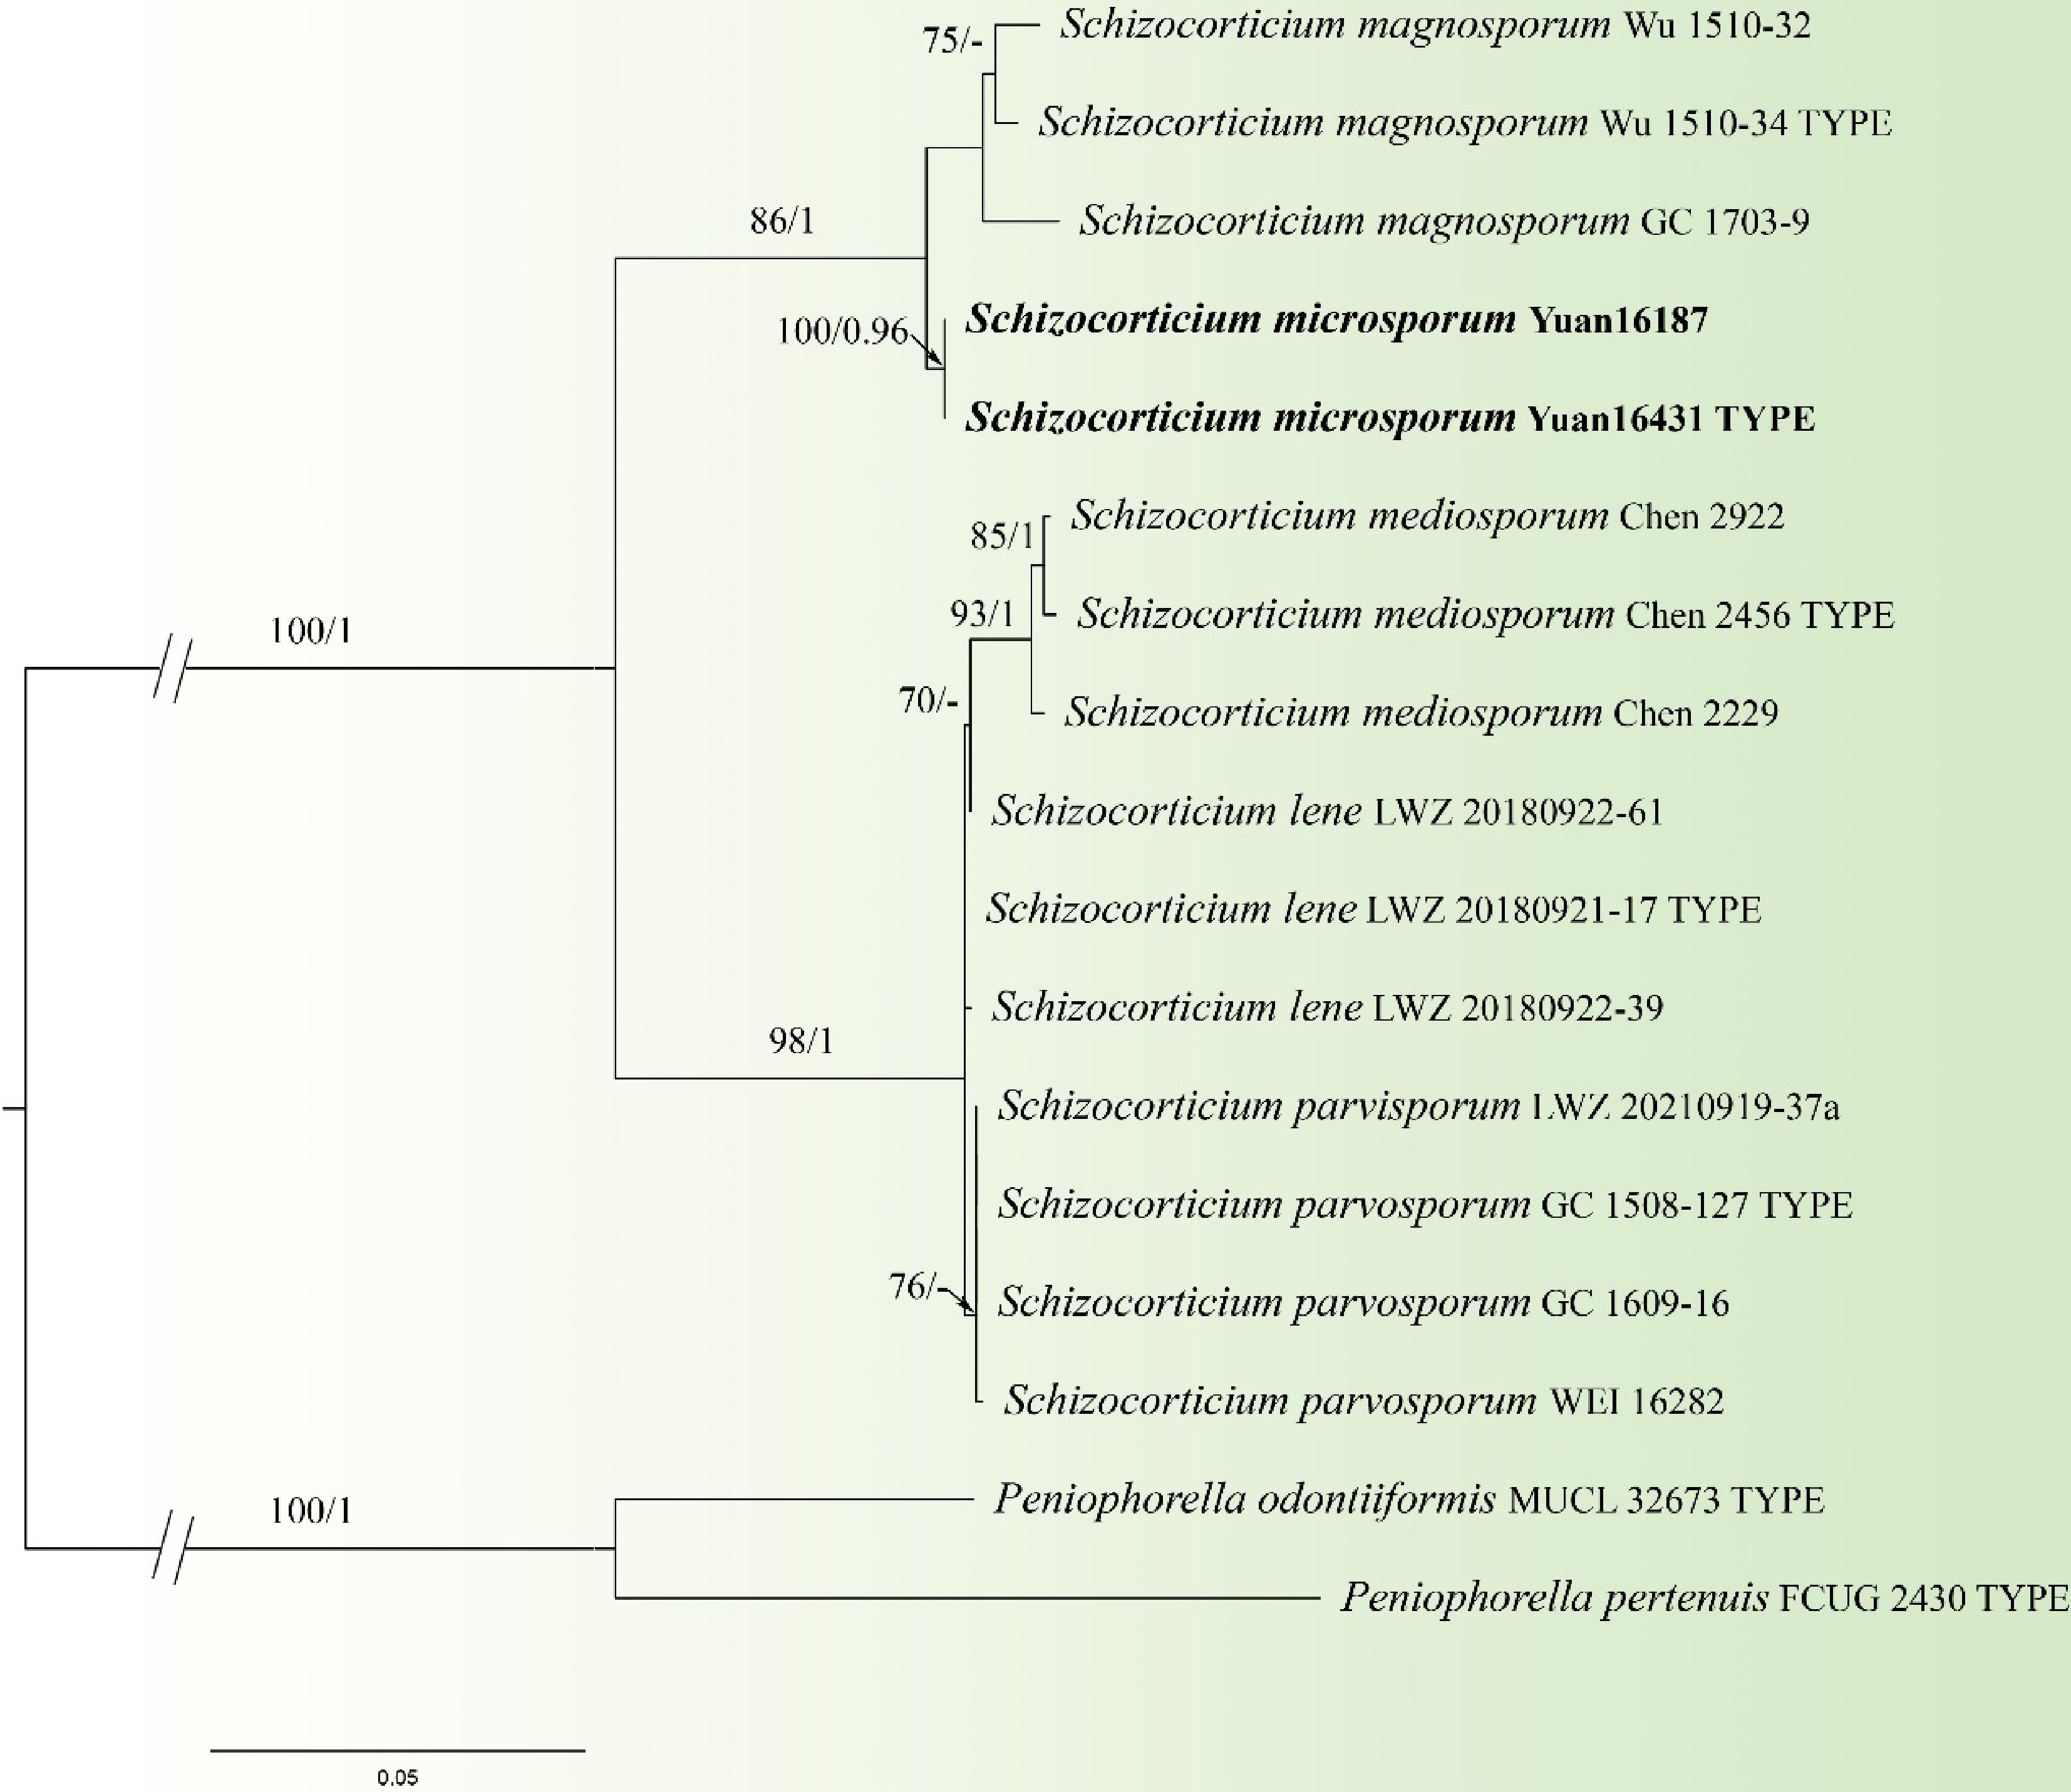
Figure 12.
Maximum likelihood tree illustrating the phylogeny of Schizocorticium microsporum related taxa based on ITS + LSU nuclear rDNA sequences dataset. Branches are labeled with Maximum likelihood bootstrap equal to or higher than 60%, and Bayesian posterior probabilities equal to or higher than 0.9. Vouchers are indicated after the species names. New species in bold (black).
-
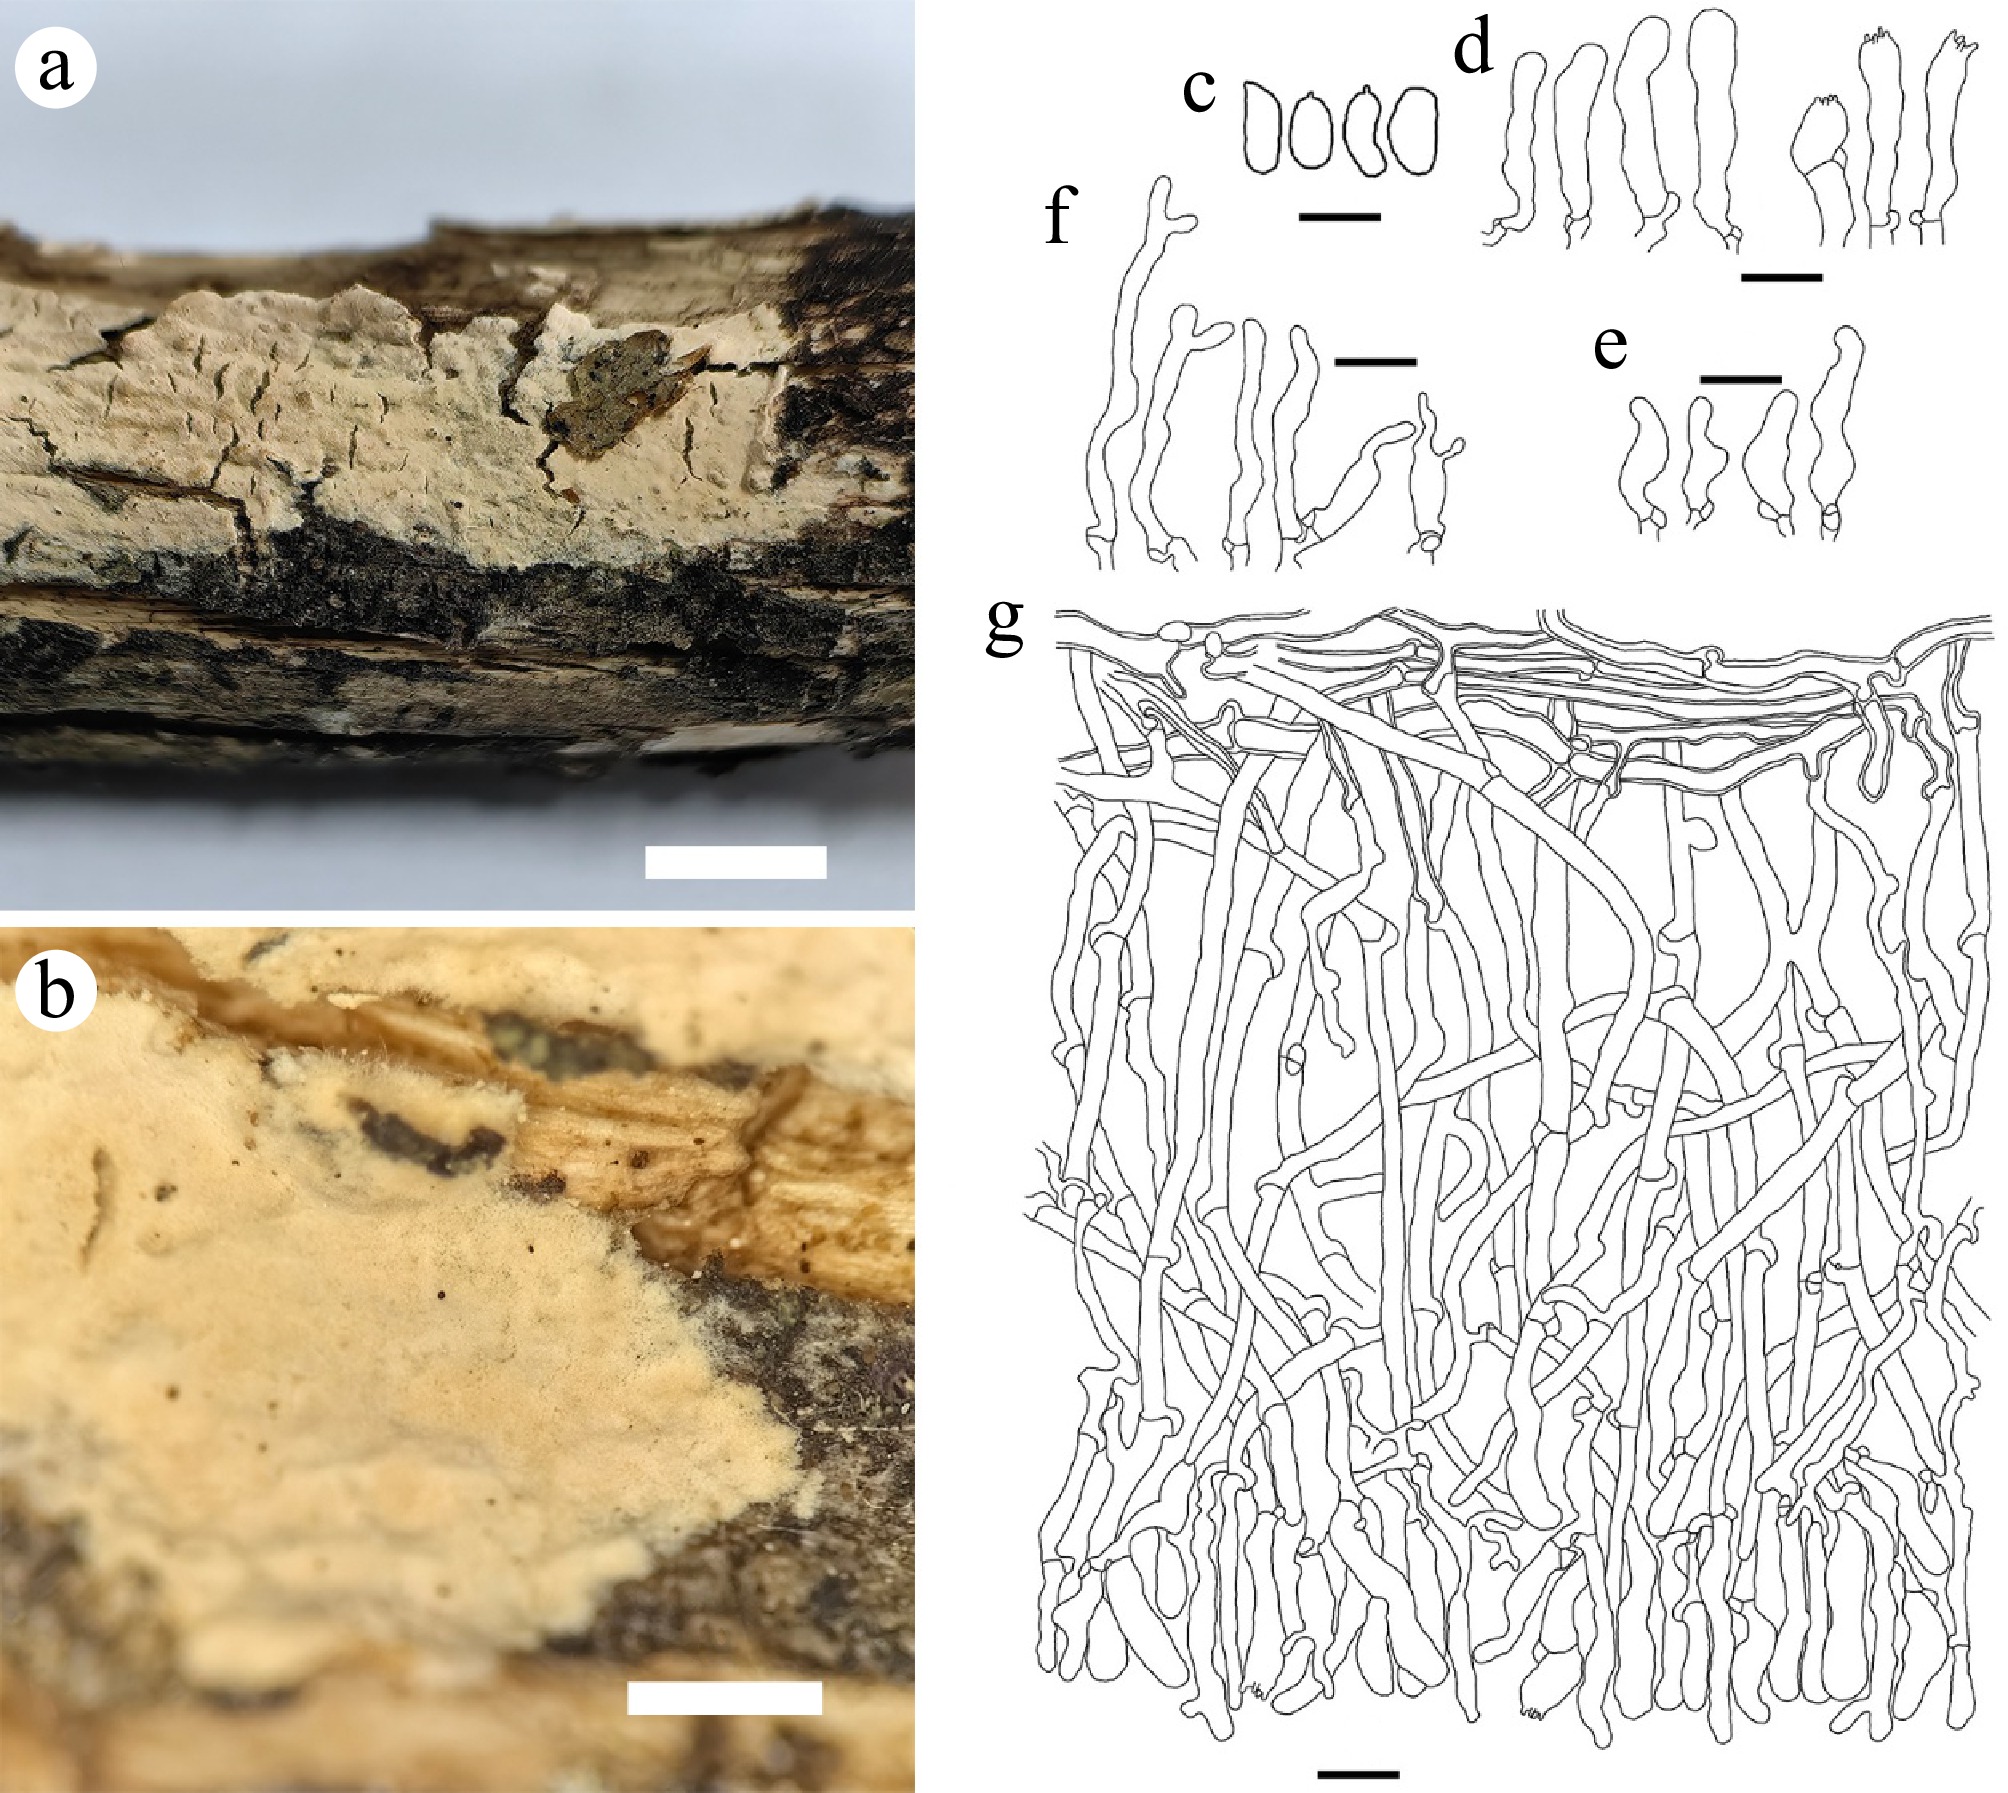
Figure 13.
Schizocorticium microsporum (holotype Yuan 16431). (a) Basidiocarp. Microscopic structures: (b) Section through basidiocarp; (c) Basidiospores; (d) Basidioles; (e) Basidia; (f) Cystidia. Scale bars: (a) = 1 cm; (b) = 1 mm; (c) = 5 µm; (d)–(g) = 10 µm.
-
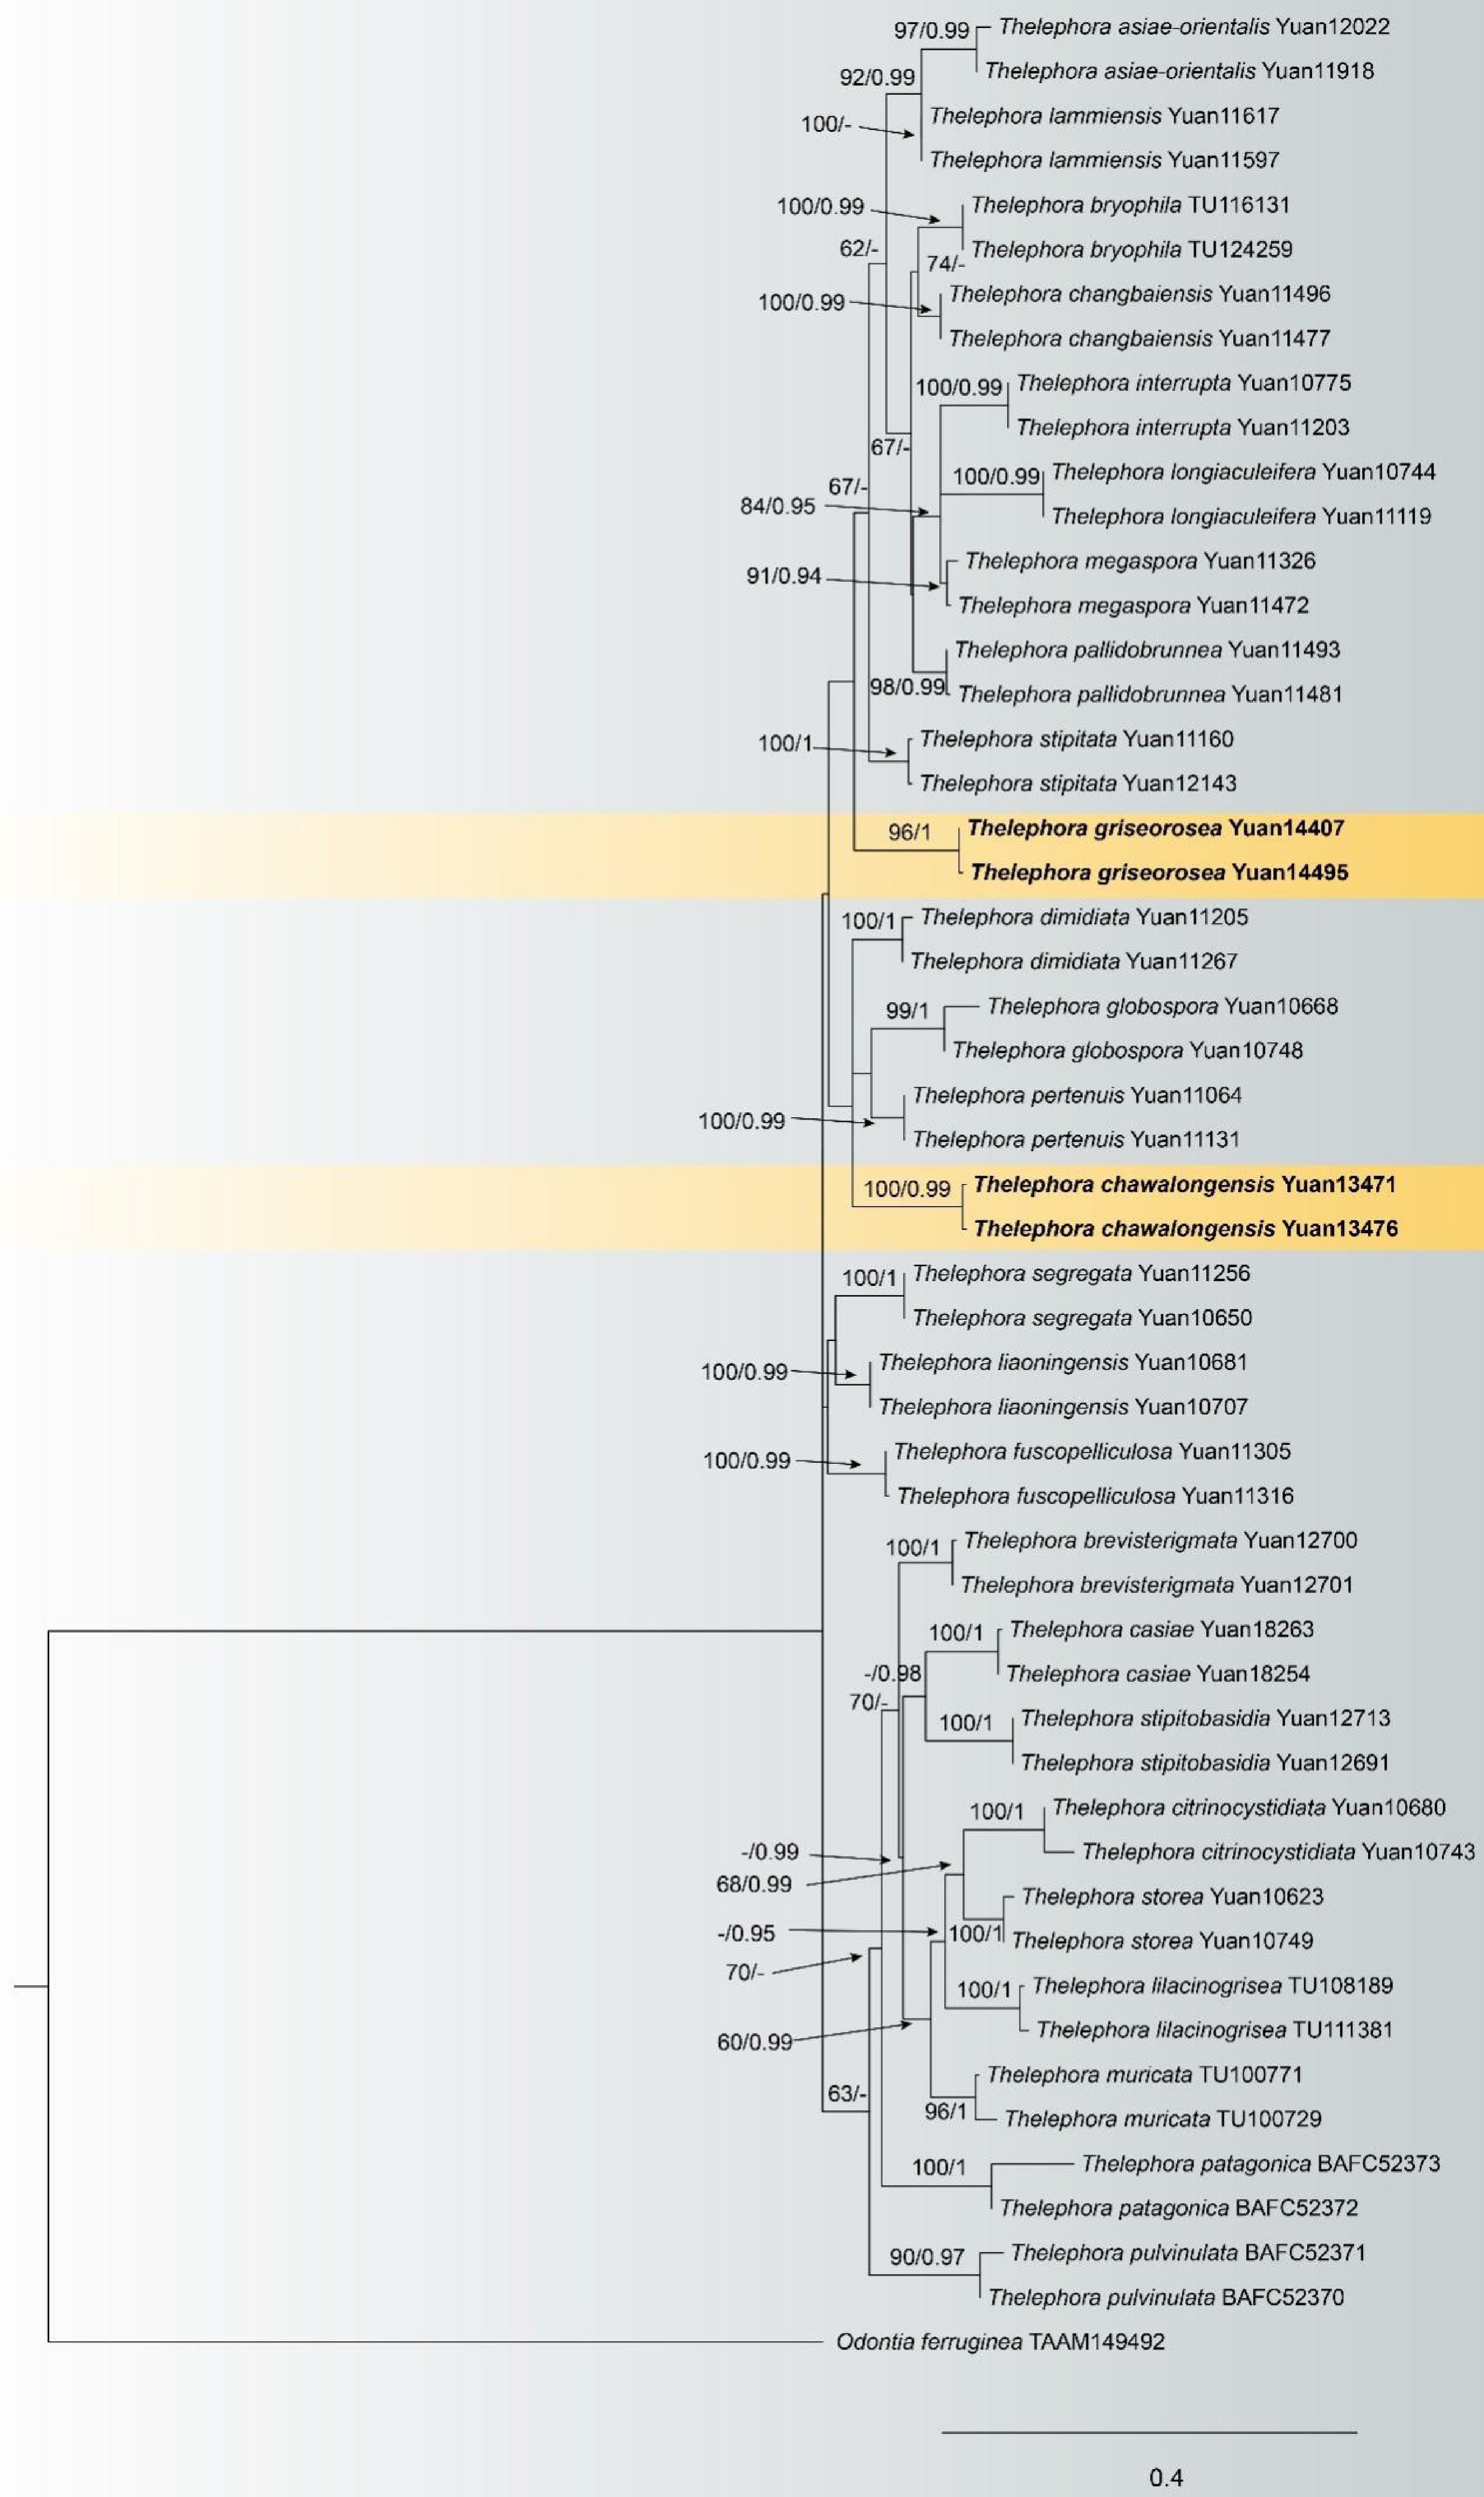
Figure 14.
Maximum likelihood tree illustrating the phylogeny of Thelephora chawalongensis and T. griseorosea related taxa based on ITS + LSU nuclear rDNA sequences dataset. Branches are labeled with Maximum likelihood bootstrap equal to or higher than 60%, and Bayesian posterior probabilities equal to or higher than 0.9. Vouchers are indicated after the species names. New species in bold (black).
-
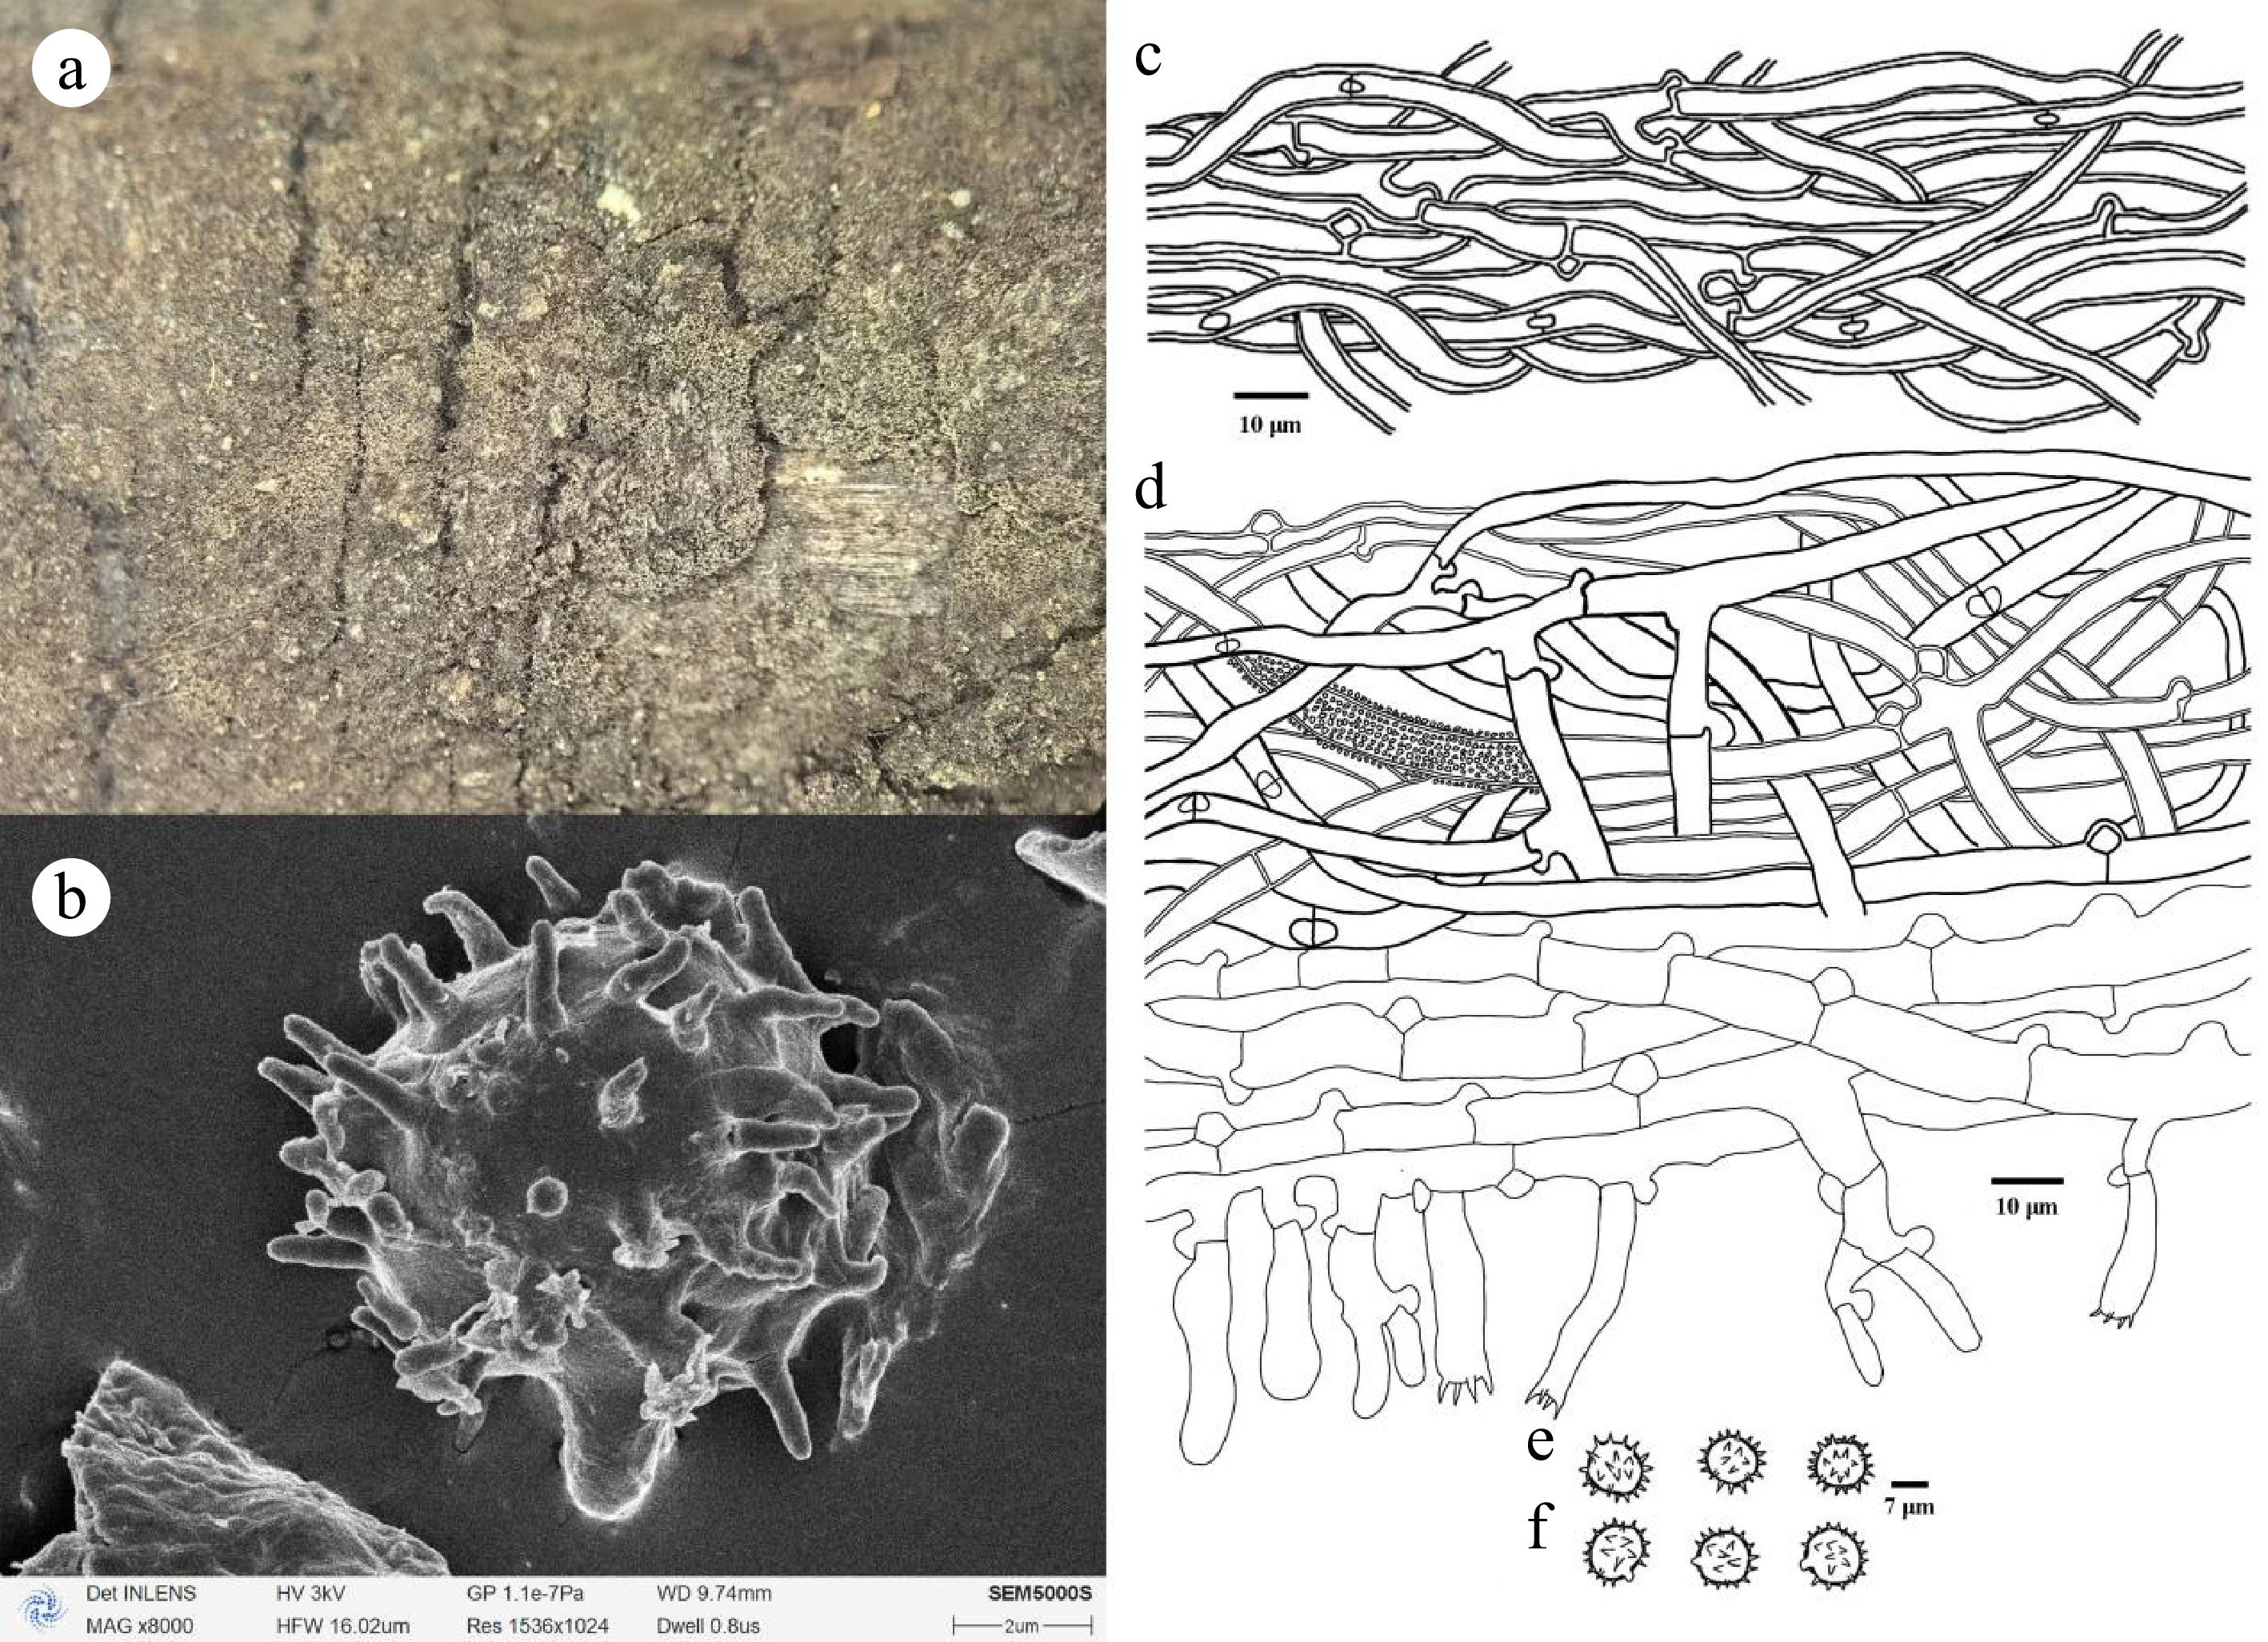
Figure 15.
Thelephora chawalongensis (holotype Yuan 13476). (a) Basidiocarp; (b) SEM of basidiospores. Microscopic structures: (c) Hyphae from a rhizomorph; (d) Section through basidiocarp; (e) Basidiospores in frontal view; (f) Basidiospores in lateral view.
-
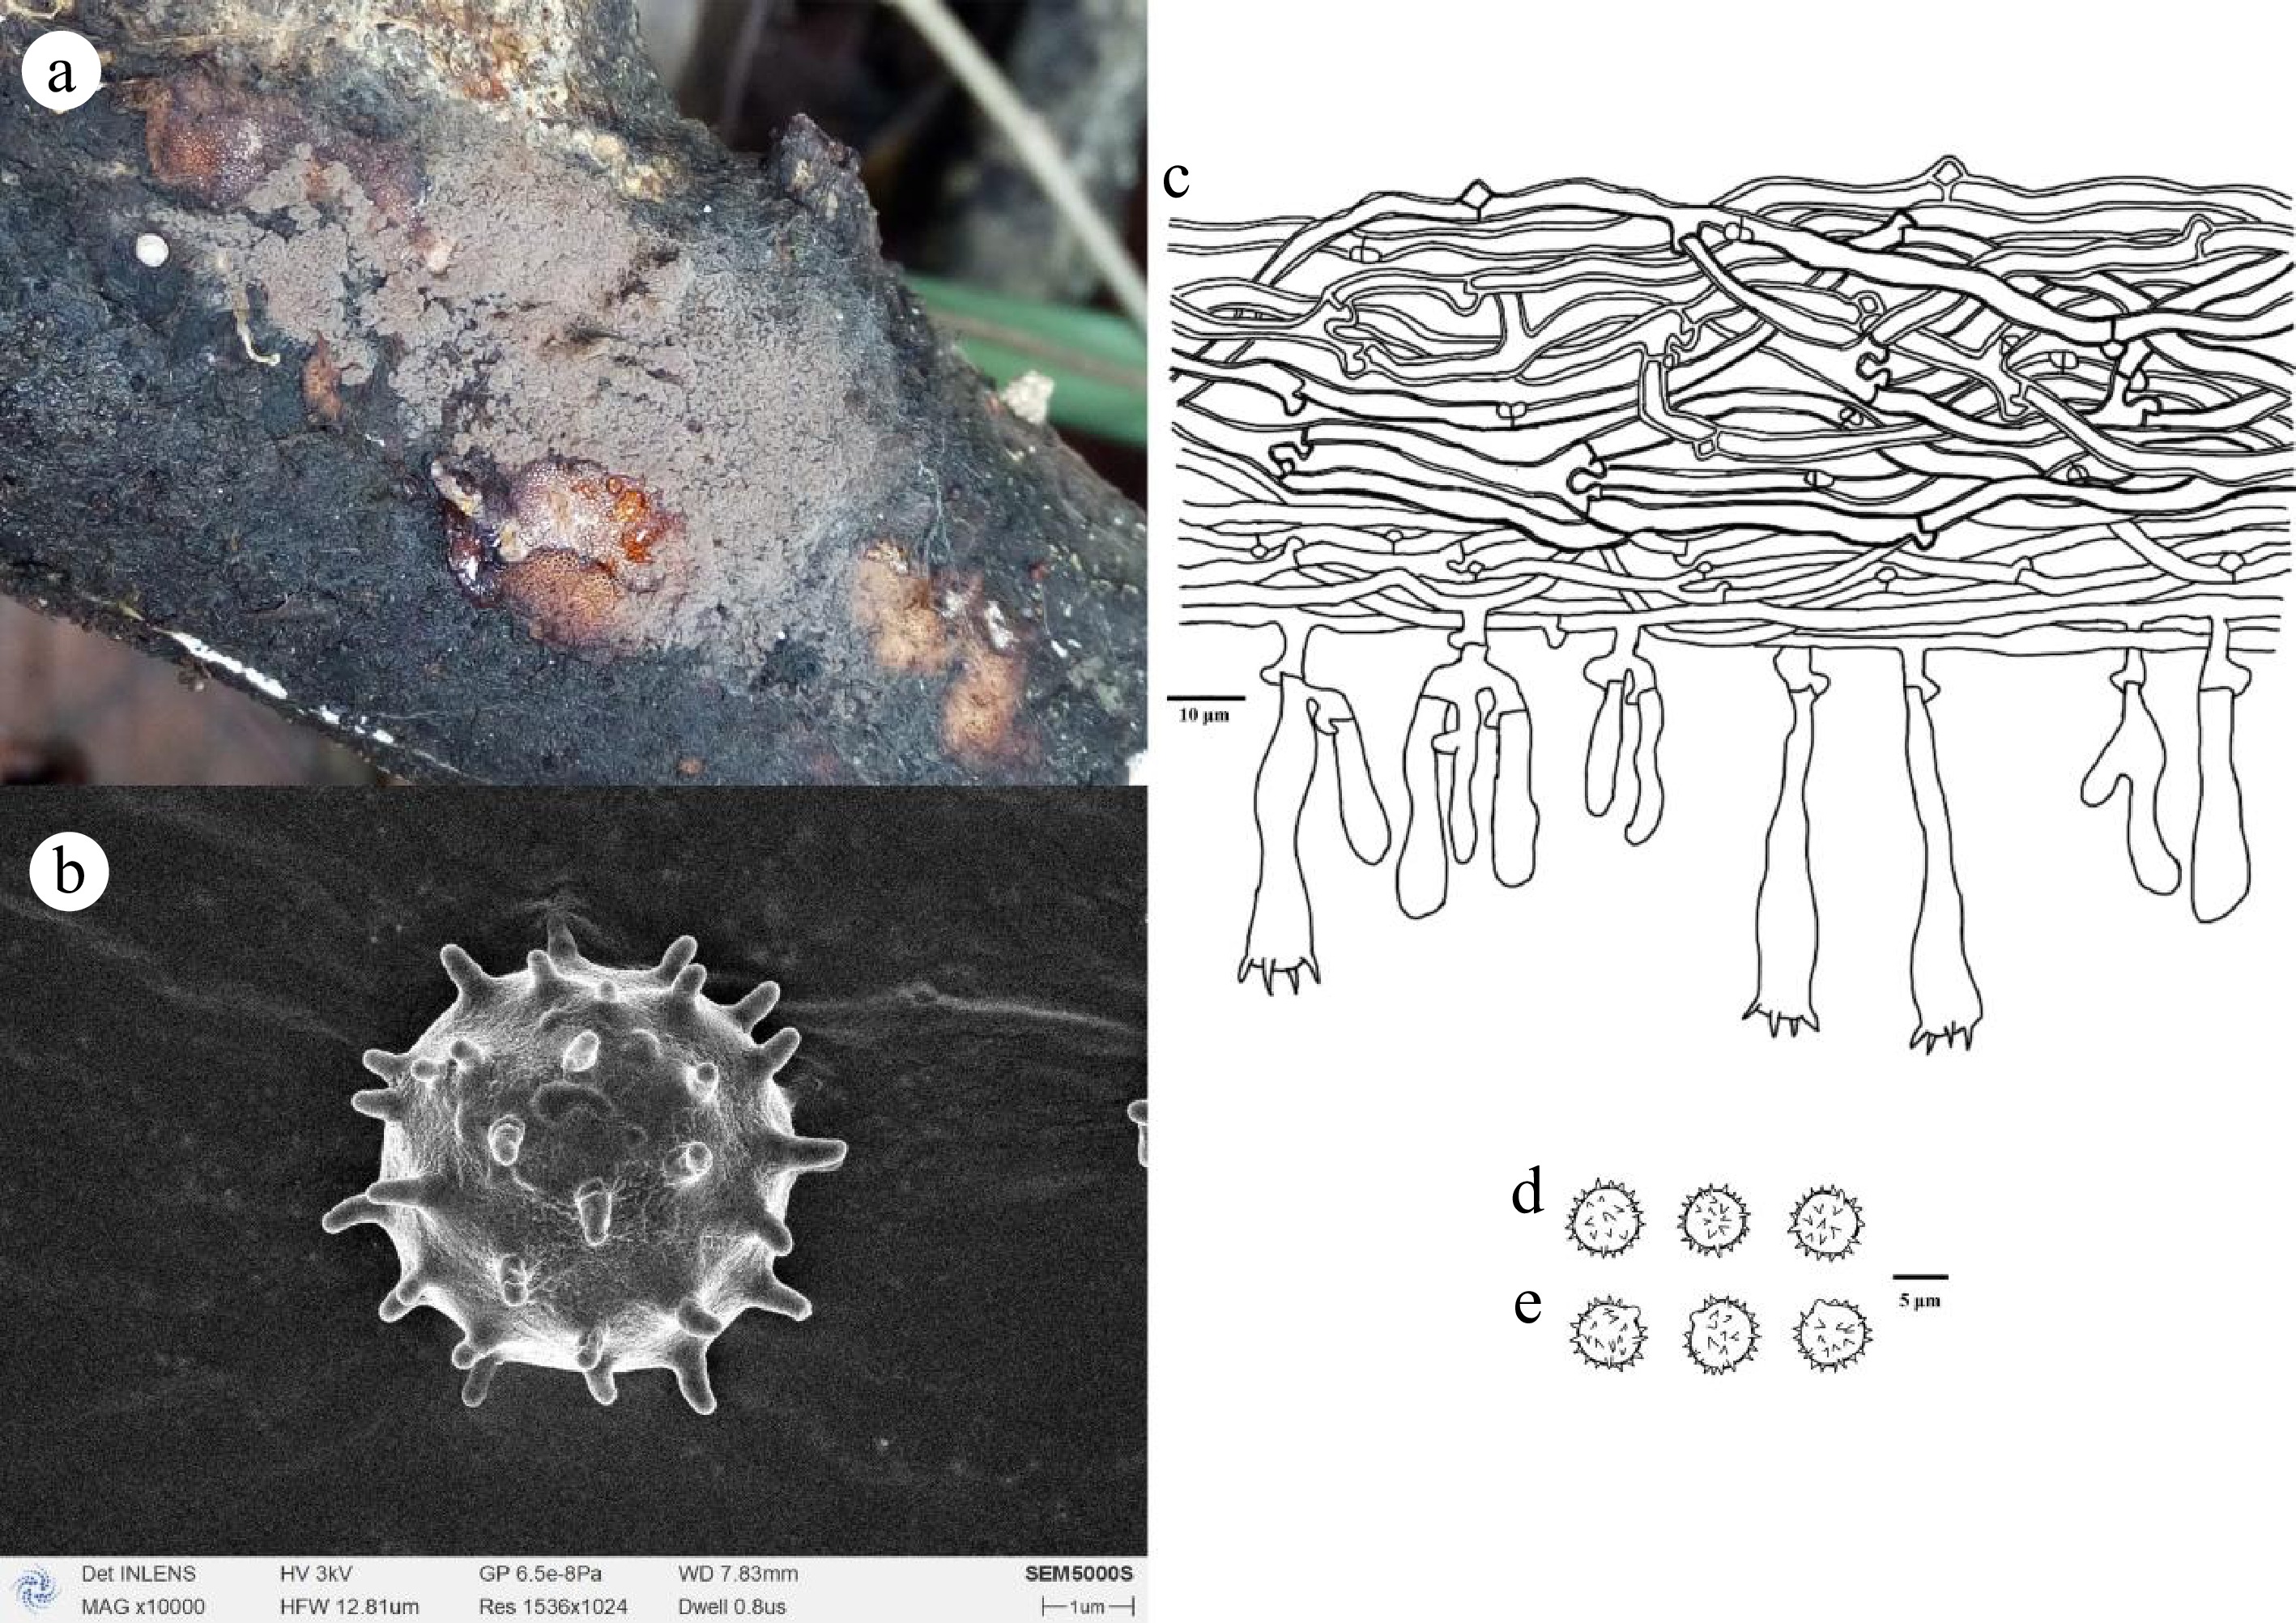
Figure 16.
Thelephora griseorosea (holotype Yuan 14495). (a) Basidiocarp; (b) SEM of basidiospores. Microscopic structures: (c) Section through basidiocarp; (d) Basidiospores in frontal view; (e) Basidiospores in lateral view.
-
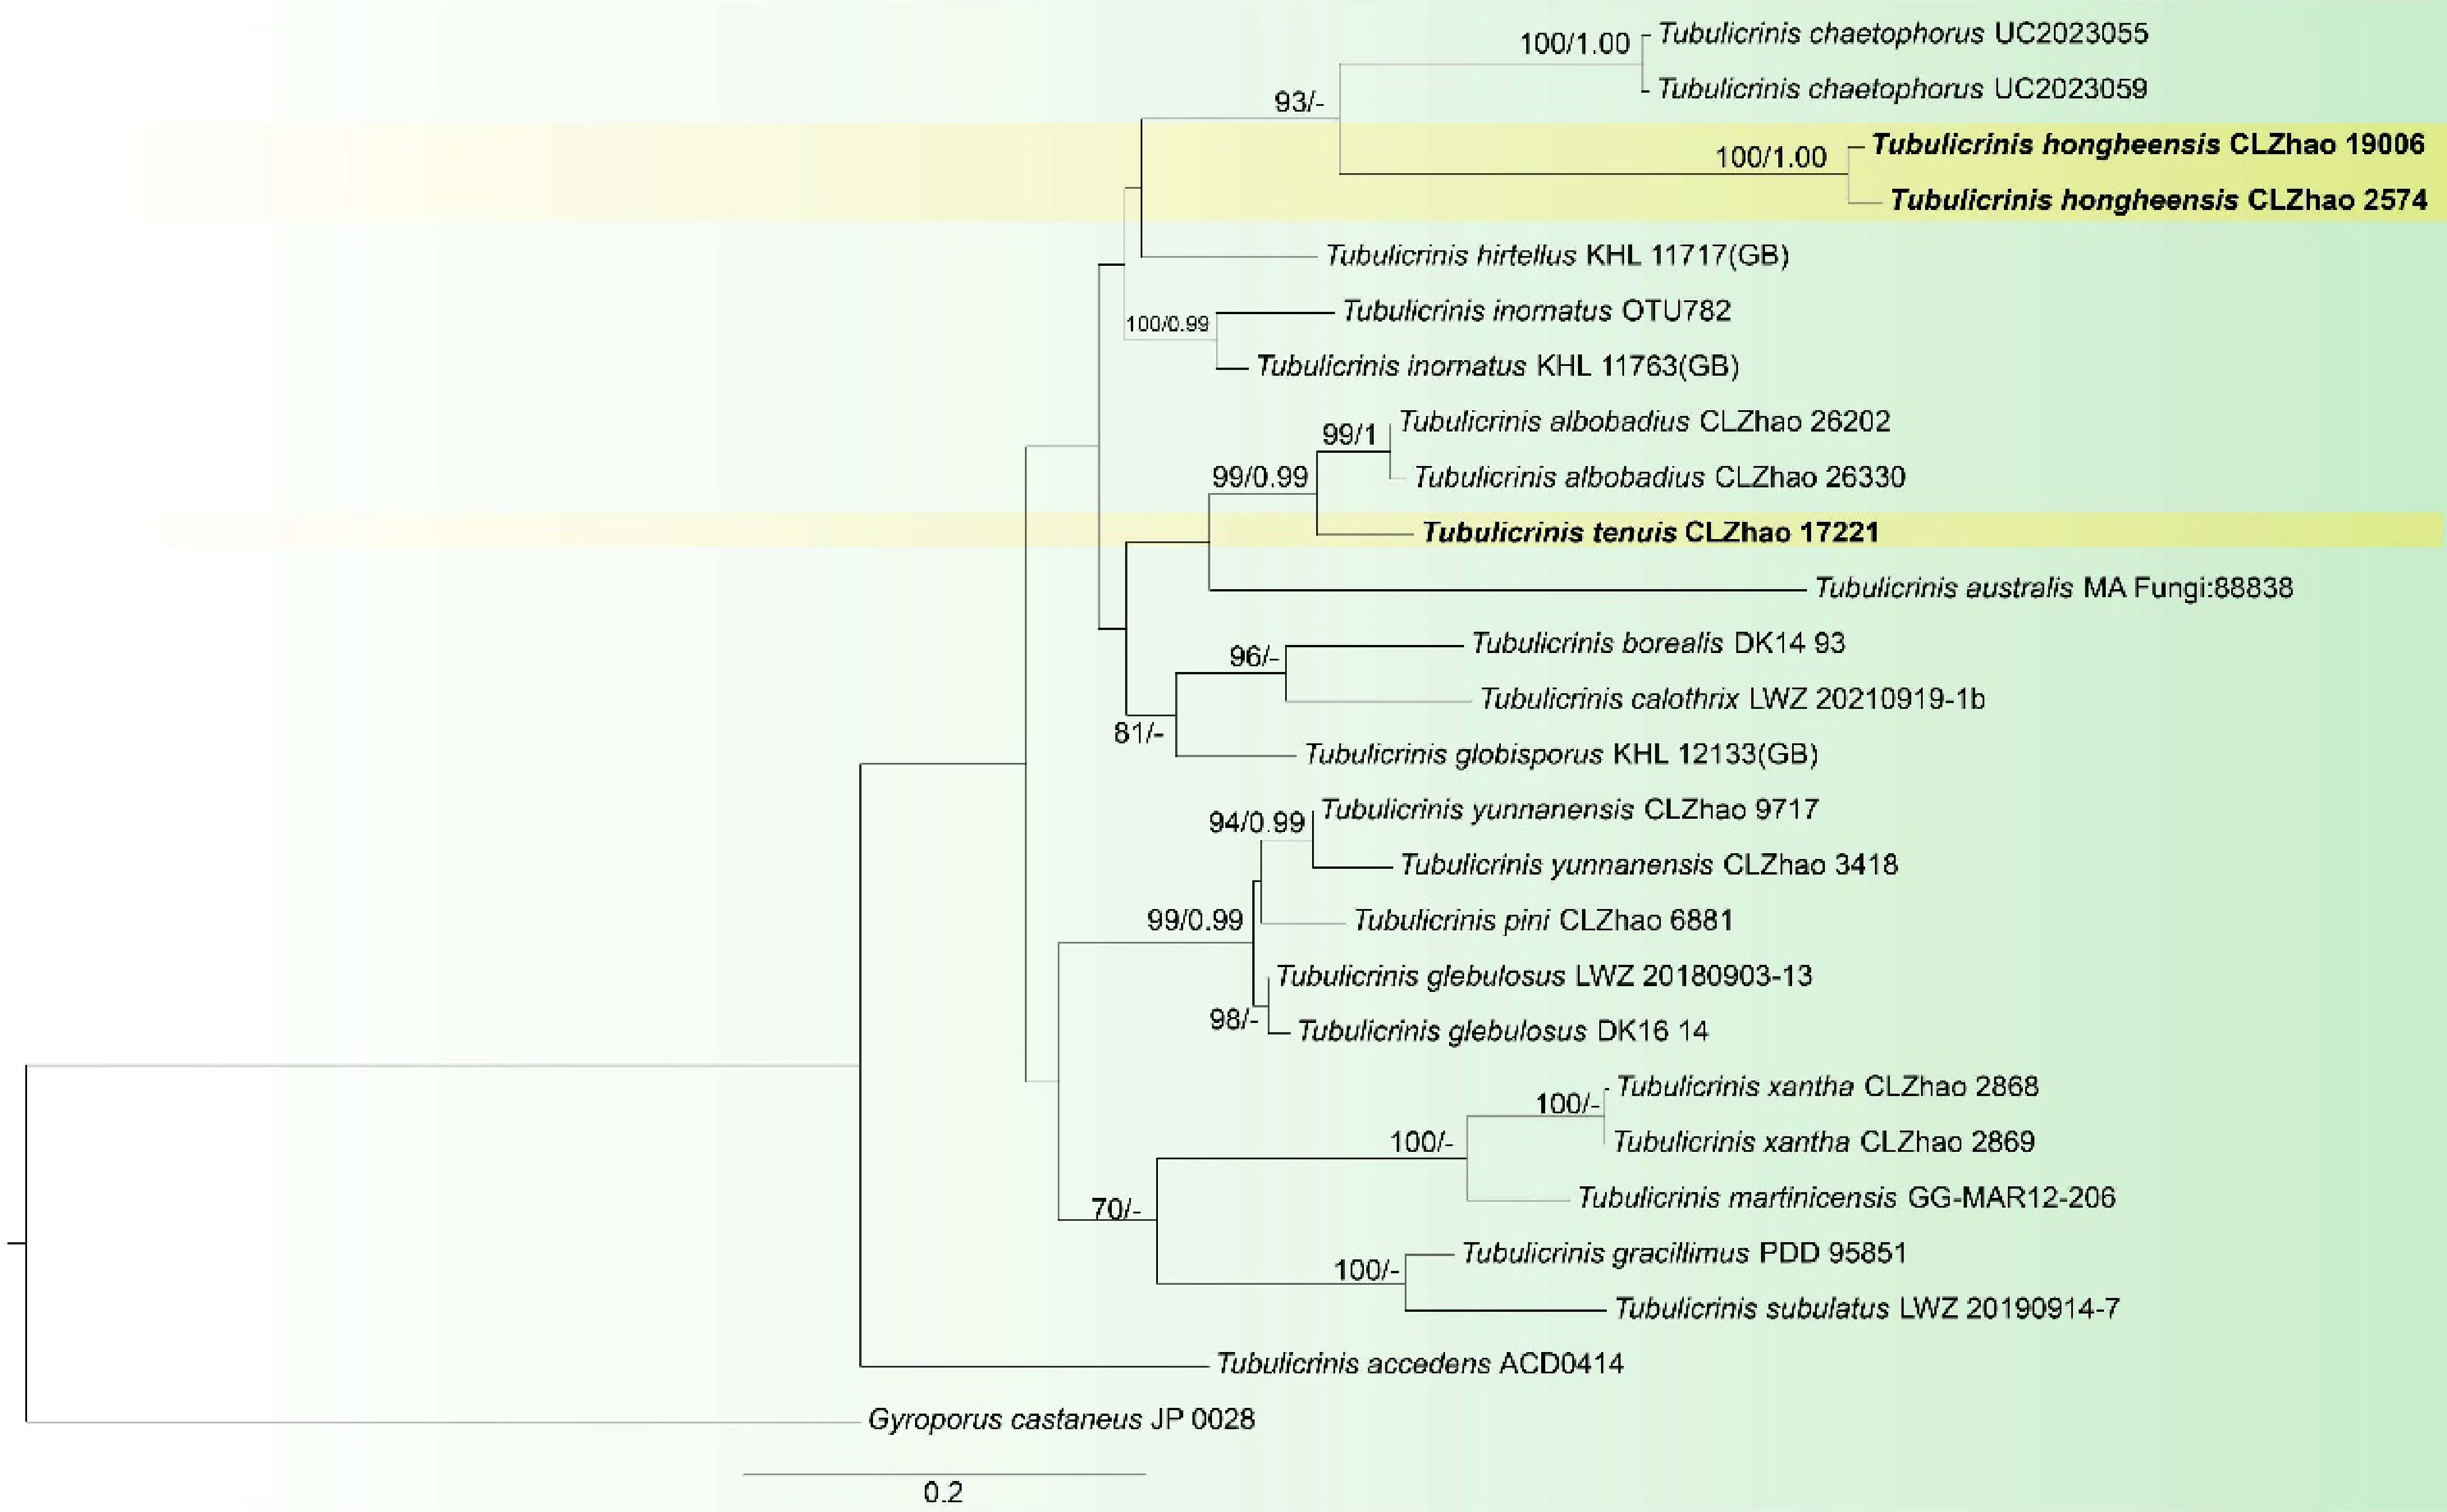
Figure 17.
Maximum likelihood tree illustrating the phylogeny of Tubulicrinis hongheensis and T. tenuis related taxa based on ITS nuclear rDNA sequences dataset. Branches are labeled with Maximum likelihood bootstrap equal to or higher than 60%, and Bayesian posterior probabilities equal to or higher than 0.9. Vouchers are indicated after the species names. New species in bold (black).
-
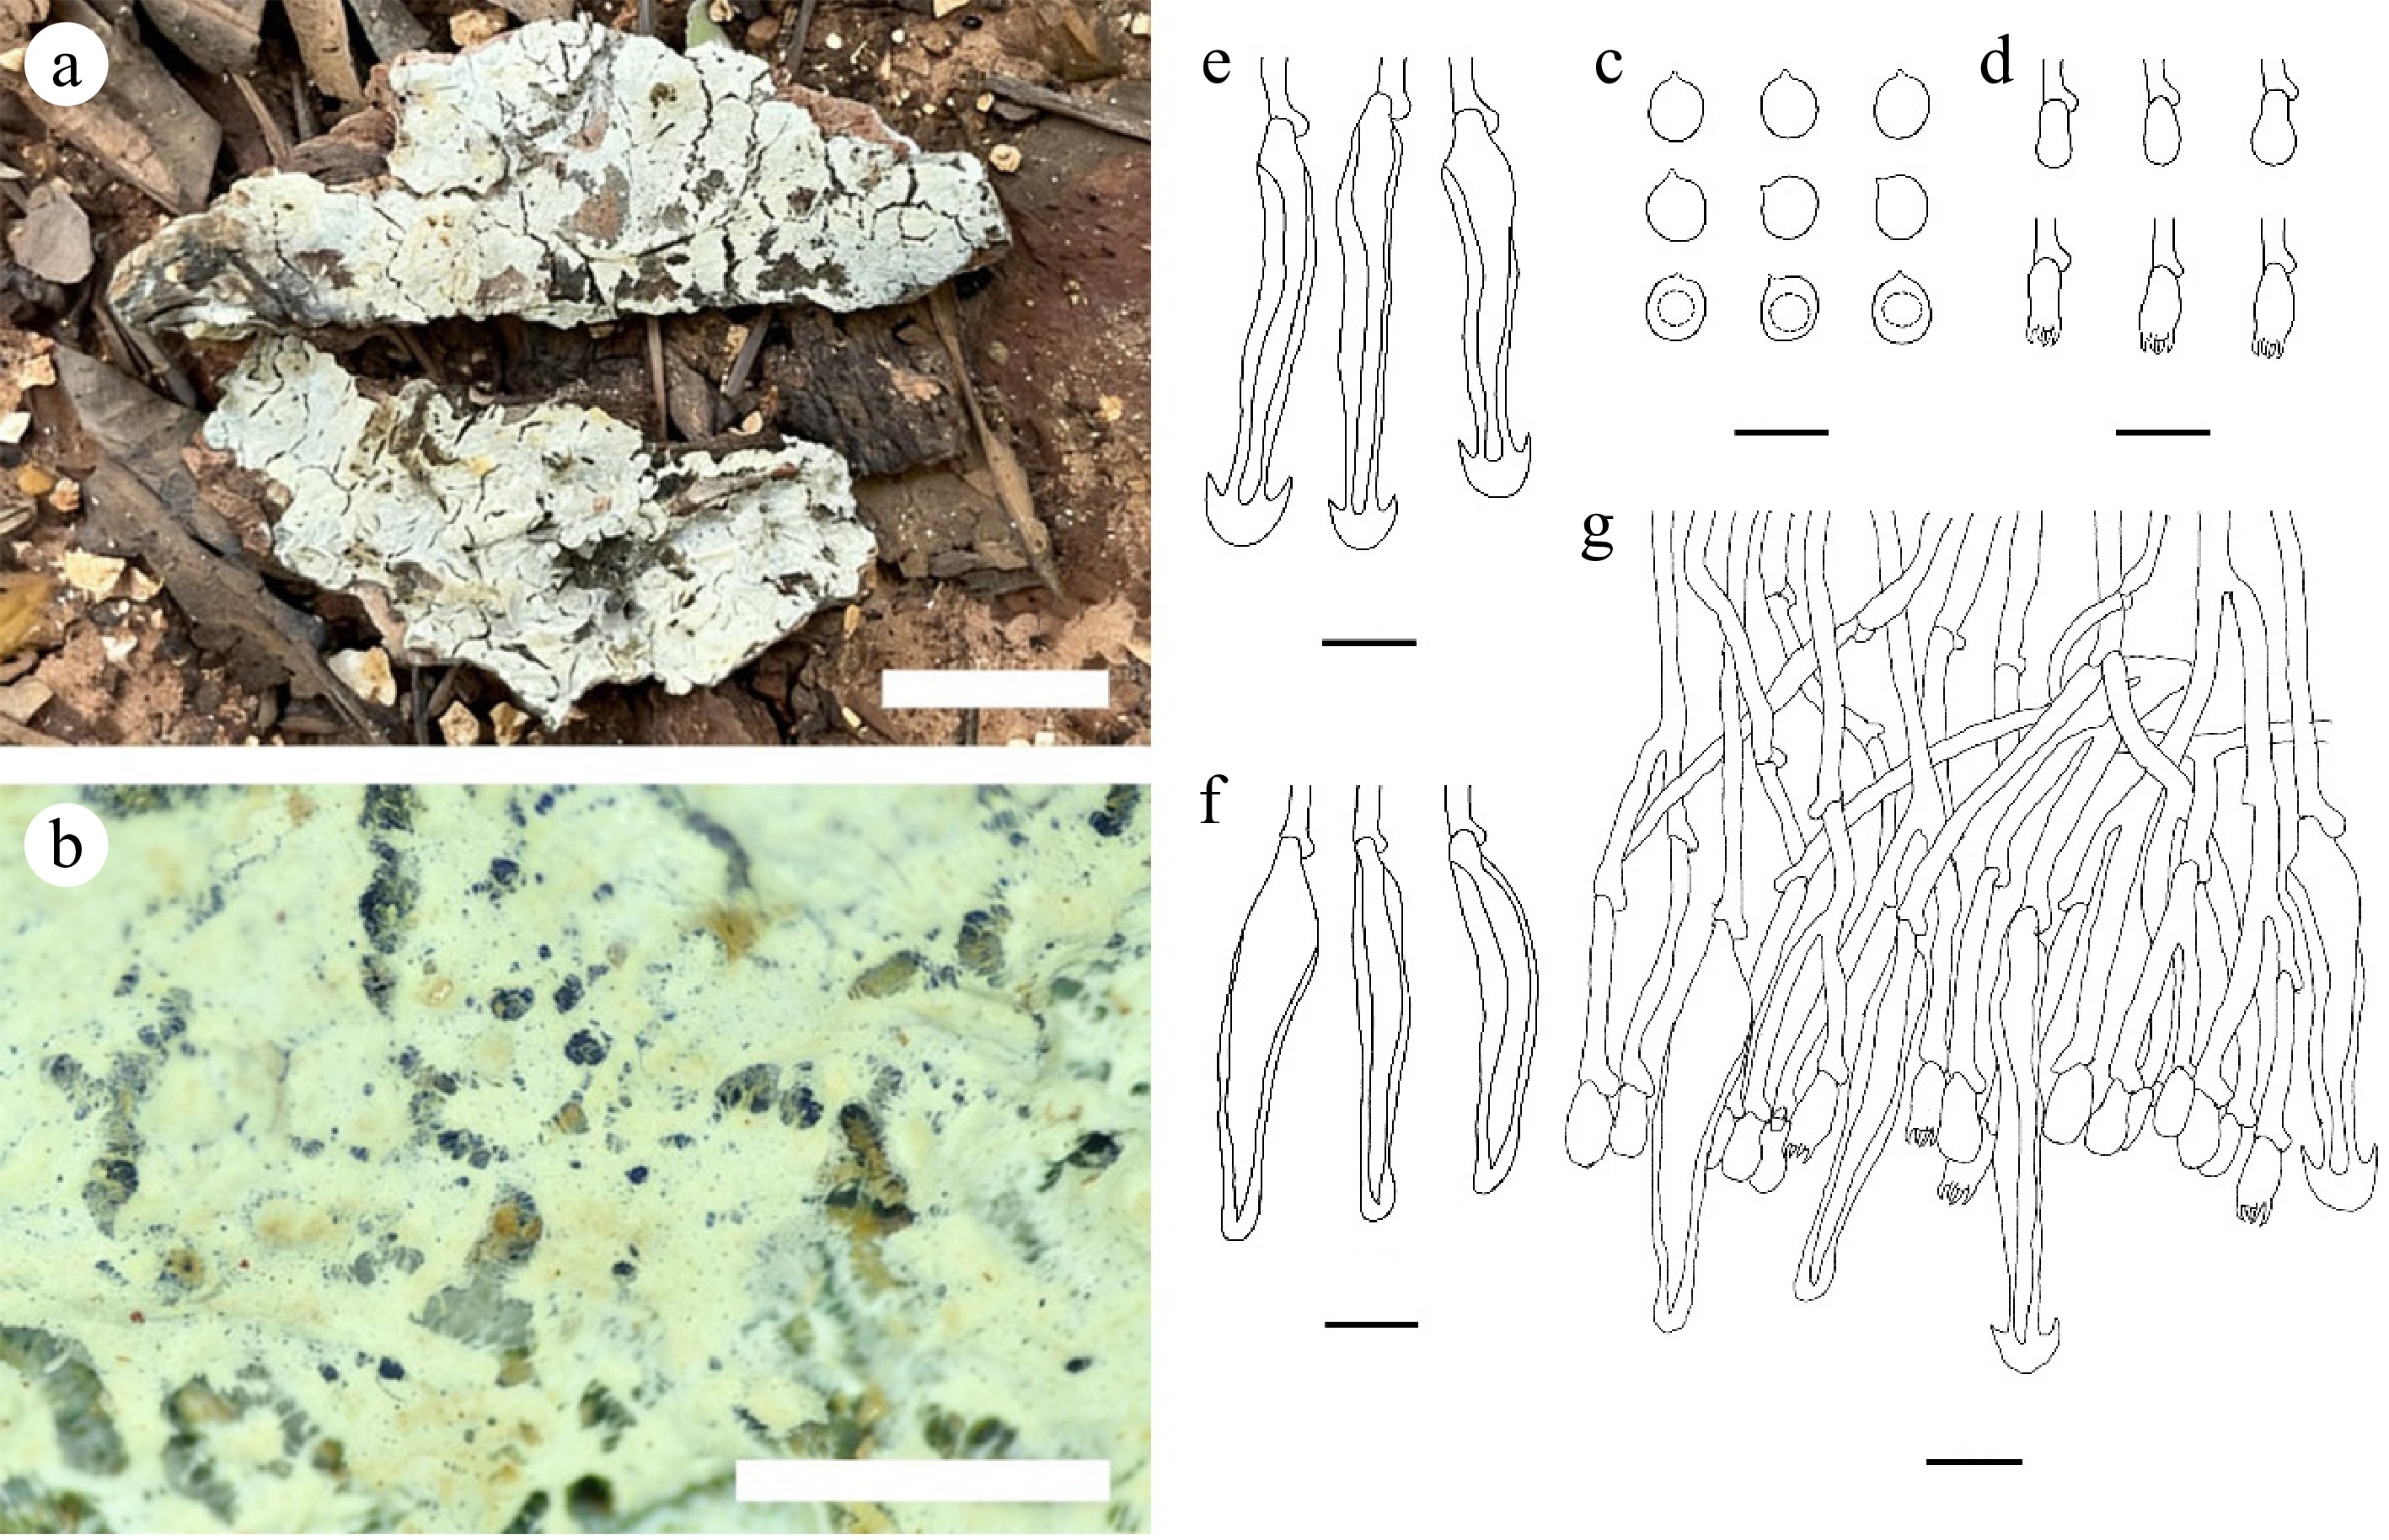
Figure 18.
Tubulicrinis hongheensis (holotype CLZhao 19006). (a), (b) Basidiocarp. Microscopic structures: (c) Basidiospores; (d) Basidia and basidioles; (e), (f) Cystidia; (g) Section through basidiocarp. Scale bars: (a) = 1 cm; (b) = 1 mm; (c) = 5 µm; (d)–(g) = 10 µm.
-
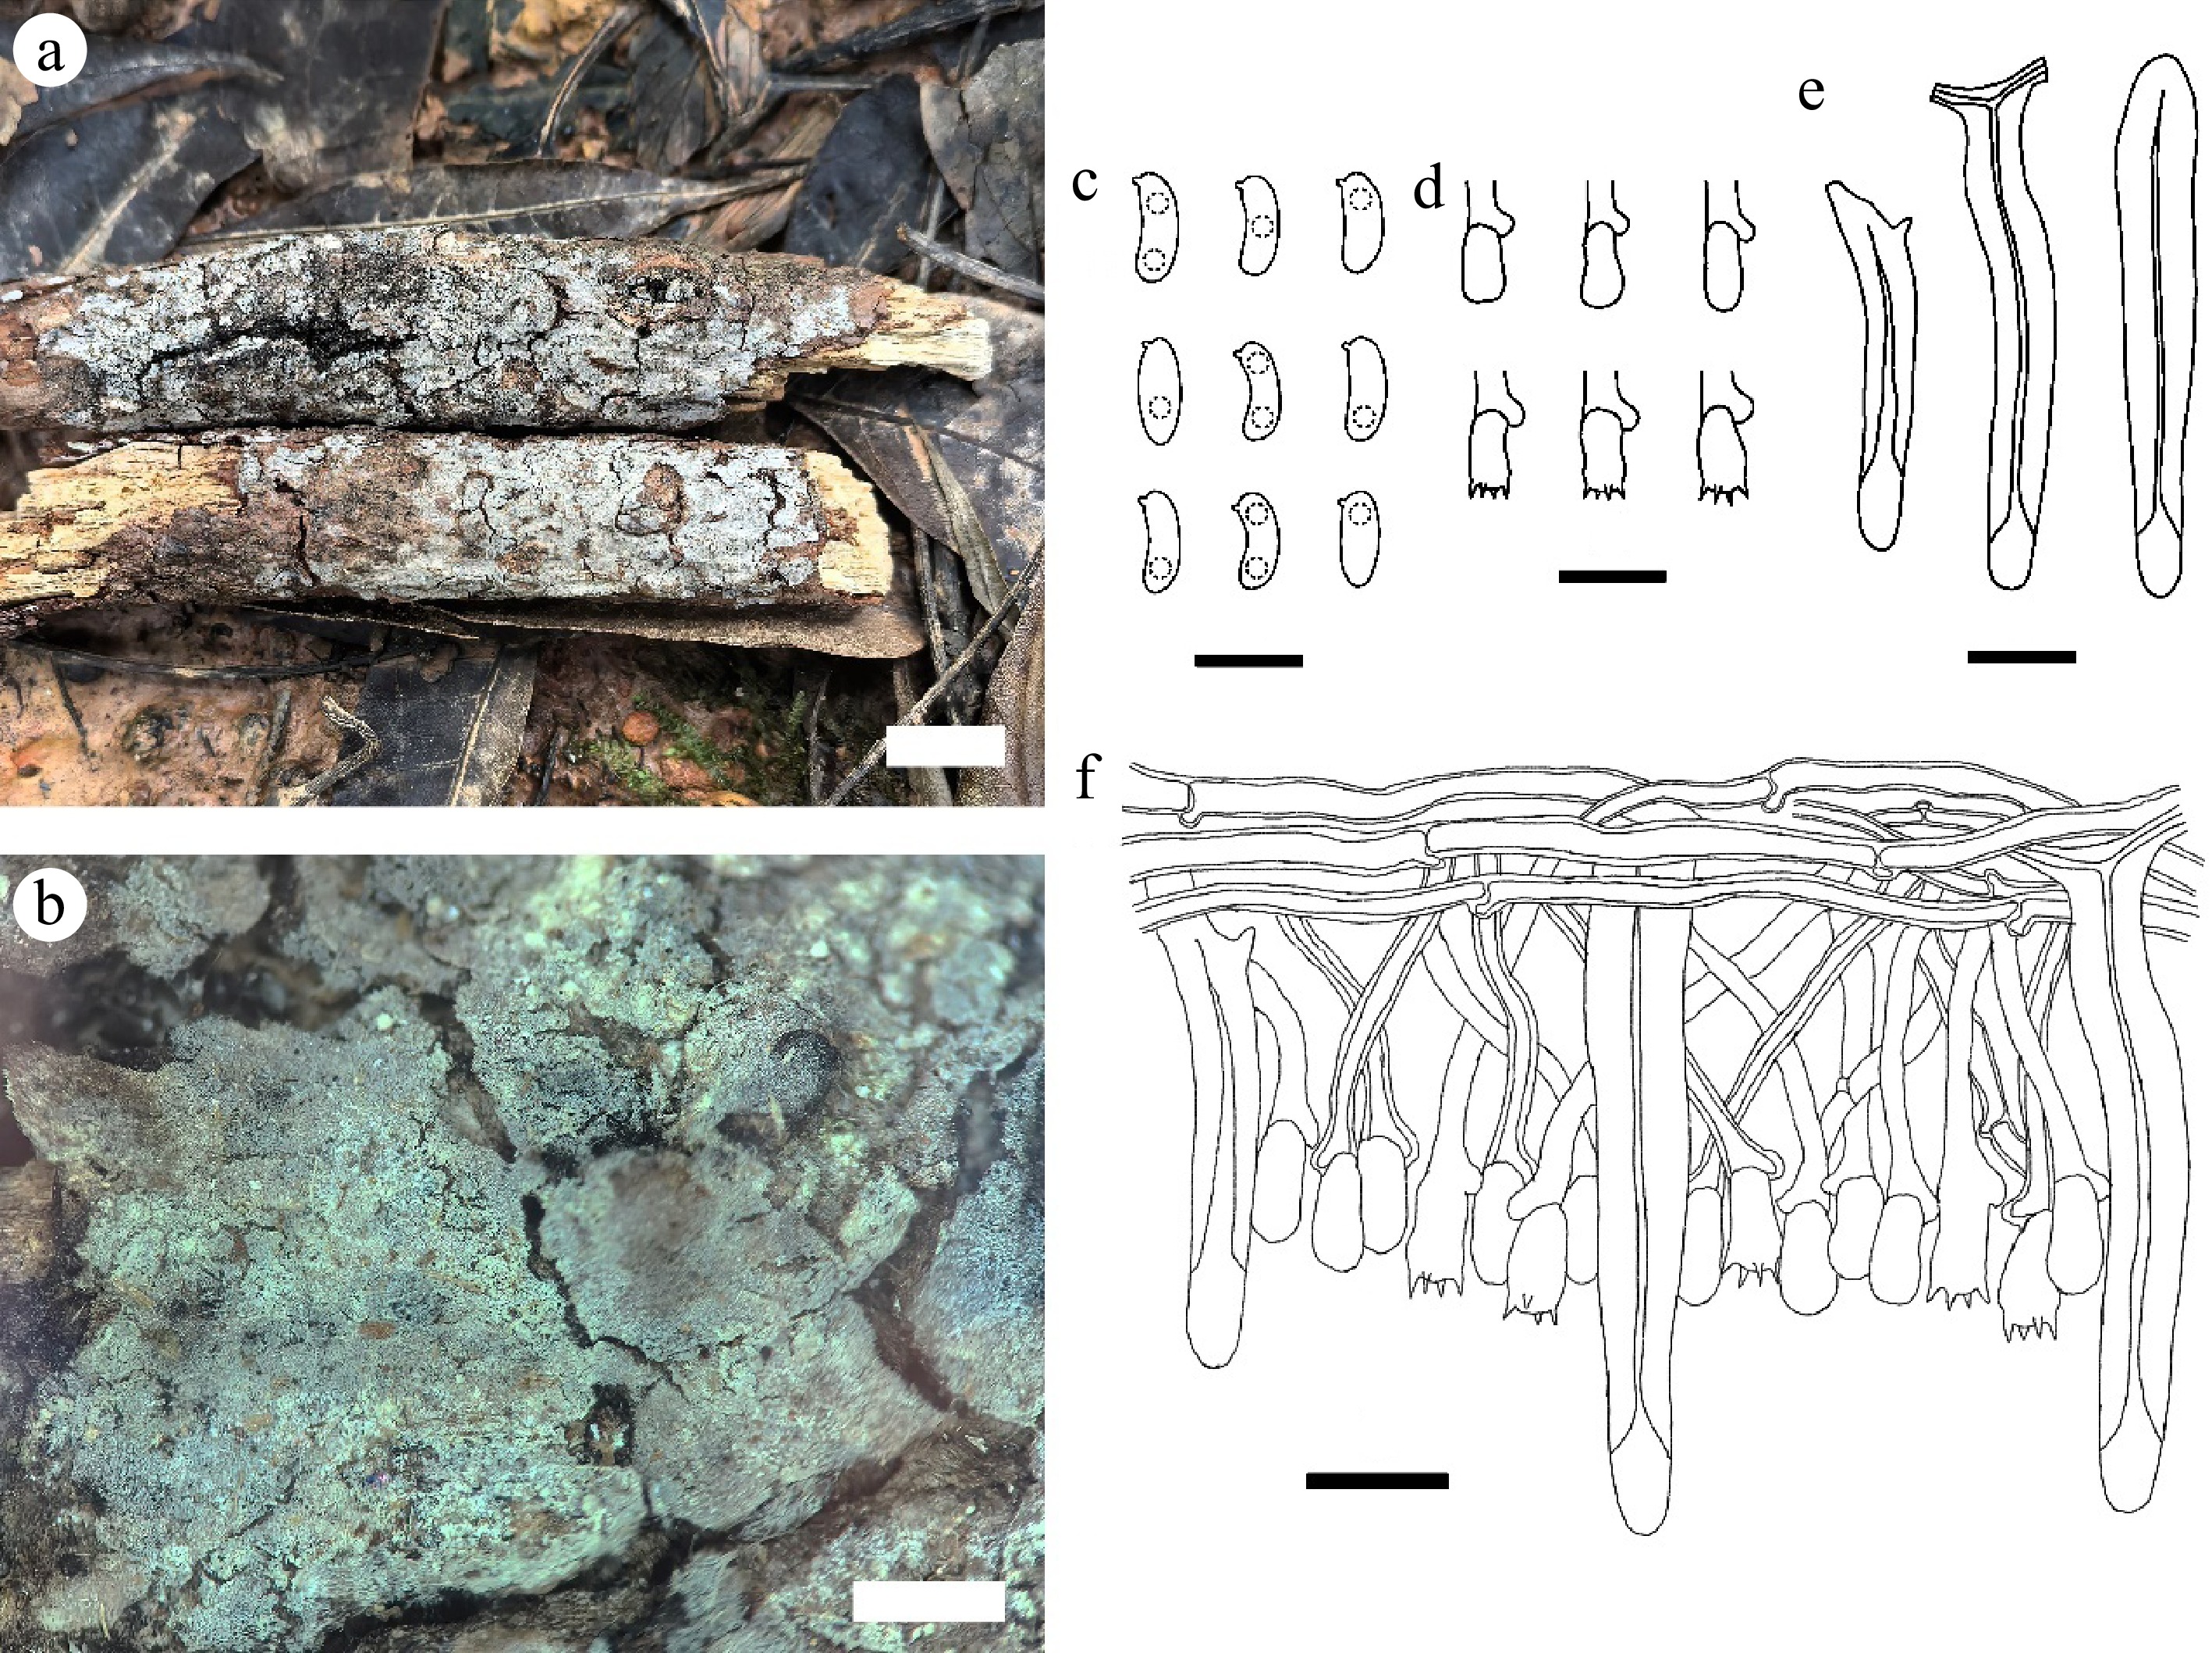
Figure 19.
Tubulicrinis tenuis (holotype CLZhao 17221). (a), (b) Basidiocarp. Microscopic structures: (c) Basidiospores; (d) Basidia and basidioles; (e) Lyocystidia; (f) Section through basidiocarp. Scale bars: (a) = 1 cm; (b) = 1 mm; (c) = 5 µm; (d)–(f) = 10 µm.
Figures
(19)
Tables
(0)