-
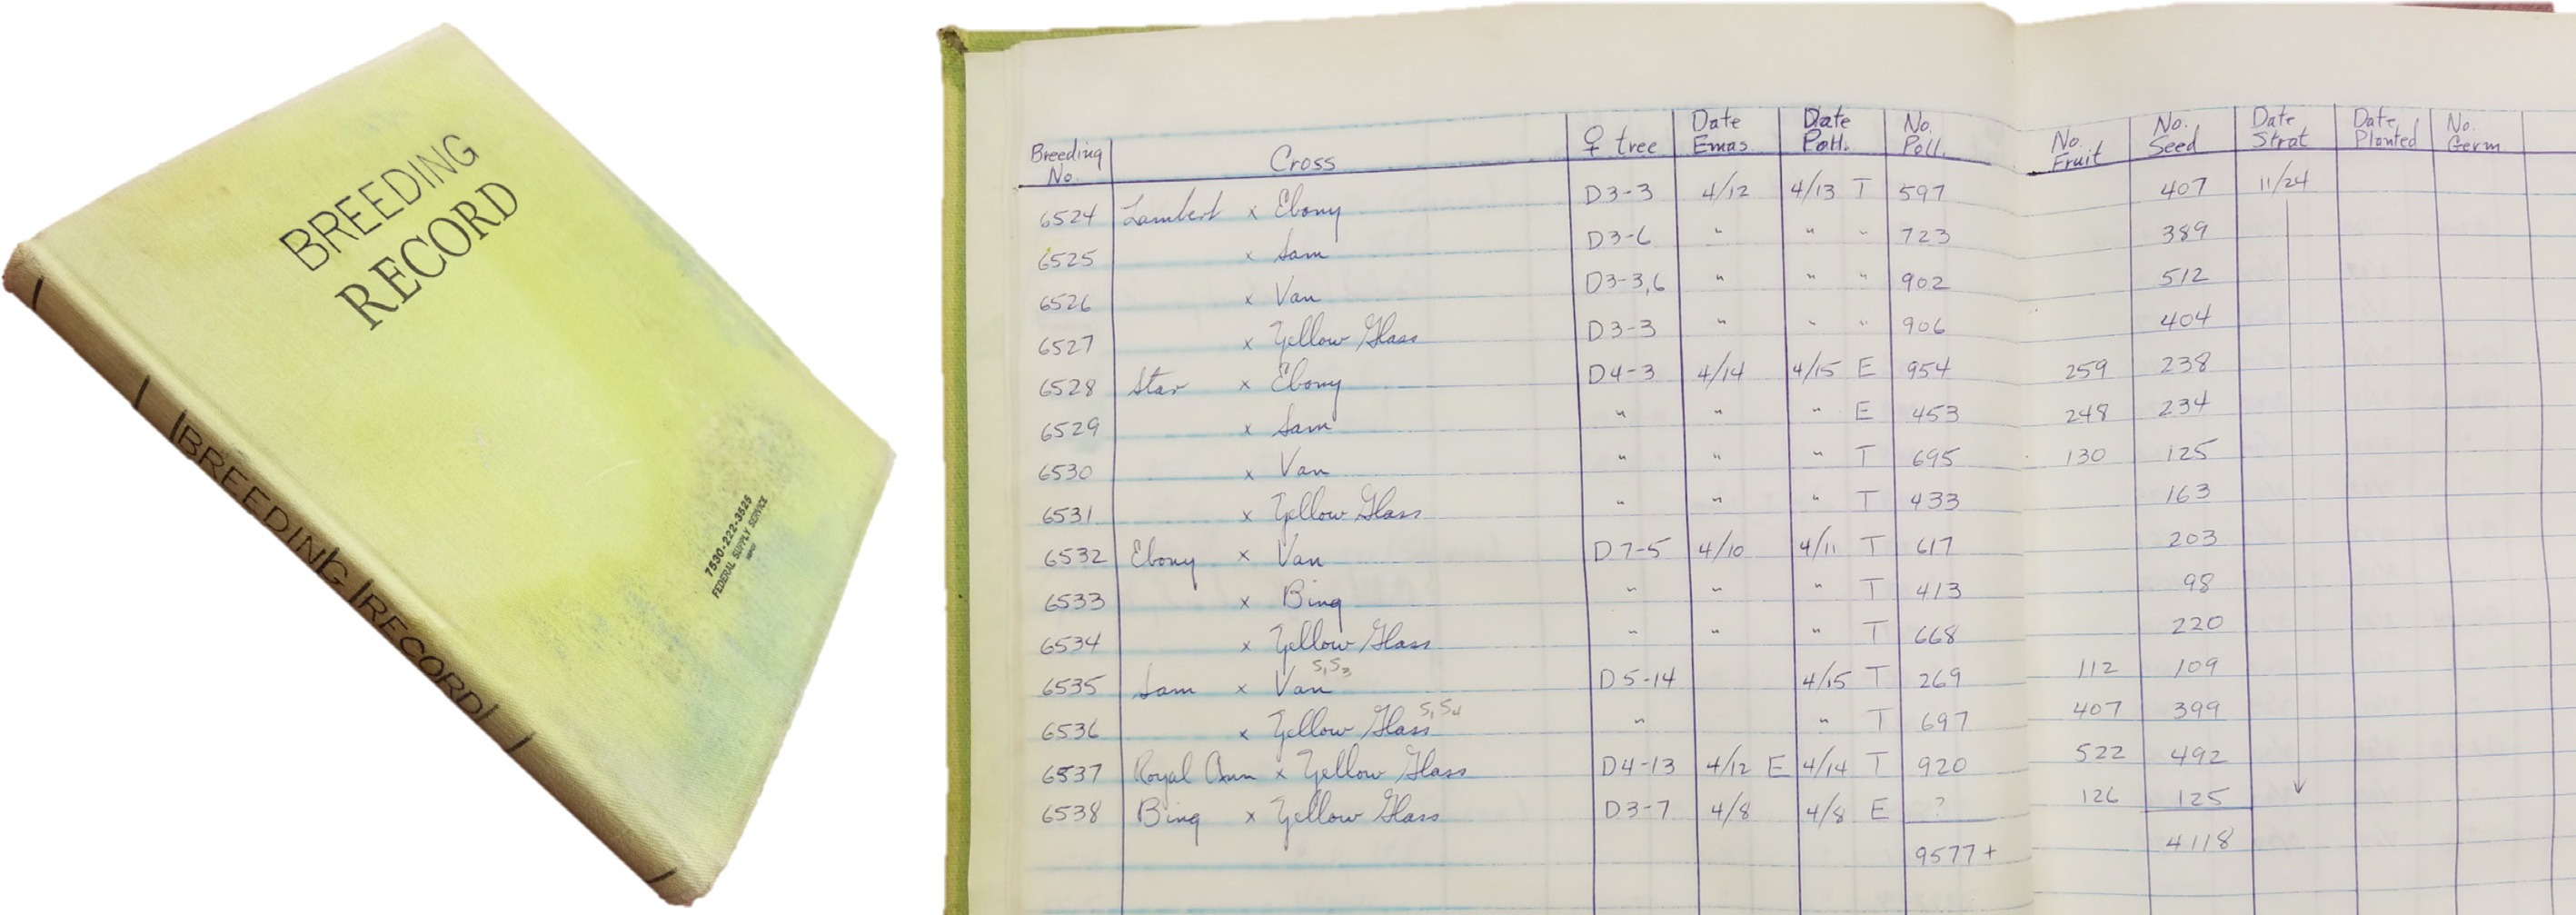
Figure 1.
Toyama's 'Breeding Records' book (left) and an example of details within (right) in which crossing activities and outcomes were recorded. Records included in columns were the four-digit family number, parents used, location of the female parent tree, dates of flower emasculation, pollination, seed stratification, and planting, numbers of pollinations, fruit, seeds, and germinated seeds, and miscellaneous comments. Data were sometimes missing for certain columns or families. For sweet cherry, records in this book began in 1964 (records shown here for 1965) and ended in 1989; although the final year of crossing by Dr. Toyama before retirement was 1984, and the final year in which the numbers of successfully germinated seeds was recorded was 1981.
-
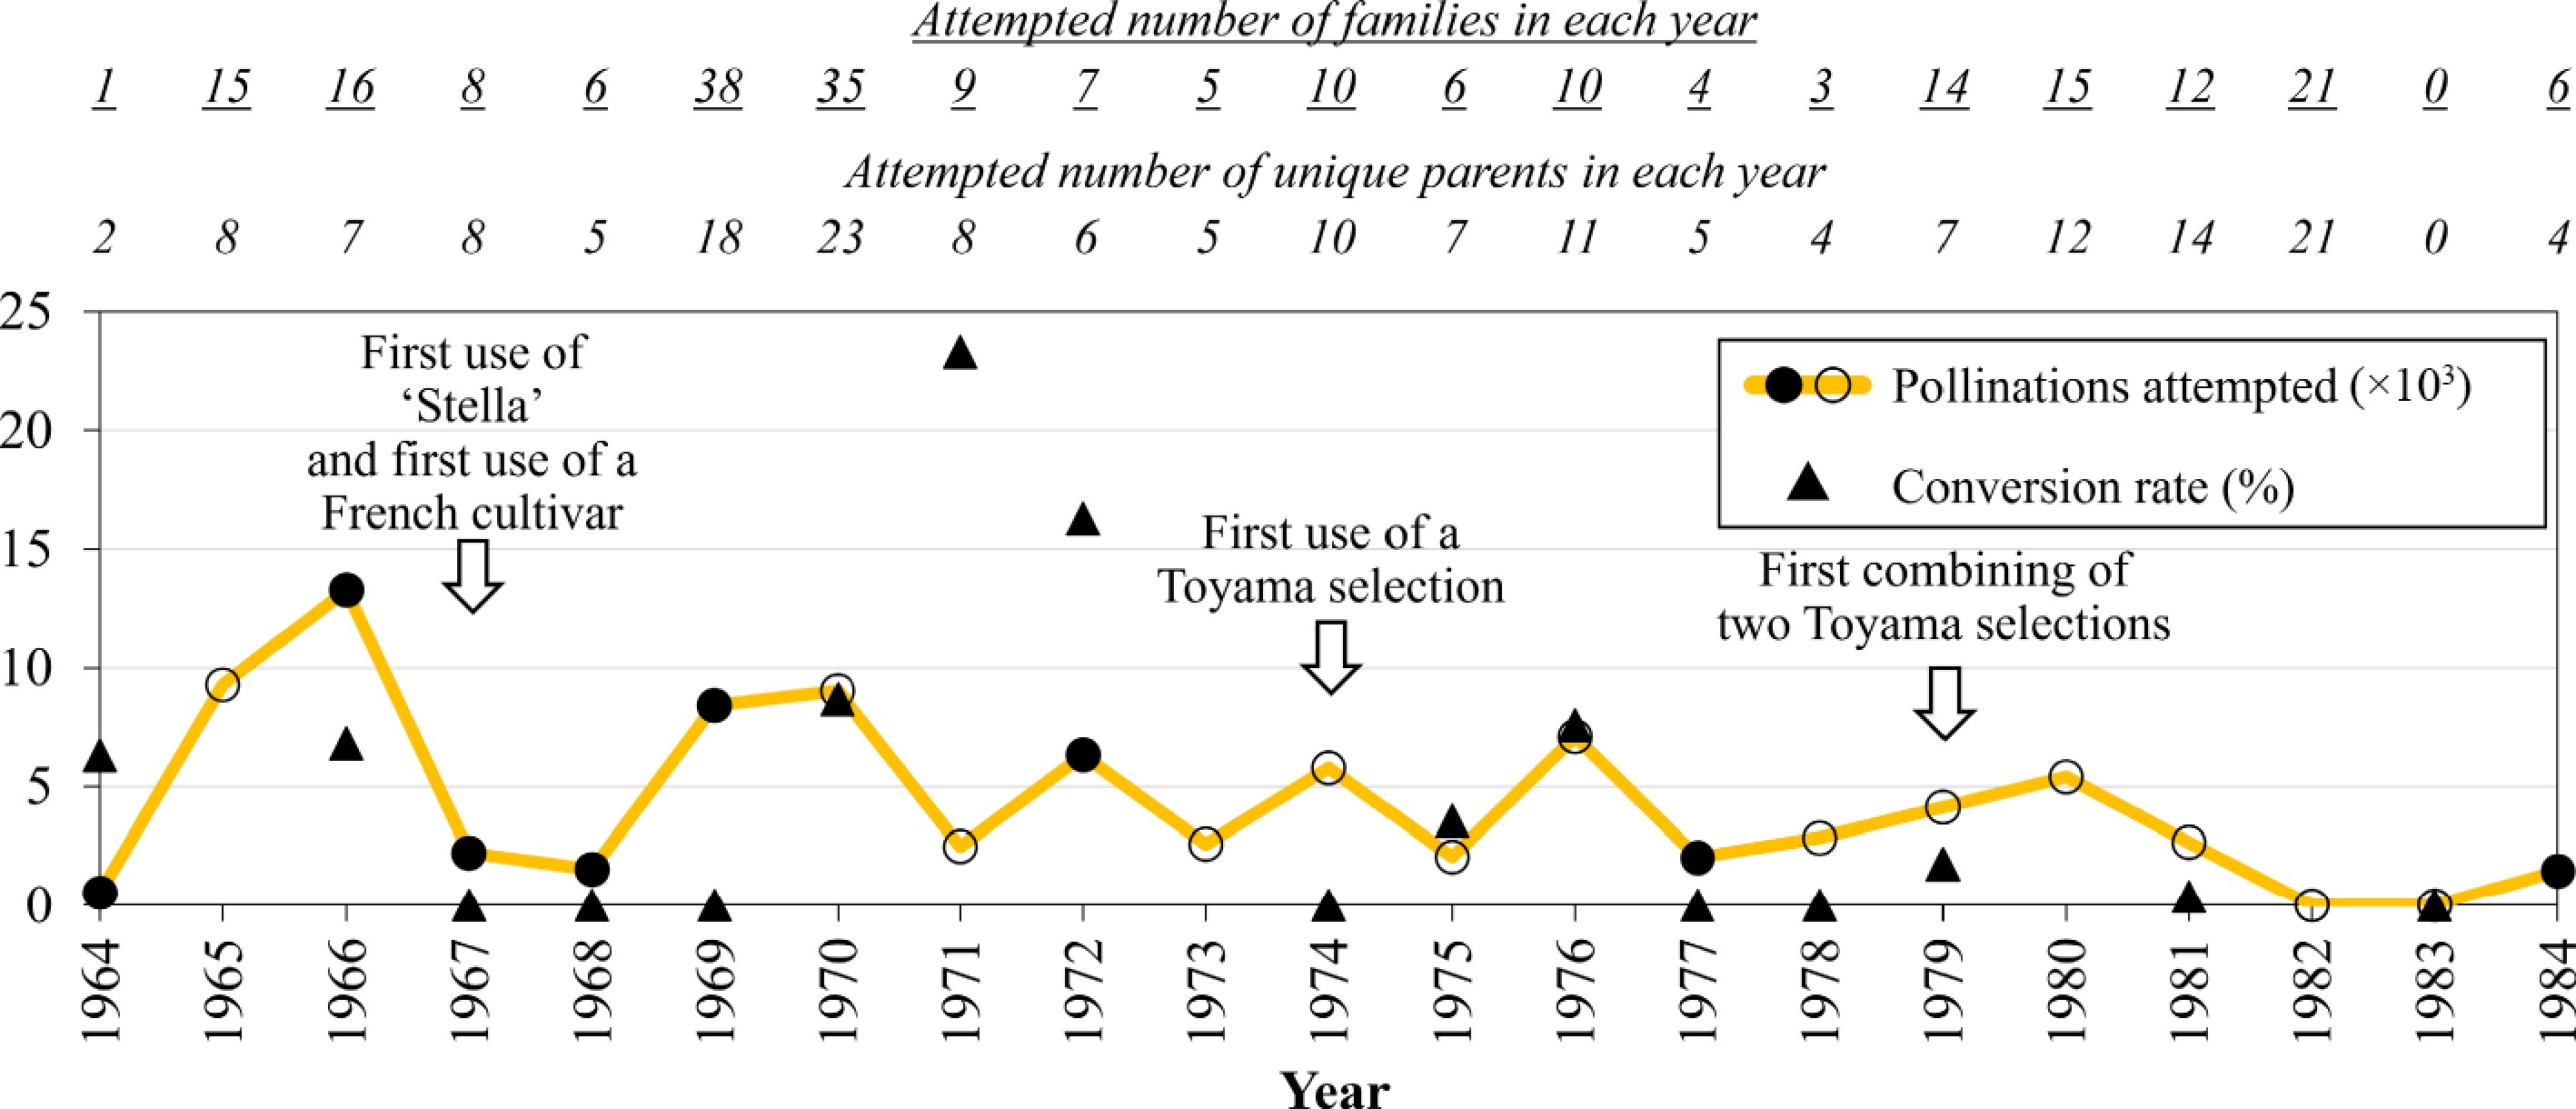
Figure 2.
Summary of crossing input and outcomes by Dr. Thomas Toyama over two decades (1964–1984). Numbers of pollinations attempted shown in open circles are minimums, given that pollination data for some families were not recorded in those years. No germinated seedlings were recorded in 1967–1969, 1974, 1977–1978, and 1983, while no data on germinated seedling numbers were available in 1965, 1973, 1980, 1982, and 1984.
-
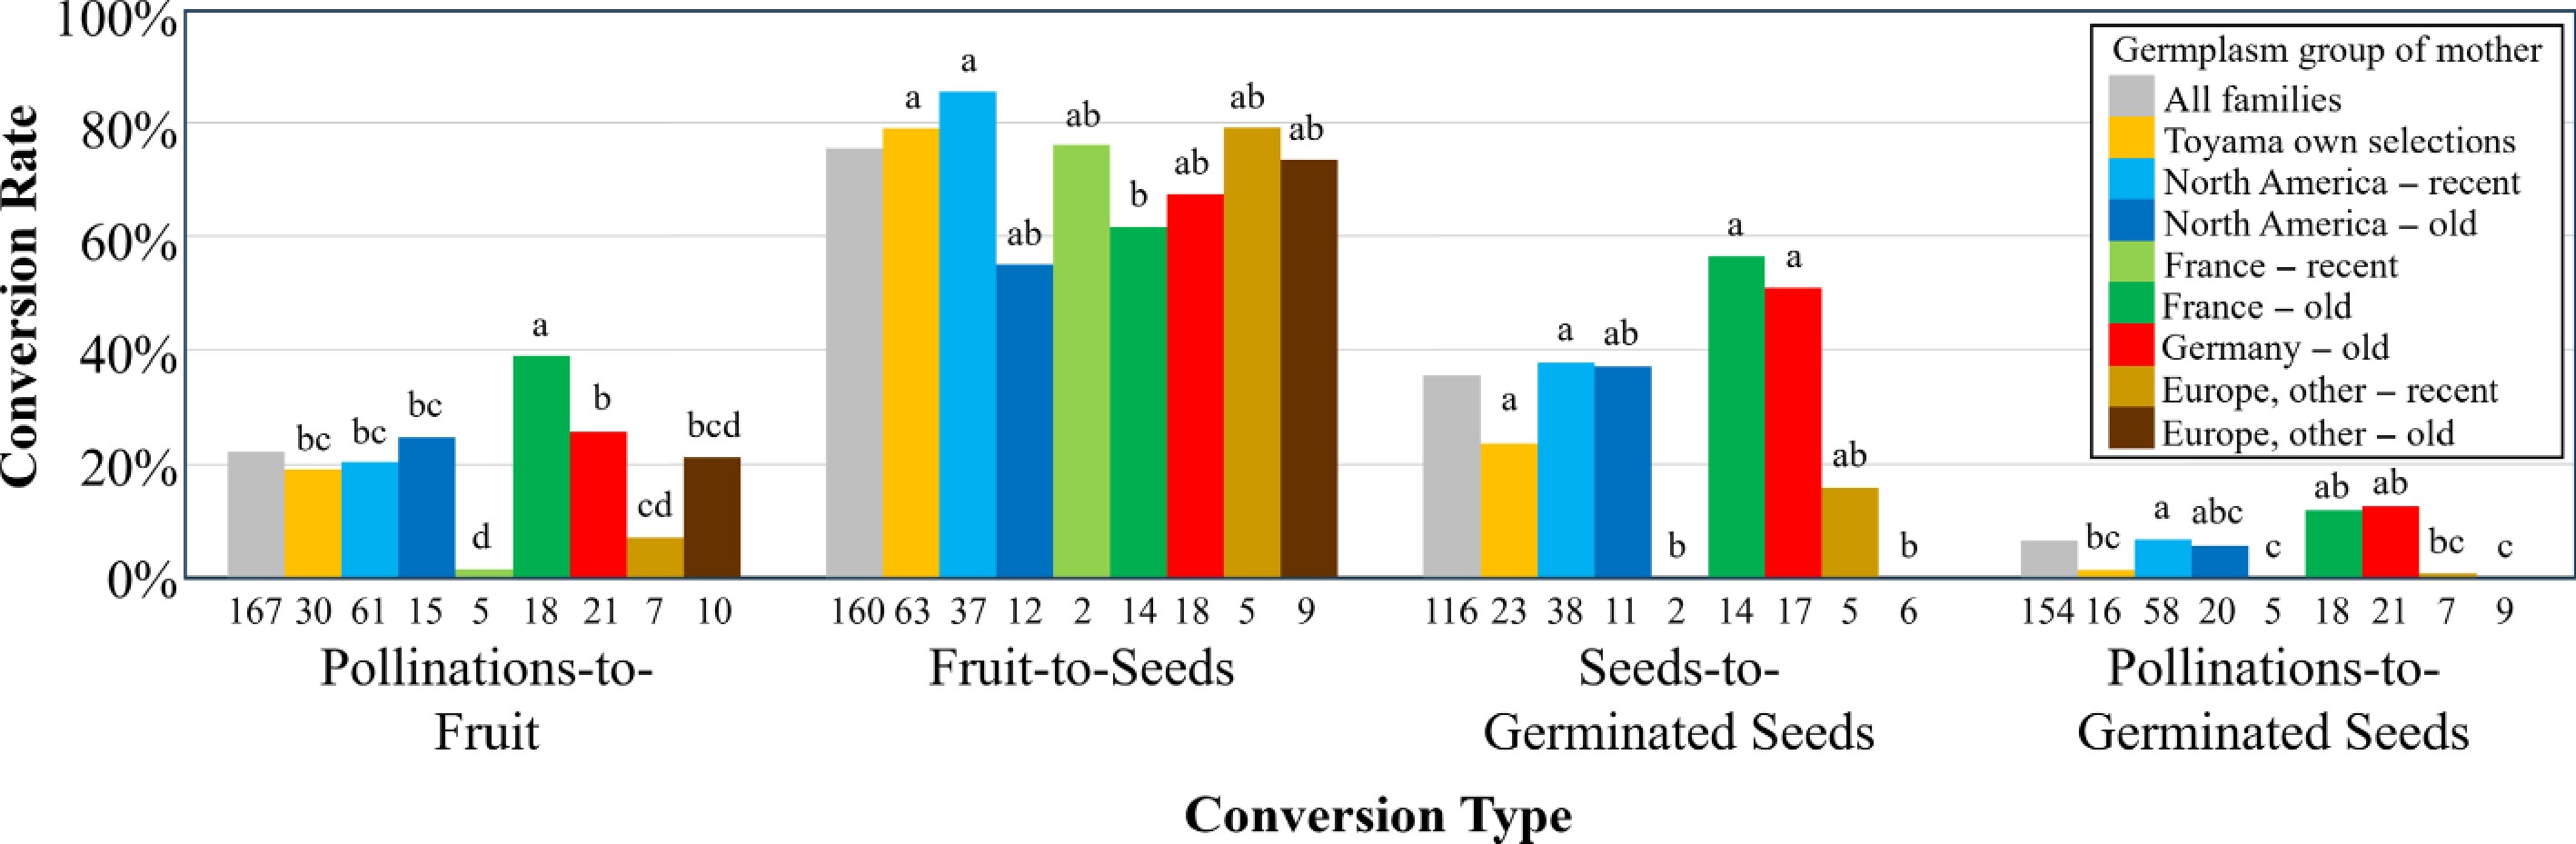
Figure 3.
Conversion rates achieved in all recorded families between pollinations attempted and obtained fruit, seeds, and germinated seeds, considering the germplasm group of the mother tree of each family. The number of families with recorded data for conversion calculations is indicated below each column. Within each conversion type, germplasm groups with different letters are significantly different (p < 0.05).
-
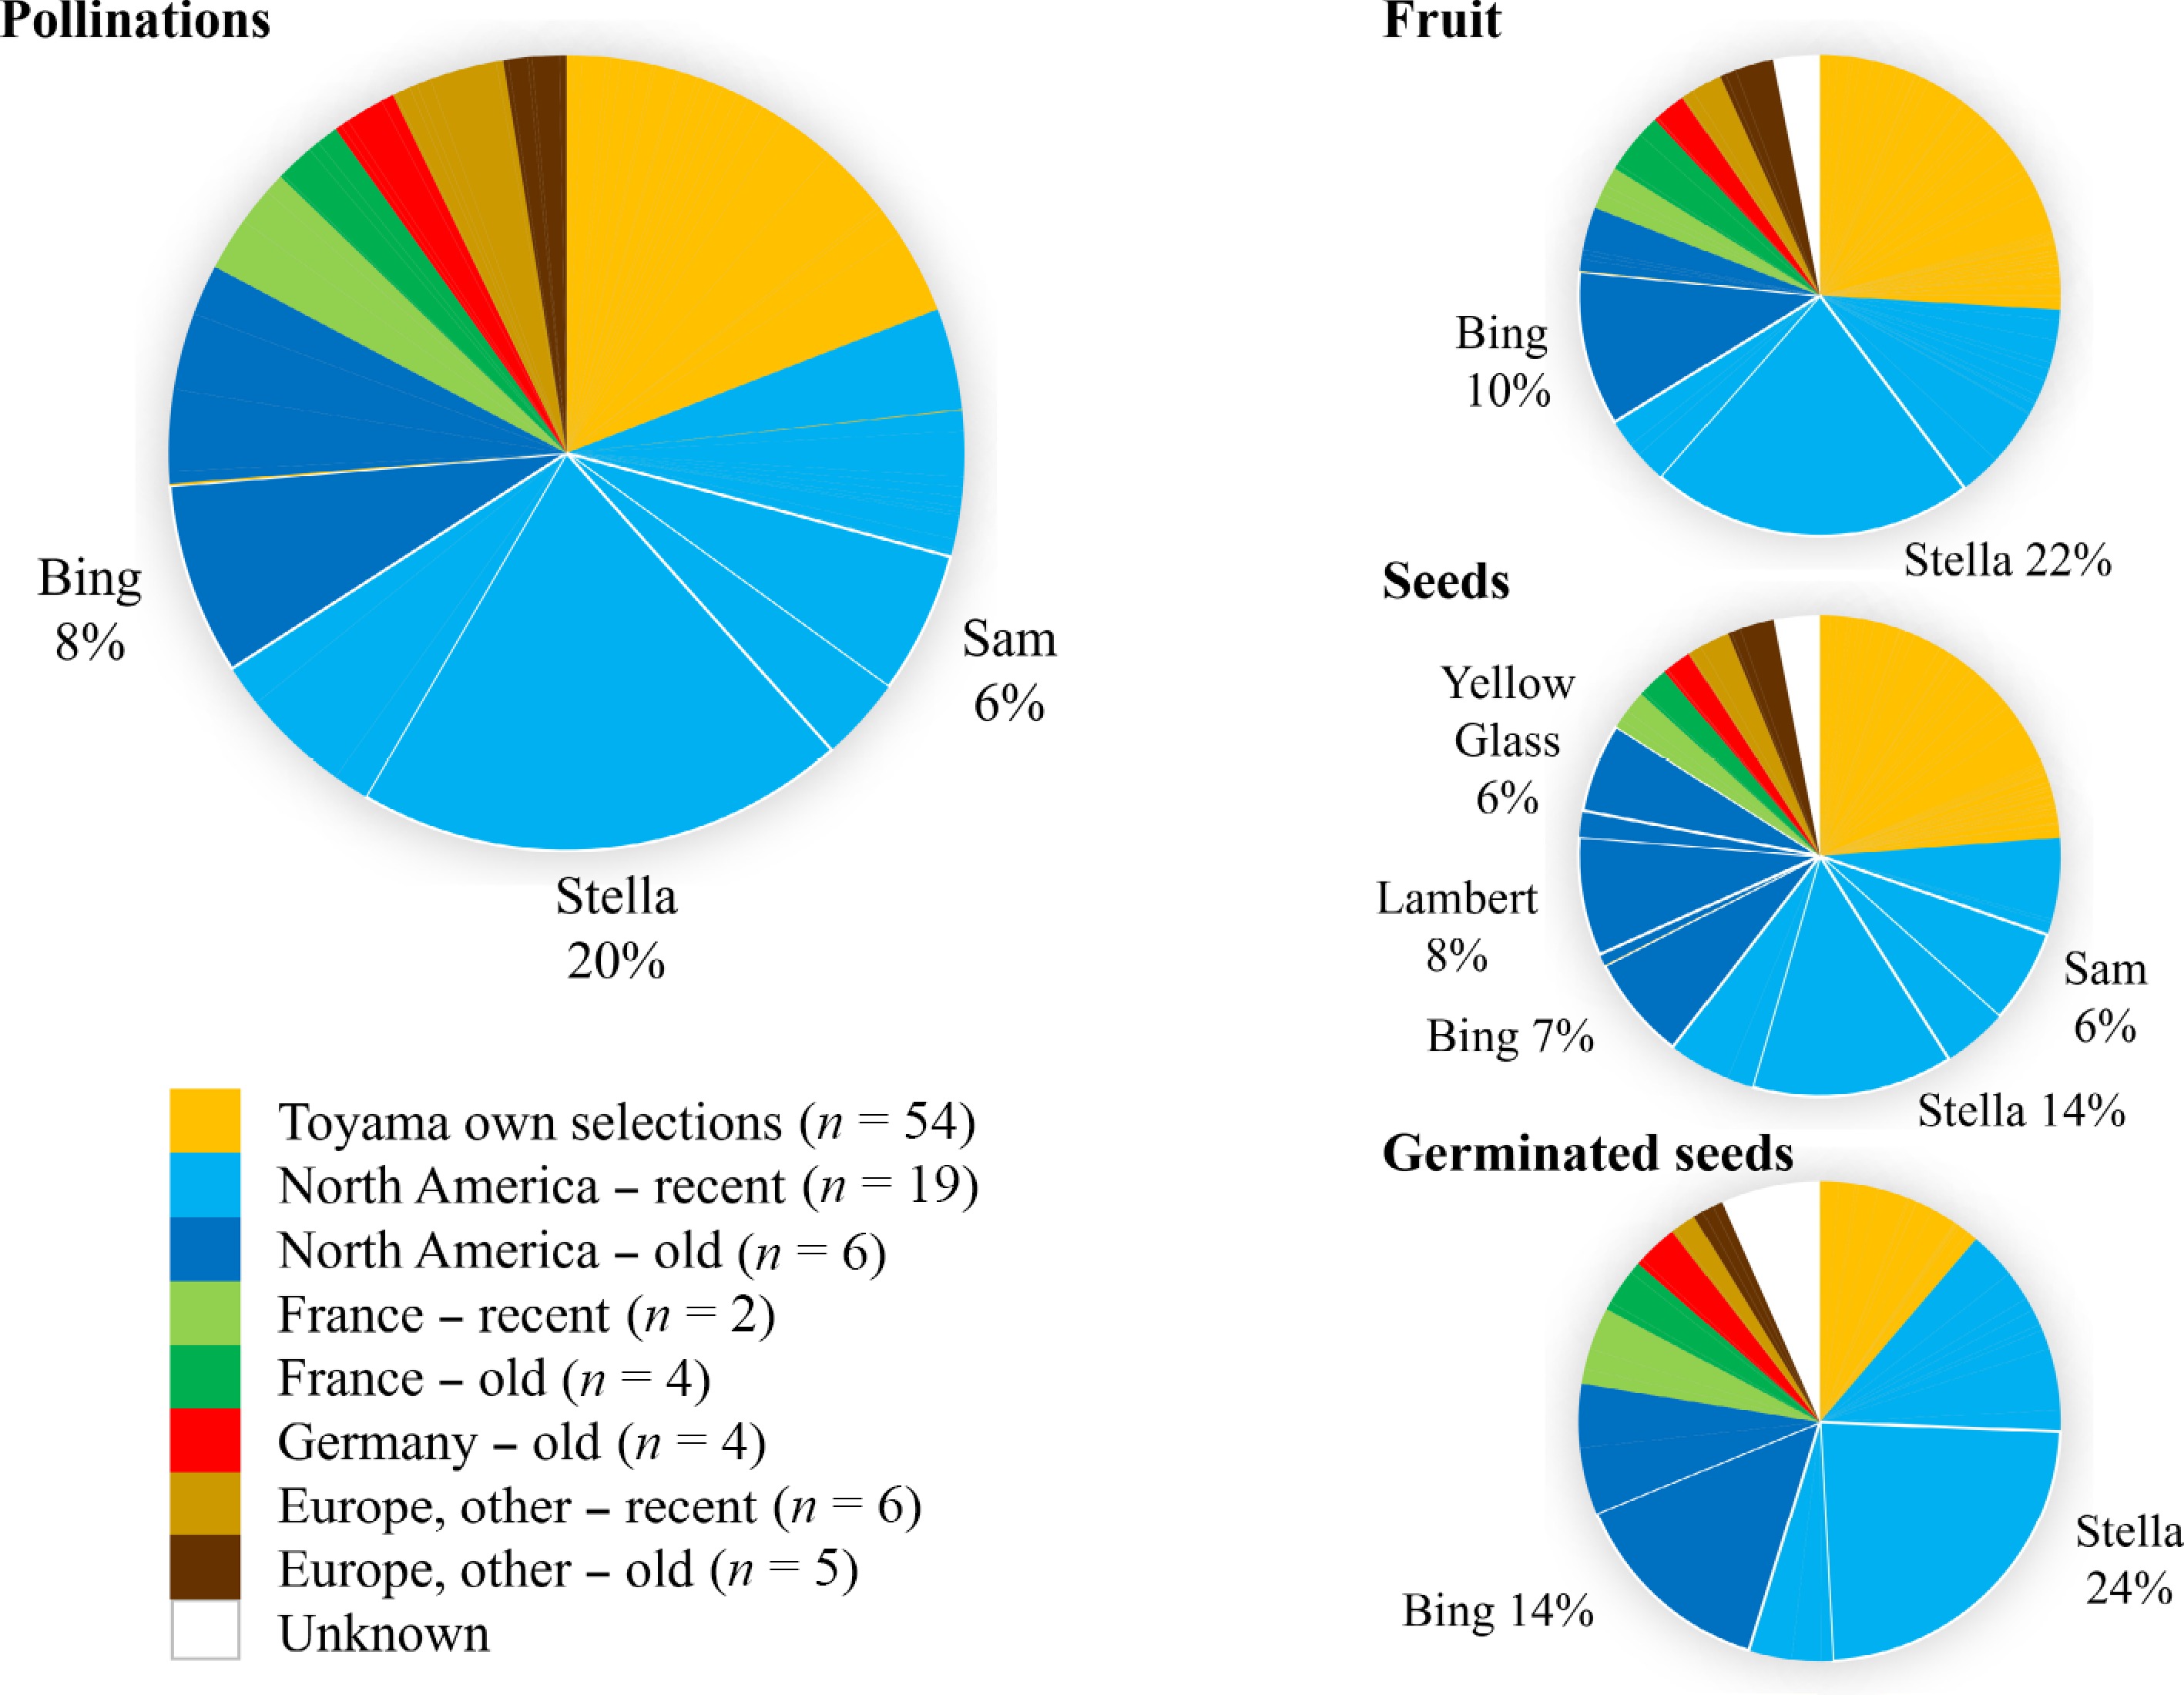
Figure 4.
Frequency of use of parents by Dr. Thomas Toyama for crosses from 1964 to 1984. Use of parents is quantified by the proportion of parental slots (gametes) involved in recorded pollinations, fruit, seeds, and germinated seeds. Parents are grouped according to geographic/temporal origins or 'Unknown' for fathers of open-pollinated families. Parents representing at least 5% of the total are noted and delimited with thicker lines.
-
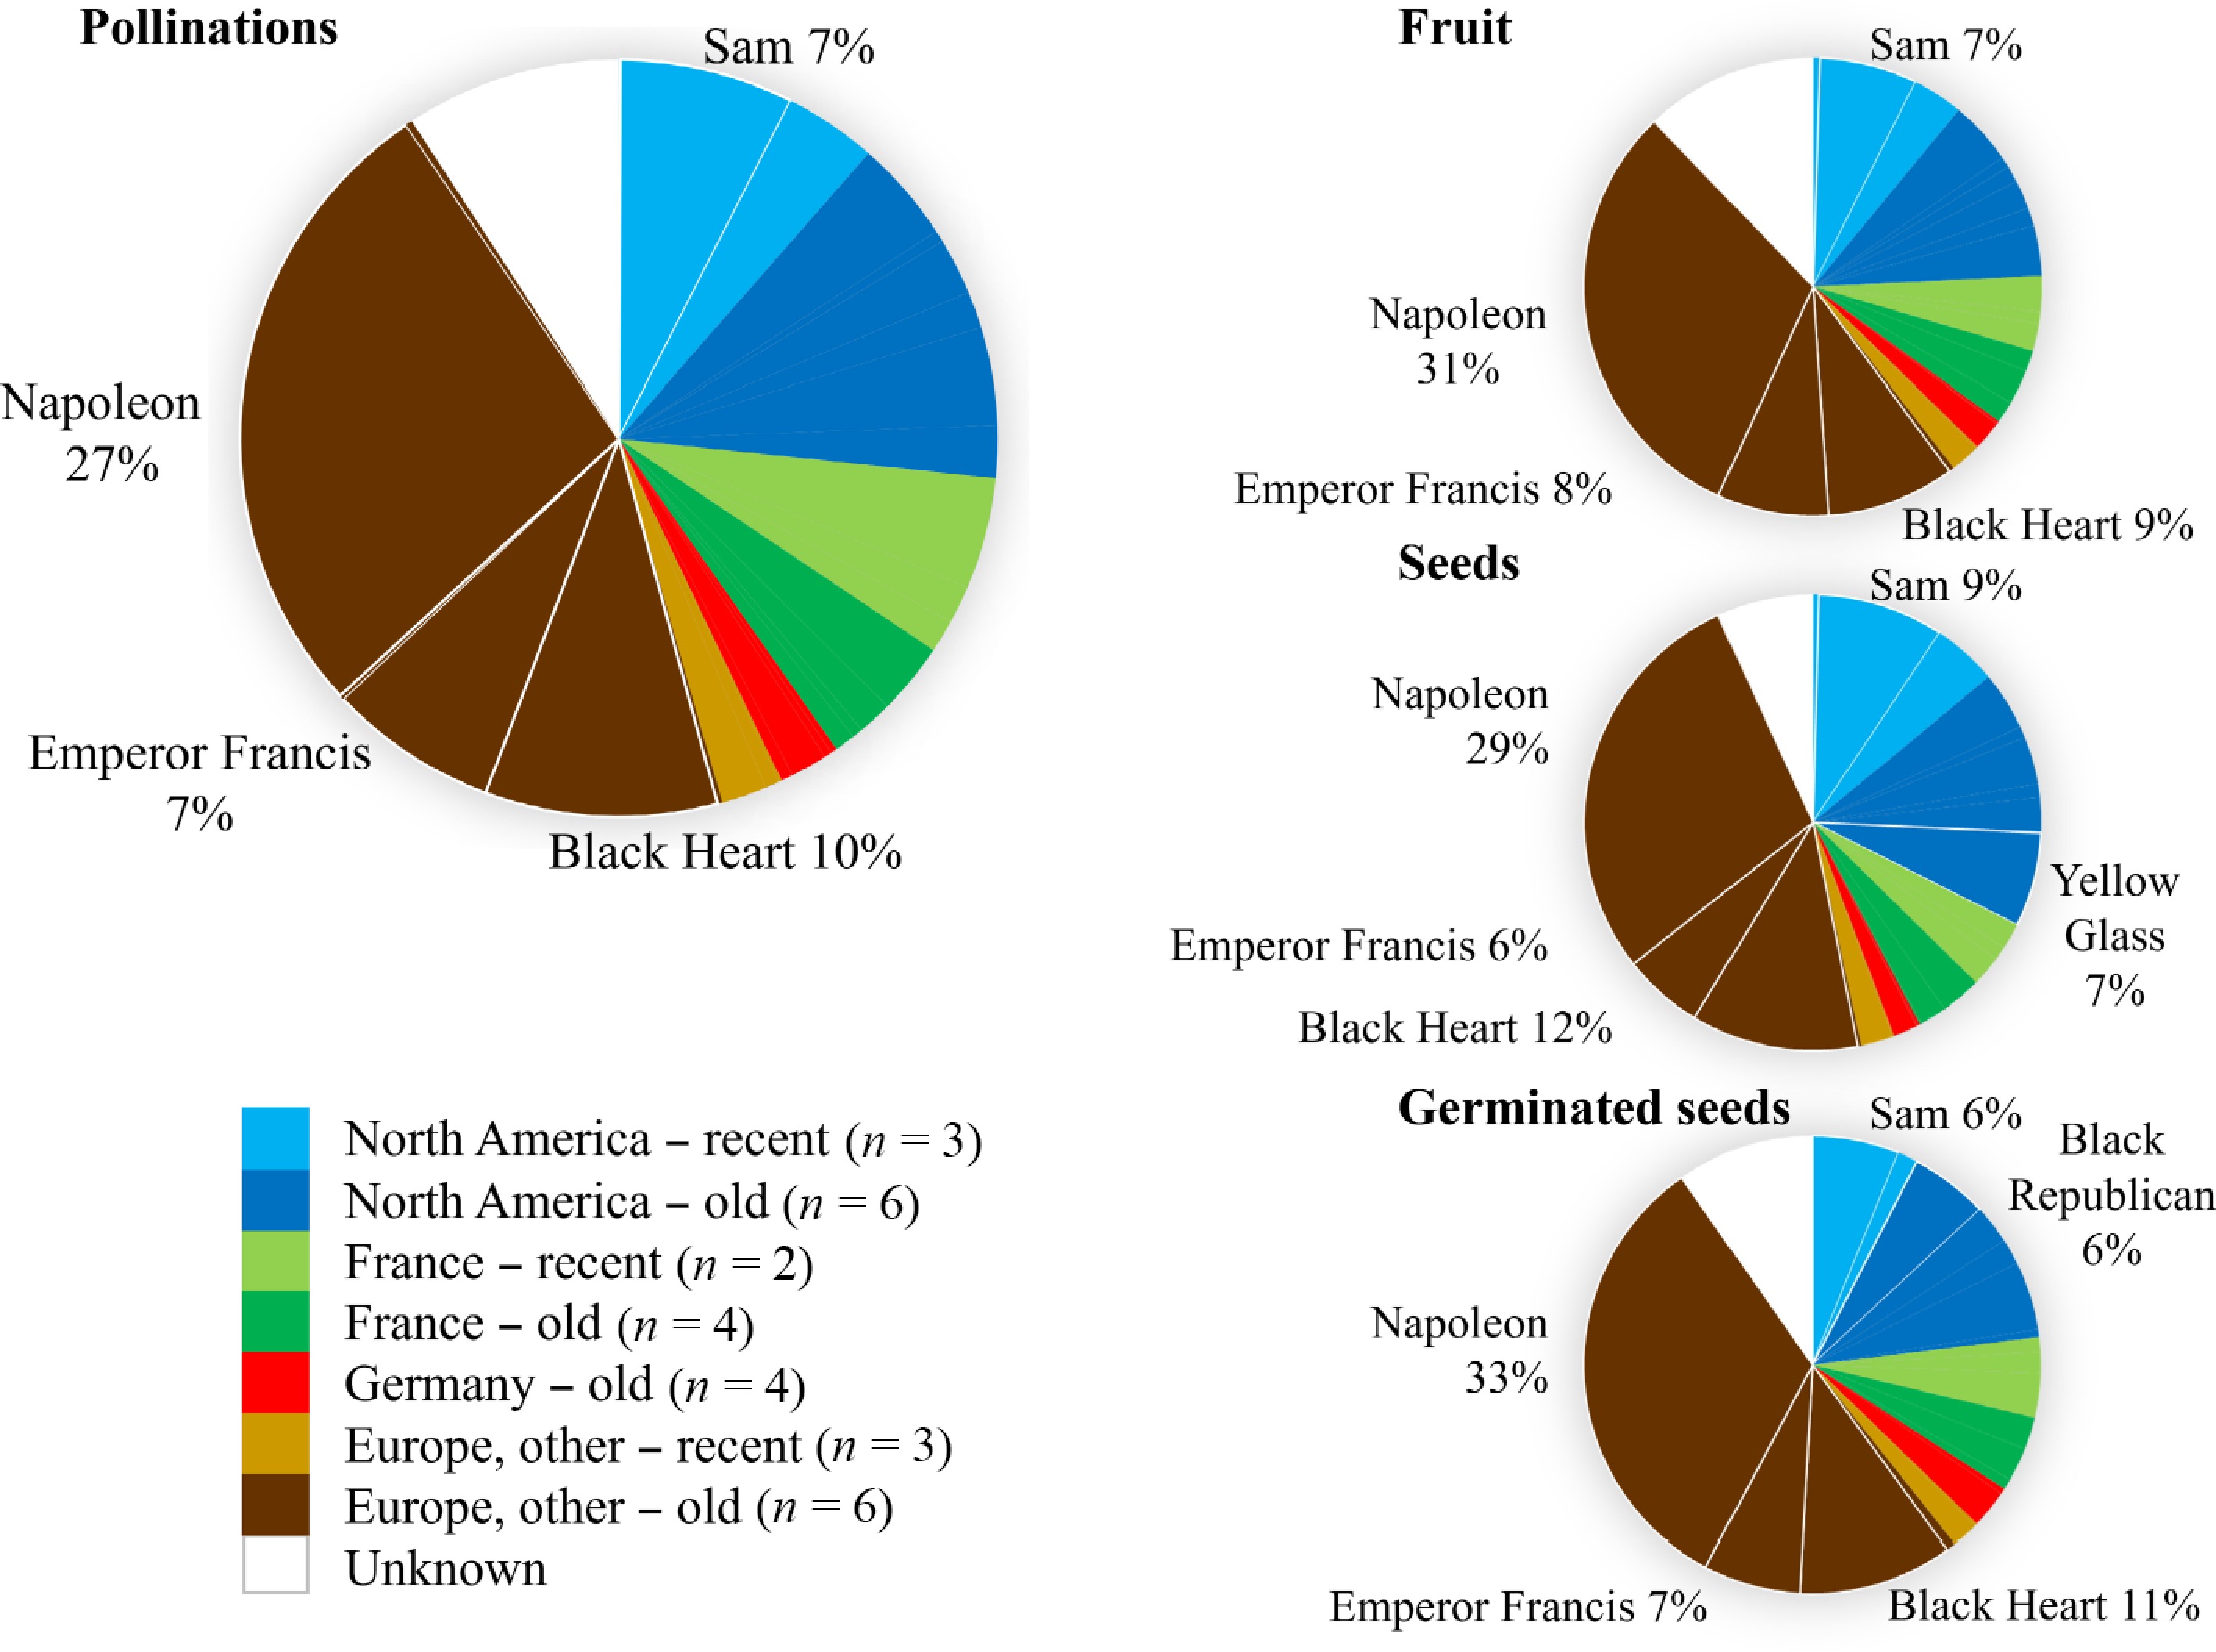
Figure 5.
Frequency of representation of ancestors in crosses made by Dr. Thomas Toyama from 1964 to 1984. Representation of 29 known ancestors is quantified by their estimated genomic contributions to parents used across all parental slots (gametes) involved in recorded pollinations, fruit, seeds, and germinated seeds. Ancestors are grouped according to geographic/temporal origins or 'Unknown' for fathers of open-pollinated families. Ancestors representing at least 5% of the total are noted and delimited with thicker lines.
-
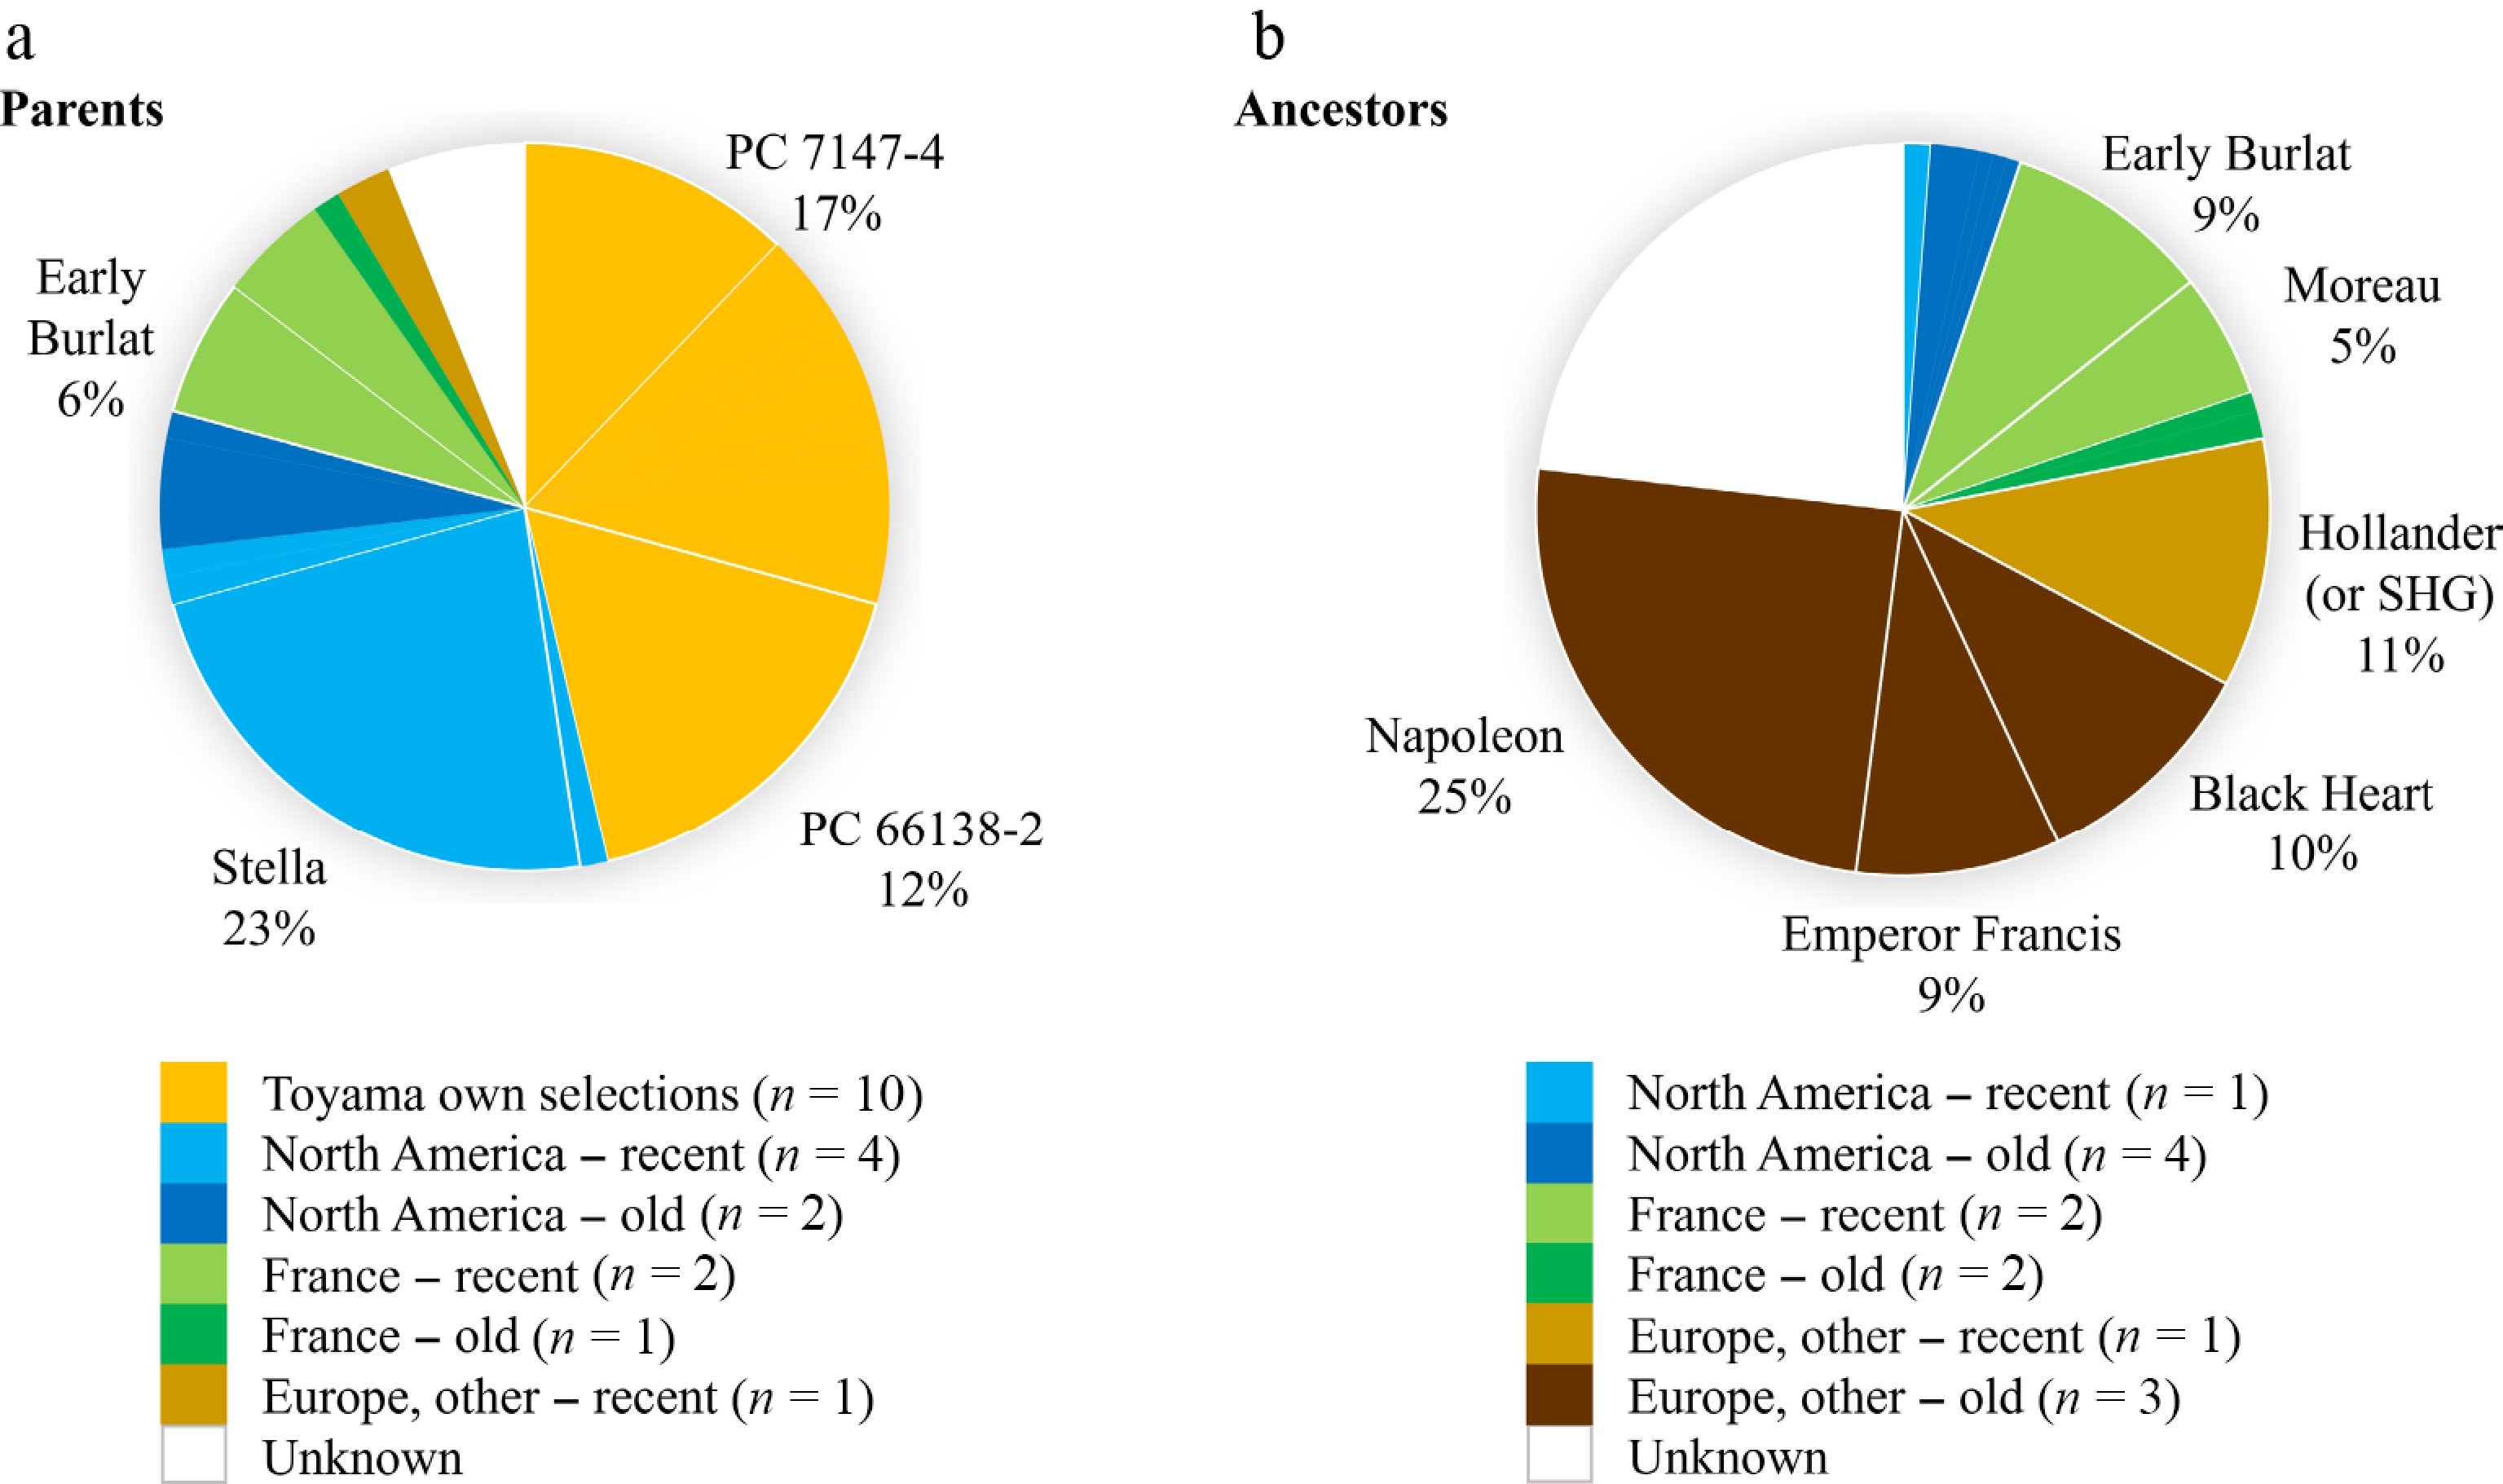
Figure 6.
(a) Frequency of representation of parents among extant Toyama selected germplasm (11 cultivars and 30 selections), grouped according to geographical/temporal origins. (b) Frequency of representation of ancestors of extant Toyama selected germplasm, grouped according to geographical/temporal origins. Within each origin, only those cultivars representing at least 5% of the total are noted and delimited with thicker lines. SHG = 'Starking Hardy Giant'.
-
Parental origin Pollinations Fruit Seeds Germinated seeds Number Families* Number Families Number Families Number Families Toyama own selections 33,439 68 (147) 9,303 147 6,980 139 1,165 68 North America − recent 82,679 138 (151) 14,946 125 11,136 123 4,512 122 North America − old 29,715 56 (61) 5,405 42 7,083 54 2,362 46 France − recent 7,881 15 (16) 1,069 16 817 13 540 16 France − old 5,146 28 (28) 1,534 28 640 25 380 27 Germany − old 4,702 26 (26) 851 26 595 26 321 26 Europe, other − recent 8,160 23 (24) 1,039 24 870 21 180 24 Europe, other − old 4,494 22 (22) 1,346 22 946 21 214 21 Unknown − O.P. − − (6) 1,145 6 921 6 690 6 Total (gametes) 176,216 376 (480) 36,638 436 29,988 428 10,364 356 Total (physical units) 88,108 188 (240) 18,319 218 14,994 214 5,182 178 The physical units of pollinations were flowers. O.P. = open-pollinated. * Numbers of families in parentheses represent the actual number of families listed in the 'Breeding Records' book; figures outside parentheses represent only those families with recorded numbers of pollinations, as for other parts of this table. For example, the '147' listed families involving Toyama own selections consisted of 12 in which such a selection was the mother only (six of these being O.P.), 15 as the father only, and 60 (= 120 parental situations) in which Toyama selections were both of the parents used; however, no data on pollination numbers were recorded for seven of the mother-only families, two of the father-only families, and 35 (= 70 parental situations) of the both-parents families. For 'North America - old', the number of seeds was more than the recorded number of fruit because data on the number of fruit were missing for several large families. Table 1.
Total numbers of recorded pollinations conducted, fruit, seeds, and germinated seeds obtained for 234 families attempted in 1965–1984 by Dr. Thomas Toyama, categorized by parental origins and counting the two parental gametes per physical unit (except in totals of the bottom line).
-
Father Total Bing Ebony Sam Star Van Windsor Mother Bing − 10% − − − 0% 6% Ebony − − − − − 11% 11% Lambert − 15% 16% − 23% 32% 23% Sam 4% 0% − 9% − 6% 4% Van 5% 12% 0% 0% − 0% 3% Total 4% 7% 6% 5% 23% 8% 6.8% Table 2.
Conversion rates (number of germinated seeds obtained to flowers pollinated) for 16 attempted families using seven parents in 1966 by Dr. Thomas Toyama.
Figures
(6)
Tables
(2)