-
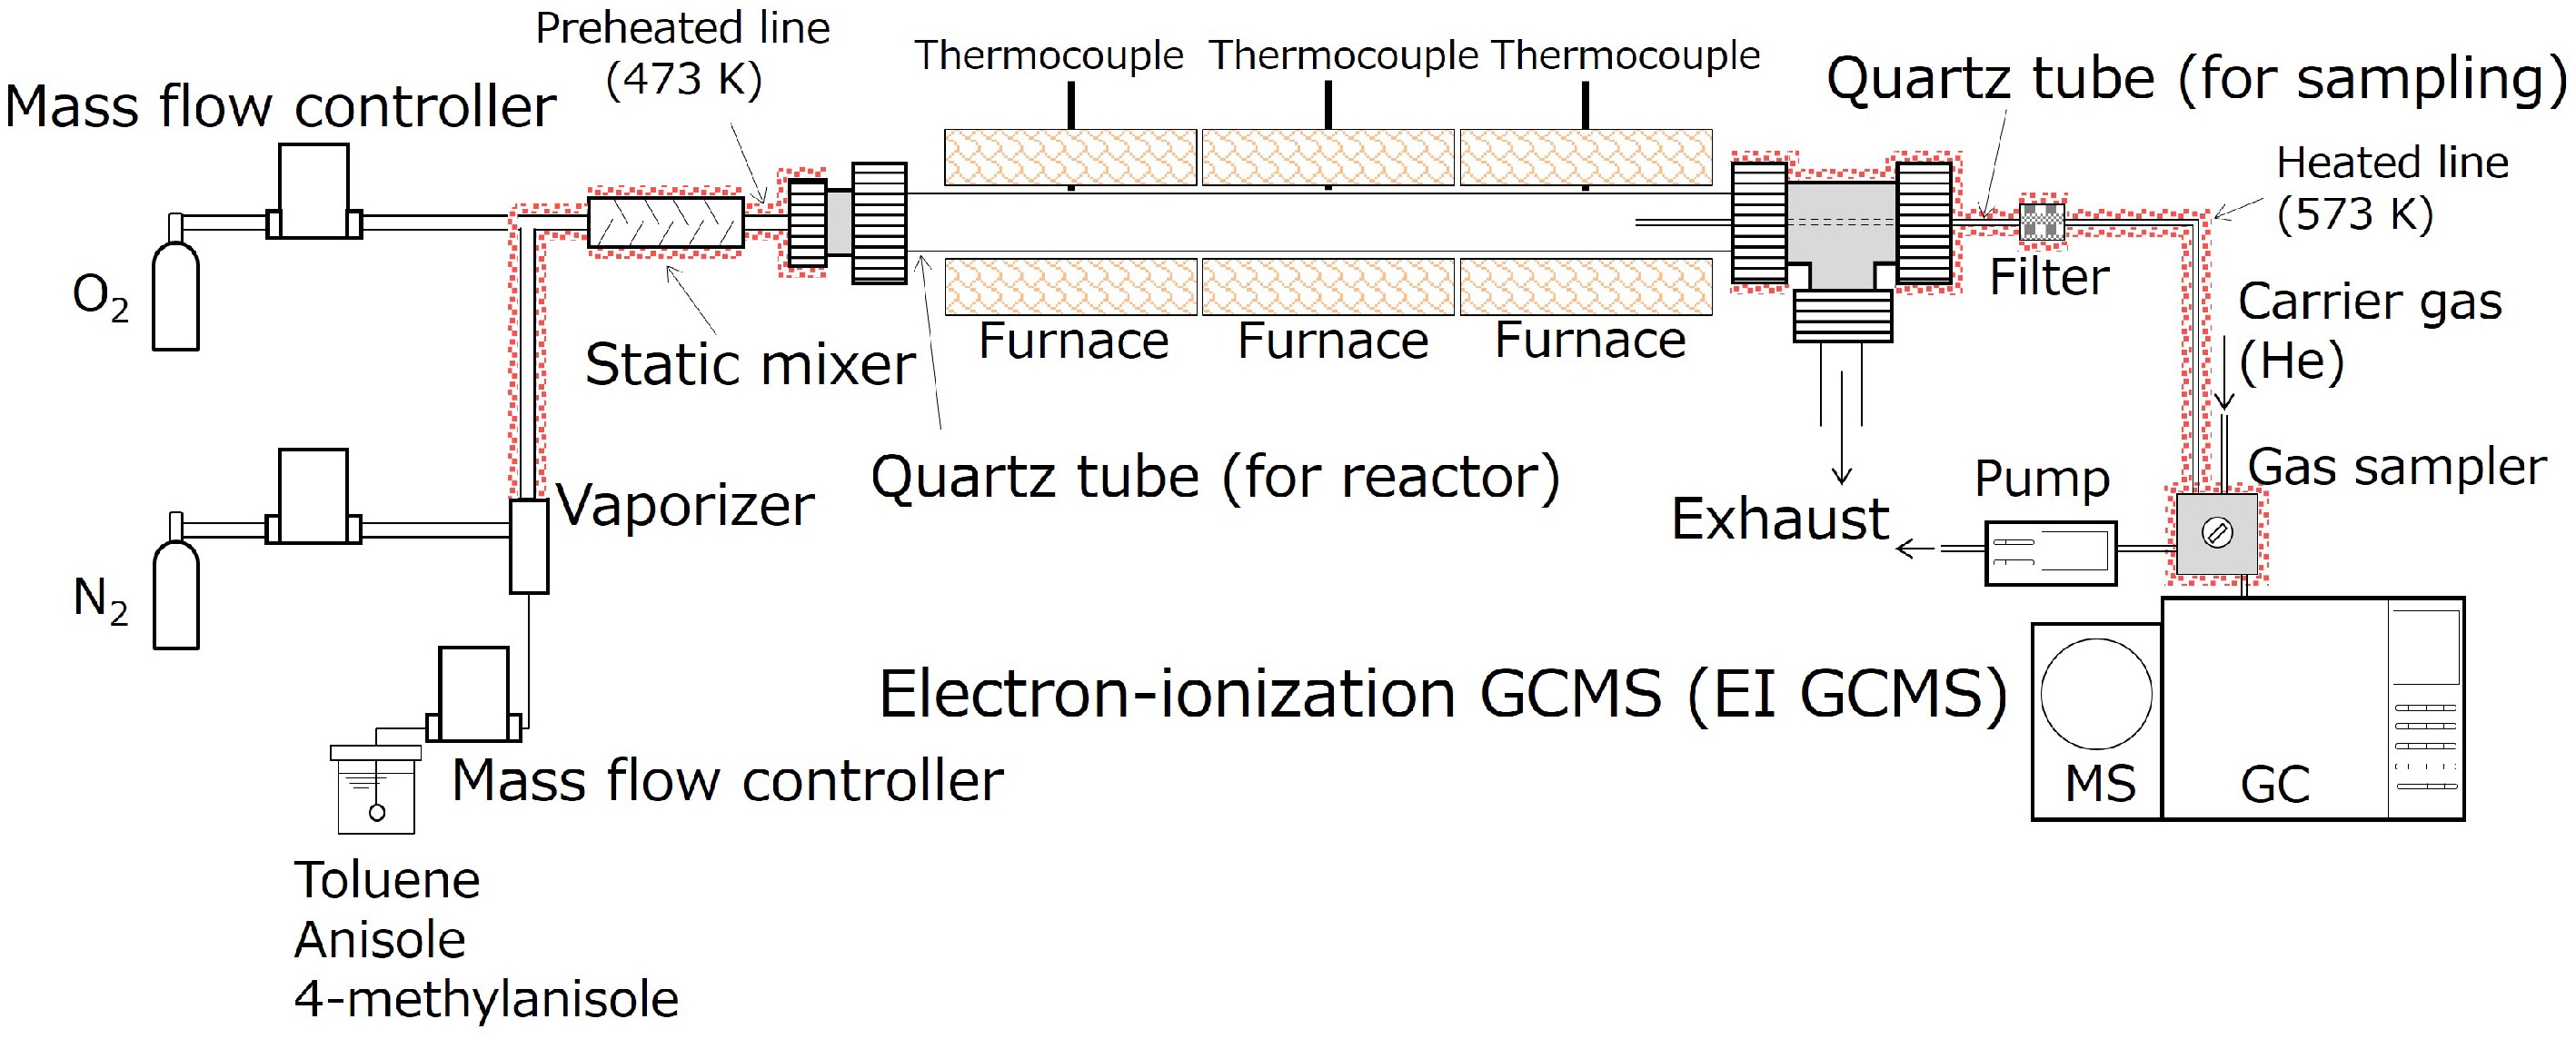
Figure 1.
A schematic diagram of a flow reactor system used for this study.
-
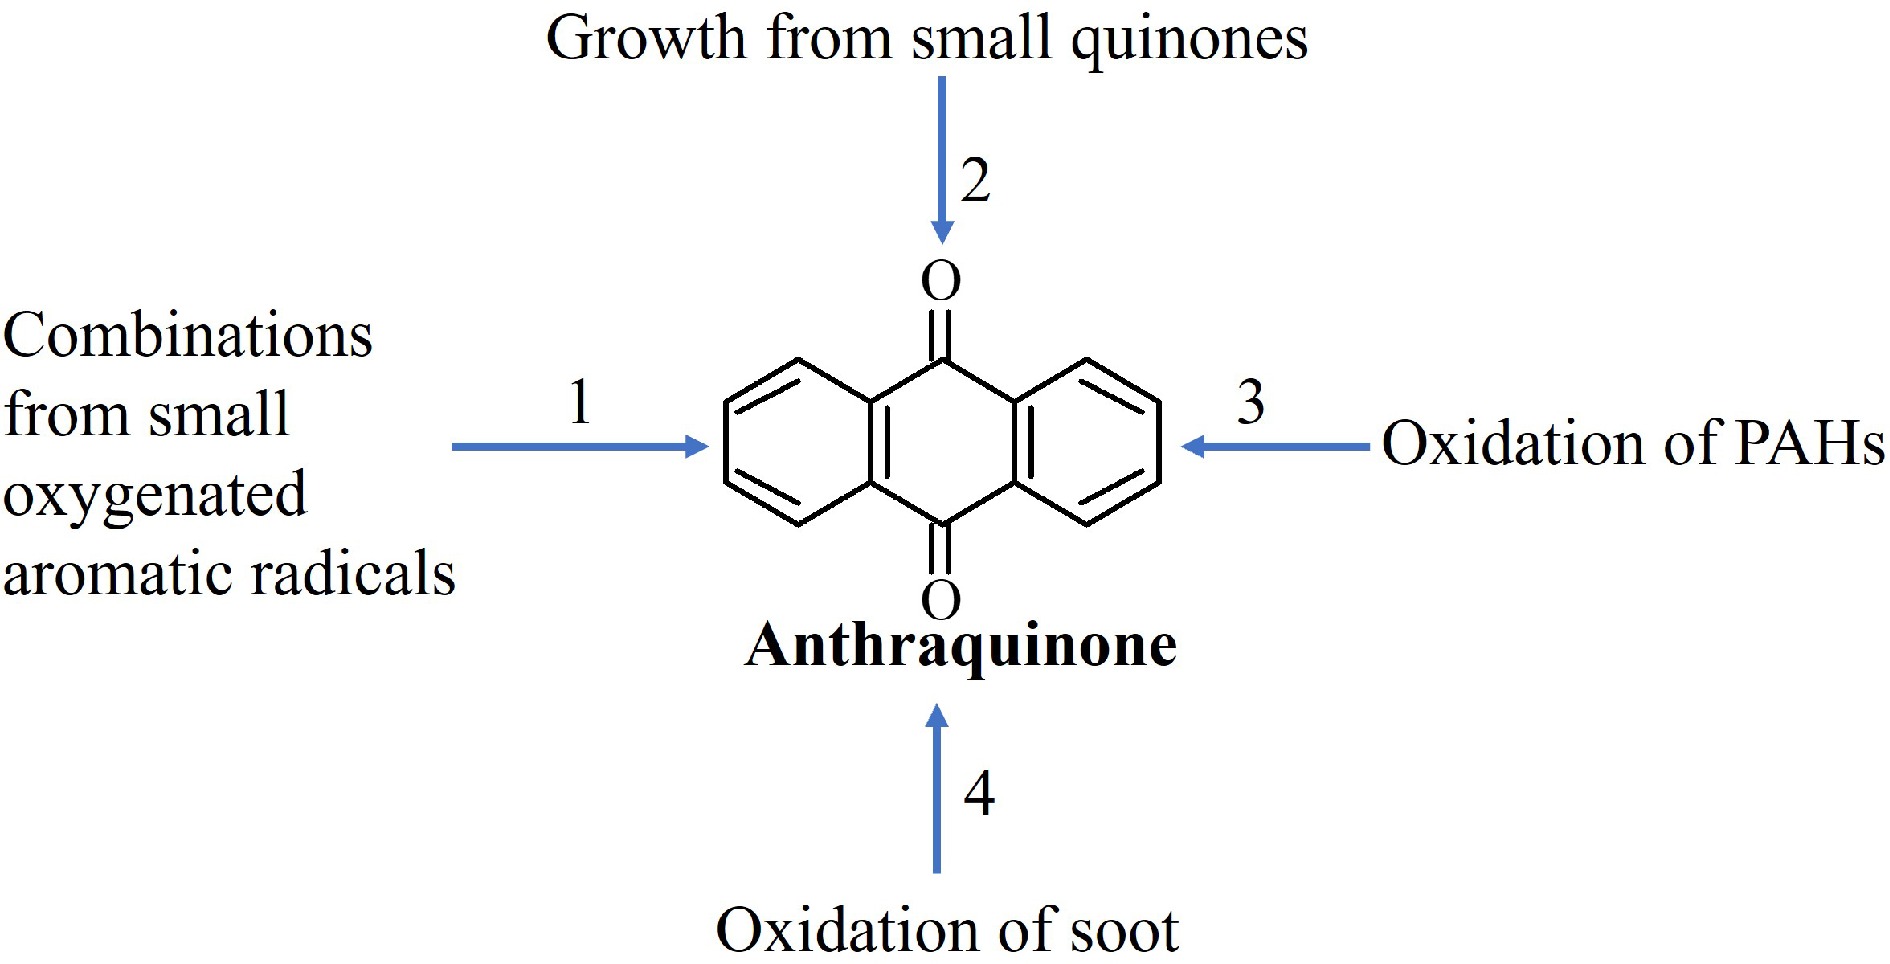
Figure 2.
Possible mechanisms for the formation of anthraquinone (9,10-anthraquinone).
-
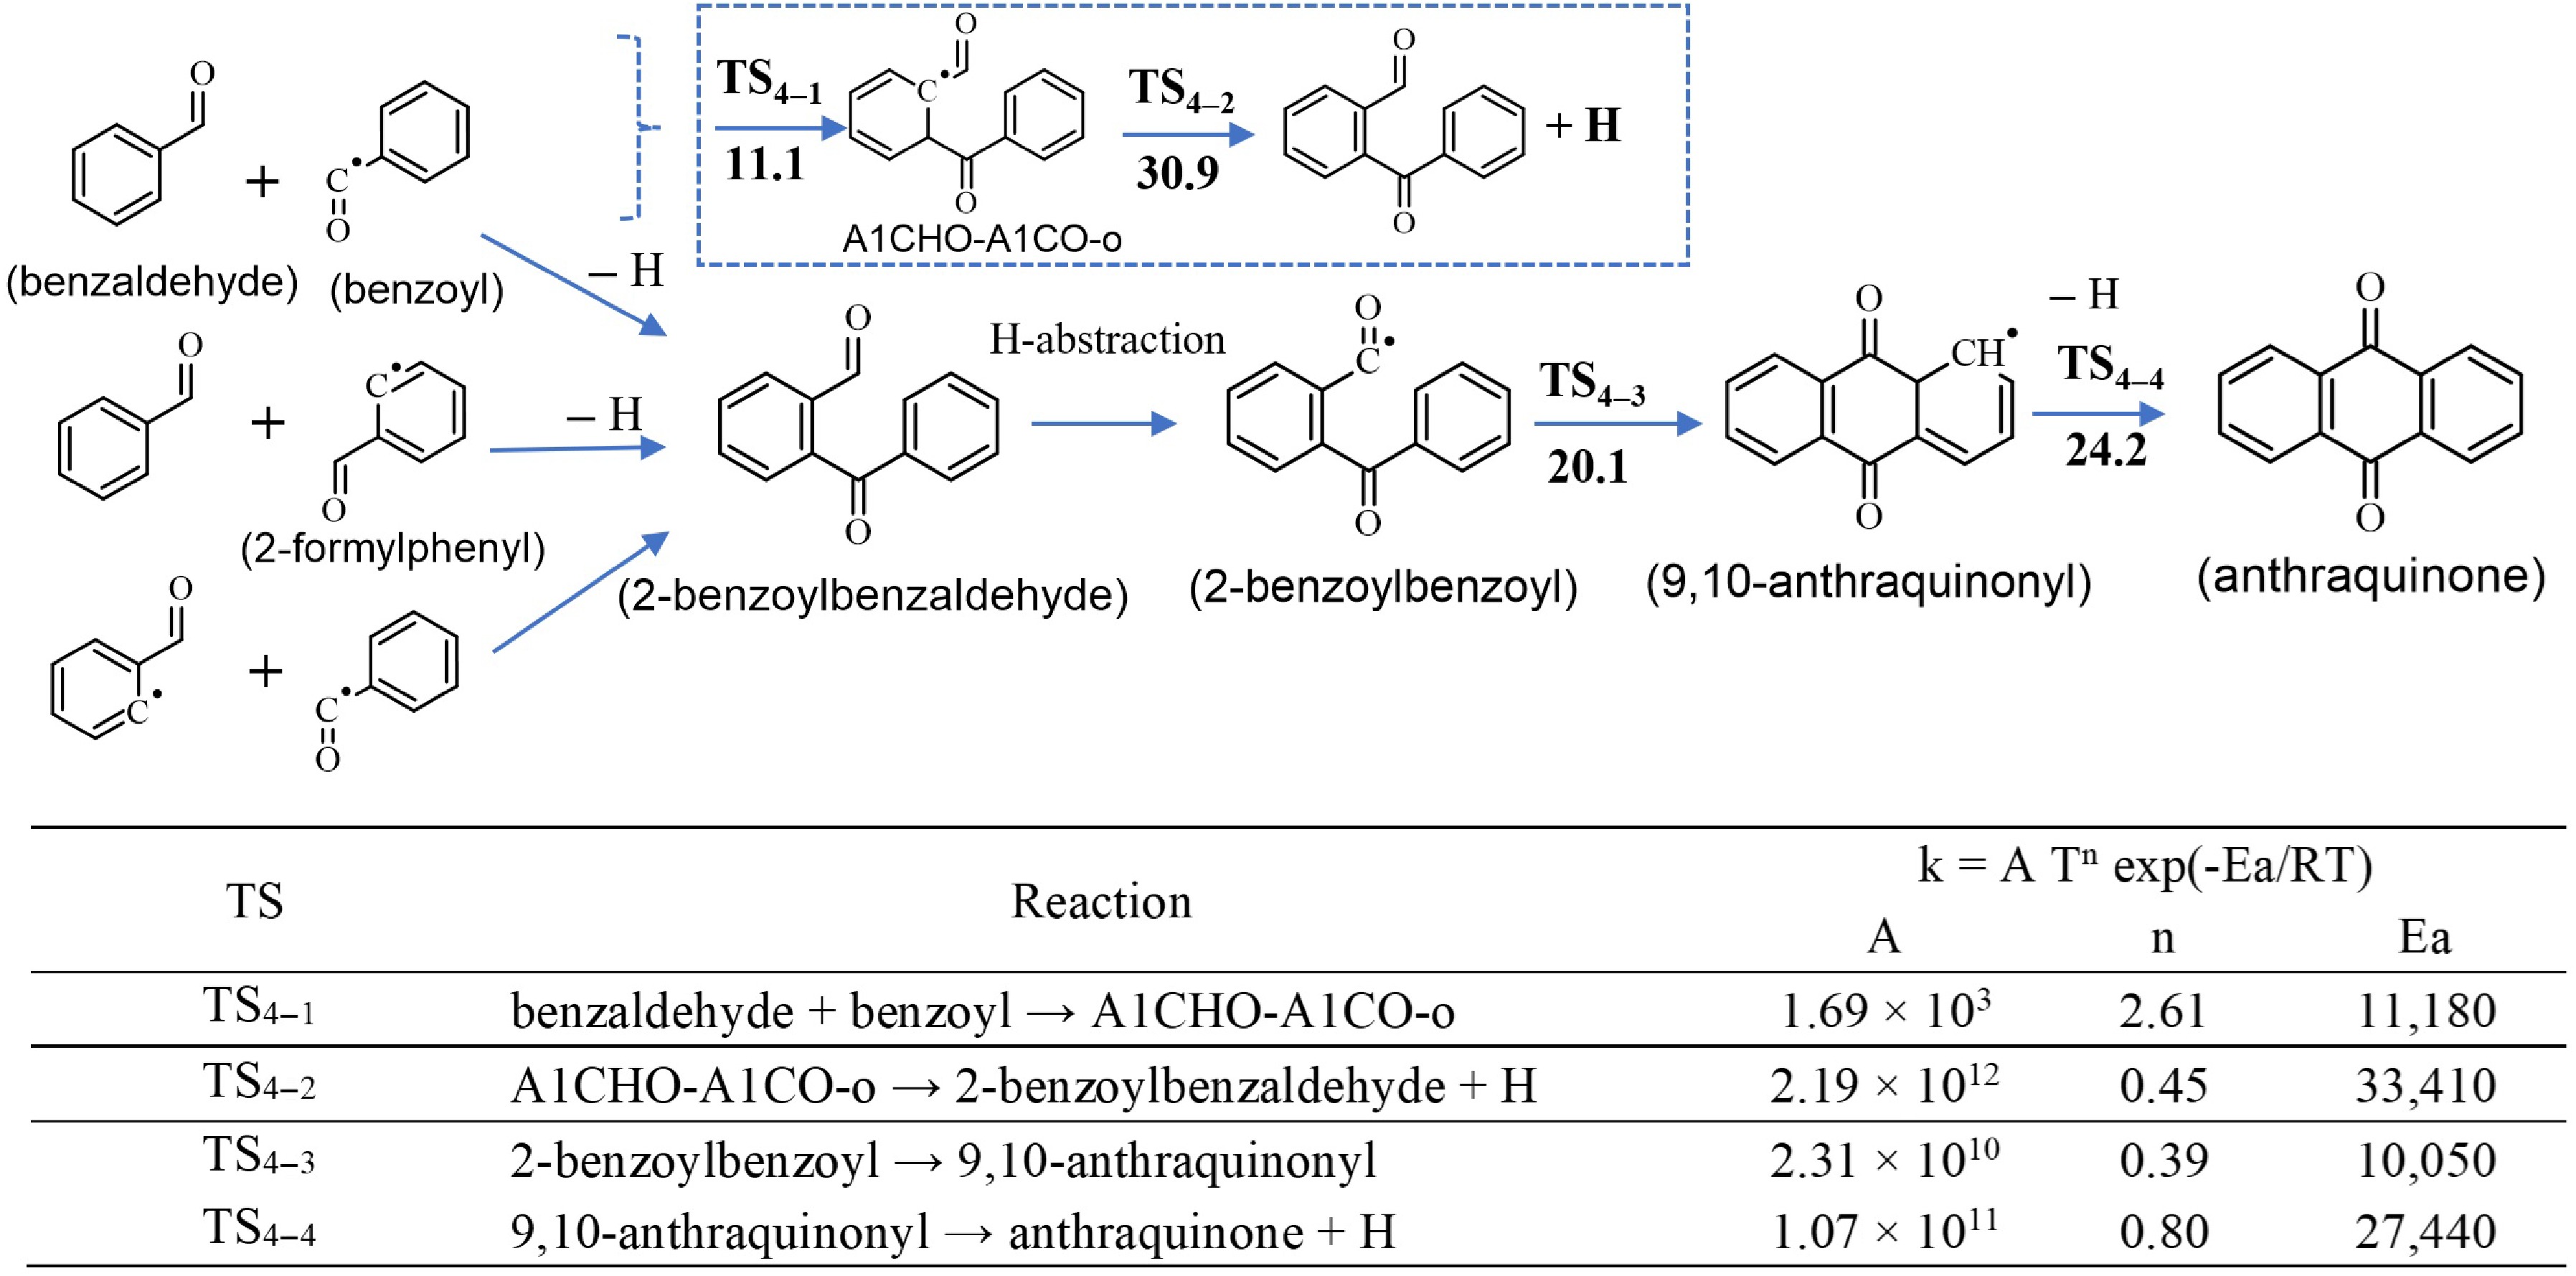
Figure 3.
Top panel: Combination of small oxygenated species leading to the formation of anthraquinone. Barrier heights (in kcal/mol) at 0 K calculated at the CBS-Q/CAM-B3LYP/6-311+ G(2d,p) level of theory, including ZPE. Bottom panel: The corresponding calculated rate constants (k) for a temperature range of 500 to 2,000 K computed at CBS-Q/CAM-B3LYP/6-311+G(2d,p) level of theory. Units are in cm, mol, s and cal. Notes: (1) the combination of benzaldehyde and benzoyl (first reaction) is a two-step reaction (illustrated in inserted box); full PES is available in Supplementary Fig. S1. (2) The rate constants of the second and third combination routes, as well as H-abstractions were not calculated in this work, but determined by analogy with structurally similar species as described in Section 'Sub-model of anthraquinone'.
-
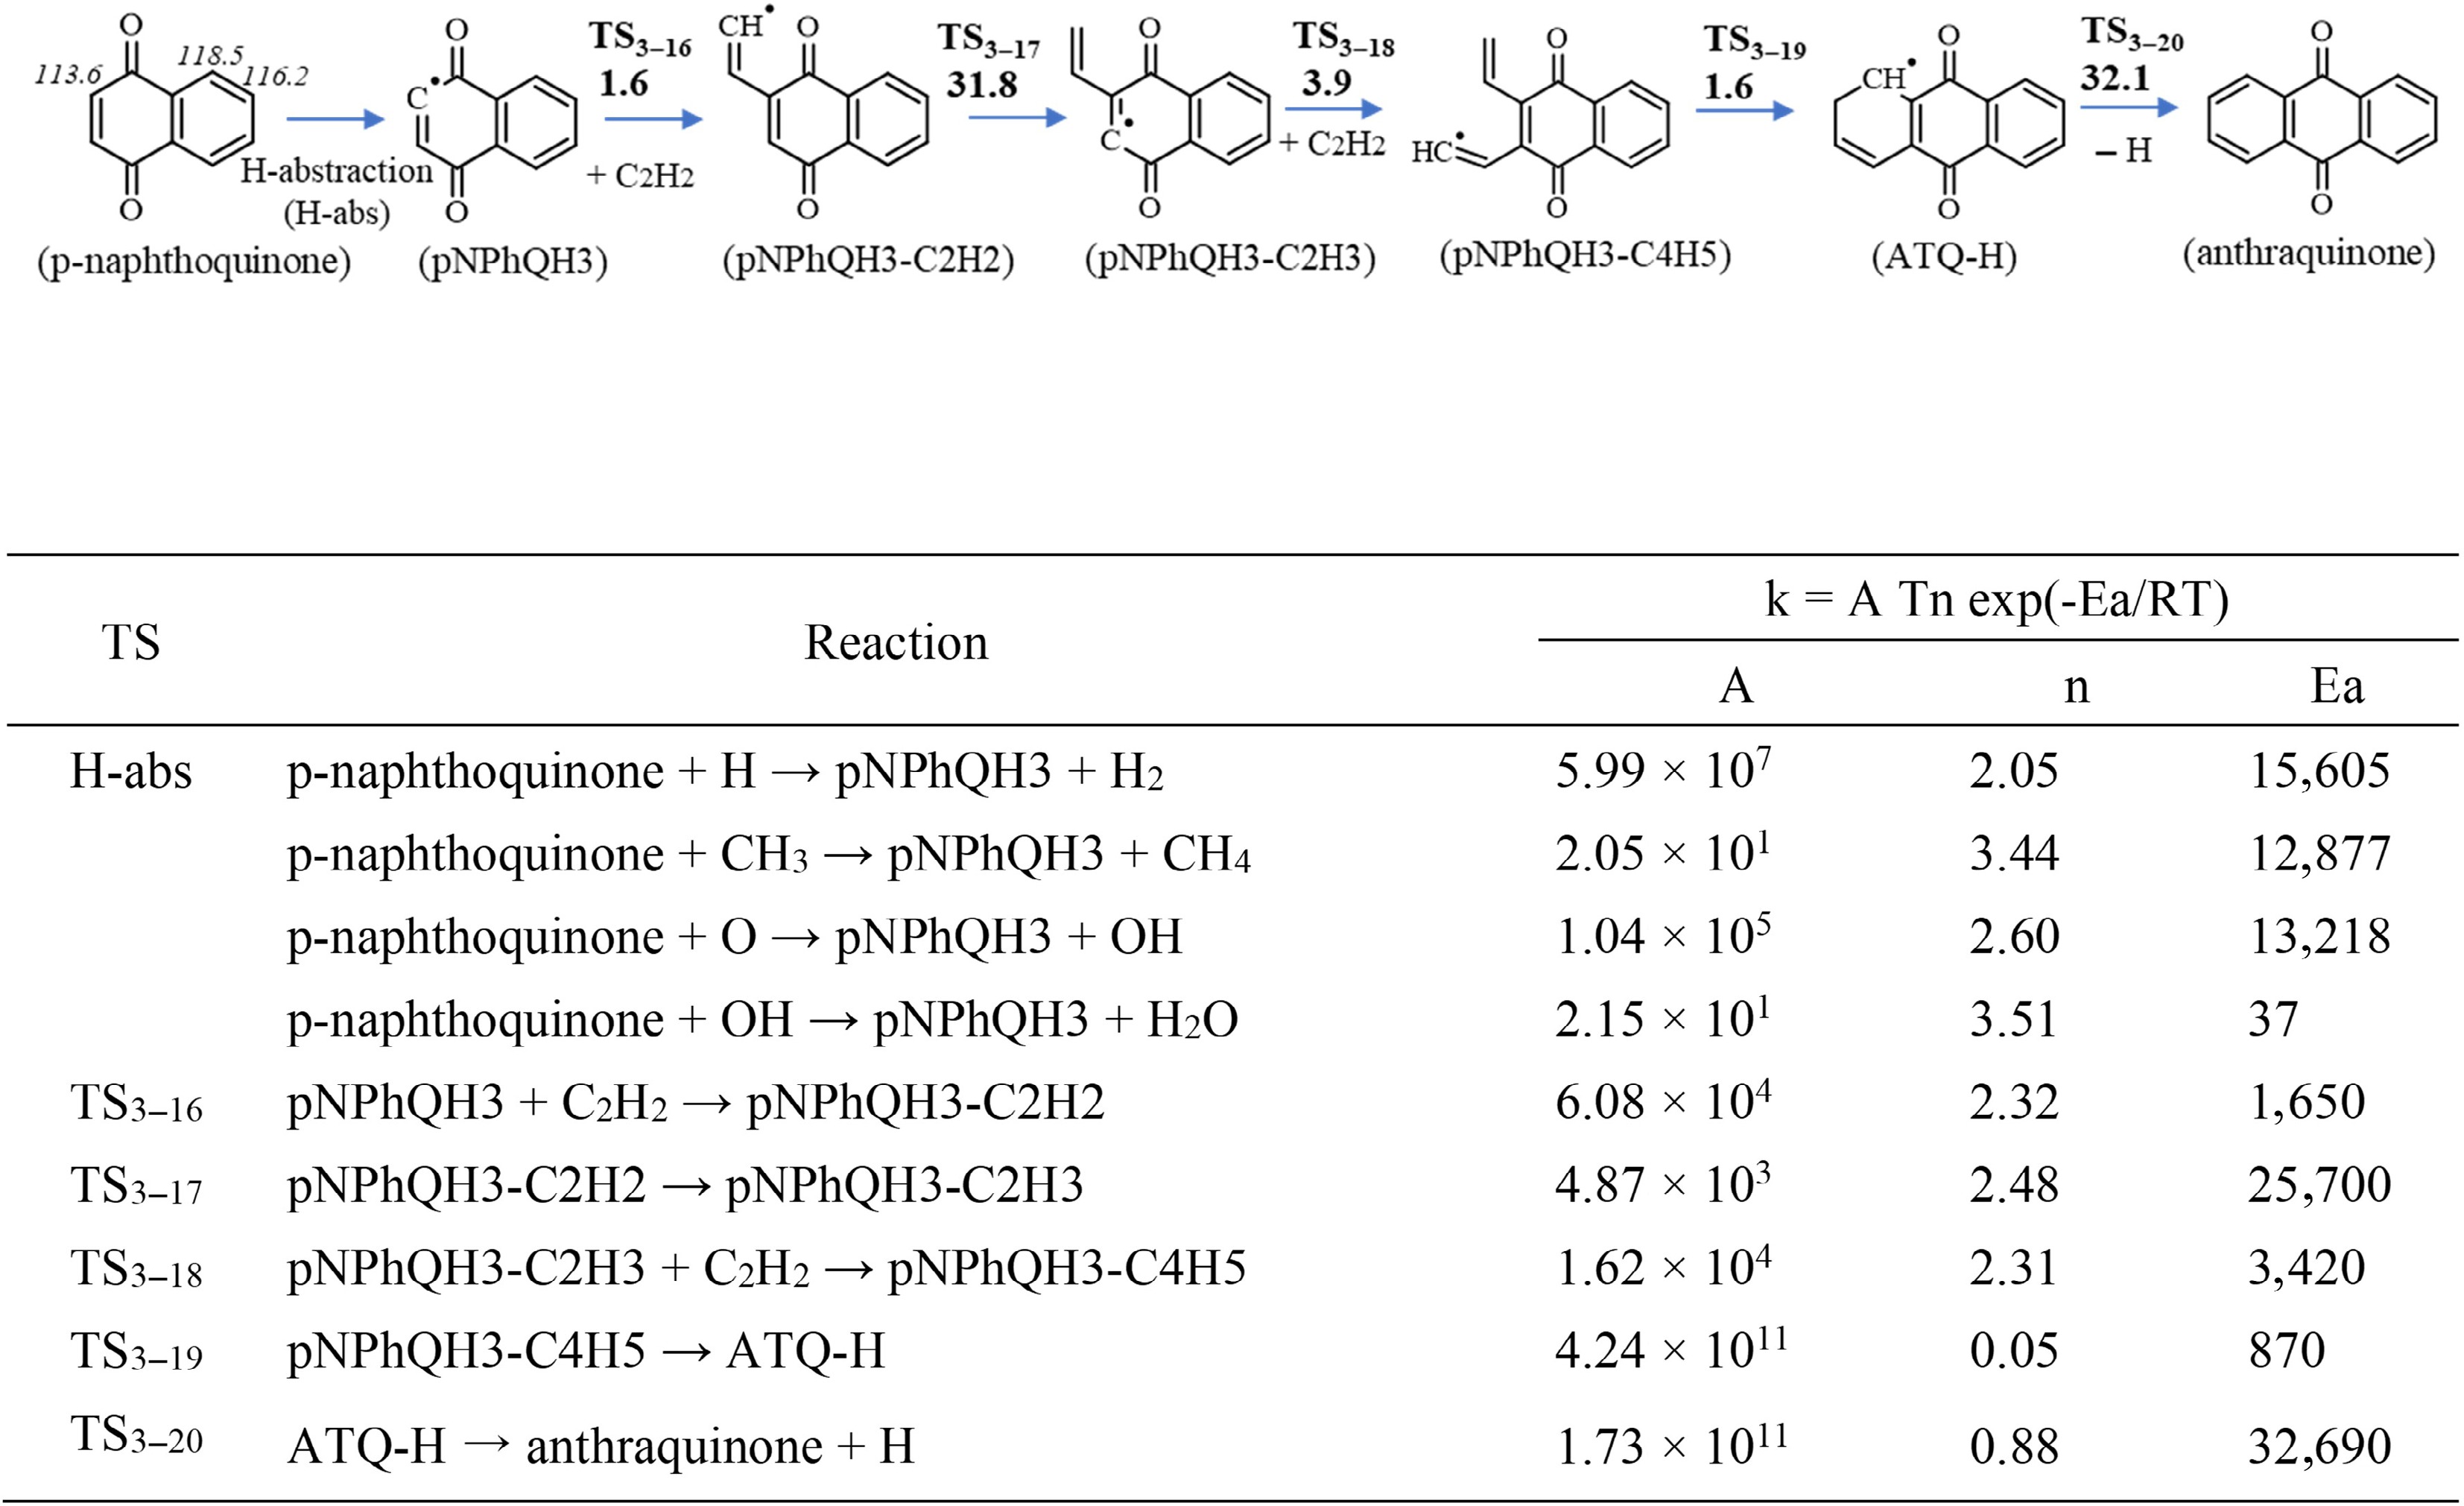
Figure 4.
Top panel: The growth from p-naphthoquinone to anthraquinone via C2H2 addition. Barrier heights (in kcal/mol) at 0 K calculated at the CBS-Q/CAM-B3LYP/6-311+ G(2d,p) level of theory, including ZPE. The numbers in italics are the C–H bond dissociation energies (in kcal/mol) at the corresponding sites of p-naphthoquinone, determined in this work. Bottom panel: The corresponding rate constants (k) for a temperatures range of 500 to 2,000 K computed at CBS-Q/CAM-B3LYP/6-311+G(2d,p) level of theory. Units are in cm, mol, s, and cal.
-
-
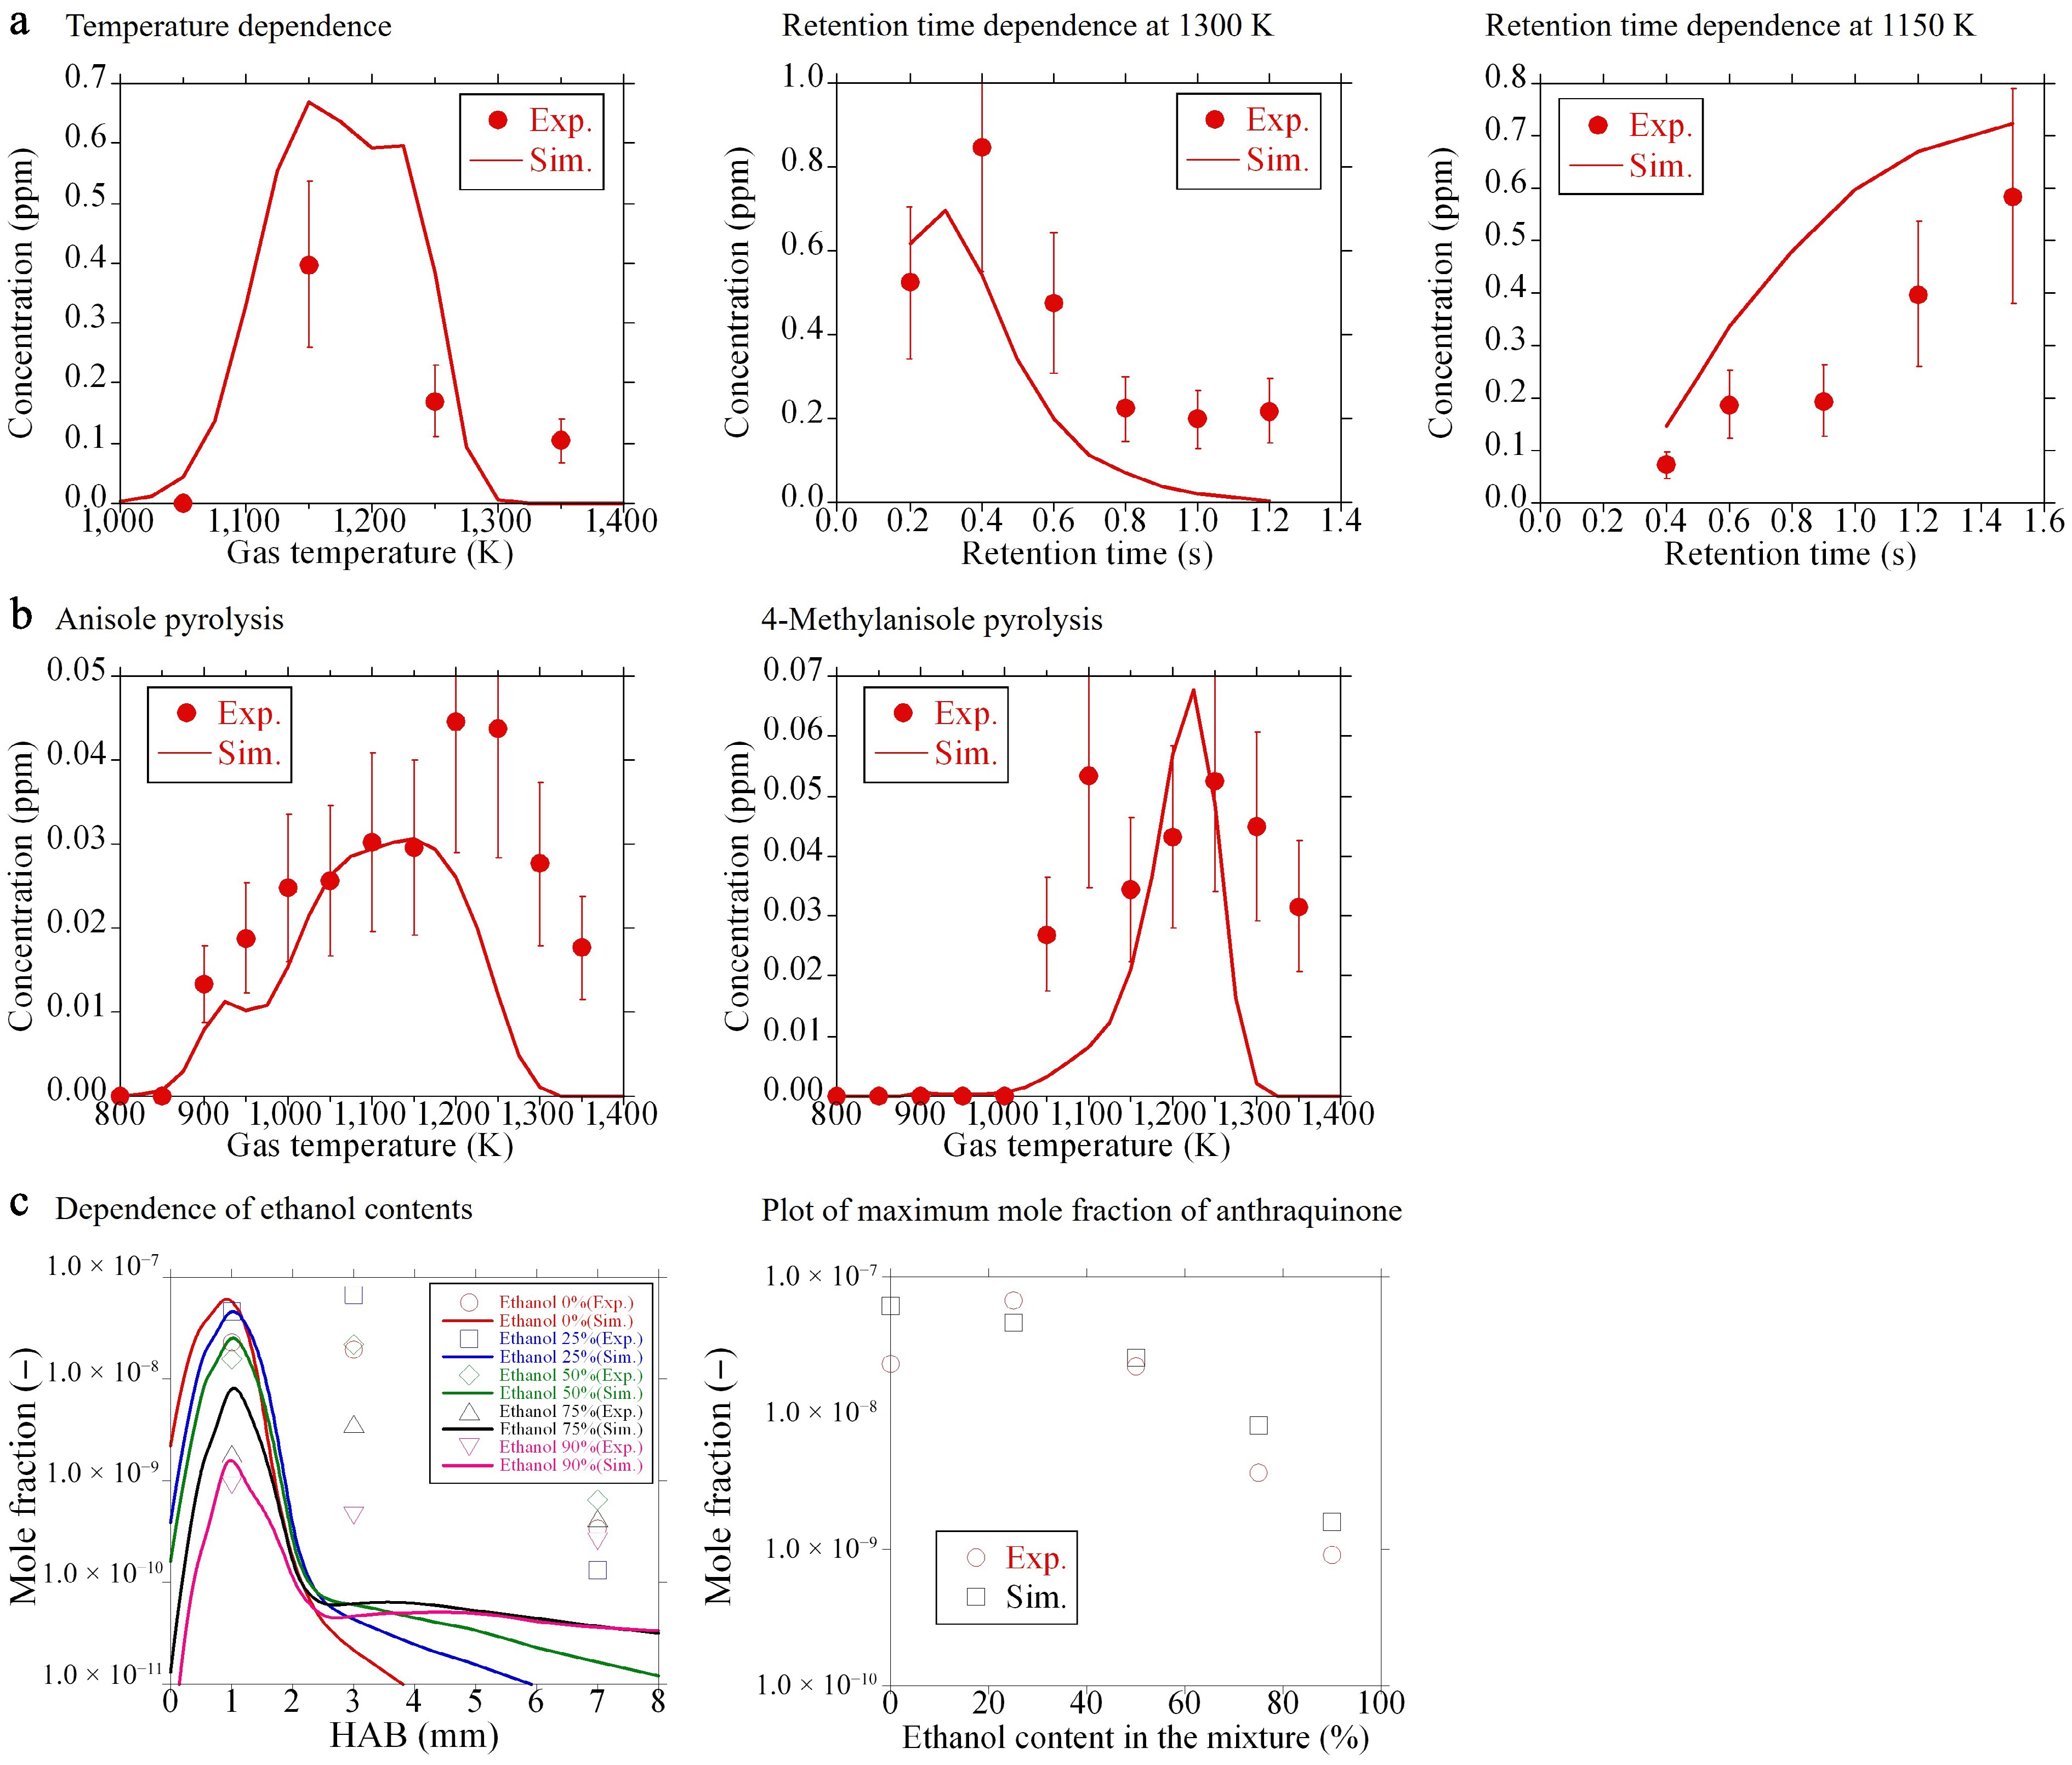
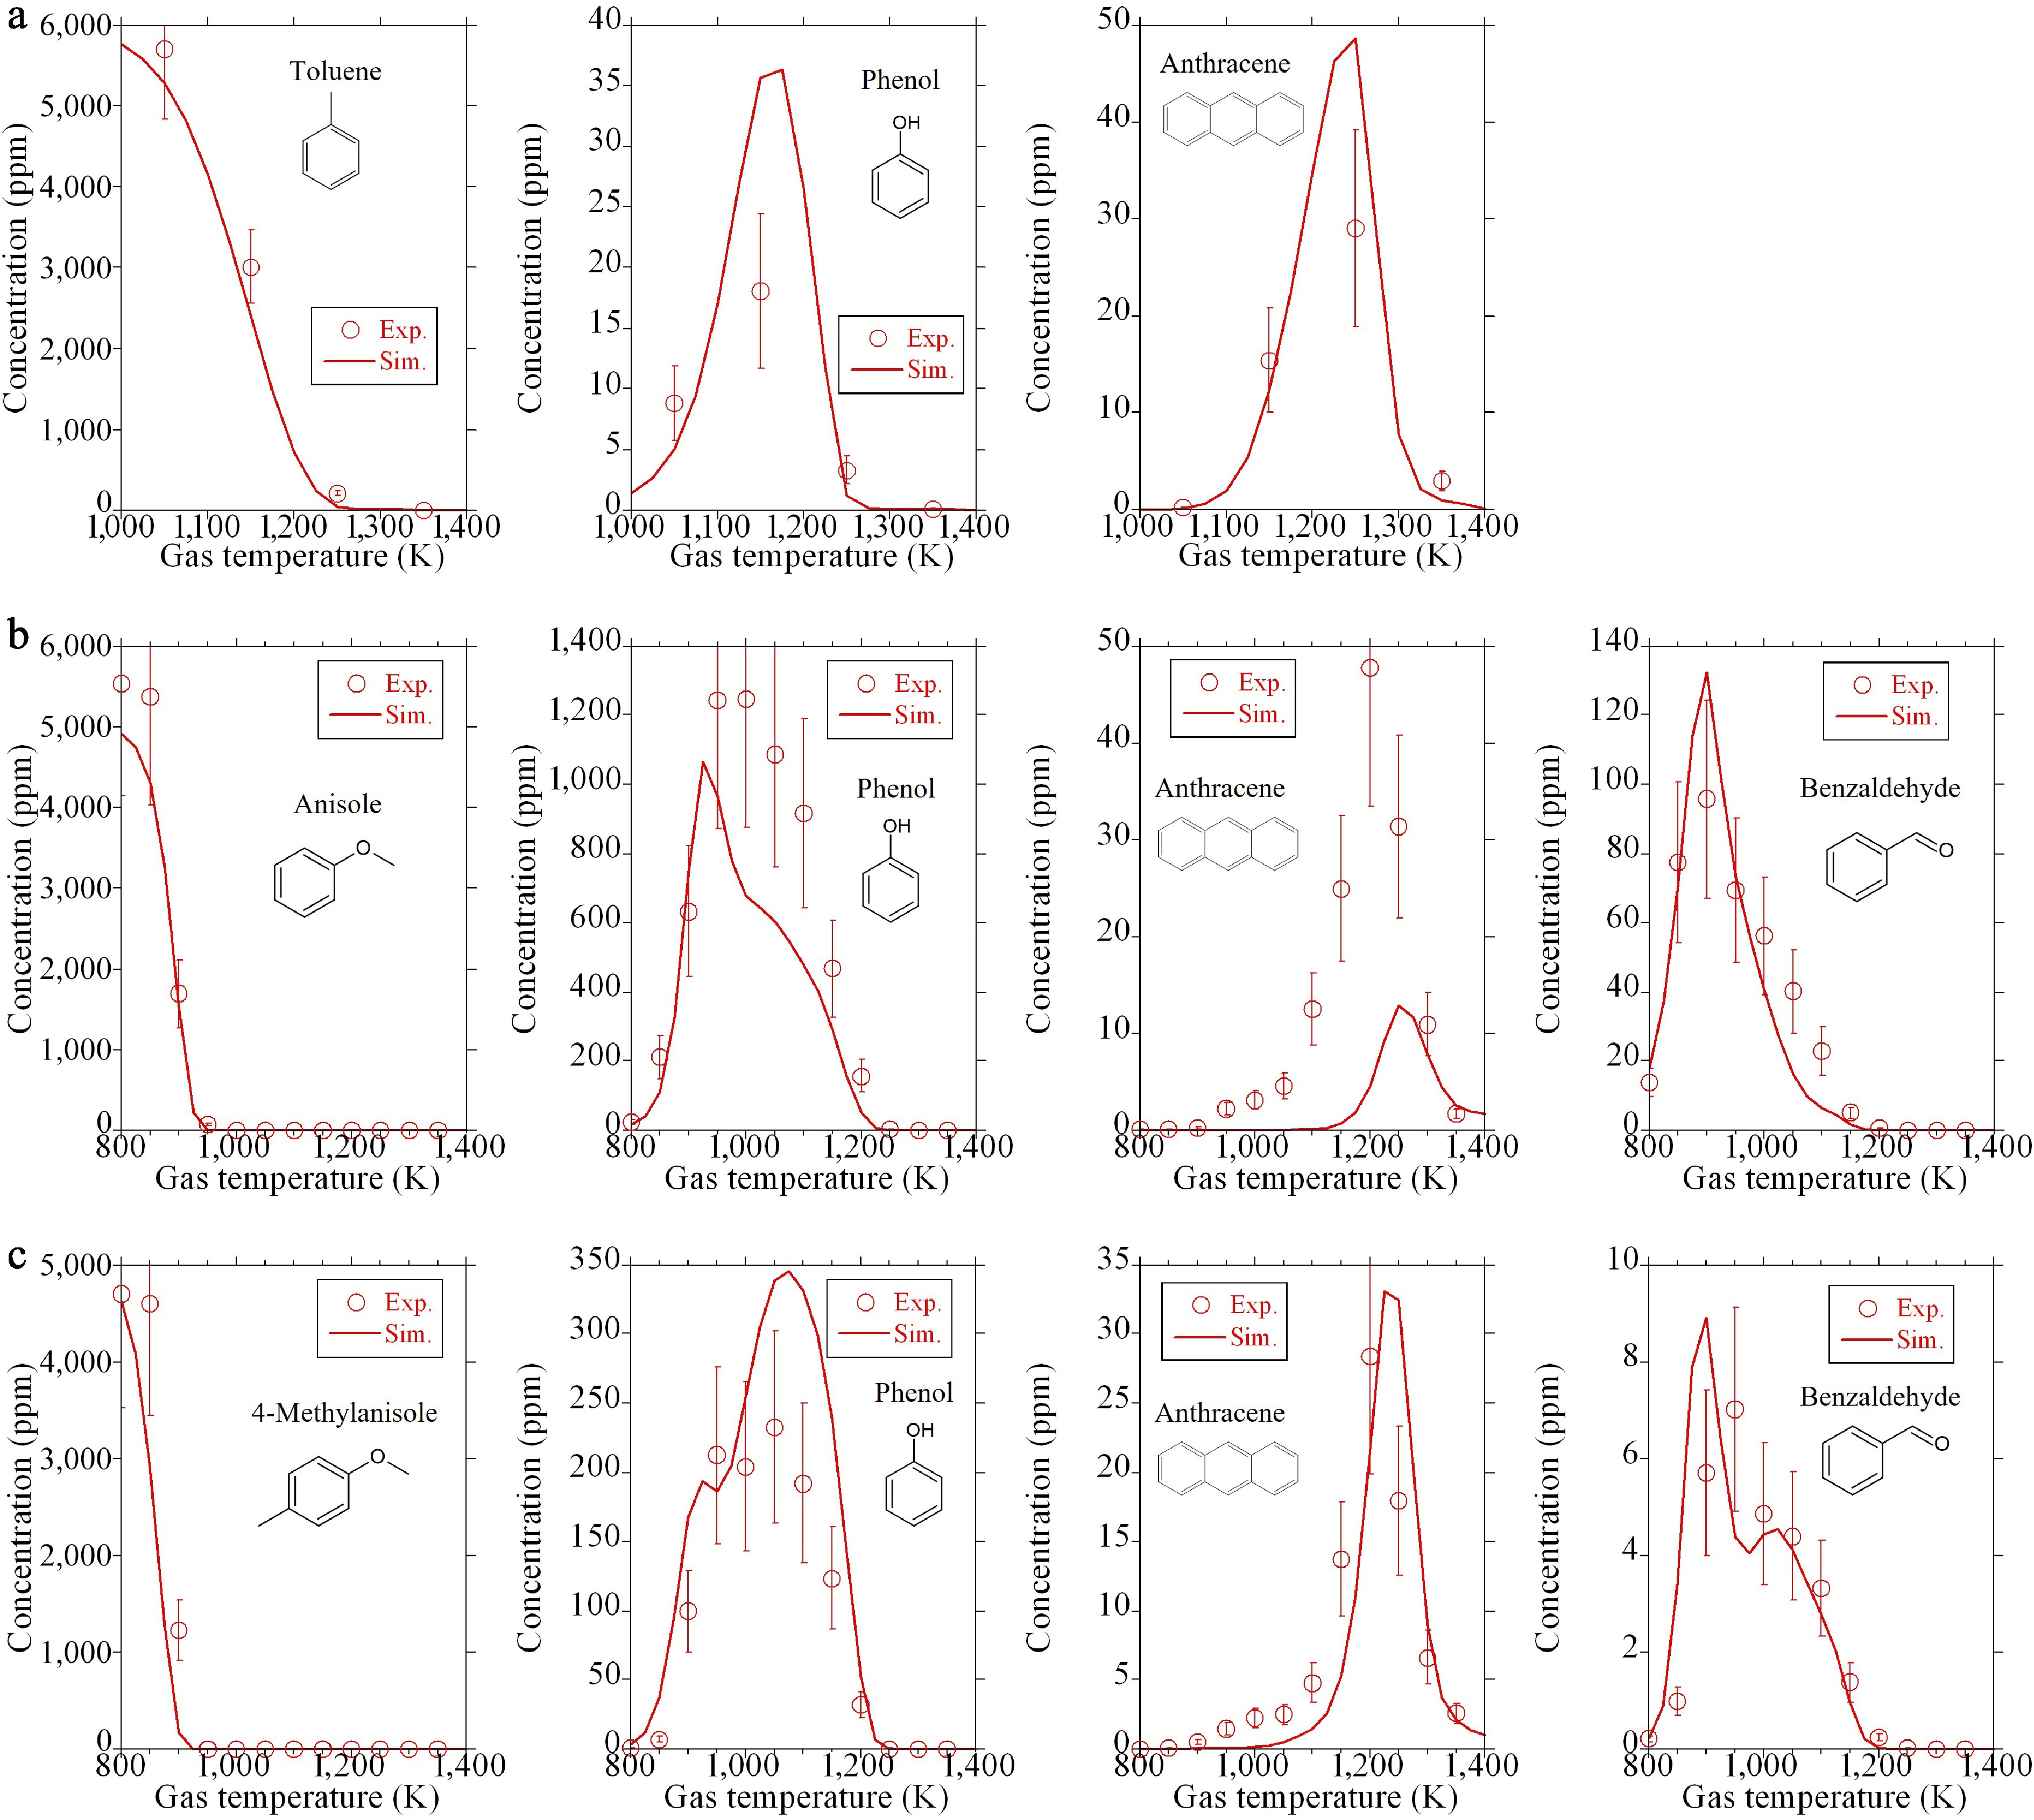
Figure 6.
Mole fractions of anthraquinone: comparison of experiments (symbols) and the present model (lines). (a), (b) New experimental data. (c) Literature data[12].
-
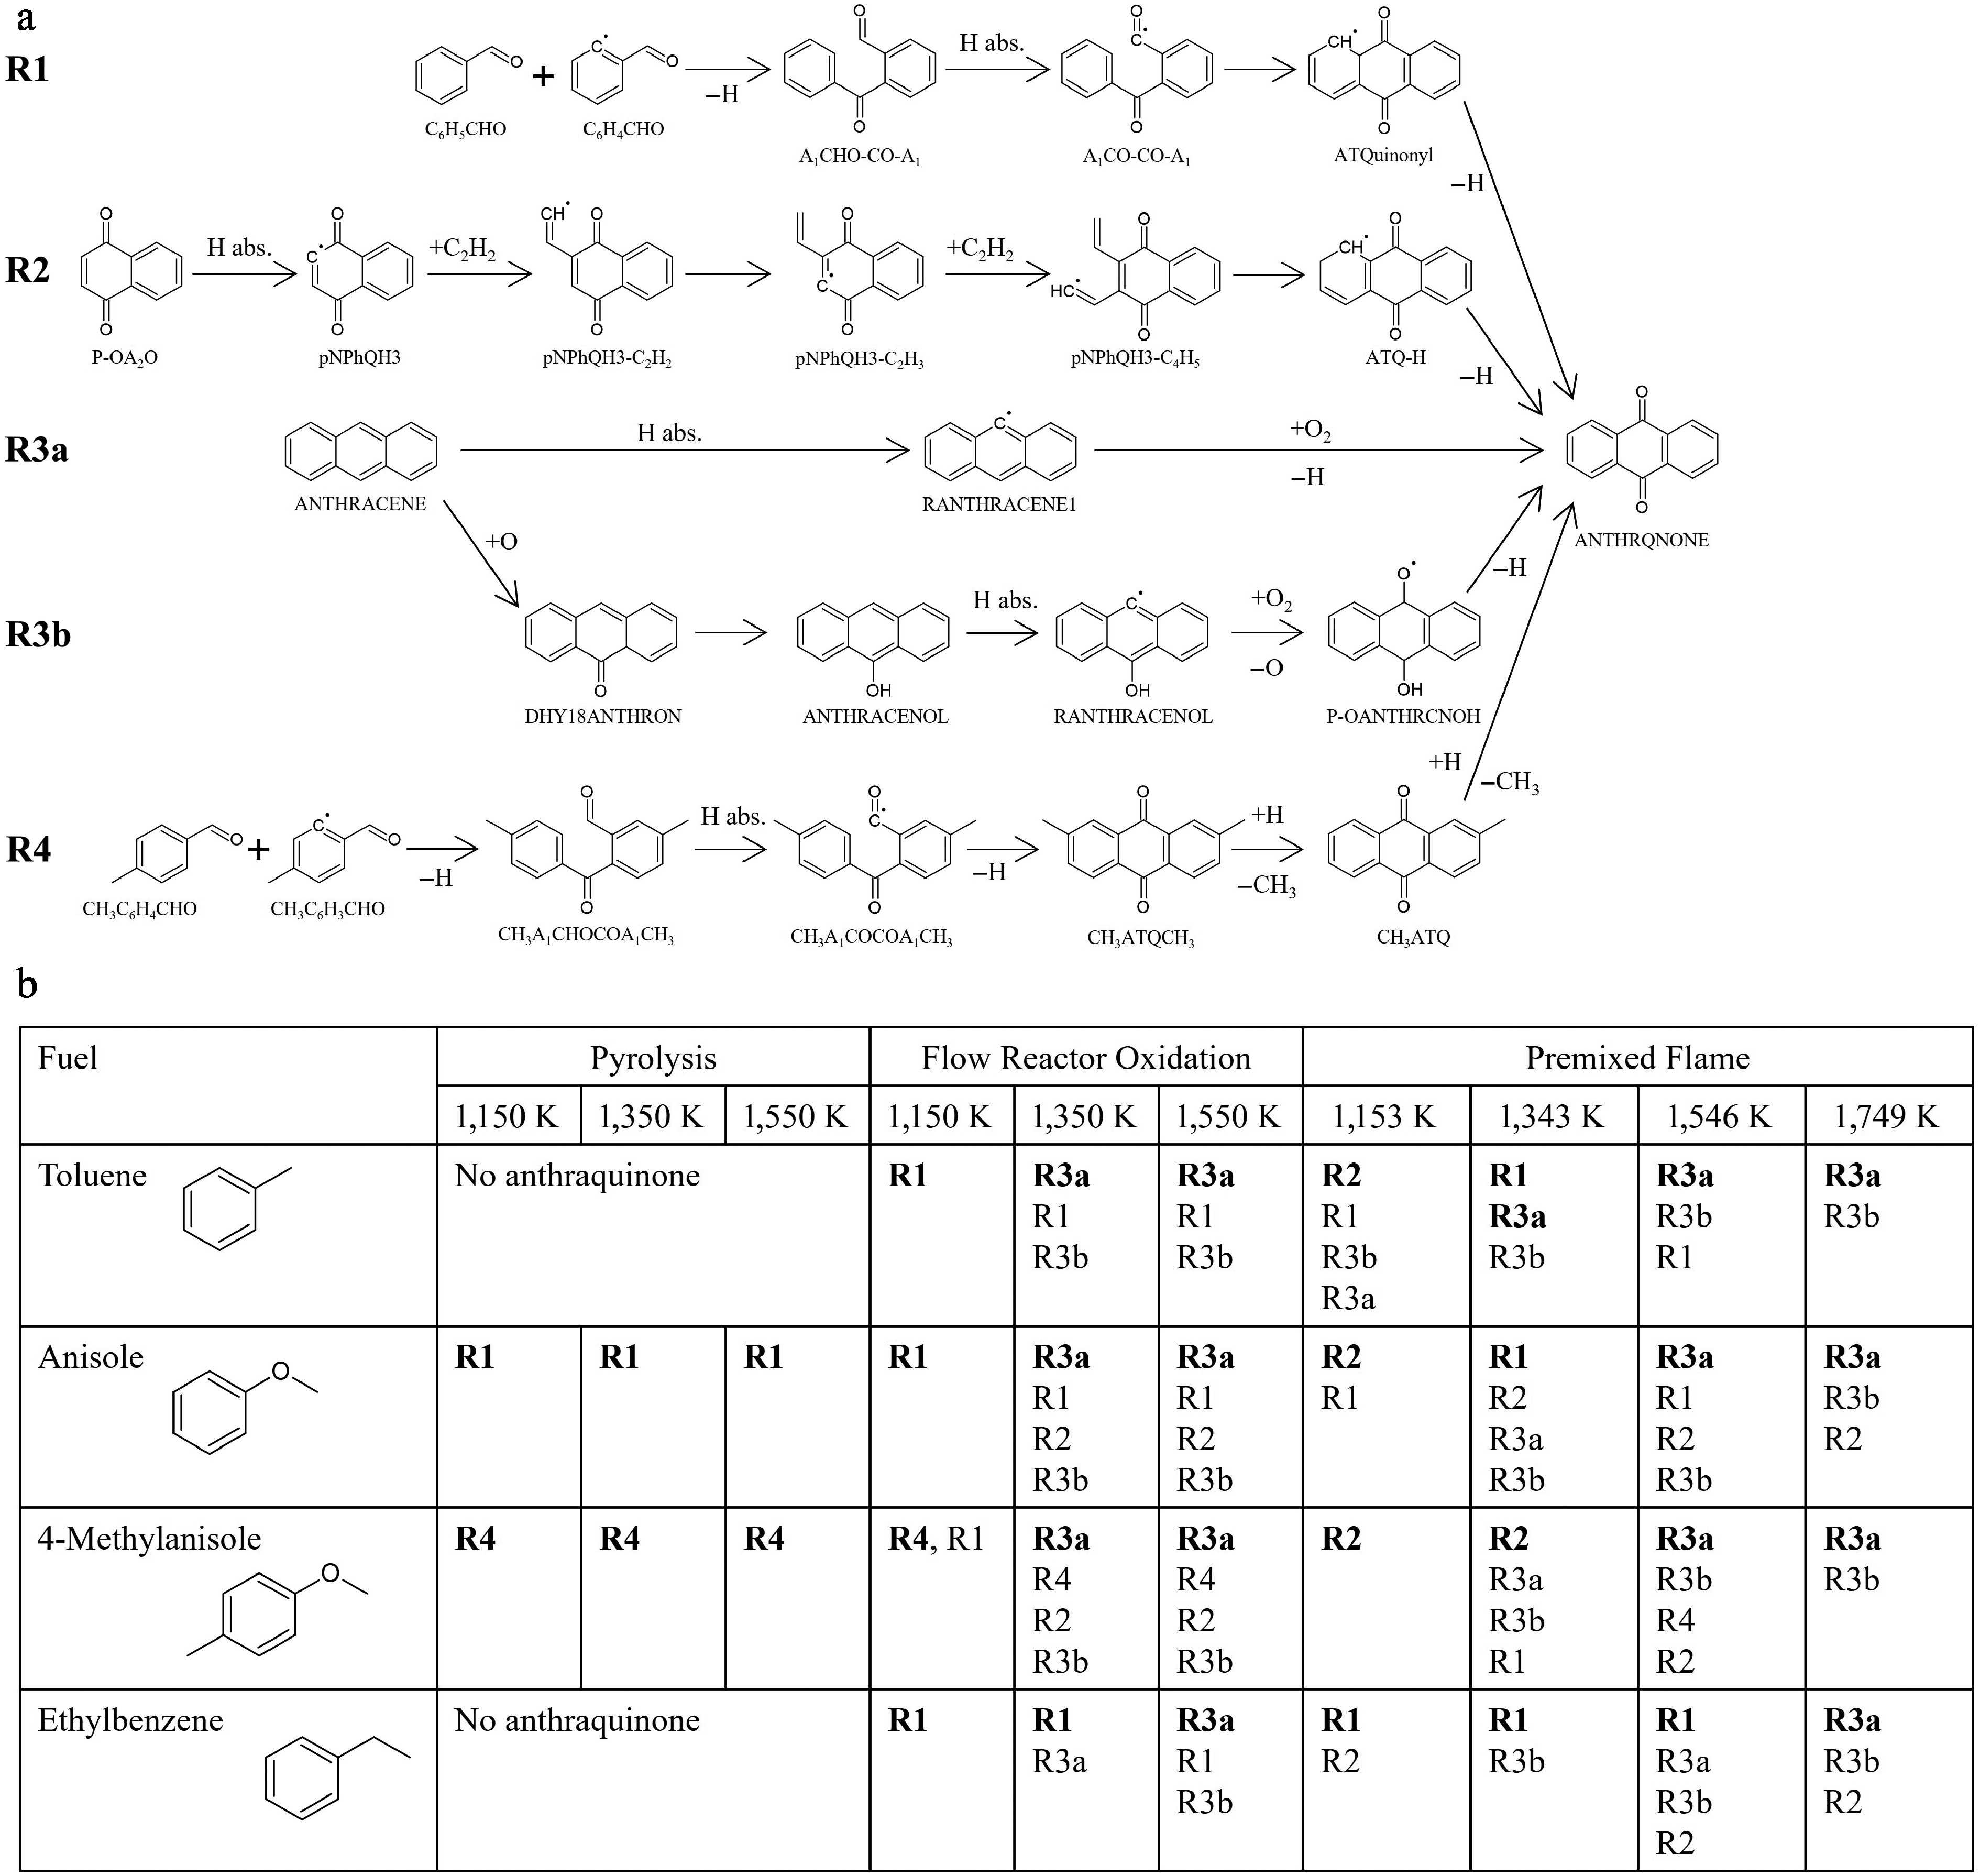
Figure 7.
Results of the reaction pathway analysis for anthraquinone. (a) Schematic illustration of the important production pathways toward anthraquinone (ANTHRQNONE). (b) Summary of the dominant pathways for anthraquinone under various fuels and conditions. Three representative cases, pyrolysis, oxidation and flame were selected. The pyrolysis and fuel-rich oxidation were analyzed in a flow reactor at an equivalence ratio of 9.0. For premixed flame simulations of toluene, anisole, and 4-methylanisole, the same equivalence ratio (φ = 1.68) and temperature profile as in ethylbenzene case[12] were employed. In flame simulations, HABs corresponding to 1,153, 1,343, 1,546, and 1,749 K are 0.74, 0.89, 1.13, and 1.55 mm, respectively. No anthraquinone is formed in the pyrolysis of toluene and ethylbenzene. The reactions are listed in the order of contribution, with the most dominant reactions highlighted in bold.
Figures
(7)
Tables
(0)