


-
Following polycyclic aromatic hydrocarbons (PAHs) formed during combustion, scientific interest in oxygenated PAHs (OPAHs) has increased because of their persistence in the environment and concern over potential toxicity[1,2]. Anthraquinone (9,10-anthraquinone; IUPAC: anthracene-9,10-dione) is an OPAH with double ketone functionalities, and has often been experimentally detected in the emissions from real combustion systems, like stoves and engines operating with biomass or biofuels. For example, Shen et al.[3,4] and Vicente et al.[5] studied the combustion of biomass in stoves and identified anthraquinone among OPAHs using Gas Chromatography coupled with a Mass Spectrometer (GC-MS) and a HP-5MS column ([5%-phenyl]-methylpolysiloxane). Nyström et al.[6], Guan et al.[7], Li et al.[8], and Lara et al.[9] characterized the exhaust particles emitted from engines fueled with diesel/biodiesel and showed that anthraquinone was one of the predominant OPAHs using either High Performance Liquid Chromatography-GC-MS (HPLC-GC-MS), or GC-MS combined with a HP-5MS column or a similar column (DB-5MS or SLB-5MS). Ahmed et al.[10] determined emission factors for OPAHs and PAHs from light duty vehicles fueled with gasoline/ethanol blend using a HPLC-GC-MS system with a DB-17MS column ([50%-phenyl]-methylpolysiloxane) for GC-MS, and reported that the most abundant OPAH in almost all their samples was anthraquinone. This molecule was also detected in semipractical turbulent diffusion flames of 'number 6' heavy fuel oil by Koziński et al.[11]. In contrast to the abundance of studies conducted in real combustors, significantly fewer studies have been carried out to detect this OPAH in laboratory reactors. Relevant studies include those by Levendis and coworkers[12,13] and Sood et al.[14] who investigated atmospheric-pressure flat laminar premixed flames of ethylbenzene/ethanol or iso-octane/anisole, and identified anthraquinone among detected OPAHs using the GC-MS system equipped respectively with a HP-5MS column or a SCION-17MS column ([50%-phenyl]-methylpolysiloxane). The cited references reported only anthraquinone, without addressing the other isomers in detail. Furthermore, to our knowledge, there is no analysis of the relative stability of their different isomers. However, the identification of anthraquinone in these studies was direct and based on sound principles, using GC-MS or HPLC-GC-MS, where species identification was based on both retention time and mass spectrum (electron ionization). The columns used in most of these studies contain 5% or 50% phenyl stationary phase, suitable for aromatic separation. Additionally, the major isomers of C14H8O2, reported in the NIST webbook[15], such as anthraquinone, henanthraquinone, and 1,4-anthraquinone, exhibit very different mass spectral signatures and different boiling points (~380, 360, and 406 °C, respectively). These aspects might suggest high confidence in the identification of anthraquinone in literature studies. As shown, while its emission has been recognized in flue gases from practical combustors, there remains a lack of experimental data in fundamental laboratory-scale reactors, which are essential for investigating its formation kinetics. Another important point is that the anthraquinone formation kinetic sub-model is a missing piece in current combustion models, and there are no theoretical calculations for reactions involved in this sub-model. Therefore, this study focuses on the formation kinetics of this OPAH using a combined approach including experiments, theoretical calculations, and modeling.
-
Three different liquid fuels, toluene (purity > 99.8%), anisole (purity > 99.0%), and 4-methylanisole (purity > 98.0%) were investigated individually using a flow reactor setup. Fuel-rich oxidation experiments with an equivalence ratio of 9.0 were conducted with toluene, while pyrolysis experiments were performed for anisole and 4-methylanisole. The experimental setup was almost identical to that described in a previous study[16−19]. Liquid fuels were delivered via a mass flow controller and introduced into a vaporizer, where high-purity nitrogen (purity > 99.99995%) served as the carrier gas. The gaseous mixture consisting of fuel and nitrogen was then sent to a tubular reactor. In the case of toluene oxidation, oxygen was mixed with the fuel-nitrogen mixture prior to the reactor. A schematic diagram of a flow reactor system used in this study is presented in Fig. 1. A summary of the experimental conditions is given in Supplementary Table S1.
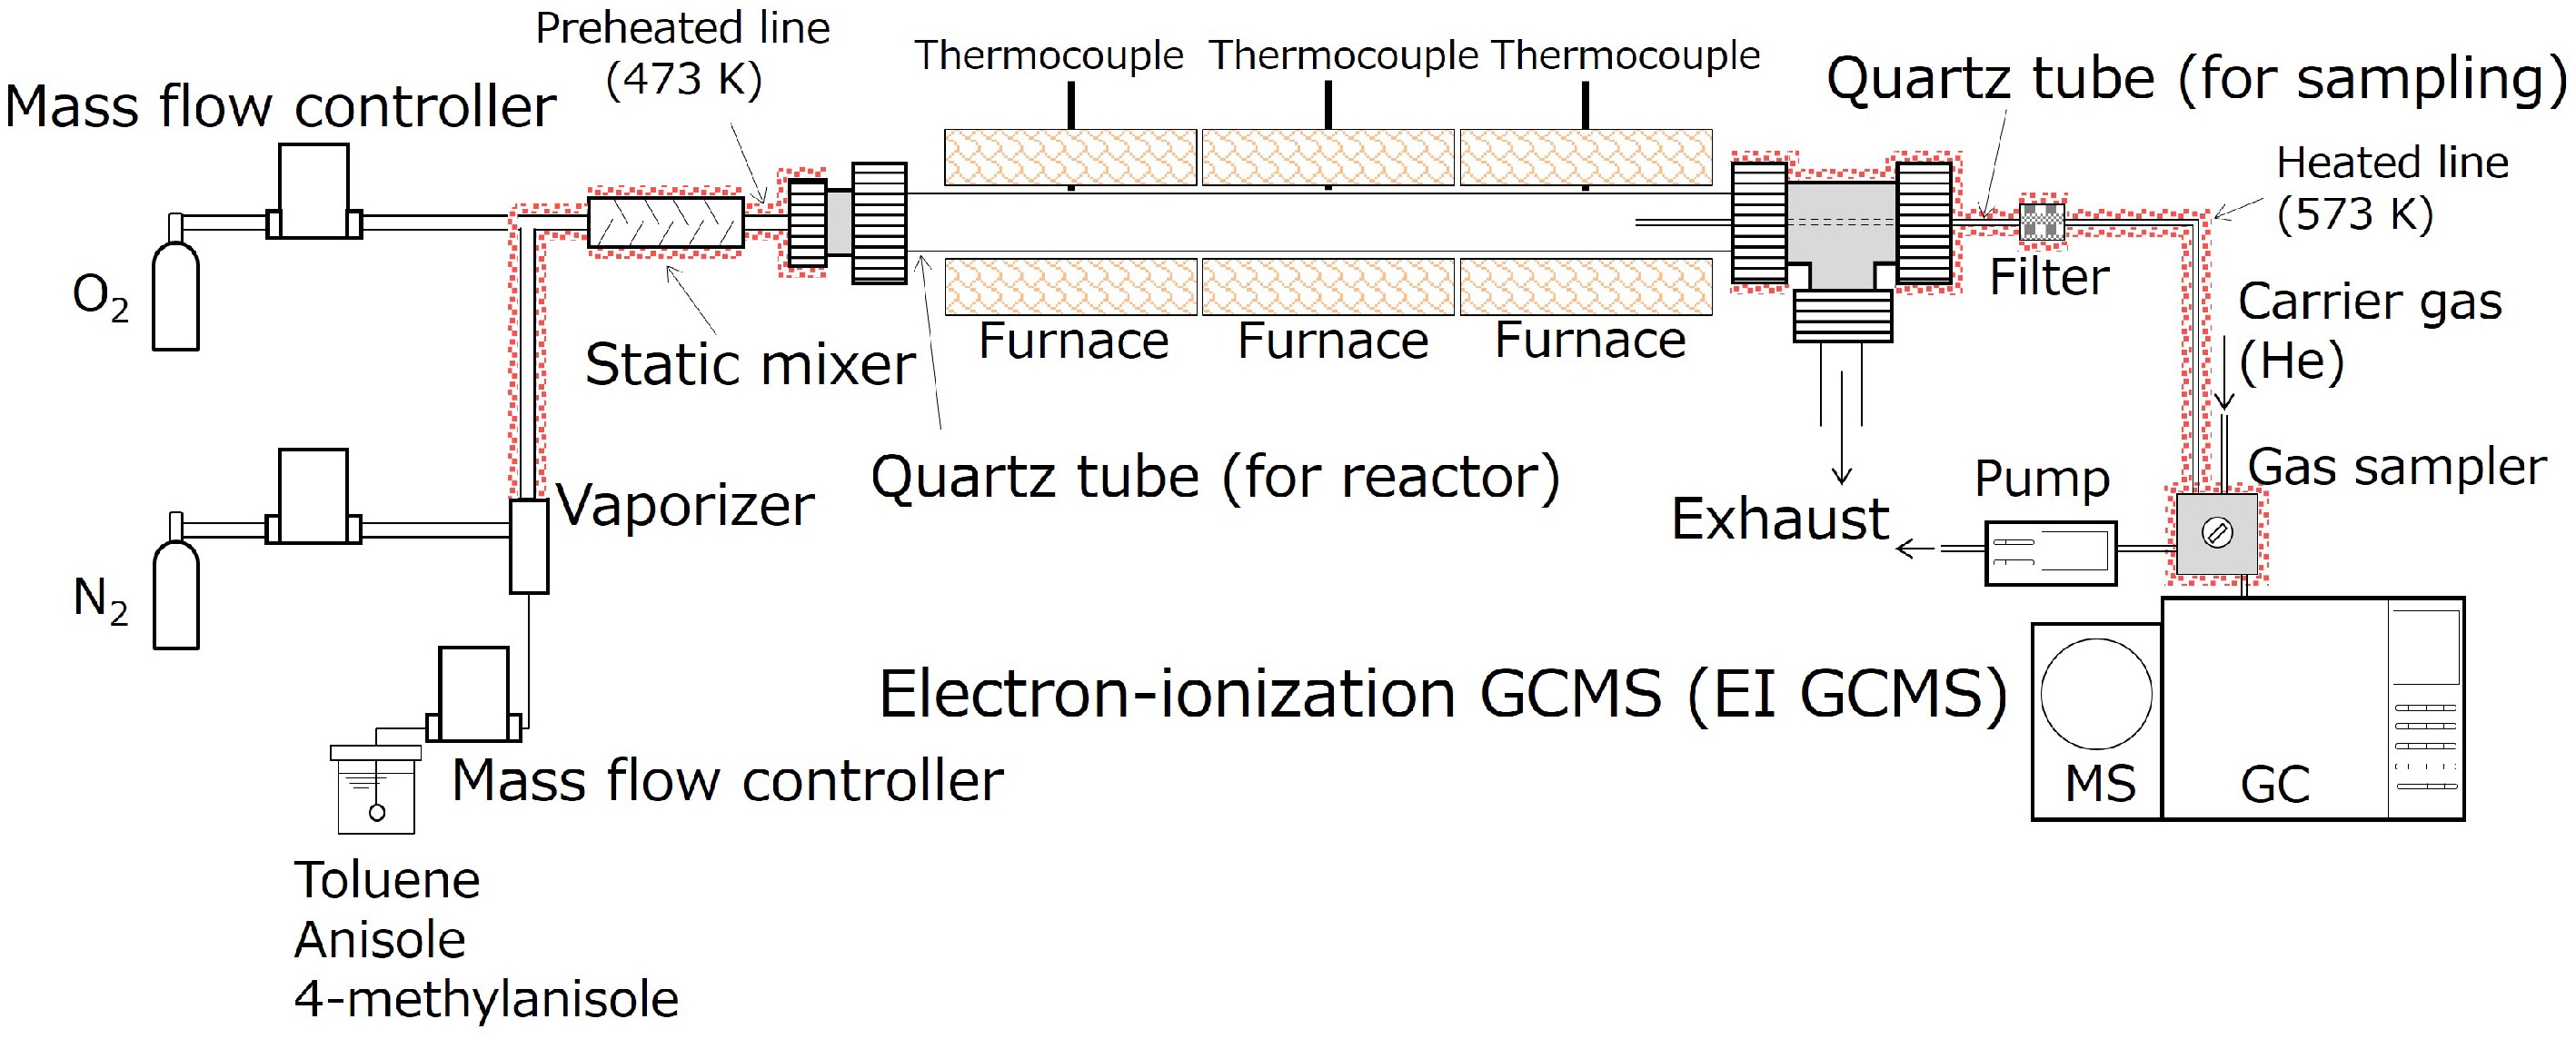
Figure 1.
A schematic diagram of a flow reactor system used for this study.
To prevent condensation and to preheat the feed mixture, the piping line from the vaporizer to the reactor was heated at 473 K. The vaporizer was maintained at specific temperatures depending on the compound: 423 K for toluene, 443 K for anisole, and 463 K for 4-methylanisole. For the toluene experiments, the gaseous temperature was changed between 1,050 and 1,350 K in 100 K intervals. For anisole and 4-methylanisole pyrolysis, the temperature ranged from 800 to 1,350 K in 50 K intervals. The reactor consisted of a quartz tube which had a 10 mm inner diameter and a 1,050 mm length, positioned within three concentric furnaces arranged in series. The combined heating length provided by the arranged furnaces was approximately 900 mm. A portion of the reaction gas was sampled through a narrow quartz tube (1 mm inner diameter), whose tip was placed 100 mm upstream of the outlet of a furnace. Therefore, the effective heating length calculated based on the furnace heating zone and the sampling point was determined to be 800 mm.
The sampled gas was then analyzed using a GC-MS (Shimadzu GCMS-QP2020) via a gas sampler with 500 μL. The sampling line, encompassing a gas sampler, was heated at 573 K to avoid condensation of anthraquinone. A previous study demonstrated that anthraquinone exhibited thermal stability from room temperature to 823 K[20]. Consequently, its decomposition during the introduction of sampled gas at 573 K can be ignored. A capillary column, Rxi-17Sil MS (RESTEK Corporation, stationary phase of 50% phenyl methylpolysiloxane), enabled a separation of the product species. High-purity helium (> 99.99995%) was utilized as the carrier gas. The detailed GC-MS operational conditions, such as the inlet pressure of the carrier gas, setting temperatures of the GC-MS interface, and the temperature program of a GC oven, are stated in our prior study[17]. For identification and calibration of anthraquinone, acetone solutions, which had different concentrations of pure chemical were utilized. Note that the concentration of anthraquinone contained in the sampled gas was quantified in this study, while other PAHs and OPAHs were previously measured[16,19]. The detection limit was approximately 0.01 ppm[17]. The total error of quantified anthraquinone was determined to be 30%, considering potential sources of uncertainty, as detailed previously[17,19]. The experimental data of anthraquinone is available in Supplementary File S1.
Simulation methods
-
A detailed description of a kinetic sub-model development for anthraquinone, including overall modeling approach, and important additions and modifications, is provided in Section 'Newly-developed model'. Please note that the simulation method for a flow reactor and premixed flame is exclusively detailed here.
A flow reactor simulation was conducted using the Plug Flow Reactor module of CHEMKIN-Pro 2021 R1 package[21]. The inlet gas composition, gaseous flow rate at a reactor inlet, pressure, inner diameter, and length of the tubular reactor were set according to the experimental conditions. The measured temperature profiles from our previous studies[17,19] were also employed as input data and are available in the Supplementary File S1. The flow reactor simulation was performed without accounting for the potential heat release from a tubular reactor, because of highly fuel-rich oxidation or pyrolysis conditions.
Premixed flame data used to test the newly-developed anthraquinone model is taken from the literature for an ethylbenzene/ethanol fuel blend with varying ethanol content[12]. Premixed flame simulation was conducted using the Premixed Laminar Burner-Stabilized Flame module of CHEMKIN-Pro 2021 R1 package[21]. Several flame conditions, including inlet gas composition, pressure, inlet mass flow rate, and temperature profiles measured by thermocouples by Therrien et al.[12], were used as input data. These flames were stabilized at their soot onset threshold, and all had similar temperature profiles[12]. Thermal diffusion, namely the 'Soret effect', was taken into account in the simulations. Convergence criteria were adjusted to ensure a grid-independent solution as with a previous study[22].
We performed the rate-of-production (ROP) analysis by means of the present model, to understand the reaction chemistry of anthraquinone, and to illuminate the effect of the difference in fuel structures and conditions, including pyrolysis and oxidation, on the production pathways toward anthraquinone.
Theoretical calculation method
-
There are no theoretical calculations in the literature concerning the formation pathways of anthraquinone. We have no basis for understanding how the combination of small oxygenated aromatic radicals leads to the formation of an OPAH such as anthraquinone. Therefore, a representative pathway of this mechanism (detailed in Section 'Newly-developed model') was investigated by calculating its potential energy surface and kinetic data using the method described here. This foundation then led us to consider more combinations within this mechanism. Similarly, the growth reactions of small quinones leading to the formation of anthraquinone were calculated theoretically for the first time in order to complement the kinetic model. Geometry optimizations of all reactants, products, and transition states (TS) were carried out using the CAM-B3LYP[23], which combines the hybrid qualities of B3LYP and the long-range correction formulated by Tawada et al.[24] in conjunction with the 6-311+G (2d,p) basis set[25]. The vibrational frequencies and the zero-point energies (ZPE) were calculated at the same level of theory and corrected by a suitable scaling factor of 0.953[26] to compensate for the effects of anharmonicity. This computational approach was adopted following a benchmark study reported previously[27], where we have found a better agreement between the calculated values and their experimental (or literature) counterparts for the vibrational frequencies and some thermodynamic properties, together with accurate identification of transition states for representative OPAHs and their radical intermediates[28,29]. In the present work, the CBS-Q/CAM-B3LYP/6-311+G (2d,p) method was assessed by comparison with the CCSD(T)-F12/CBS reference method employed in the previous work[27], where the barrier heights and reaction energies for the hydrogen abstraction reactions of benzofuran and dibenzofuran were studied. The results, presented in Supplementary Table S2, reveal deviations of less than 2 kcal/mol, with mean square deviations of 0.709 kcal/mol for E0 and 1.049 kcal/mol for ΔrH°298 K, which is considered acceptable. It is noteworthy that the reference method[27] entails a significant computational expense, while our approach achieves a similar level of accuracy with greater efficiency, especially for large, heavy-atom systems. As a result, this method is relevant for studying the formation of anthraquinone in the present study. Subsequently, the intrinsic reaction coordinate calculations (IRC)[30] were performed for all studied reactions to ensure the correct linkage between each transition state and its associated molecular complexes. The stability of the wave function[31] was evaluated by examining the mono-configurational nature of the ground states for all studied species, including reactants, transition states, and products. This is supported by T1 diagnostic values, which are significantly low, remaining below 0.02 for the molecules and below 0.04 for the radicals in the analyzed reactions. All computations were performed with Gaussian16 (A.03)[32].
Additional single-point energies calculations were carried out using the modified CBS-QB3 composite method (denoted CBS-Q')[33,34] that preserves the original energy calculation sequence while introducing changes exclusively in the geometry optimization and the frequency calculation part.
High-pressure limit rate constants were calculated within the framework of the canonical transition state theory (TST)[35] in conjunction with statistical thermodynamics to evaluate the partition functions, as expressed below:
$ {k}_{\infty }\left(T\right)=\kappa \sigma \dfrac{{k}_{B}T}{h}\dfrac{{Q}_{TS}(T)}{{Q}_{R}(T)}exp\left(-\dfrac{{E}_{0}}{RT}\right) $ (1) In the above equation, 'κ' denotes the transmission coefficient, which is computed from the one-dimensional asymmetric Eckart potential[36]. 'σ' represents the statistical factor, accounting for external symmetries and optical isomers of the reactants as well as the TS. 'kB' is Boltzmann's constant, 'h' is Planck's constant, 'T' is the temperature, and 'E0' refers to the electronic energy barrier height without including the vibrational partition function (ZPE). 'QTS(T)' and 'QR(T)' denote the total partition functions of the transition state and the reactants, respectively.
Lastly, we fitted rate coefficients from Eq. (2) over the temperature range 500−2,000 K to a three-parameter Arrhenius expression:
$ {k}_{\infty }(T)=A{T}^{n}exp\left(-\dfrac{{E}_{a}}{RT}\right) $ (2) To achieve greater accuracy, the low-frequency modes of vibration corresponding to internal rotation were treated as hindered rotor using the 1-DHR-U method[37] rather than as a harmonic oscillator. The calculation of the kinetic parameters, following this methodology, was carried out using the ThermRot software[38]. This software makes it possible to easily retrieve the relevant data from the Gaussian calculation files, as well as to calculate the kinetic parameters. This software was also used to convert the calculated thermodynamic data (from atomization reactions, including the spin-splitting correction for the reference atoms C, H, O) into the form of NASA polynomials.
-
The resulting model is described in this section. In this study, a recently published kinetic model[19] was employed as a base model, as it includes not only the low to high temperature oxidative and pyrolyzed reactions of several hydrocarbons, such as toluene, ethylbenzene, ethanol, anisole, and 4-methylanisole, but also PAH growth reactions up to pentacyclic structures. This base model consists of 1,741 species and 9,973 reactions. The C0−C4 chemistry in the base mechanism was based on AramcoMech 2.0[39], and then hierarchically developed using a similar set of reaction pathways and reaction rate rules to reproduce global combustion characteristics of methylated aromatics, such as ignition delay times at low to high temperatures, and flame velocities[40]. Subsequently, through the incorporation of molecular growth reactions for monoaromatic hydrocarbons and PAHs, the base model was validated against speciation data, including small hydrocarbons and PAHs formed in the jet-stirred reactor pyrolysis of gasoline surrogates[41] and in the fuel-rich oxidation of ethylene, n-decane, and toluene[16,42], or pyrolysis of anisole and 4-methylanisole in a flow reactor[19]. Additionally, the base model exhibited a high degree of agreement with the measured results for OPAHs, such as furans and alcohols, which were produced in the pyrolysis of anisole and 4-methylanisole[19] and in the fuel-rich oxidation of ethylene, n-decane, and toluene[16]. The OPAH reaction mechanism was built based on several experimental and theoretical works, as well as the reaction rate rules of simpler species, as detailed previously[16]. As the sub-model involving 4-methylanisole was originally absent, it was incorporated in this latest work[19]. In order to accurately predict anthraquinone production, 49 species and 288 reactions were newly added into the base mechanism. The developed anthraquinone sub-mechanism is detailed in the following section. The integrated mechanism files are available in Supplementary File S2.
Sub-model of anthraquinone
-
For the construction of the anthraquinone sub-model, four potential pathways were listed, as presented in Fig. 2: (1) the combination reactions of small oxygenated aromatic species; (2) Hydrogen-Abstraction-Carbon-Addition (HACA) growth reaction from small quinones; (3) oxidation reactions of PAHs; and (4) oxidation of soot. Among these four mechanisms, the first three are gas-phase reactions, while the last one involves heterogeneous reactions. In the fourth pathway, once soot particles are generated via the nucleation of PAHs, the reactions between oxygenated species (such as O2, OH, and O) and PAHs present on soot particles, take place, which could result in OPAH production[43]. Subsequently, through desorption of OPAHs from soot surfaces, gaseous OPAHs can be produced. However, this process is still a subject that requires more experimental and theoretical supports. Furthermore, while the base model employed for this study incorporates PAH growth reactions up to pentacyclic structures, it lacks both soot growth reactions and surface oxidation reactions that would lead to the formation of OPAHs. Consequently, the fourth pathway was excluded, and the initial three mechanisms were considered for modeling. Under the conditions used to test the anthraquinone sub-model, soot formation is quite limited, therefore the influence of this exclusion could be minimized to a first approximation. These mechanisms are outlined in the following paragraphs, and all the added reactions pertaining to anthraquinone formation and consumption are provided in Supplementary Table S3. Additionally, the names, nomenclature in the model, and chemical structures of important species stated below are summarized in Supplementary Table S4.
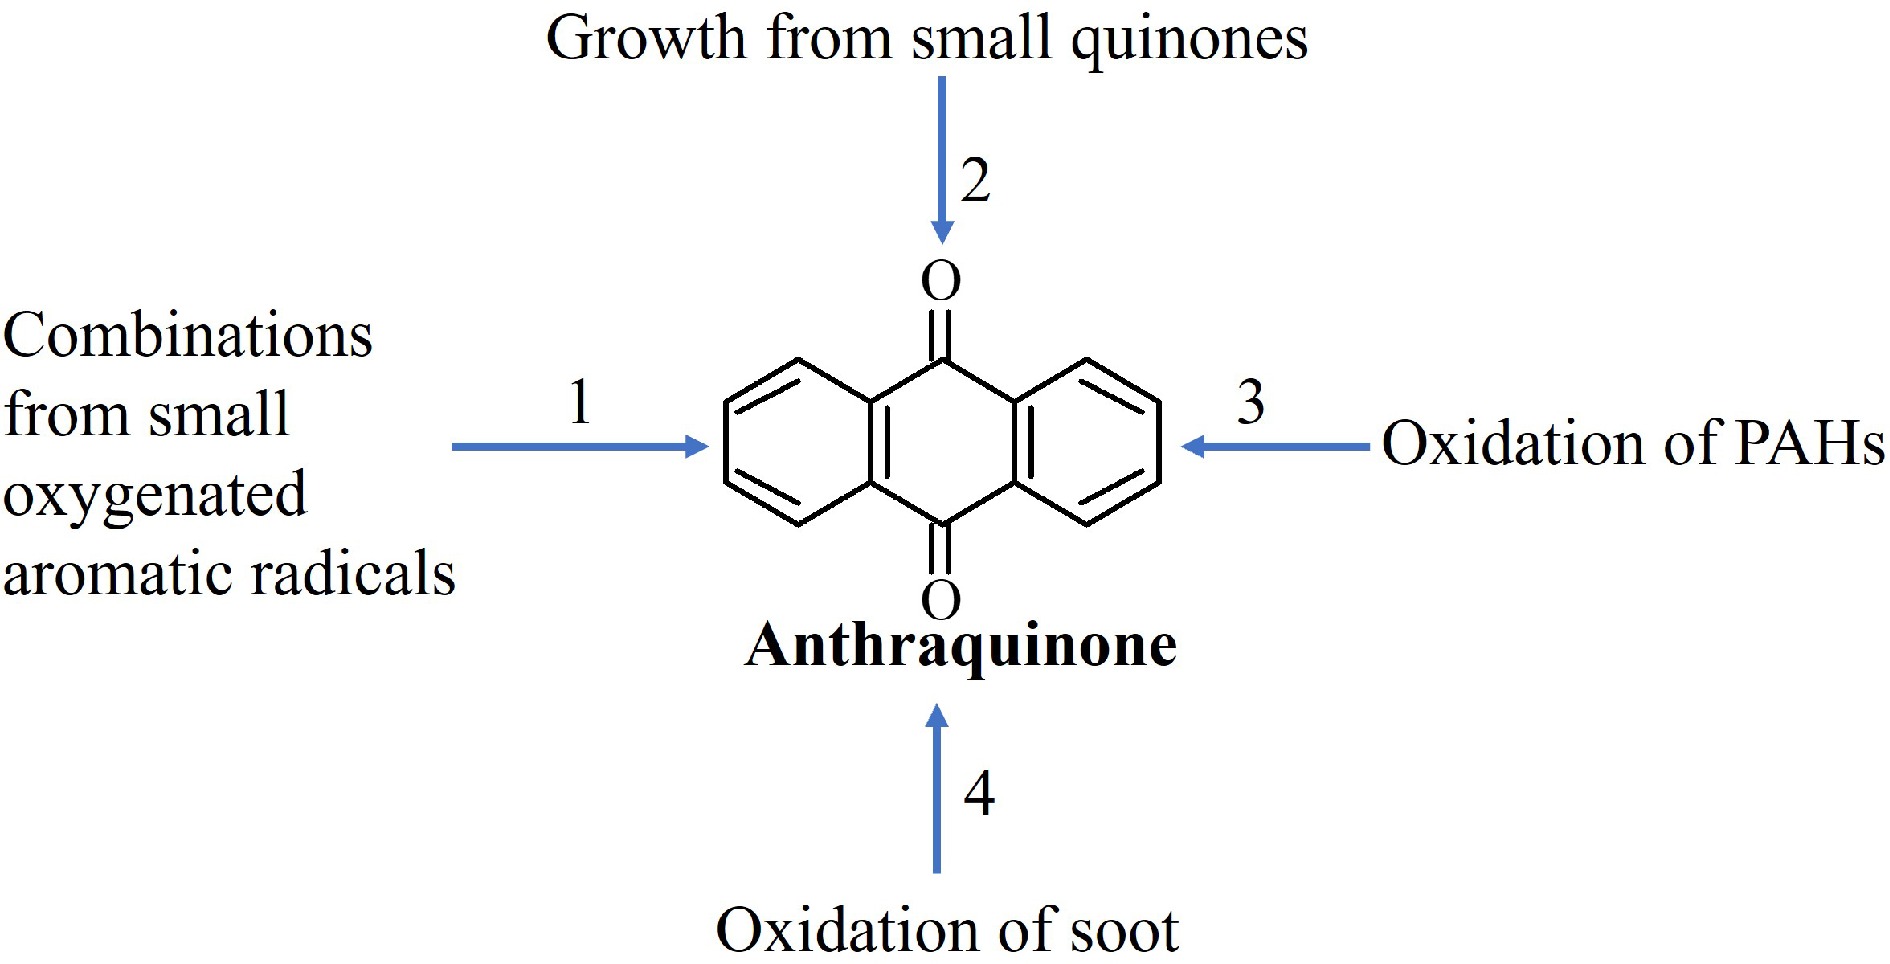
Figure 2.
Possible mechanisms for the formation of anthraquinone (9,10-anthraquinone).
The combination reactions of small oxygenated aromatic species could be initiated by benzaldehyde (C6H5CHO) and its derivative radicals (C6H4CHO and C6H5CO), leading to the formation of 2-benzoylbenzaldehyde (A1CHO-CO-A1). Subsequently, this molecule undergoes hydrogen abstraction reactions and cyclization, followed by hydrogen elimination, resulting in the production of anthraquinone (ANTHRQNONE). In this study, benzaldehyde and its derivative radicals were identified as promising precursors of anthraquinone. Benzaldehyde is readily produced in toluene oxidation[40] and anisole pyrolysis[44], and it possesses a formyl group that is structurally similar to the ketone group. The rate constants for the combination and H-abstraction of 2-benzoylbenzaldehyde were estimated by analogy with similar structures, e.g., phenyl and benzaldehyde, which are contained in the base model. Conversely, the rate parameters for the pathways from 2-benzoylbenzoyl radical (A1CO-CO-A1) to anthraquinone were theoretically calculated, as detailed in Section 'Theoretical results on selected pathways'. When 4-methylanisole is utilized as fuel, a similar reaction pathway to that stated above, which is initiated by the combination of methylbenzaldehyde (CH3C6H4CHO) and formyl methylphenyl radical (CH3C6H3CHO), as an example, is considered, eventually leading to the formation of methylanthraquinone (CH3ATQ910) and dimethylanthraquinone (CH3ATQ910CH3). The ipso-displacement reaction of H results in the release of CH3, leading to the production of anthraquinone from these species. The rate constants of the ipso-displacement reaction were estimated based on the analogous reaction from toluene + H[45].
As for the HACA mechanism from small quinone, p-naphthoquinone (1,4-naphthoquinone, P-OA2O) was considered as the starting molecule. Subsequent to H-abstraction reactions of p-naphthoquinone, a sequence of acetylene addition, cyclization, and hydrogen removal occurs to produce anthraquinone. The rate coefficients for these reactions were theoretically calculated and described in detail in Section 'Theoretical results on selected pathways'. In addition to the conventional HACA pathway, a radical/π-bond addition reaction involving p-naphthoquinone + o-benzyne (C-C6H4) to produce anthraquinone and acetylene was incorporated in an analogy with benzene + o-benzyne[46].
It was also hypothesized that anthracene would be the starting species for the oxidation pathway of PAH, leading to anthraquinone. This pathway was mainly described with reference to the formation pathways of benzoquinone and naphthoquinone contained in the present model, due to an analogous nature with anthraquinone. Depending on the C−H position, anthracenyl radicals have three isomers (RANTHRACENE1, RANTHRACENE2, and RANTHRACENE3). However, anthracenyl radical (RANTHRACENE1) and its oxidative radical, anthracenoxy radical (ANTHRACENEOJ1), were selected as precursors of anthraquinone due to the central location of the unpaired electron in the anthracene molecule. Following the formation of the anthracenyl radical (RANTHRACENE1) through H-abstraction reactions of anthracene, the subsequent direct production of anthraquinone occurs through a reaction between RANTHRACENE1 and O2, accompanied by hydrogen elimination. The rate constants of this reaction were derived from the formation of benzoquinone from phenyl and O2[47]. In addition to this simple reaction, we incorporated the reaction pathways involving anthrone (ANTHRONE), 1,8-dehydroxy-9-anthron (DHY18ANTHRON), anthracenol (ANTHRACENOL), and others. Anthrone and 1,8-dehydroxy-9-anthron are both produced from anthracene + O, which is an analogous reaction to the formation of 2,5-cyclohexadienone and 2,4-cyclohexadienone from benzene + O. Both anthrone and 1,8-dehydroxy-9-anthron undergo H-abstraction reactions to produce anthracenoxy radical (ANTHRACENEOJ1). The isomerization reaction between 1,8-dehydroxy-9-anthron and anthracenol was added by referring to the similar reaction between 2,4-cyclohexadienone and phenol. Anthracenol is also formed from anthracene, such as anthracene + O, and is consumed by H-abstraction of hydroxyl groups to produce anthracenoxy radicals. Simultaneously, anthracenol undergoes H-abstraction reactions for benzene ring to form 10-hydroxyanthracen-9-yl radical (RANTHRACENOL). The rate constants of these H-abstraction reactions were based on the reactions involving phenol and benzene, as included in the current model. The 10-hydroxyanthracen-9-yl radical further reacts with O2, eventually resulting in anthraquinone production. This pathway was based on p-benzoquinone formation in the present model. It is reasonable to hypothesize that anthraquinone production would be influenced by anthracene formation. Our previous paper showed that the simulated anthracene production was lower than that of the experiments[16]. In order to improve this situation, recent theoretical results on the combination of benzyl (C6H5CH2) and methylphenyl (C6H4CH3) radicals leading to anthracene formation via benzyltoluene (O-BNZYLTOLN) and dihydroanthracene (DHYANTHRACENE)[48] have been employed in the present model. The effectiveness of this reaction pathway for anthracene production, particularly in the case of toluene fuel, is already demonstrated[48].
Besides the formation reactions of anthraquinone, its consumption reactions were incorporated. However, due to inadequate knowledge and findings regarding the promising anthraquinone consumption pathways, they were incorporated as global reactions. It was hypothesized that after a hydrogen atom from the benzene ring of anthraquinone was extracted by H or OH, unimolecular decomposition would predominate, resulting in the production of CO and small hydrocarbons. Consequently, the rate parameters for anthraquinone consumption were taken from H-abstraction reactions of benzene.
The thermodynamic properties of several newly added species that were correlated with the combination and HACA mechanism were theoretically calculated, as stated in Section 'Theoretical calculation method'. Conversely, those of other species were obtained from the group additivity method, implemented in a Reaction Mechanism Generator (RMG), a freely available software developed by MIT group[49,50]. The transport data of new species, which is necessary for the flame simulations, was estimated through the application of the correlation method proposed by Wang and Frenklach[51]. This method utilizes the observation that Lennard-Jones collision diameter, and potential well depth exhibit a strong correlation with molecular weight. The rationale for employing this estimation method is detailed in a previous paper[52].
Theoretical results on selected pathways
-
Ideally, a comprehensive theoretical study of all the reaction pathways in Fig. 2 with full potential energy surface (PES) analyses would be desirable. However, this would require a longer-term project due to their complexity and the lack of prior theoretical foundations for anthraquinone and its related radicals. Therefore, as a first step in this topic, this work aims to study only the selected reaction pathways in mechanisms 1 and 2 in Fig. 2, for which an estimation for mechanism and rates becomes challenging. This approach allows us to complete the sub-model of this molecule as much as possible in order to have a first view on the formation of anthraquinone, which will then guide future calculations and research on the formation kinetics of this OPAH.
Regarding mechanism 1, Fig. 3 presents several possibilities of combination of small aromatics leading to the formation of anthraquinone, as already mentioned earlier. These routes pass through the formation of 2-benzoylbenzaldehyde. The formation of this molecule is supported by the theoretical investigation via a potential energy surface (PES) for benzaldehyde and benzoyl combination, where the 2-benzoylbenzaldehyde formation route has the lowest energy barrier (30.9 kcal/mol)—see the full PES in Supplementary Fig. S1. Other paths from the benzaldehyde and benzoyl combination have a much higher energy barriers (49.0 kcal/mol and 62.7 kcal/mol, respectively). It should be noted that due to the complexity of the calculated system, only the full PES of this first combination was studied. Those of the other two are considered as perspectives when their importance is identified. This identification is also one of the objectives of the present study. As displayed in Fig. 3, benzaldehyde can combine with its radicals, benzoyl or 2-formylphenyl, to form 2-benzoylbenzaldehyde. The combination of benzoyl and 2-formylphenyl radicals could also lead to the formation of 2-benzoylbenzaldehyde. This species, in turn, reacts through H-abstractions to form the 2-benzoylbenzoyl radical, then recyclization to form the 9,10-anthraquinonyl radical, and finally by a C–H β-scission leading to the formation of anthraquinone. The barrier energies of these two latter reactions were calculated to be 20.1 kcal/mol and 24.2 kcal/mol, respectively. The rate coefficients were accordingly calculated for the first time and reported in Fig. 3. As a first approximation, the rate coefficient calculations were performed only at the high-pressure limit. The thermodynamic properties of the derived species were accordingly calculated and incorporated into the model. The standard formation enthalpies (ΔfH°298 K) of anthraquinone are calculated to be −18.11 kcal/mol, which is in close agreement with the value reported by NIST (−18.08 ± 0.69 kcal/mol)[15]. The calculated rate coefficients of other reactions are available in Supplementary Fig. S1.
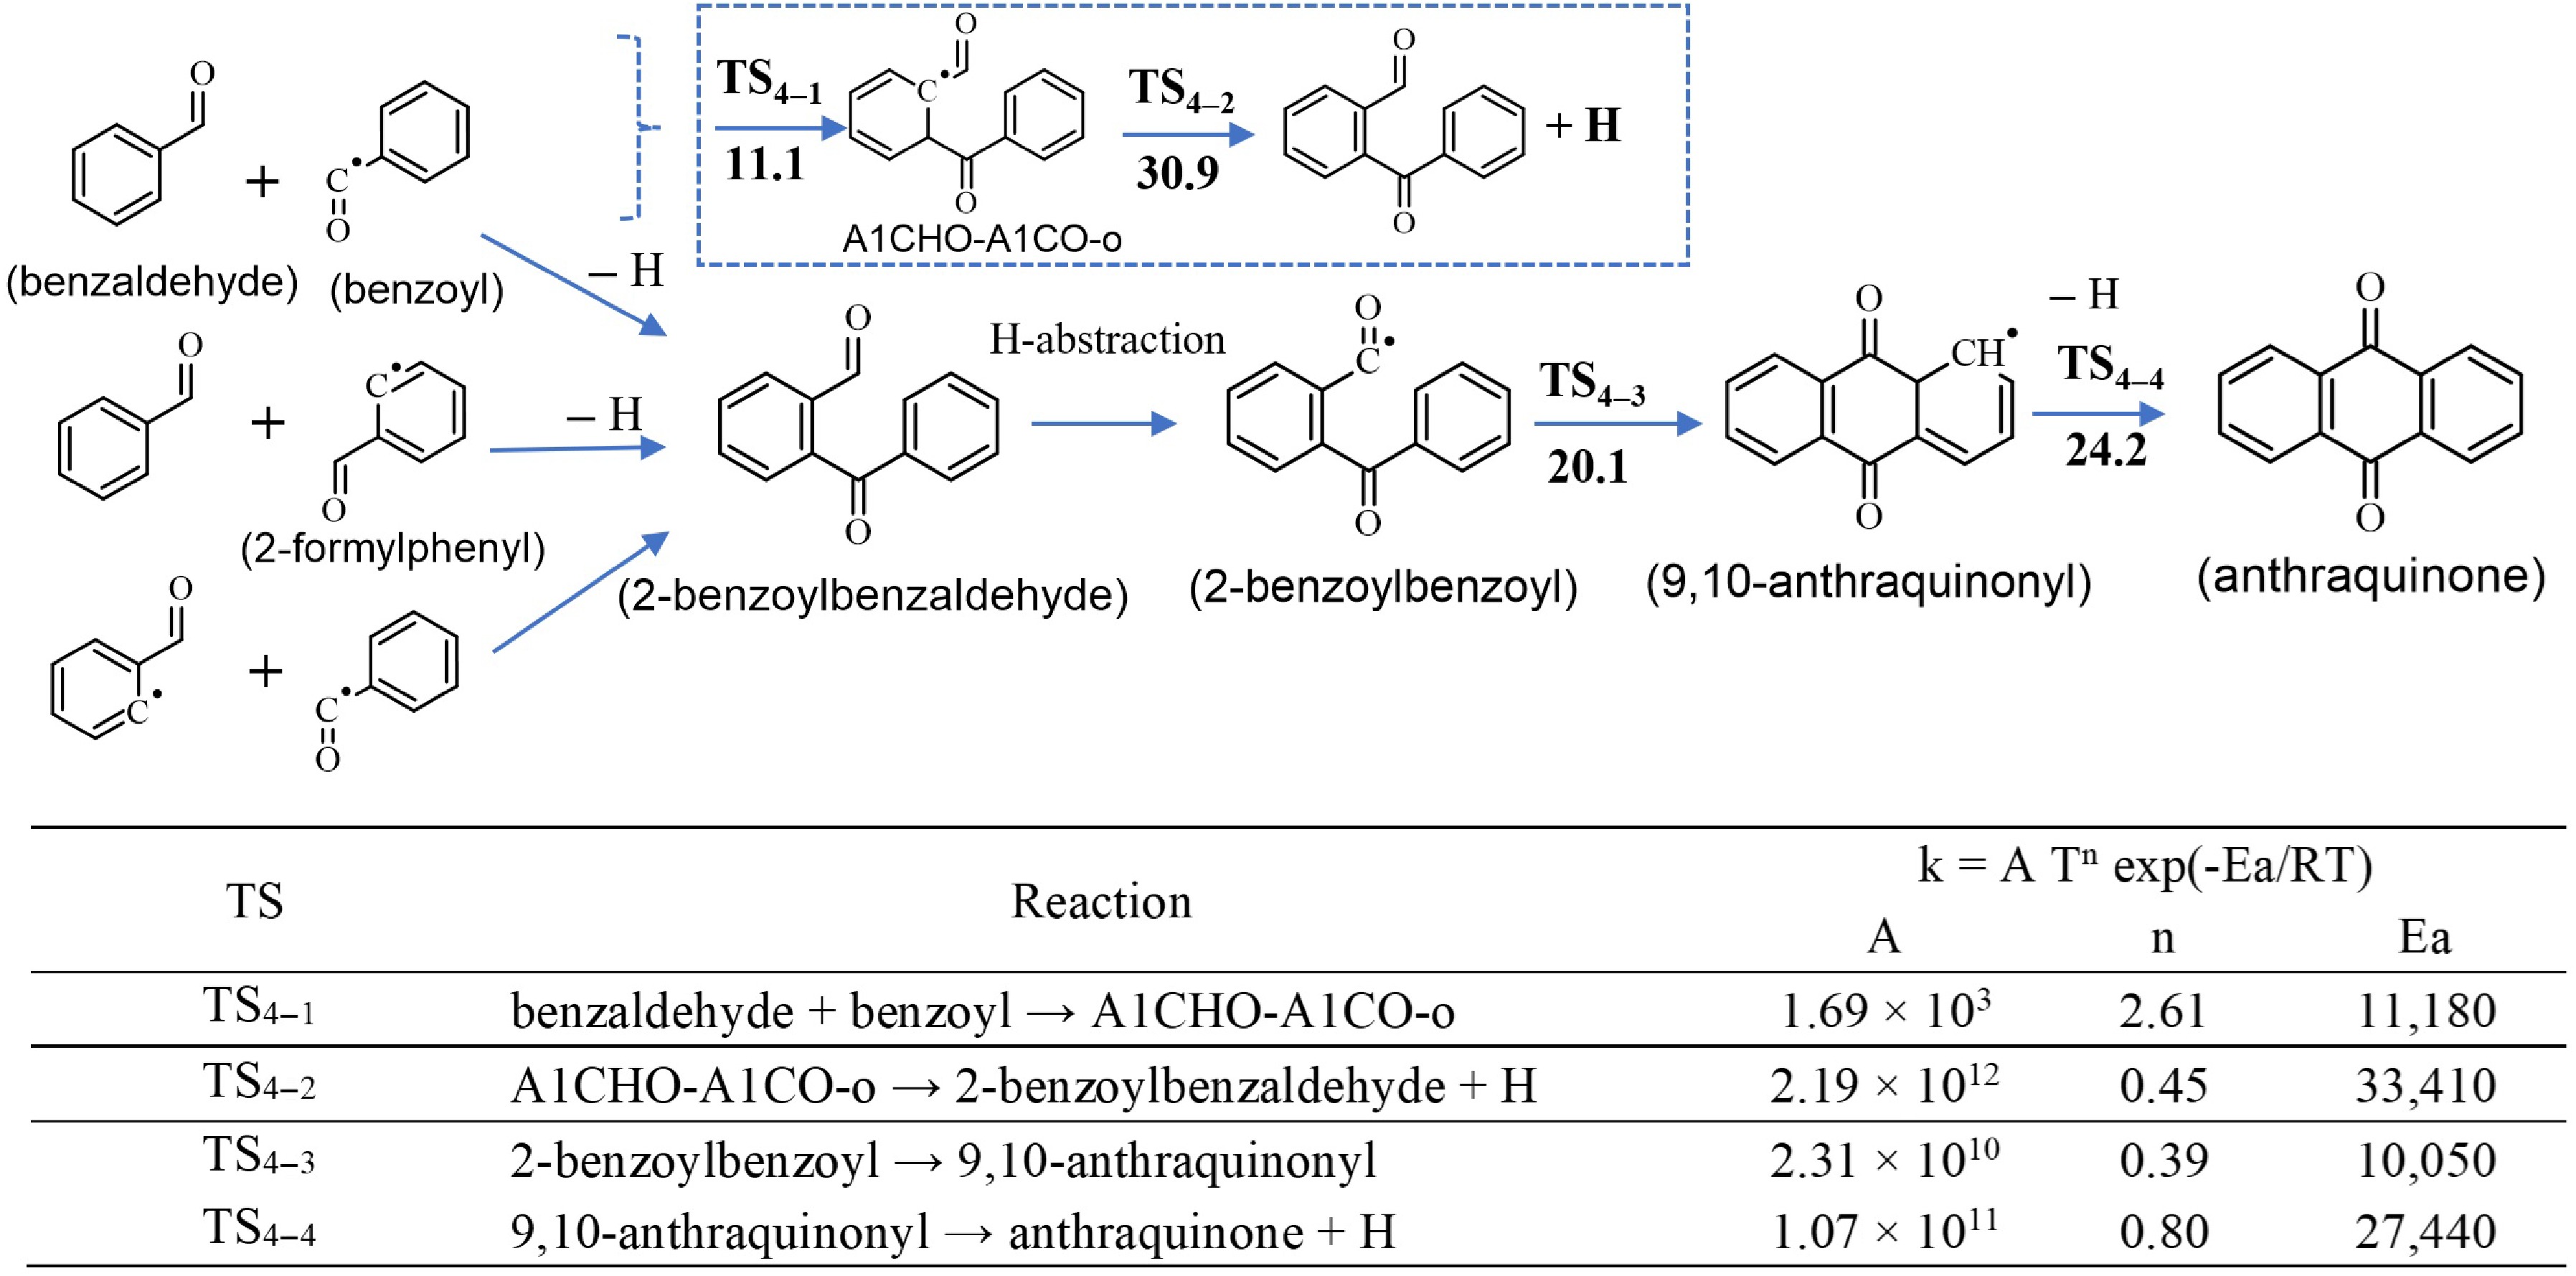
Figure 3.
Top panel: Combination of small oxygenated species leading to the formation of anthraquinone. Barrier heights (in kcal/mol) at 0 K calculated at the CBS-Q/CAM-B3LYP/6-311+ G(2d,p) level of theory, including ZPE. Bottom panel: The corresponding calculated rate constants (k) for a temperature range of 500 to 2,000 K computed at CBS-Q/CAM-B3LYP/6-311+G(2d,p) level of theory. Units are in cm, mol, s and cal. Notes: (1) the combination of benzaldehyde and benzoyl (first reaction) is a two-step reaction (illustrated in inserted box); full PES is available in Supplementary Fig. S1. (2) The rate constants of the second and third combination routes, as well as H-abstractions were not calculated in this work, but determined by analogy with structurally similar species as described in Section 'Sub-model of anthraquinone'.
Regarding mechanism 2, Fig. 4 presents this mechanism starting from p-naphthoquinone at the site where the C–H bond dissociation energies are lowest. It should be noted that only this pathway, relevant for the formation of anthraquinone, has been explored; H abstractions at other sites and their subsequent reactions were not included. After H-abstractions, the pNPhQH3 radical is formed, then C2H2 can add to it, to form the pNPhQH3-C2H2 radical. This radical isomerizes by H-transfer followed by a second C2H2 addition, then ring closure and a C–H β-scission leads to the formation of anthraquinone. The barrier energies of these steps were calculated. The rate coefficients were accordingly calculated for the first time for these species and reported in Fig. 4. A similar mechanism was calculated by Chu et al.[53] for PAHs, the growth from naphthalene to anthracene, and its barrier heights are summarized in Supplementary Fig. S2. Comparing Fig. 4 and Supplementary Fig. S2, it is observed that the barrier heights of C2H2 additions are in a similar range between p-naphthoquinone and naphthalene systems (1.6−2.7 kcal/mol for the first addition; 3.6−3.9 kcal/mol for the second addition). The barrier height of the other reactions (isomerization [TS3−17], cyclization [TS3−19], and C–H bond scission [TS3−20]) are different between the two systems. p-Naphthoquinone could be formed via different pathways, for example the oxidation of naphthalene or the growth from smaller quinones like 1,4-benzoquinone (p-benzoquinone). The latter route was also theoretically investigated in the present study, and the calculated kinetic data was incorporated into the model. Its PES and corresponding rate coefficients are presented in Supplementary Fig. S3, which is very similar to the mechanism presented in Fig. 4. We studied whether the 'Diels-Alder' reaction involving p-naphthoquinone and 1,3-butadiene using estimated rate coefficients from RMG, which leads to the production of anthraquinone, was effective. It was found that this reaction had a negligible impact on the mole fraction of anthraquinone. Consequently, this reaction is not included in the present model to avoid additional complexity and uncertainty in the model, but a detailed investigation should be performed in the future.
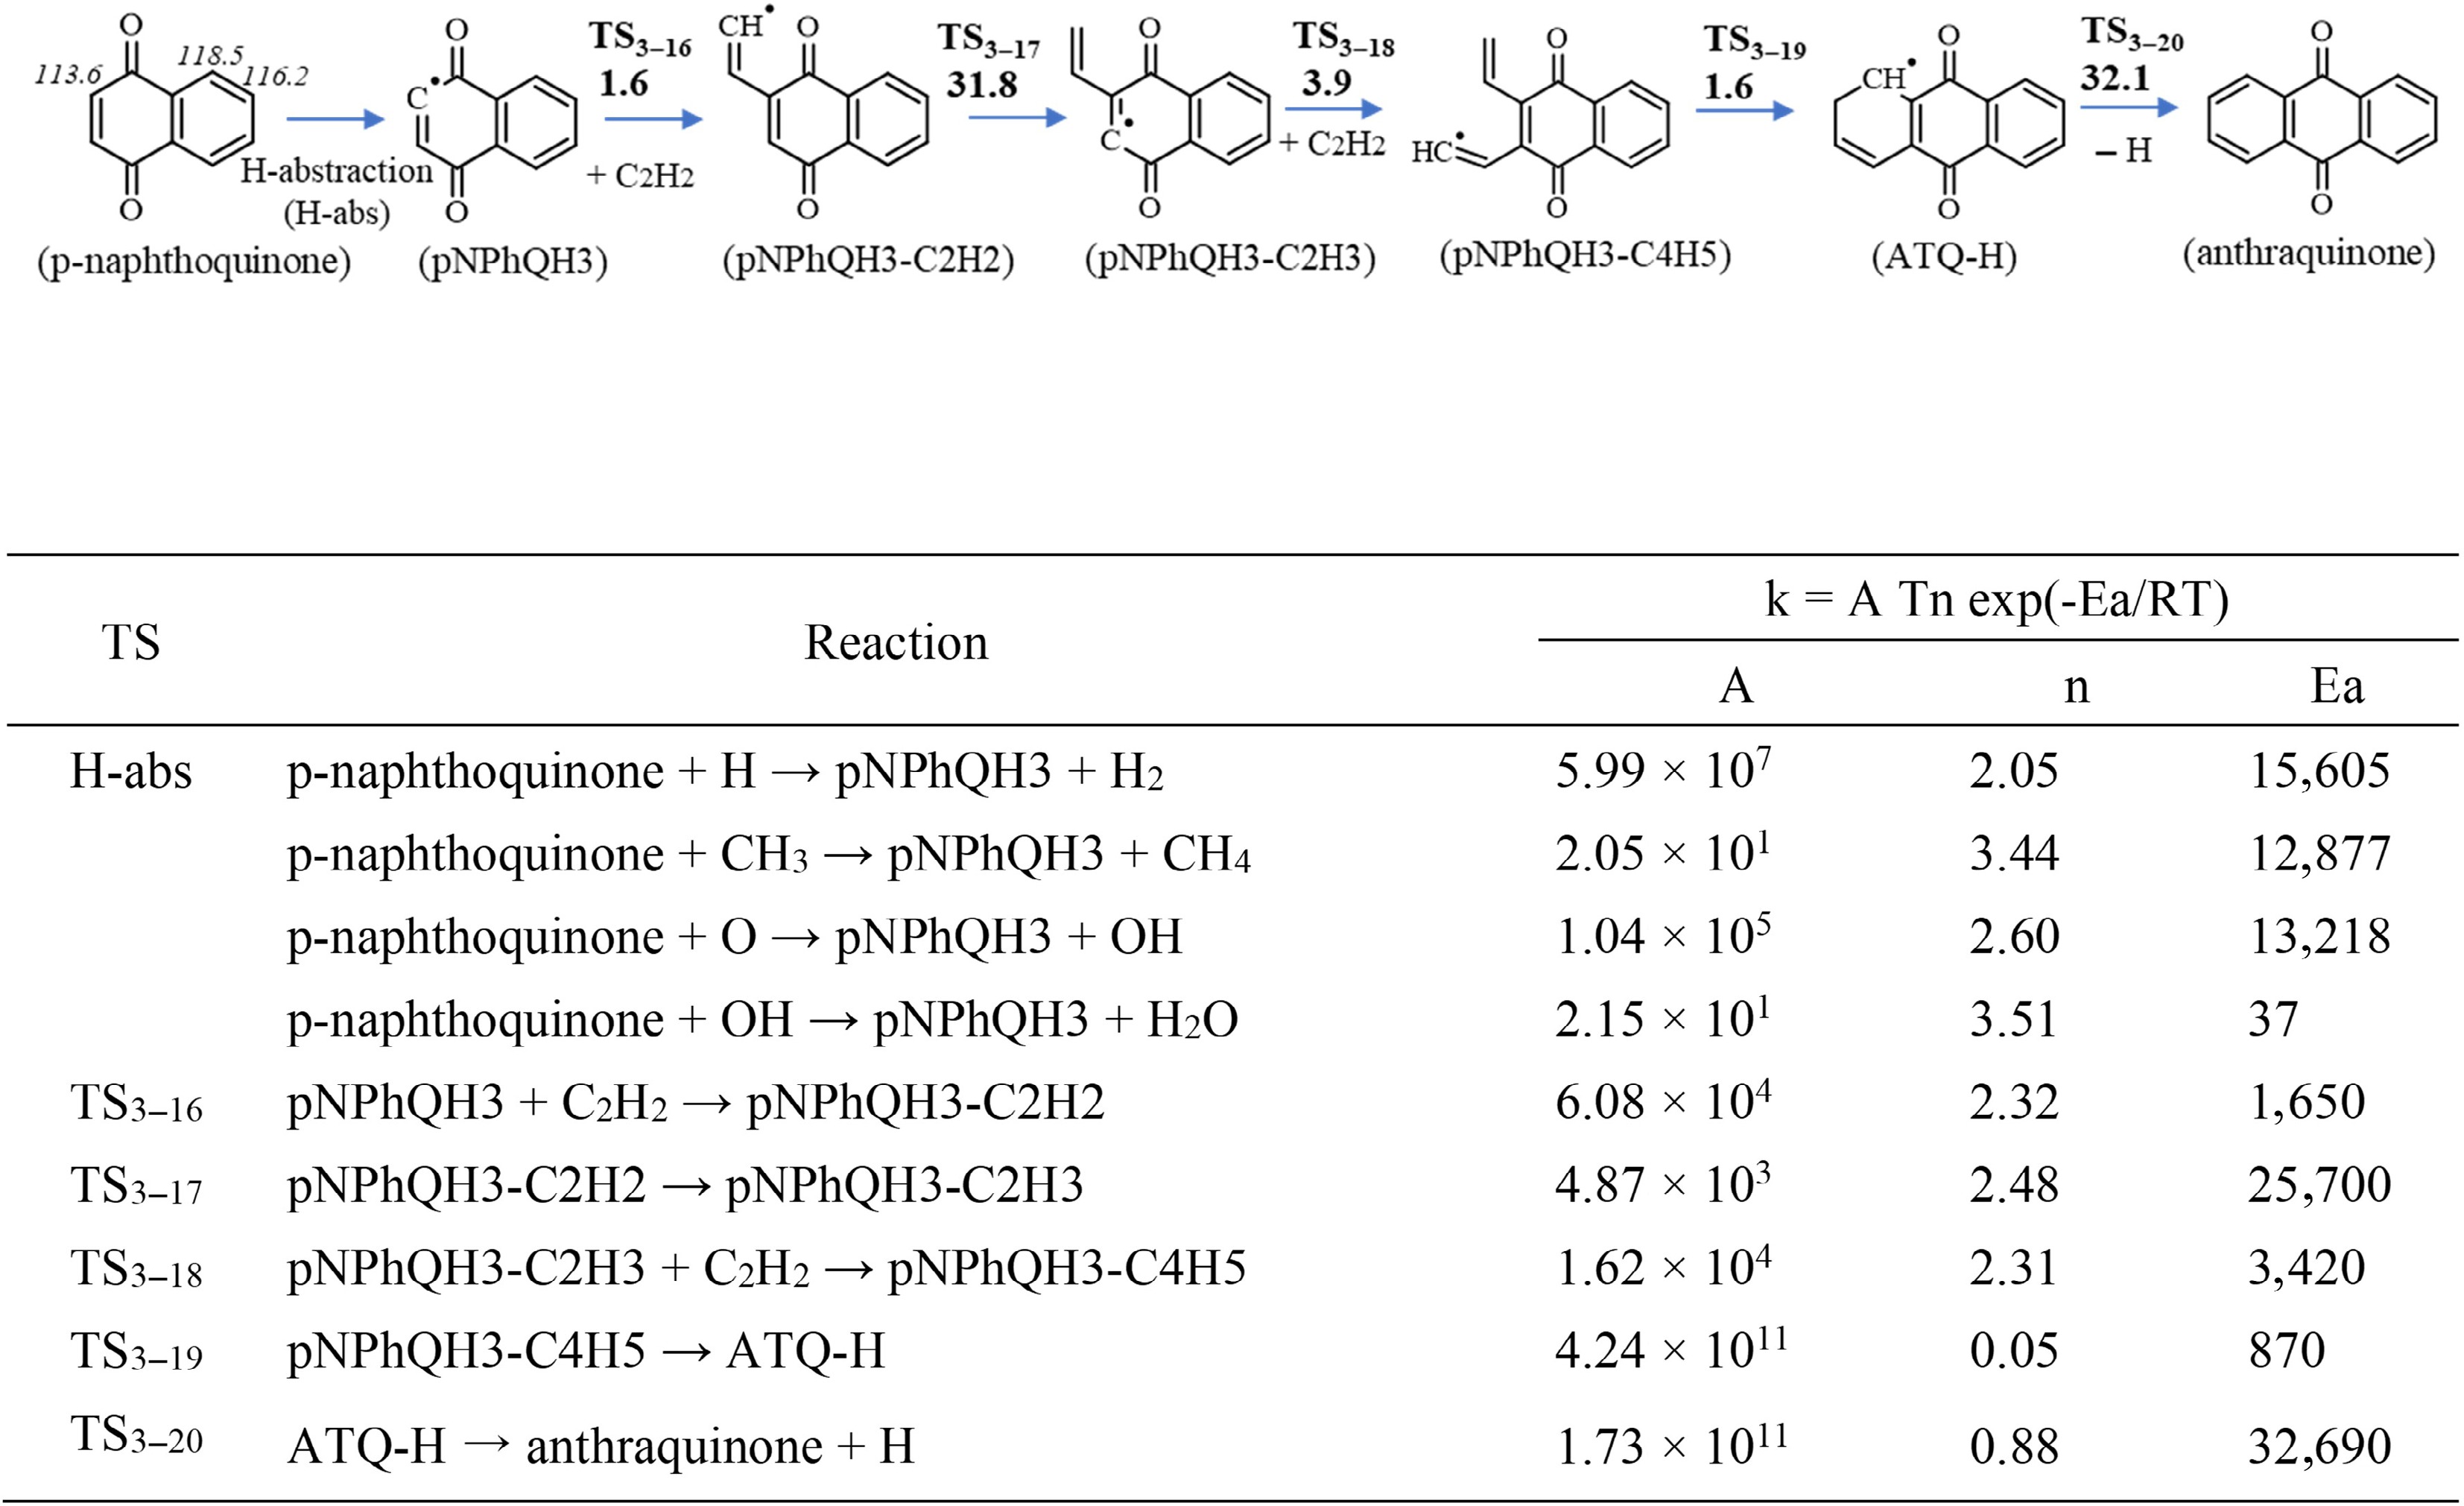
Figure 4.
Top panel: The growth from p-naphthoquinone to anthraquinone via C2H2 addition. Barrier heights (in kcal/mol) at 0 K calculated at the CBS-Q/CAM-B3LYP/6-311+ G(2d,p) level of theory, including ZPE. The numbers in italics are the C–H bond dissociation energies (in kcal/mol) at the corresponding sites of p-naphthoquinone, determined in this work. Bottom panel: The corresponding rate constants (k) for a temperatures range of 500 to 2,000 K computed at CBS-Q/CAM-B3LYP/6-311+G(2d,p) level of theory. Units are in cm, mol, s, and cal.
Experimental results and comparison to model prediction
-
As stated in the experimental section, the flow reactor experimental data for the fuel-rich oxidation of toluene and the pyrolysis of anisole and 4-methylanisole, was newly obtained. Conversely, the premixed flame data of ethylbenzene/ethanol blend is from the literature[12]. Firstly, we compared the measured and simulated results of the fuel and selected aromatics in a flow reactor experiment as illustrated in Fig. 5, showing that the present model can accurately predict the experimental trend. Note that phenanthrene is abundantly produced in the flow reactor experiments, in addition to anthracene. However, it is not shown here due to its weak correlation with anthraquinone formation.
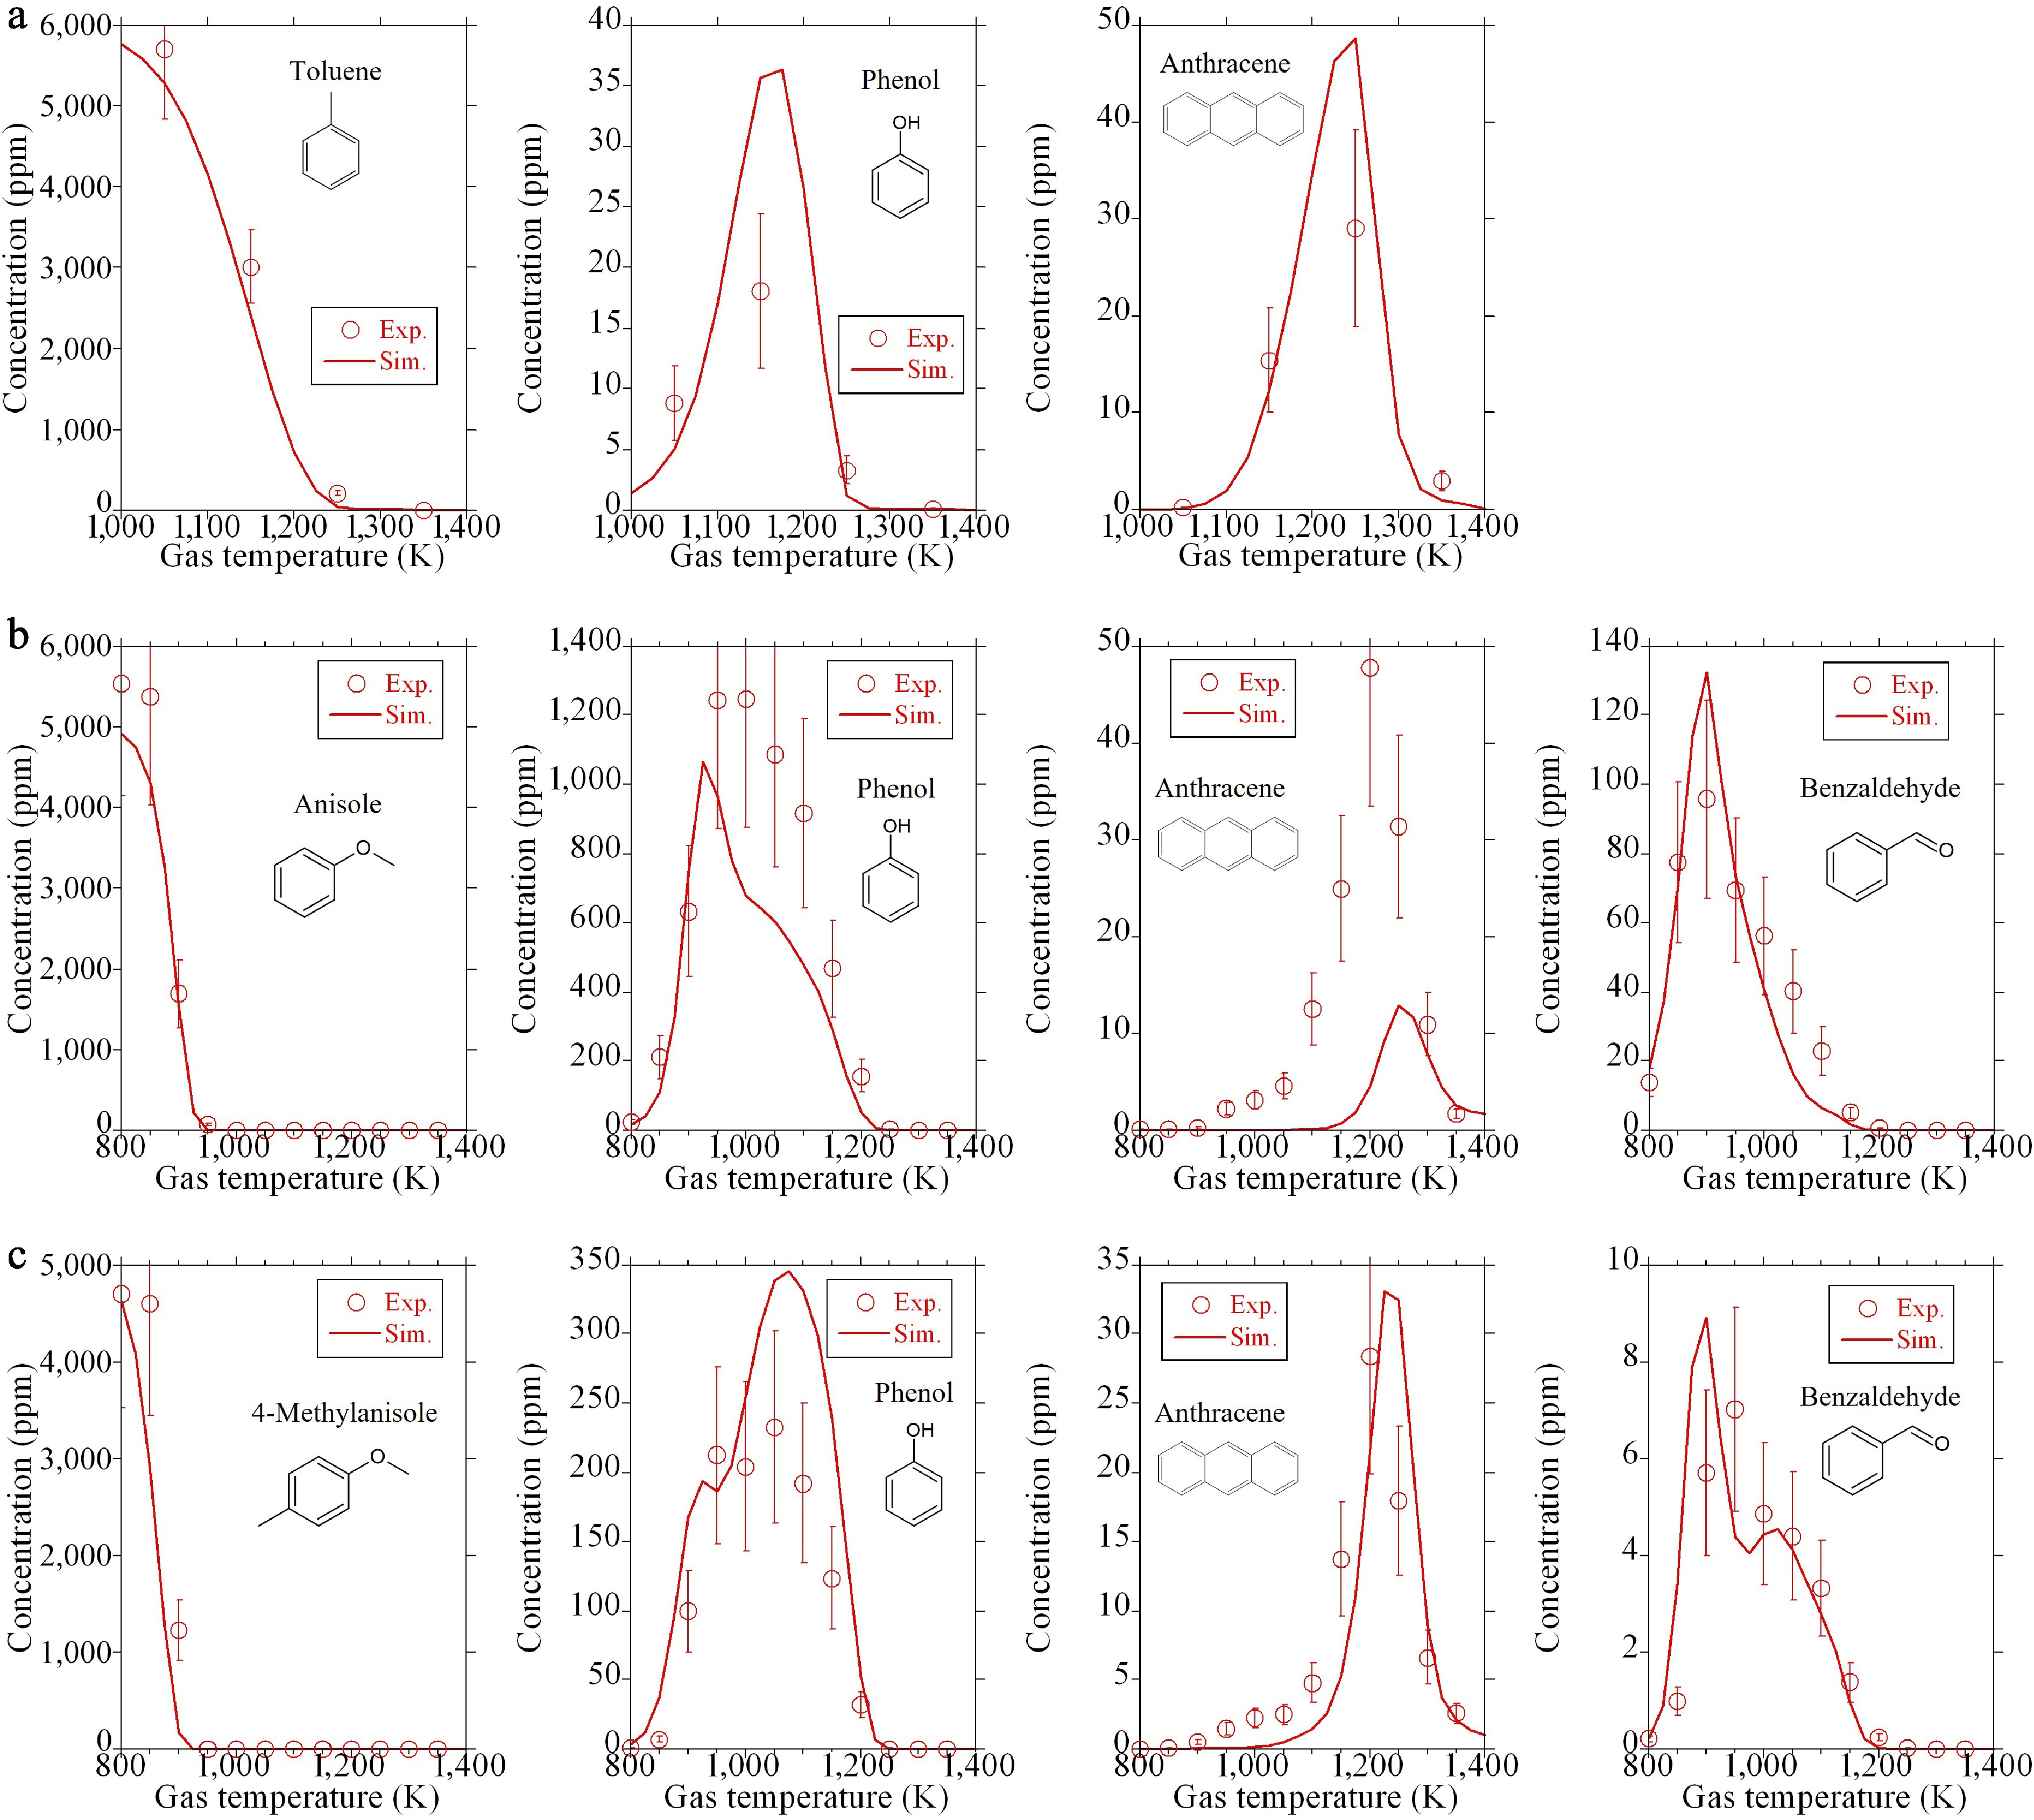
Figure 6a shows the comparison of the measured and simulated results for the fuel-rich oxidation of toluene. The left panel of Fig. 6a shows the dependence of a temperature, whereas the middle and right panels present the effect of residence time on anthraquinone production at 1,300 and 1,150 K, respectively. Note that these temperatures are still low, not enough to produce much soot. In the concentration profile as a function of temperature, the experiment exhibits the maximum concentration at 1,150 K, which is well reproduced by the simulation. The temperature showing the maximum concentration is analogous to that of other OPAHs formed in the fuel-rich oxidation of toluene, such as benzofuran and dibenzofuran[16]. In the middle panel of Fig. 6a, both the experiment and the simulation demonstrate that the concentration of anthraquinone once increases, then decreases, with respect to the residence time. This suggests that anthraquinone is immediately consumed after its formation at 1,300 K. On the other hand, in the concentration profile as a function of residence time at 1,150 K, anthraquinone production increases with an increase in residence time within the studied range. This suggests that anthraquinone formation is dominant, rather than its consumption under this condition.
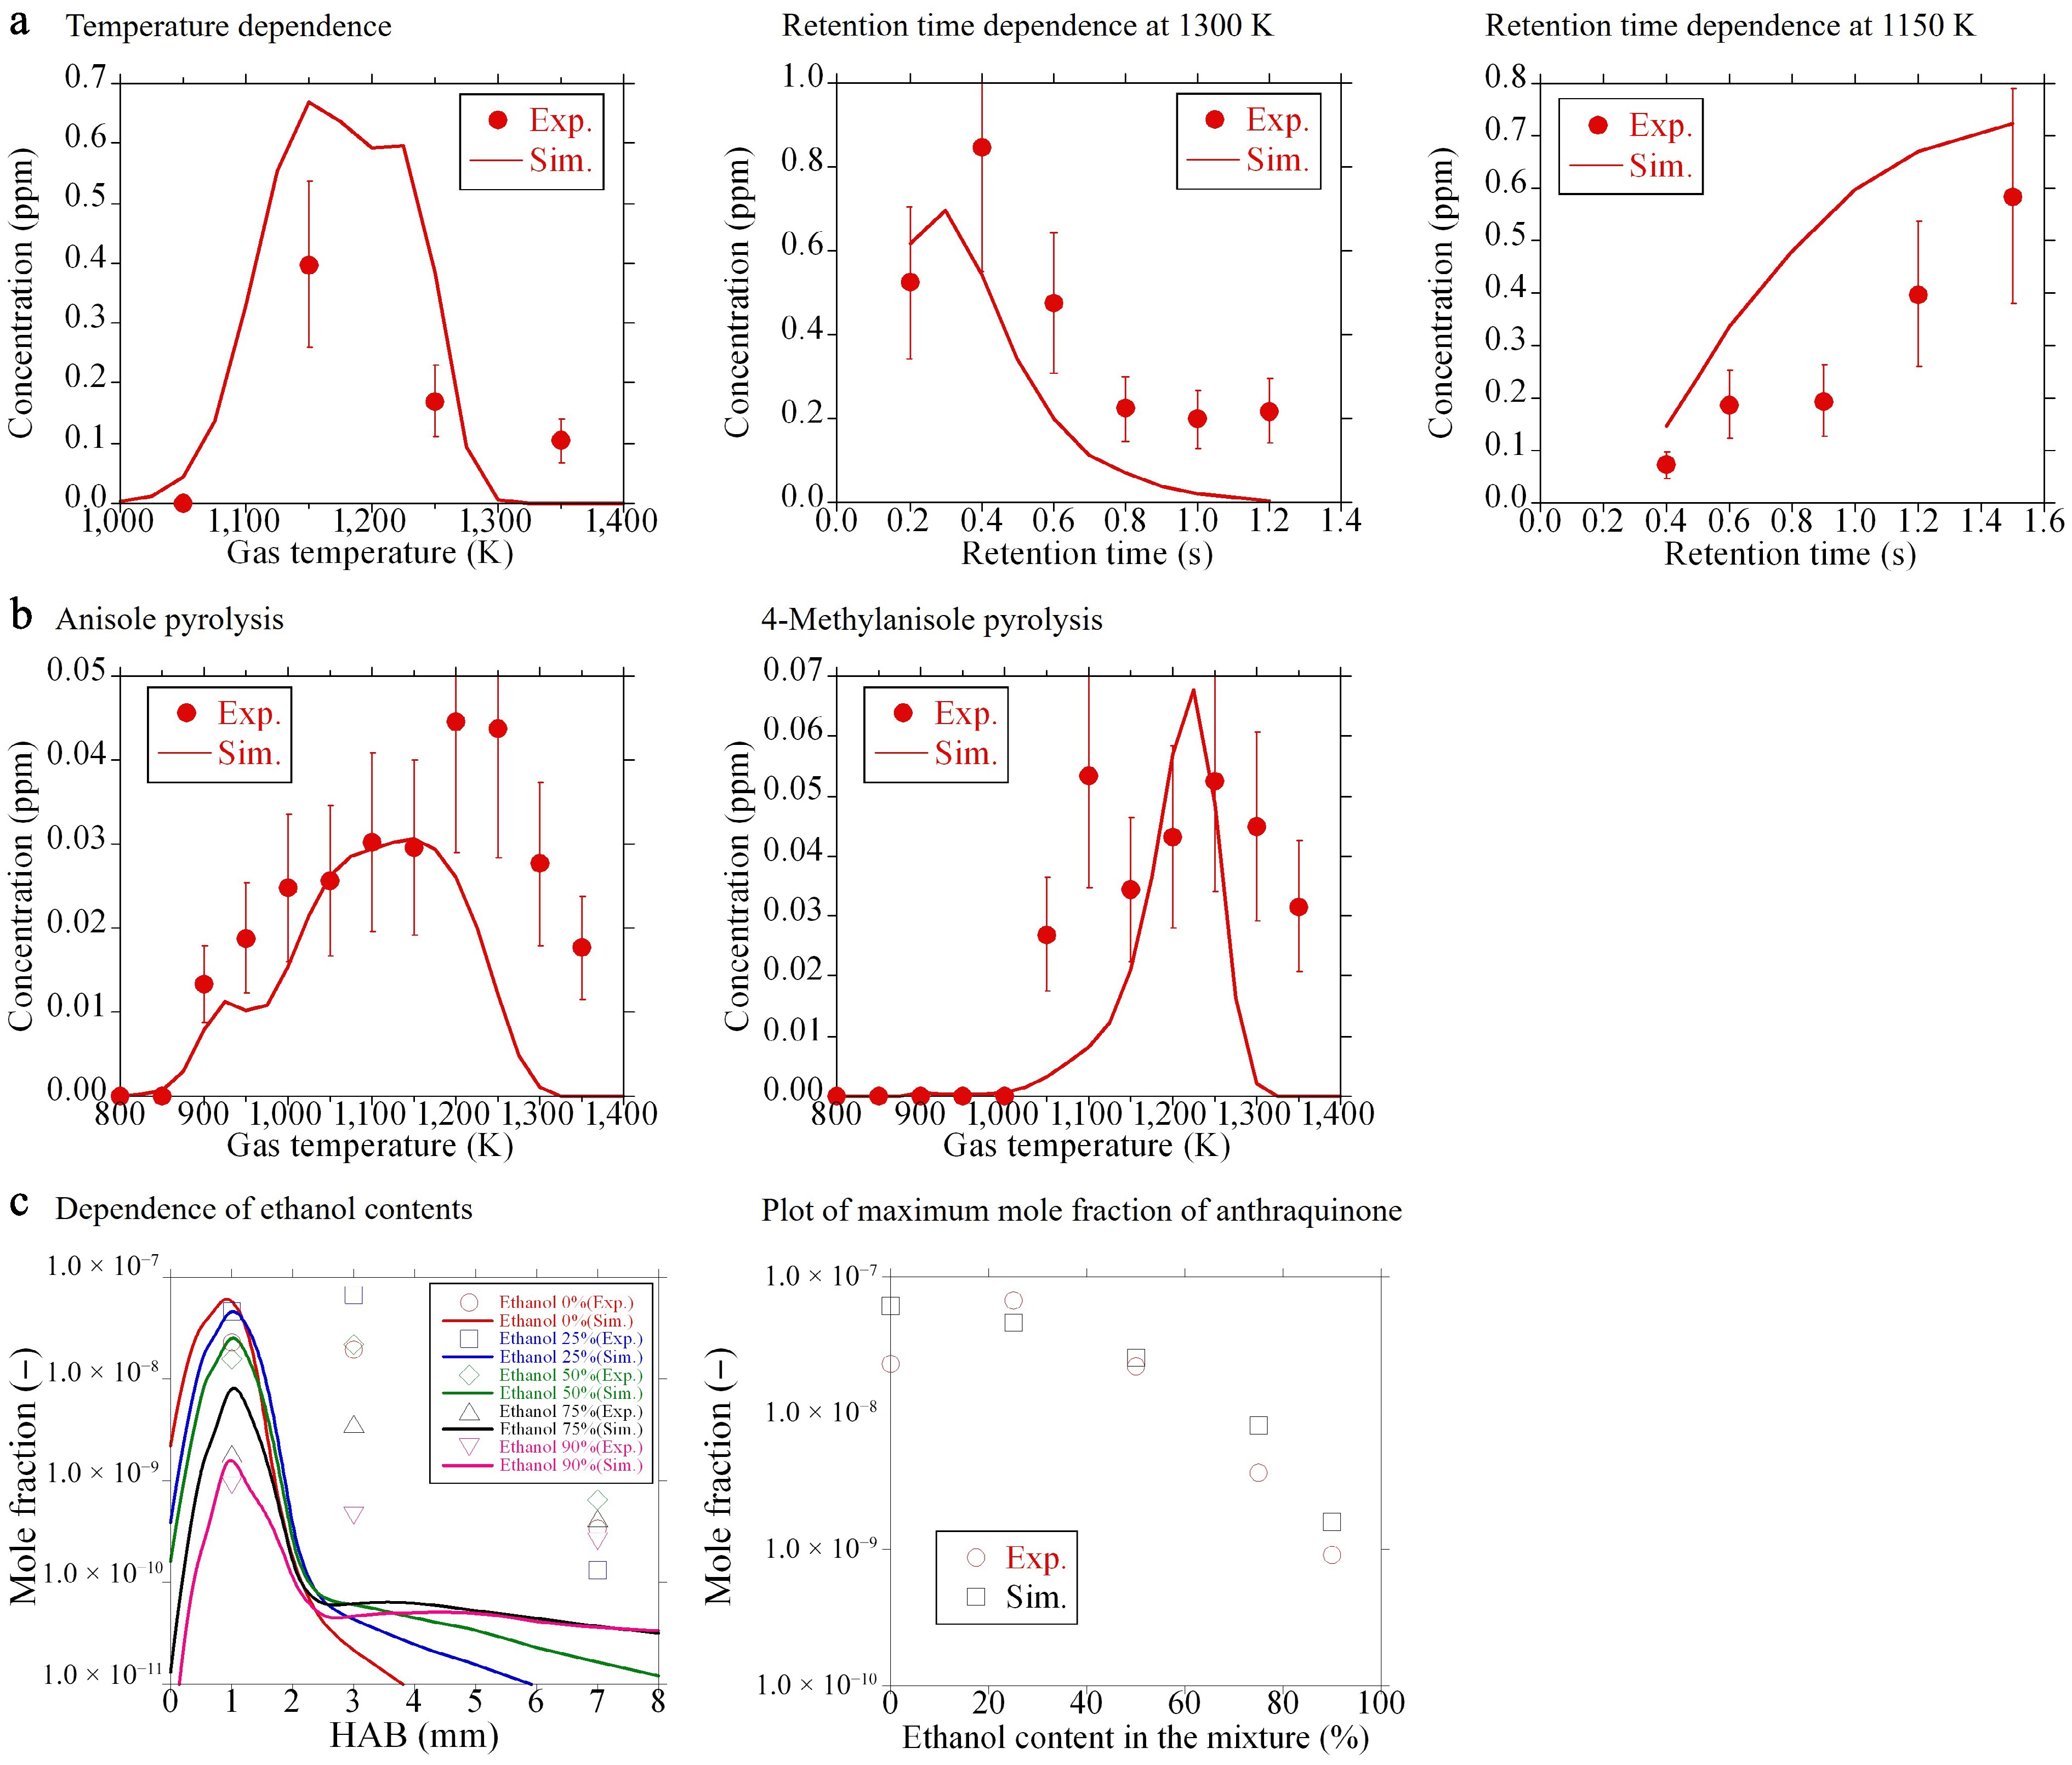
Figure 6.
Mole fractions of anthraquinone: comparison of experiments (symbols) and the present model (lines). (a), (b) New experimental data. (c) Literature data[12].
Figure 6b exhibits the concentration profiles of anthraquinone in the pyrolysis of anisole (left panel), and 4-methylanisole (right panel). The simulations could satisfactorily capture the experimental tendency in both pyrolysis cases. Anthraquinone production is approximately smaller than that in the fuel-rich oxidation of toluene by one order of magnitude, and is close to the lower detection limit of the present analyzer. This low concentration of anthraquinone in these pyrolysis experiments is reasonable because oxygen atom concentration included in the feed gas (oxygen atom concentration in the chemical structure of anisole or 4-methylanisole) is 5,000 ppm, while it is 12,000 ppm (6,000 ppm based on oxygen molecule) for the fuel-rich oxidation of toluene. Furthermore, the contribution of the oxidation pathway of PAH to anthraquinone formation under the pyrolysis environment would be minor. The temperatures exhibiting the maximum anthraquinone production are approximately 1,150–1,200 K, and 1,200–1,250 K for the pyrolysis of anisole and 4-methylanisole, respectively. In our previous study[19], numerous OPAHs, such as alcohols and furans, produced in the pyrolysis of anisole and 4-methylanisole, were quantified. Because these OPAHs were basically primary products from the fuels, the temperatures showing their maximum mole fractions were generally lower than or equal to 1,000 K[19]. Given the difference in these temperatures, anthraquinone is not a primary product of the fuels, and a number of reaction steps would be necessary from the fuel consumption to the formation of anthraquinone. In Fig. 6a and b, the rapid consumption of anthraquinone in simulations at elevated temperatures above 1,300 K is pronounced. This may be due to the simplified expression of anthraquinone consumption reactions and/or the uncertainty associated with temperature profiles as input data.
A comparison of the experimental and simulated mole fractions of anthraquinone in the premixed flame of ethylbenzene/ethanol blend is presented in the left panel of Fig. 6c. These flames were measured at their soot onset thresholds, thus they are very low sooting flames[12]. Note that the mole fractions of anthraquinone are expressed on a log scale, to be coherent with the original data, in Fig. 6c. The left panel of Fig. 6c illustrates that height-above-burner (HAB) exhibiting the maximum mole fraction is around 1 mm in all flames and drastically decreases with further increase of HAB in the simulations. Conversely, the experiments show a gradual decline of anthraquinone production against HAB. This difference would be attributed to the sampling method in the experiments. The speciation data of the flames is significantly sensitive to the sampling method because a sampling probe itself and/or extraction of the reacted gas from a sampling probe to an analyzer would disturb the flame and become a potential cause of artifact and uncertainty. The simplified consumption reactions of anthraquinone included in the present model could be another source of significant uncertainty. ROP analysis of anthraquinone at HAB = 1, 3, and 7 mm in ethylbenzene 100% and ethylbenzene 25%/ethanol 75% flames indicated that the following two reactions, ANTHRQNONE+H = > 2CO + C6H3 + C−C6H4 + H2 and ANTHRQNONE + OH = > 2CO + C6H3 + C−C6H4 + H2O, are predominantly responsible for the consumption of anthraquinone in both flames at HAB = 1 mm. Conversely, only the former reaction was found to be predominant at HAB = 3 and 7 mm. As stated in Section 'Sub-model of anthraquinone', the rate parameters of these two global reactions are based on the H-abstraction reaction of benzene. This suggests that the H-abstraction reaction plays an important role in anthraquinone consumption. However, given the discrepancies between the experiment and simulation in Fig. 6c, this simplified expression of anthraquinone consumption may not be sufficient. Consequently, modeling the detailed consumption pathways of anthraquinone has the potential to enhance the efficacy of simulations. However, this is a future task for the community. Instead of the mole fraction profiles against HAB, the maximum mole fraction of anthraquinone is plotted as a function of ethanol content in the blends, as displayed in the right panel of Fig. 6c. This clearly shows the comparable trend in both experiments and simulations that the peak mole fraction of anthraquinone reduces with an increase of ethanol content in the blends. Based on the comparison presented in Fig. 6, the present mechanism can reasonably reproduce the anthraquinone production behaviors obtained in several experimental setups and conditions. However, the dominant production pathways toward anthraquinone are still unclear and are discussed in the next section.
Modeling analysis on anthraquinone formation chemistry
-
ROP analysis was successful in identifying the important formation pathways for anthraquinone. These pathways were subsequently categorized into four distinct groups, designated as R1 to R4, as exhibited in Fig. 7a. R1 is a combination reaction initiated by benzaldehyde (C6H5CHO) and 2-formylphenyl radical (C6H4CHO), followed by H-abstraction reactions, cyclization, and hydrogen elimination. Note that the predominant pathway of benzaldehyde (C6H5CHO) consumption involves H-abstraction reactions, leading to the formation of benzoyl radicals (C6H5CO). In contrast, the formation of formylphenyl radicals (C6H4CHO) from benzaldehyde is restricted. Nevertheless, C6H4CHO plays an important role in anthraquinone formation because C6H5CO undergoes rapid decomposition to produce C6H5 and CO. The incorporation of the C6H4CHO oxidation pathway, such as C6H4CHO + O2 = > C5H5 + 2CO + O, exerts several effects on the production of anthraquinone, including a reduction in its production and a temperature shift of its peak concentration in toluene oxidation. However, due to the lack of understanding regarding the reactivity of the intermediate products during C6H4CHO oxidation, such as formyl cyclopentadiene (C5H5CHO) and formyl cyclopentadienyl radical (C5H4CHO), the oxidation pathway of C6H4CHO should be described with special care. Hence, further experimental and theoretical examination is necessary to properly model the decomposition of C6H4CHO and its isomerization to C6H5CO. R2 denotes the HACA pathway from p-naphthoquinone (P-OA2O). R3 involves the oxidation of anthracene and is subdivided into two pathways. R3a is a straightforward reaction in which anthracenyl radical (RANTHRACENE1) formed through H-abstraction of anthracene reacts with O2 to produce anthraquinone. Conversely, R3b is initiated by the reaction between anthracene and atomic oxygen, resulting in the formation of 1,8-dehydroxy-9-anthron (DHY18ANTHRON). Subsequent to this, isomerization, H-abstraction, and the further addition of oxygen can occur, leading to the formation of anthraquinone. R4 represents the combination pathway; however, its importance lies exclusively in 4-methylanisole pyrolysis.
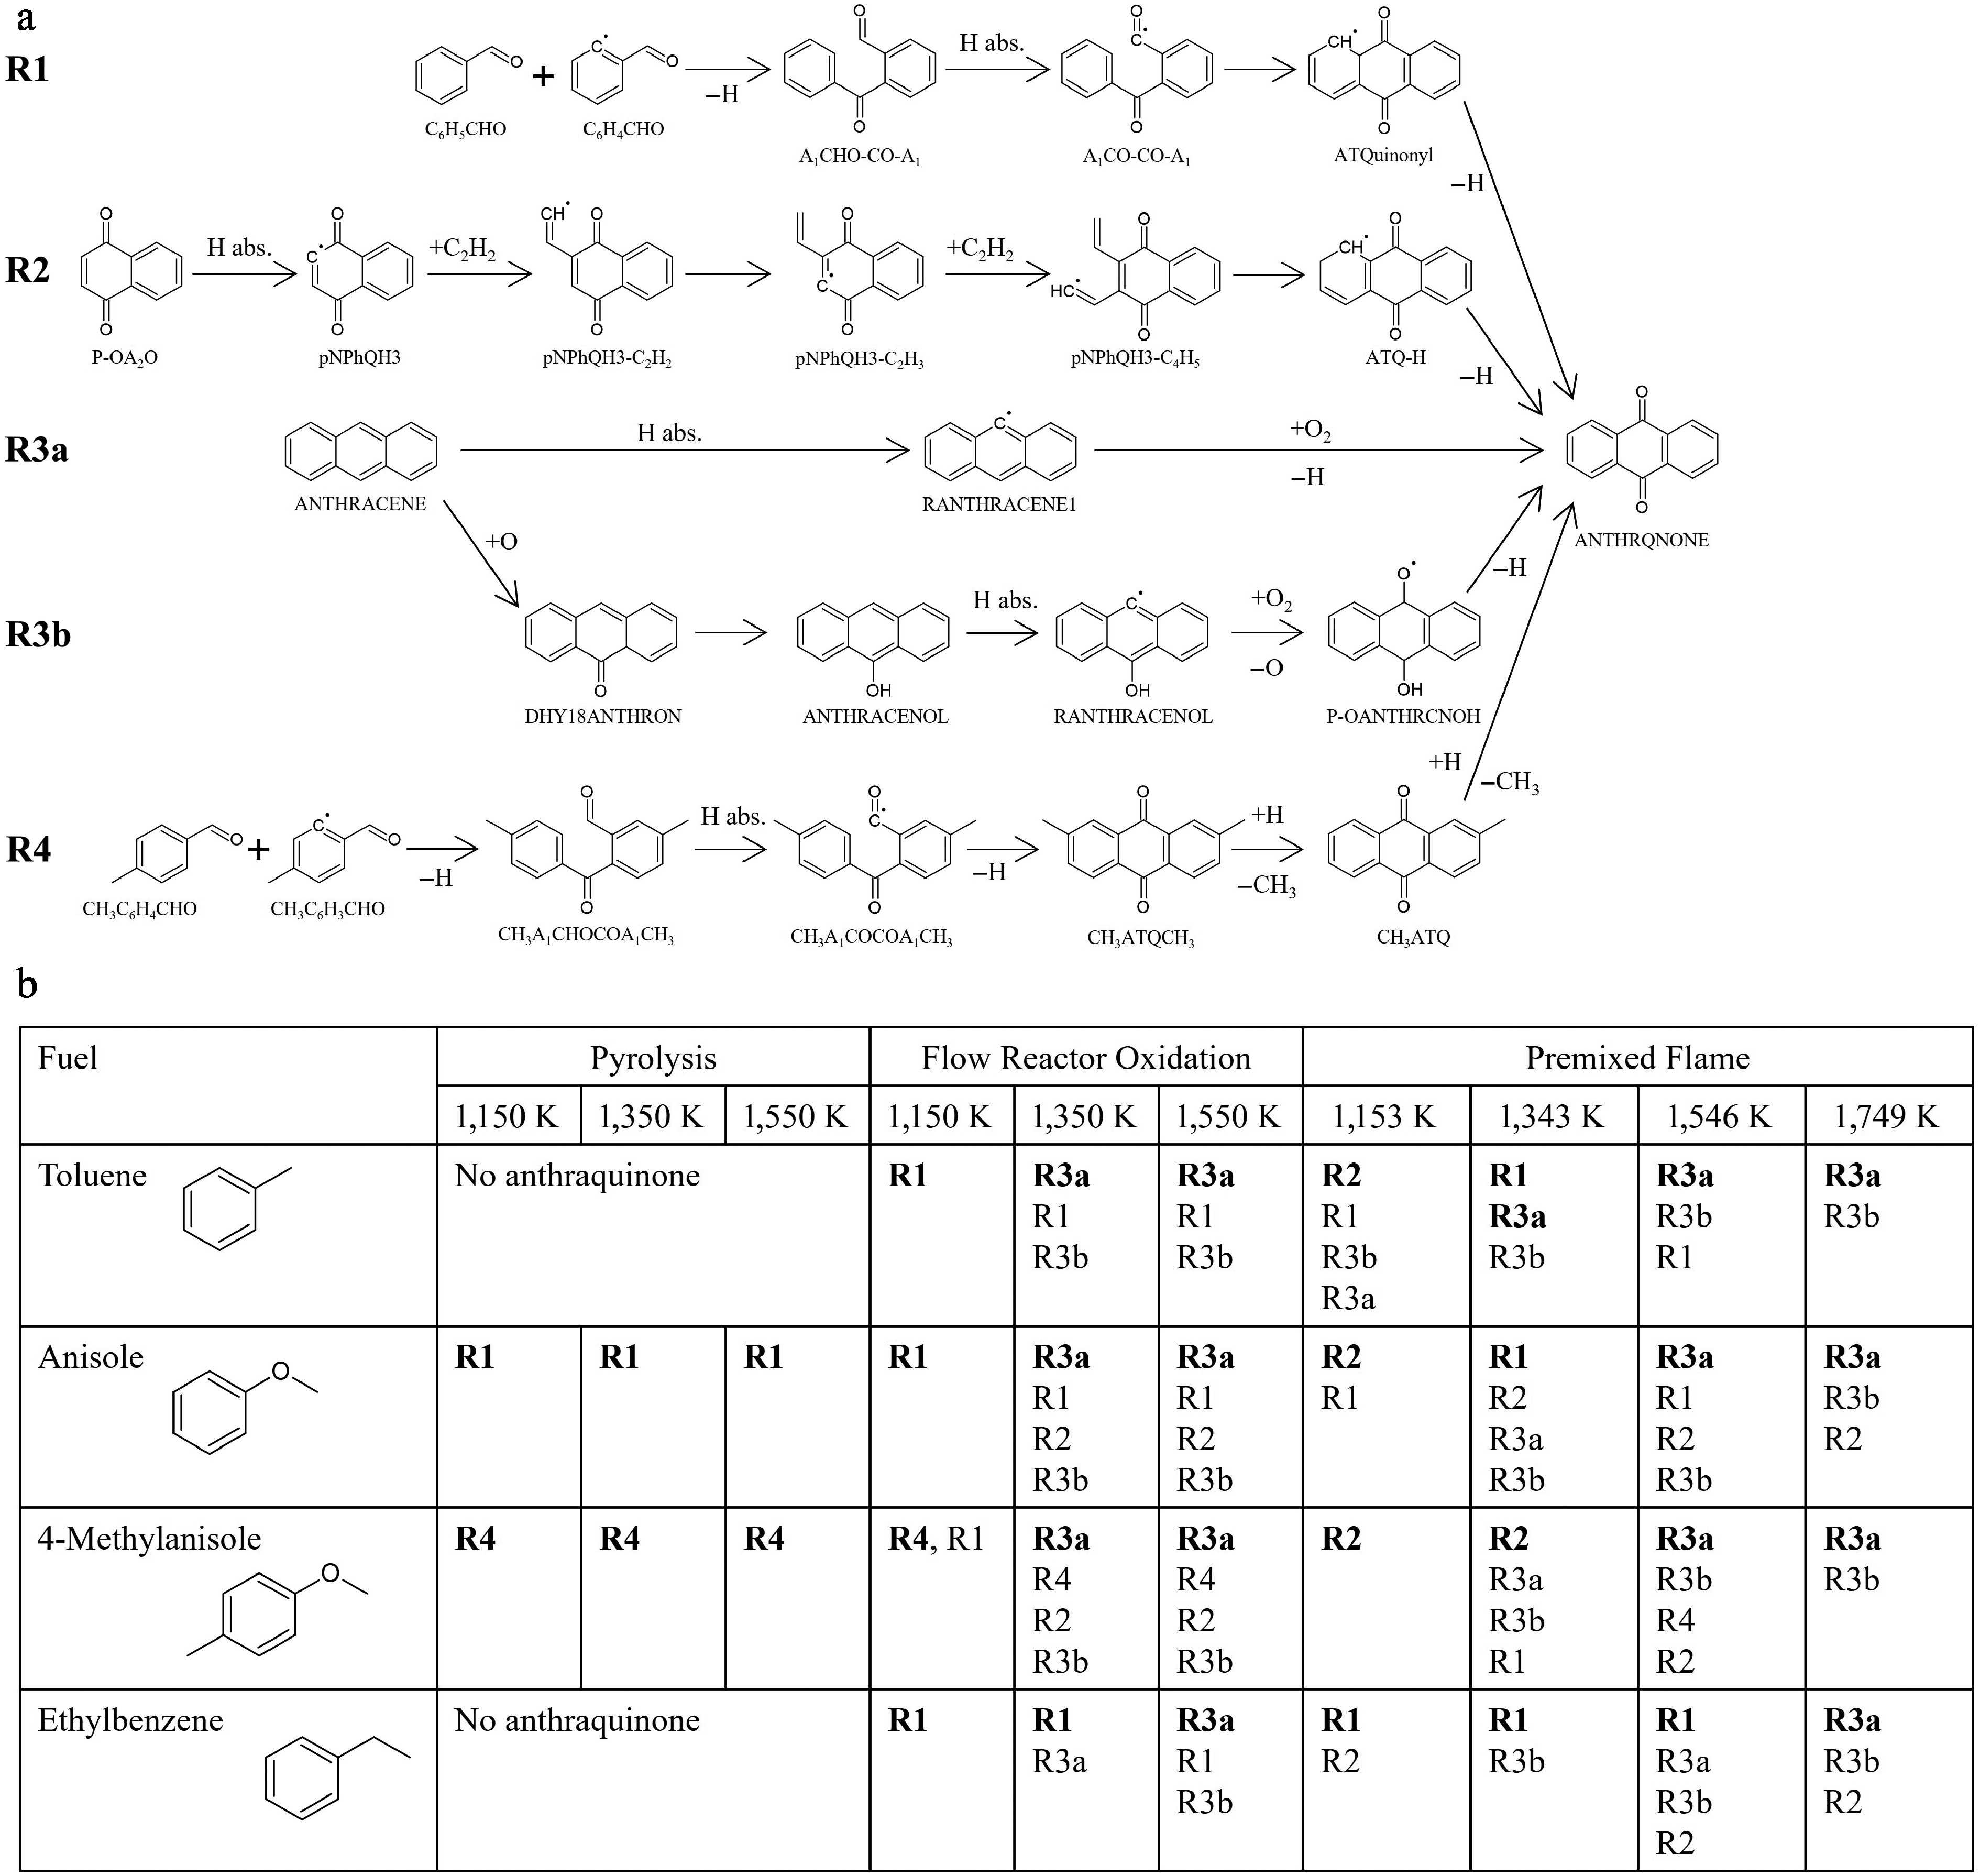
Figure 7.
Results of the reaction pathway analysis for anthraquinone. (a) Schematic illustration of the important production pathways toward anthraquinone (ANTHRQNONE). (b) Summary of the dominant pathways for anthraquinone under various fuels and conditions. Three representative cases, pyrolysis, oxidation and flame were selected. The pyrolysis and fuel-rich oxidation were analyzed in a flow reactor at an equivalence ratio of 9.0. For premixed flame simulations of toluene, anisole, and 4-methylanisole, the same equivalence ratio (φ = 1.68) and temperature profile as in ethylbenzene case[12] were employed. In flame simulations, HABs corresponding to 1,153, 1,343, 1,546, and 1,749 K are 0.74, 0.89, 1.13, and 1.55 mm, respectively. No anthraquinone is formed in the pyrolysis of toluene and ethylbenzene. The reactions are listed in the order of contribution, with the most dominant reactions highlighted in bold.
To clarify which of the aforementioned pathways are dominant, simulations were conducted using various fuels and under different conditions. The summary of the obtained results is presented in Fig. 7b. Three distinct cases, namely pyrolysis and oxidation in a flow reactor, and premixed flame, were considered for the simulations in order to provide a perspective on the anthraquinone formation chemistry for future work and to encourage the community to conduct further experiments. Given the absence of anthraquinone formation during the pyrolysis of toluene and ethylbenzene, these cases were excluded from the simulation. The fuel-rich oxidation in a flow reactor was simulated with three varying temperatures, 1,150, 1,350, and 1,550 K, to investigate temperature dependence. Although the experiments at 1,550 K were not conducted in this study, a more profound understanding of the anthraquinone chemistry would be acquired by simulating up to this temperature. As with the experiment, the simulated equivalence ratio was 9.0. In addition to ROP analysis for the premixed flame of ethylbenzene, which complies with the literature[12], the flame simulations for toluene, anisole, and 4-methylanisole were conducted to manifest the reaction characteristics of anthraquinone at elevated temperatures. For ROP analysis of premixed flames using toluene, anisole, and 4-methylanisole, the same equivalence ratio (φ = 1.68) and temperature profiles as in the ethylbenzene case[12] were employed. To facilitate a meaningful comparison of the simulated results of a flow reactor, ROP analysis for these flames was conducted at corresponding temperatures to a flow reactor. Additionally, 1,750 K was employed as representative of the highest temperature. HABs corresponding to these temperatures are 0.74, 0.89, 1.13, and 1.55 mm. Among these HABs, the first two are within the preheating zone, while HABs = 1.13 and 1.55 mm are corresponding to the reaction zone and post flame region, respectively. The simulated ROP profiles of anthraquinone against a distance (HAB in premixed flame) in each case are presented in Supplementary Figs. S4−S11. Based on these profiles, Fig. 7b illustrates the reactions in the order of their contribution, with the most dominant reactions highlighted in bold.
In the fuel-rich oxidation of toluene in a flow reactor at 1,150 K, R1 is the dominant reaction pathway, with other reaction pathways contributing only marginally to anthraquinone production. Conversely, in a flow reactor oxidation at temperatures of 1,350 and 1,550 K, the predominant pathway becomes R3a. Although R1 contributes to anthraquinone formation to some extent at elevated temperatures, particularly at points with short distances, its contribution decreases as temperature increases. R3b, an alternative oxidation pathway from anthracene, is present at elevated temperatures, though its contribution is significantly less compared to R3a and R1. In the case of the premixed flame of toluene, the predominant pathways are dynamically changed according to HAB, more precisely, to flame temperatures. At HAB = 0.74 mm, which corresponds to 1,153 K, R2 predominates, while R1 and R3a contribute equally to anthraquinone production at HAB = 0.89 mm, and temperature of 1,343 K. With an increase of HAB, namely an increase of temperature, such as HAB = 1.13 mm (1,546 K) and 1.55 mm (1,749 K), the dominant pathway is R3a, followed by R3b.
In anisole pyrolysis in a flow reactor, R1 is found to be the predominant production pathway for anthraquinone, with negligible contributions from other reactions across all three temperatures. For anisole oxidation in a flow reactor at 1,150 K, R1 maintains its predominance. However, during the oxidation of anisole at 1,350 and 1,550 K in the flow reactor, R3a is the predominant contributor instead of R1, with less contribution from R2 and R3b. In a manner analogous to toluene oxidation, the main formation pathway for anthraquinone strongly depends on the distance, at elevated temperatures. This observation suggests that under conditions of brief reactor length and/or reaction time, the prevailing pathway transitions to R1, even at higher temperatures. The predominant pathways for anthraquinone formation in the premixed flame of anisole are influenced by HAB as in the premixed flame of toluene. R2 is dominant at low HAB (0.74 mm, i.e., 1,153 K). However, the dominant pathway transitions to R1 at HAB = 0.89 mm (1,343 K), subsequently to R3a at HAB = 1.13 mm (1,546 K) and 1.55 mm (1,749 K).
In the case of 4-methylanisole pyrolysis in a flow reactor, the dominant production pathway for anthraquinone is R4 at all three temperatures. At 1,150 K, a minor contribution of R1 is also observed. As stated above, R4 is the combination reaction of small oxygenated aromatic species that is specific to 4-methylanisole. Thus, given the similarity of reaction characteristics between R1 and R4, it can be concluded that the combination reactions serve a dominant role in anthraquinone formation in 4-methylanisole pyrolysis. In the oxidation of 4-methylanisole in a flow reactor at 1,150 K, the contribution of R4 remains significant. In contrast, at temperatures of 1,350 and 1,550 K, R3a becomes the predominant pathway, with its dominance being noticeable at 1,550 K. Similarly to anisole pyrolysis, R2, and R3b are minor contributors to anthraquinone production at elevated temperatures. In contrast to the pyrolysis and oxidation in a flow reactor, the combination reactions, such as R1 and R4, are not so important in the remixed flame of 4-methylanisole. Instead, R2 is more dominant than the other reactions at low HAB (0.74 and 0.89 mm, i.e., 1,153−1,343 K), while R3a becomes a prevailing pathway at large HAB (1.13 and 1.55 mm, i.e., 1,546−1,749 K), followed by R3b.
In the fuel-rich oxidation of ethylbenzene in a flow reactor, while R1 maintains its predominance up to 1,350 K, the dominant pathway is changed to R3a at 1,550 K. Intriguingly, the temperature at which the dominant pathway for anthraquinone formation changes from R1 to R3a is higher in ethylbenzene fuel compared to the fuel-rich oxidation of toluene and anisole. The analyzed results of ethylbenzene premixed flame demonstrate that R1 is a major contributor to anthraquinone production at HAB = 0.74 mm (1,153 K), 0.89 mm (1,343 K), and 1.13 mm (1,546 K). At an increased HAB of 1.55 mm (1,749 K), the contributions of R3a and R3b are substantially larger than that of R1. It is noteworthy that the dominant pathway is R3a at HAB = 1.13 mm (1,546 K) in other flames, while R1 maintains its predominance at the corresponding HAB in ethylbenzene flame. Given the similar tendency in flow reactor oxidation and premixed flames using ethylbenzene as fuel, the influence of R3a on anthraquinone production is lower than that of R1 compared to other fuels. Nevertheless, the overall trend is similar in each fuel, albeit to varying degrees.
-
In an effort to elucidate the reaction chemistry of anthraquinone, a combination of fundamental experiments, theoretical calculations, and modeling was employed. Based on reaction pathway analysis exhibited in the previous section, it is found that under pyrolysis conditions, the combination reactions of small oxygenated aromatic species are dominant for anthraquinone production, with negligible contribution from other pathways, such as HACA and oxidation of PAHs. O2 is a key species in one of the production routes of p-naphthoquinone (P-OA2O), which serves as a starting species in R2. Furthermore, O2 acts as a pivotal role in both R3a and R3b. Consequently, the contribution of R2, R3a, and R3b to anthraquinone is negligible in the pyrolysis environment, even for oxygenated fuels, anisole, and 4-methylanisole. The lower contribution of R2, R3a, and R3b to anthraquinone is helpful in explaining lower anthraquinone production in the pyrolysis experiments of anisole and 4-methylanisole than that in the fuel-rich oxidation of toluene, as demonstrated in Fig. 6a and b.
In case of oxidation in a flow reactor, the prevailing pathways exhibit a pronounced sensitivity to variations in temperature, underscoring the critical role of thermal conditions in determining the predominance of the reaction pathways. At relatively low temperatures, the combination reactions are the primary contributor to anthraquinone formation. However, the significance of the combination reactions diminishes with an increase in temperature, and instead, the oxidation pathways from anthracene, particularly R3a, occupy a dominant position with respect to anthraquinone production. At lower temperatures, benzaldehyde (C6H5CHO) and methylbenzaldehyde (CH3C6H4CHO), the main precursors in R1 and R4, are more likely to form than anthracene, a precursor in R3a and R3b, due to numerous reaction steps required for anthracene formation. Conversely, anthracene is substantially produced, and its oxidation proceeds at high temperatures. As a result, the predominant pathway changes from the combination reactions to anthracene oxidation with an increase in temperature.
The transition of the dominant pathway toward anthraquinone in premixed flame is more dynamic than that of the flow reactor oxidation. At low HAB, namely low temperatures, the role of R2 is significant in anthraquinone production, probably because the formation of p-naphthoquinone (P-OA2O), a precursor in R2, is more predominant than its consumption. Although the combination reaction is dominant in several cases with an increase of HAB, further increase of HAB results in a transition of the predominant pathway to anthracene oxidation, R3a and R3b. It is noteworthy that the flow reactor oxidation and premixed flame exhibit a similarity in terms of the predominant anthraquinone formation pathways; the importance of oxidation pathways, especially R3a, becomes significantly large at elevated temperatures.
Despite the limited availability of fuels and conditions, the present model is successful in revealing the effect of the difference in experimental conditions and fuels on the predominant formation pathways for anthraquinone. Given the abundant production of anthraquinone in various combustion processes, the findings obtained in this study are of great importance in comprehending the reaction mechanisms of anthraquinone. In addition, given the diverse structures of OPAHs with two ketone groups, signified as quinones, it is hypothesized that the present investigation will lay a solid foundation for the future works that clarify the reaction chemistry of quinones, including smaller ones, other than anthraquinone during combustion.
-
This study offers the first integrated kinetic investigation of anthraquinone formation during combustion, combining theoretical calculations, detailed modeling, and comparison with experimental data. The construction of a dedicated sub-mechanism, validated across different fuels and combustion conditions, provides mechanistic insights into pathways that are otherwise difficult to isolate experimentally. The rate coefficients of several reaction pathways, such as HACA and combination reactions, were determined based on the theoretical calculations. The sub-mechanism of anthraquinone chemistry was developed and subsequently merged with the existing model. The developed model could reasonably reproduce not only the present measured data for the oxidation of toluene and the pyrolysis of anisole and 4-methylanisole, but also literature data concerning premixed flames of ethylbenzene/ethanol blends. To identify the dominant reaction pathways, kinetic analysis for three cases was conducted: pyrolysis and fuel-rich oxidation in a flow reactor and a premixed flame. The fuels used in these simulations were toluene, anisole, 4-methylanisole, and ethylbenzene. Despite the use of four distinct fuels in analysis, the predominant reaction pathways for anthraquinone generally exhibited a similar trend. During pyrolysis in a flow reactor, the combination reactions involving small oxygenated aromatic species were found to be predominant across all the temperatures studied. In contrast, during fuel-rich oxidation in a flow reactor, the combination reactions maintained their predominance at lower temperatures, such as 1,150 K, while the oxidation reactions starting from anthracene became major contributors to anthraquinone production instead of the combination reactions at elevated temperatures. In premixed flames, the predominant pathways were found to be significantly influenced by HAB, namely temperature. In many cases, the HACA pathway exhibited a predominant influence on anthraquinone formation at low HAB, where small quinones formed. Conversely, the combination reaction played a pivotal role in an increase in HAB. A further increase in HAB, specifically an increase in temperature, resulted in a transition of the predominant pathway to oxidation reactions initiated by anthracene. Among the four fuels, the effect of the combination reaction on anthraquinone formation was found to be generally stronger in ethylbenzene than in the other three fuels. The results of this study indicated the significance of all three pathways, combination, HACA, and oxidation of anthracene. However, the importance of the combination and oxidation reactions was particularly underlined. Because this examination constitutes the initial endeavor to clarify the formation chemistry of anthraquinone, the framework established here provides a solid foundation for future experimental and theoretical studies on quinone formation in combustion, for example, (1) theoretically evaluating the pressure dependence of the studied pathways, (2) full PES for the combination of benzaldehyde and 2-formylphenyl, (3) experimental quantification of anthraquinone and other quinones in the combustion of other fuels and biofuels at different pressure conditions.
This work was supported by the Japan Society for the Promotion of Science (JSPS) KAKENHI (Grant Nos. 23H01616 and 23K17060), internal grant of Department of Energy and Environment, AIST, and the I-SITE ULNE through the 'Biofuel-Soot' project (R-JEUNES-19-010-TRAN). KS thanks the financial support of CRERC-Ibaraki University for her experimental campaign at this institution. High performance computing resources were provided by the Centre de Resources Informatiques (CRI) of the University of Lille and IDRIS under the allocation 2020-101578 made by GENCI.
-
The authors confirm their contributions to the paper as follows: study conception and design: Suzuki S, Tran LS; experimental data collection: Sood K, Kobayashi K, Tanishita N, Suzuki S; theoretical calculations: Lizardo-Huerta JC, Taamalli S, El Bakali A, Louis F; model development and simulations: Suzuki S, Lizardo-Huerta JC, Tran LS; analysis and interpretation of experimental, theoretical, and modeling results: Sood K, Lizardo-Huerta JC, Taamalli S, El Bakali A, Louis F, Gasnot L, Sakai Y, Tanaka K, Suzuki S, Tran LS; manuscript preparation: Suzuki S, Sood K, Lizardo-Huerta JC, Taamalli S, El Bakali A, Louis F, Gasnot L, Sakai Y, Tanaka K, Tran LS. All authors reviewed the results and approved the final version of the manuscript.
-
All data generated or analyzed during this study are included in this published article and its supplementary information files.
-
The authors declare that they have no conflict of interest.
- Supplementary Table S1 A summary of experimental conditions for a flow reactor.
- Supplementary Table S2 Test of the used method with other OPAHs (benzofuran and dibenzofuran).
- Supplementary File S1
- Supplementary Table S3 Lists of the rate constants of newly added reactions related to anthraquinone in the present study.
- Supplementary Table S4 A summary table of names, nomenclature in the mechanism, and chemical structures of the selected species in the manuscript.
- Supplementary File S2
- Supplementary File 1 Experimental data.
- Supplementary File 2 Kinetic model (mechanism, thermo, transport data).
- Supplementary Fig. S1 Top panel: Potential energy surface (PES) for addition (combination) of the benzoyl radical to benzaldehyde going to the formation of 9,10-anthraquinone at the CBS-Q/CAM-B3LYP/6-311+G(2d,p) level of theory, including ZPE. Energies are in kcal/mol at 0K relative to the reactants. Notes: The H-abstraction reactions were not calculated in this work, so the connected line should not to indicate barrierles; their rate constants were taken from benzaldehyde [2] as described in the main paper. Bottom panel: The corresponding rate constants (k) for a temperatures range of 500 to 2,000 K computed at CBS-Q/CAM-B3LYP/6-311+G(2d,p) level of theory. Units are in cm, mol, s and cal.
- Supplementary Fig. S2 The growth from naphthalene to anthracene via C2H2 addition, with barrier heights (in kcal/mol) calculated at the G3(MP2,CC)//B3LYP/6-311G** level of theory by Chu et al.[3].
- Supplementary Fig. S3 PES of the growth from p-benzoquinone to p-naphthoquinone via C2H2 addition. Barrier heights (in kcal/mol) at 0 K calculated at the CBS-Q/CAM-B3LYP/6-311+G(2d,p) level of theory, including ZPE. Bottom panel: The corresponding rate constants (k) for a temperatures range of 500 to 2,000 K computed at CBS-Q/CAM-B3LYP/6-311+G(2d,p) level of theory. Units are in cm, mol, s and cal.
- Supplementary Fig. S4 Analyzed ROP profiles of anthraquinone in the fuel-rich oxidation of toluene in a flow reactor at three temperatures, 1,150 K, 1,350 K, and 1,550 K. Note that analyzed results in pyrolysis is not presented because of no anthraquinone production. Red-solid, blue-solid, black-solid, black-dashed, and green-solid lines represent R1, R2, R3a, R3b, and R4, respectively.
- Supplementary Fig. S5 Analyzed ROP profiles of anthraquinone in the premixed flame of toluene.
- Supplementary Fig. S6 Analyzed ROP profiles of anthraquinone in the pyrolysis and fuel-rich oxidation of anisole in a flow reactor at three temperatures, 1,150 K, 1,350 K, and 1,550 K.
- Supplementary Fig. S7 Analyzed ROP profiles of anthraquinone in the premixed flame of anisole.
- Supplementary Fig. S8 Analyzed ROP profiles of anthraquinone in the pyrolysis and fuel-rich oxidation of 4-methylanisole in a flow reactor at three temperatures, 1,150 K, 1,350 K, and 1,550 K.
- Supplementary Fig. S9 Analyzed ROP profiles of anthraquinone in the premixed flame of 4-methylanisole.
- Supplementary Fig. S10 Analyzed ROP profiles of anthraquinone in the fuel-rich oxidation of ethylbenzene in a flow reactor at three temperatures, 1,150 K, 1,350 K, and 1,550 K.
- Supplementary Fig. S11 Analyzed ROP profiles of anthraquinone in the premixed flame of ethylbenzene. Red-solid, blue-solid, black-solid, black-dashed, green-solid, and orange-dotted lines represent R1, R2, R3a, R3b, R4, and temperature, respectively.
- Copyright: © 2026 by the author(s). Published by Maximum Academic Press, Fayetteville, GA. This article is an open access article distributed under Creative Commons Attribution License (CC BY 4.0), visit https://creativecommons.org/licenses/by/4.0/.
-
About this article
Cite this article
Suzuki S, Sood K, Lizardo-Huerta JC, Taamalli S, Kobayashi K, et al. 2026. Chemistry of anthraquinone formation during fuel and biofuel combustion. Progress in Reaction Kinetics and Mechanism 51: e008 doi: 10.48130/prkm-0026-0003 

Chemistry of anthraquinone formation during fuel and biofuel combustion
- Received: 30 July 2025
- Revised: 23 December 2025
- Accepted: 16 January 2026
- Published online: 29 April 2026
Abstract: In contrast to the extensive research on polycyclic aromatic hydrocarbons (PAHs), the reaction chemistry of oxygenated PAHs (OPAHs) during combustion has received little attention, despite their highly detrimental effects. Among OPAHs, anthraquinone, a tricyclic ring structure with two ketone groups, was selected for focus in this study due to its confirmed production in various combustion processes, and no study on its formation chemistry is available in the literature. To elucidate its reaction chemistry, a multifaceted investigation (experimental, theoretical, and modeling) was employed. Fuel-rich oxidation of toluene and the pyrolysis of anisole and 4-methylanisole using a flow reactor were performed to quantify anthraquinone experimentally. Theoretical calculations were conducted for the rate parameters of molecular growth reactions from p-benzoquinone/p-naphthoquinone via Hydrogen-Abstraction-Carbon-Addition (HACA), and a combination of small oxygenated aromatics—benzaldehyde and its radicals. The sub-mechanism involving anthraquinone formation and consumption was developed and integrated with the existing model. The developed model could satisfactorily replicate both the measured data in a flow reactor and the literature data in a flame. To inspect anthraquinone reaction chemistry, kinetic analysis was conducted, demonstrating that three pathways were important for anthraquinone formation: (1) combination of small oxygenated aromatics; (2) HACA mechanism from small quinones, and (3) oxidation of PAHs. However, the predominant formation pathways varied with conditions and fuel. In a flow reactor, combination and oxidation pathways were the primary contributors to anthraquinone formation during pyrolysis and oxidation. Under flame conditions, the relative importance of these three pathways varied dynamically with the height-above-burner.
-
Key words:
- Anthraquinone /
- Combustion /
- PAHs/OPAHs /
- Kinetic modeling /
- Theoretical calculation /
- Flow reactor