-
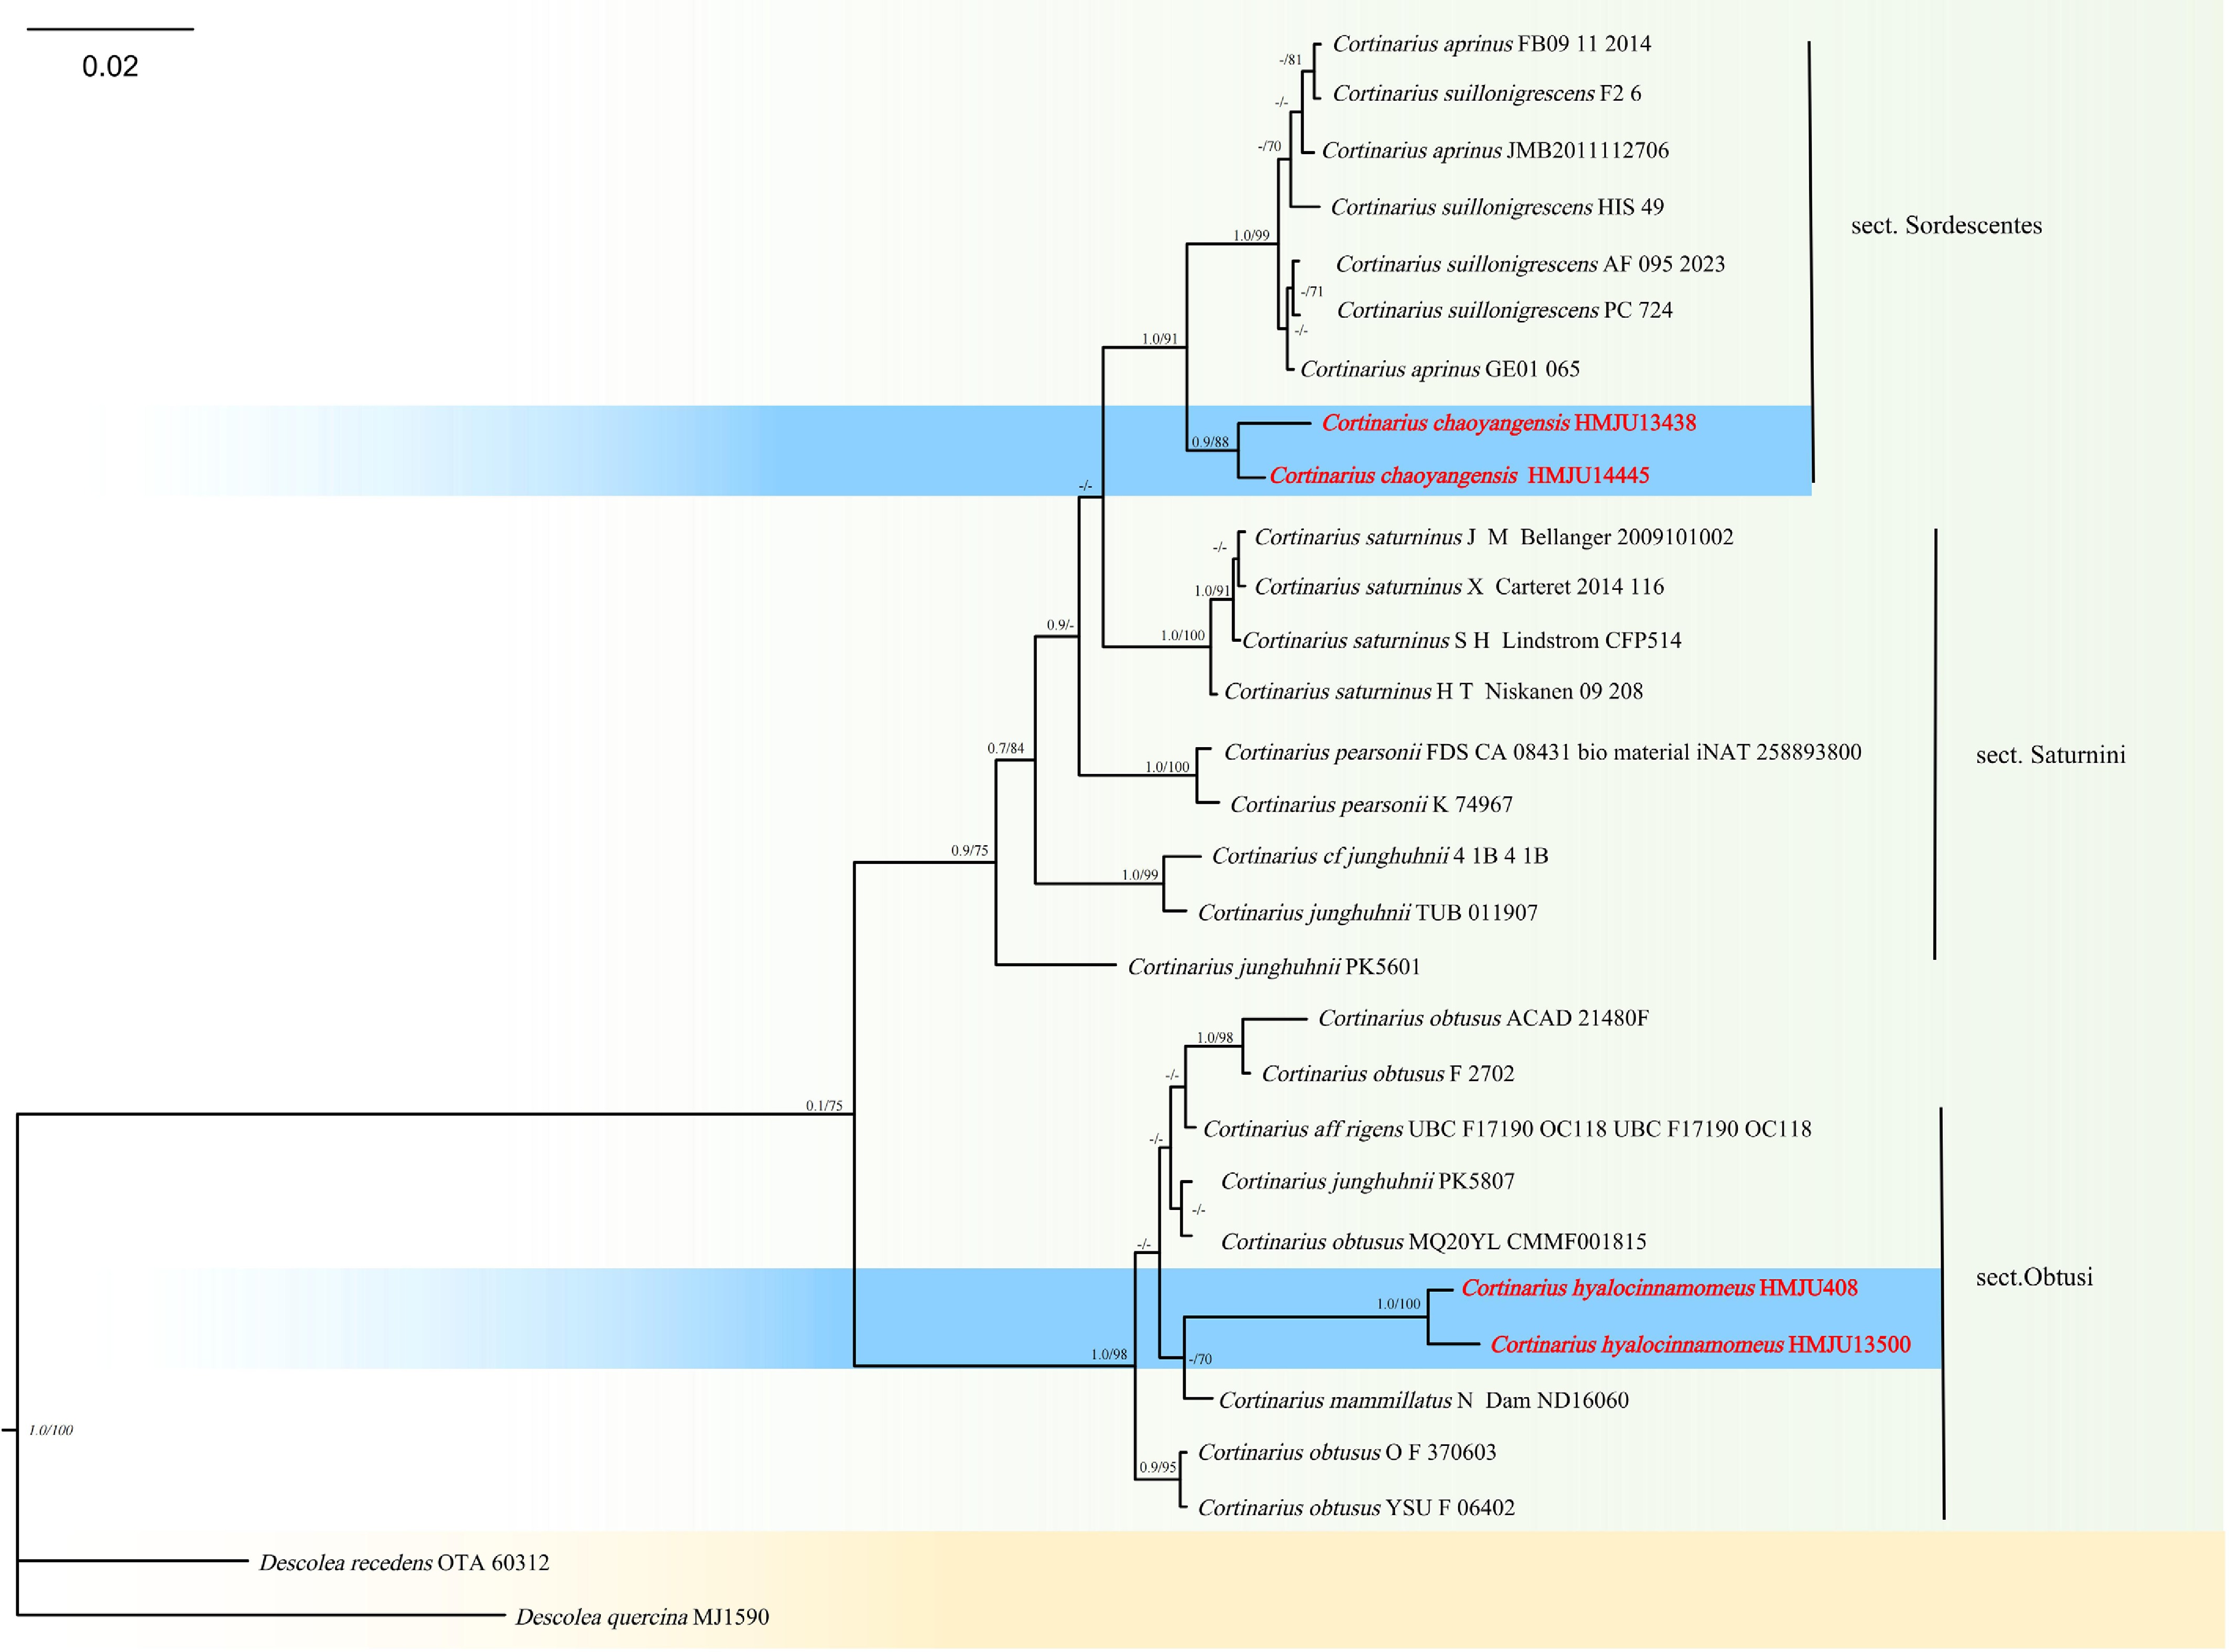
Figure 1.
Phylogram of Maximum Likelihood phylogenetic analysis based on combined ITS and nLSU sequences. The analysis includes 30 strains; total characters: 1,394 (ITS: 709, nLSU: 685). Descolea quercina (MJ1590) and Descolea recedens (OTA 60312) were used as the outgroup taxa. The best model used was TIM2 + F + R2. Estimated base frequencies were as follows: A = 0.248, C = 0.209, G = 0.212, T = 0.331. Bootstrap values for ML equal to or greater than 70% and BYPP values greater than 0.70 are labelled on the nodes. The type strains are in bold.
-
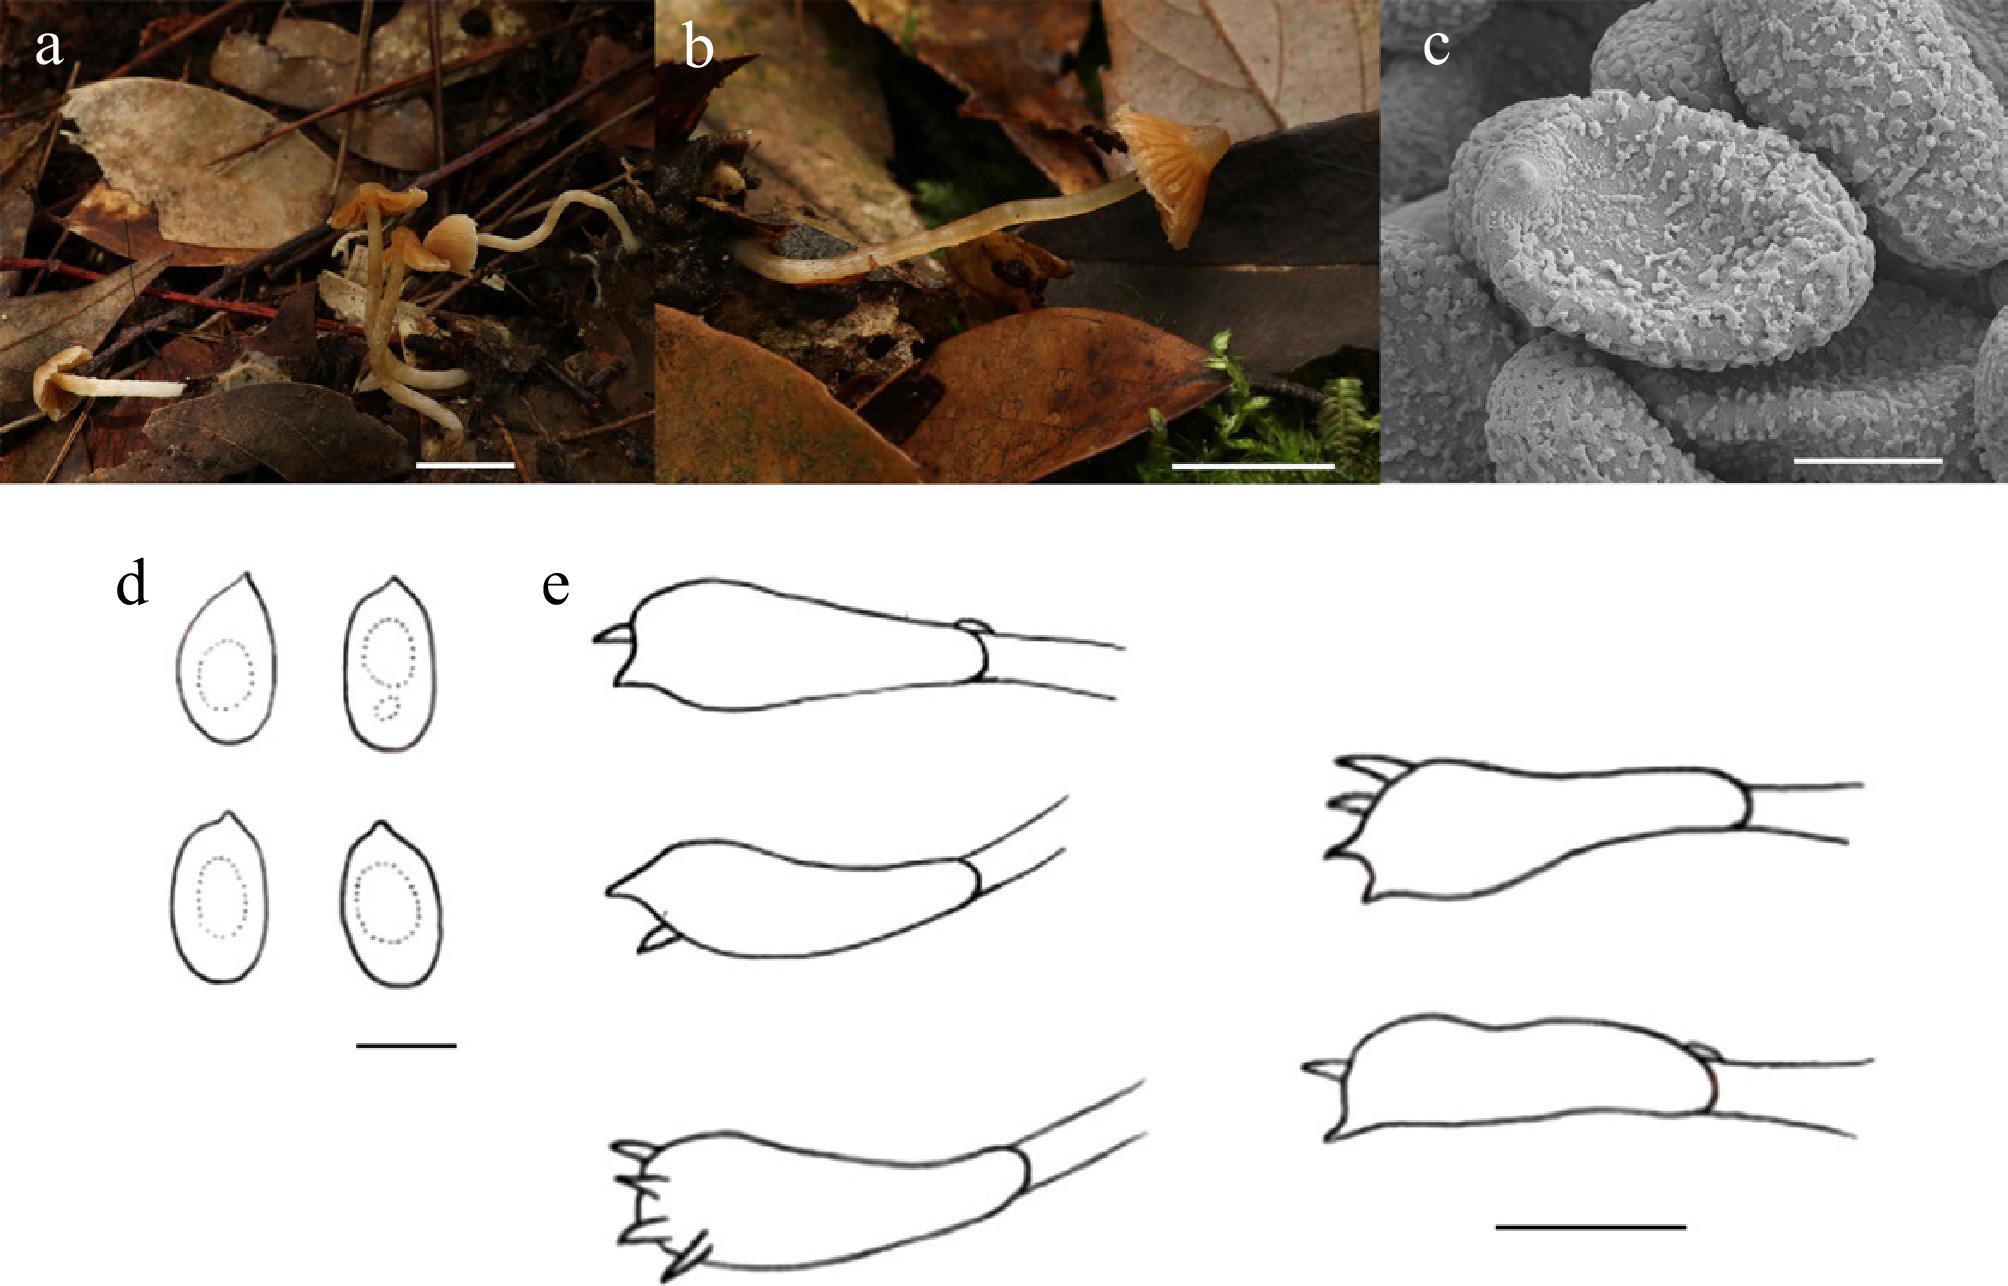
Figure 2.
Cortinarius hyalocinnamomeus (HMJU 408, holotype). (a), (b) Basidiocarps. (c) SEM images of basidiospores. (d) Basidiospores. (e) Basidia. Scale bar: (a), (b) 1 cm; (c) 3 µm; (d) 5 µm; and (e) 10 µm.
-
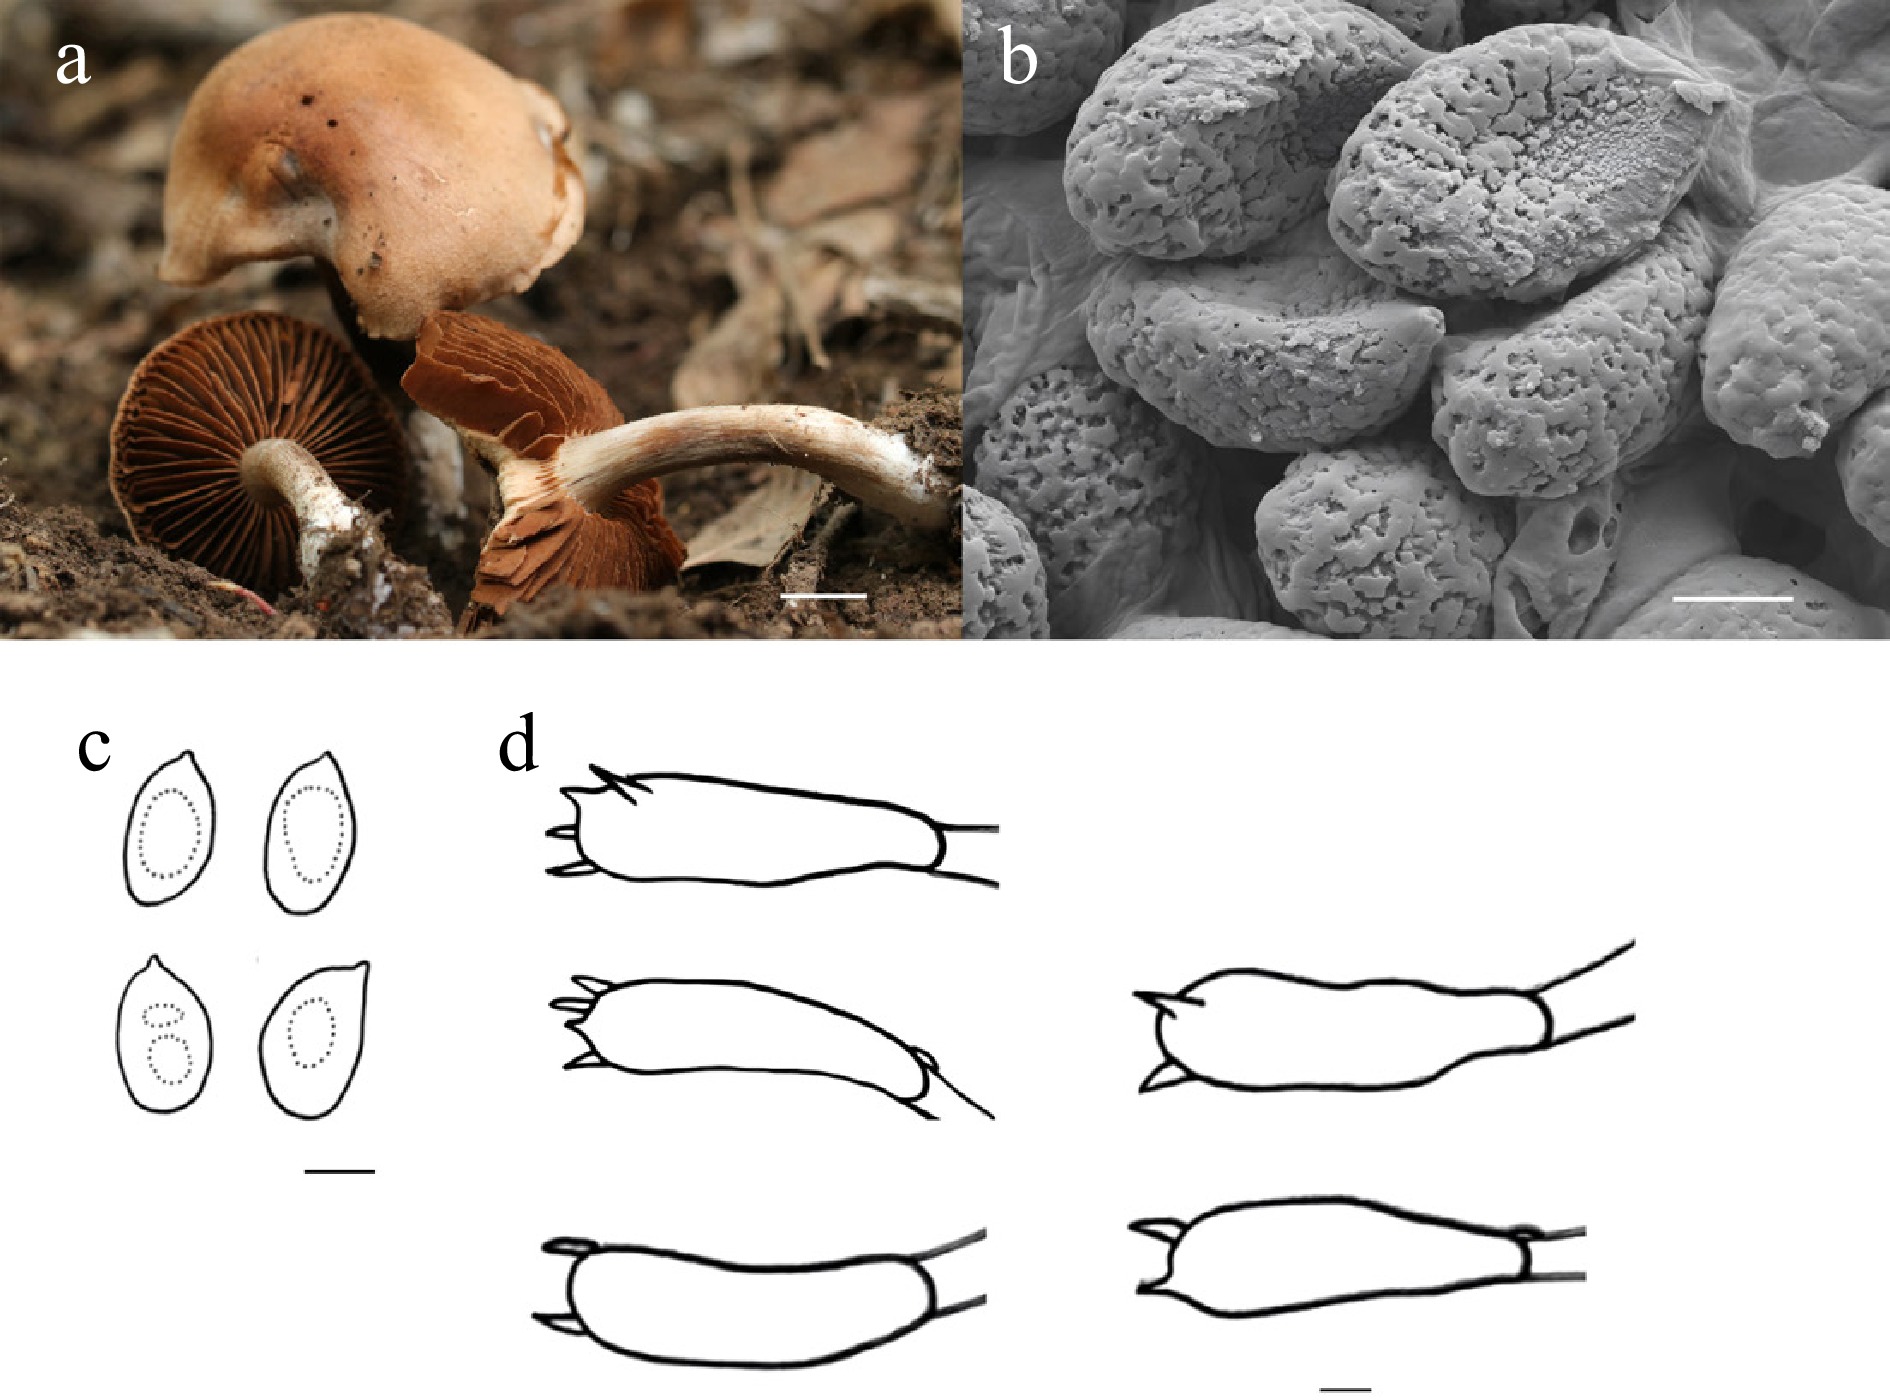
Figure 3.
Cortinarius chaoyangensis (HMJU 13438, holotype). (a) Basidiocarps. (b) SEM images of basidiospores. (c) Basidiospores. (d) Basidia. Scale bars: (a) 1 cm; (b)–(d) 5 µm.
-
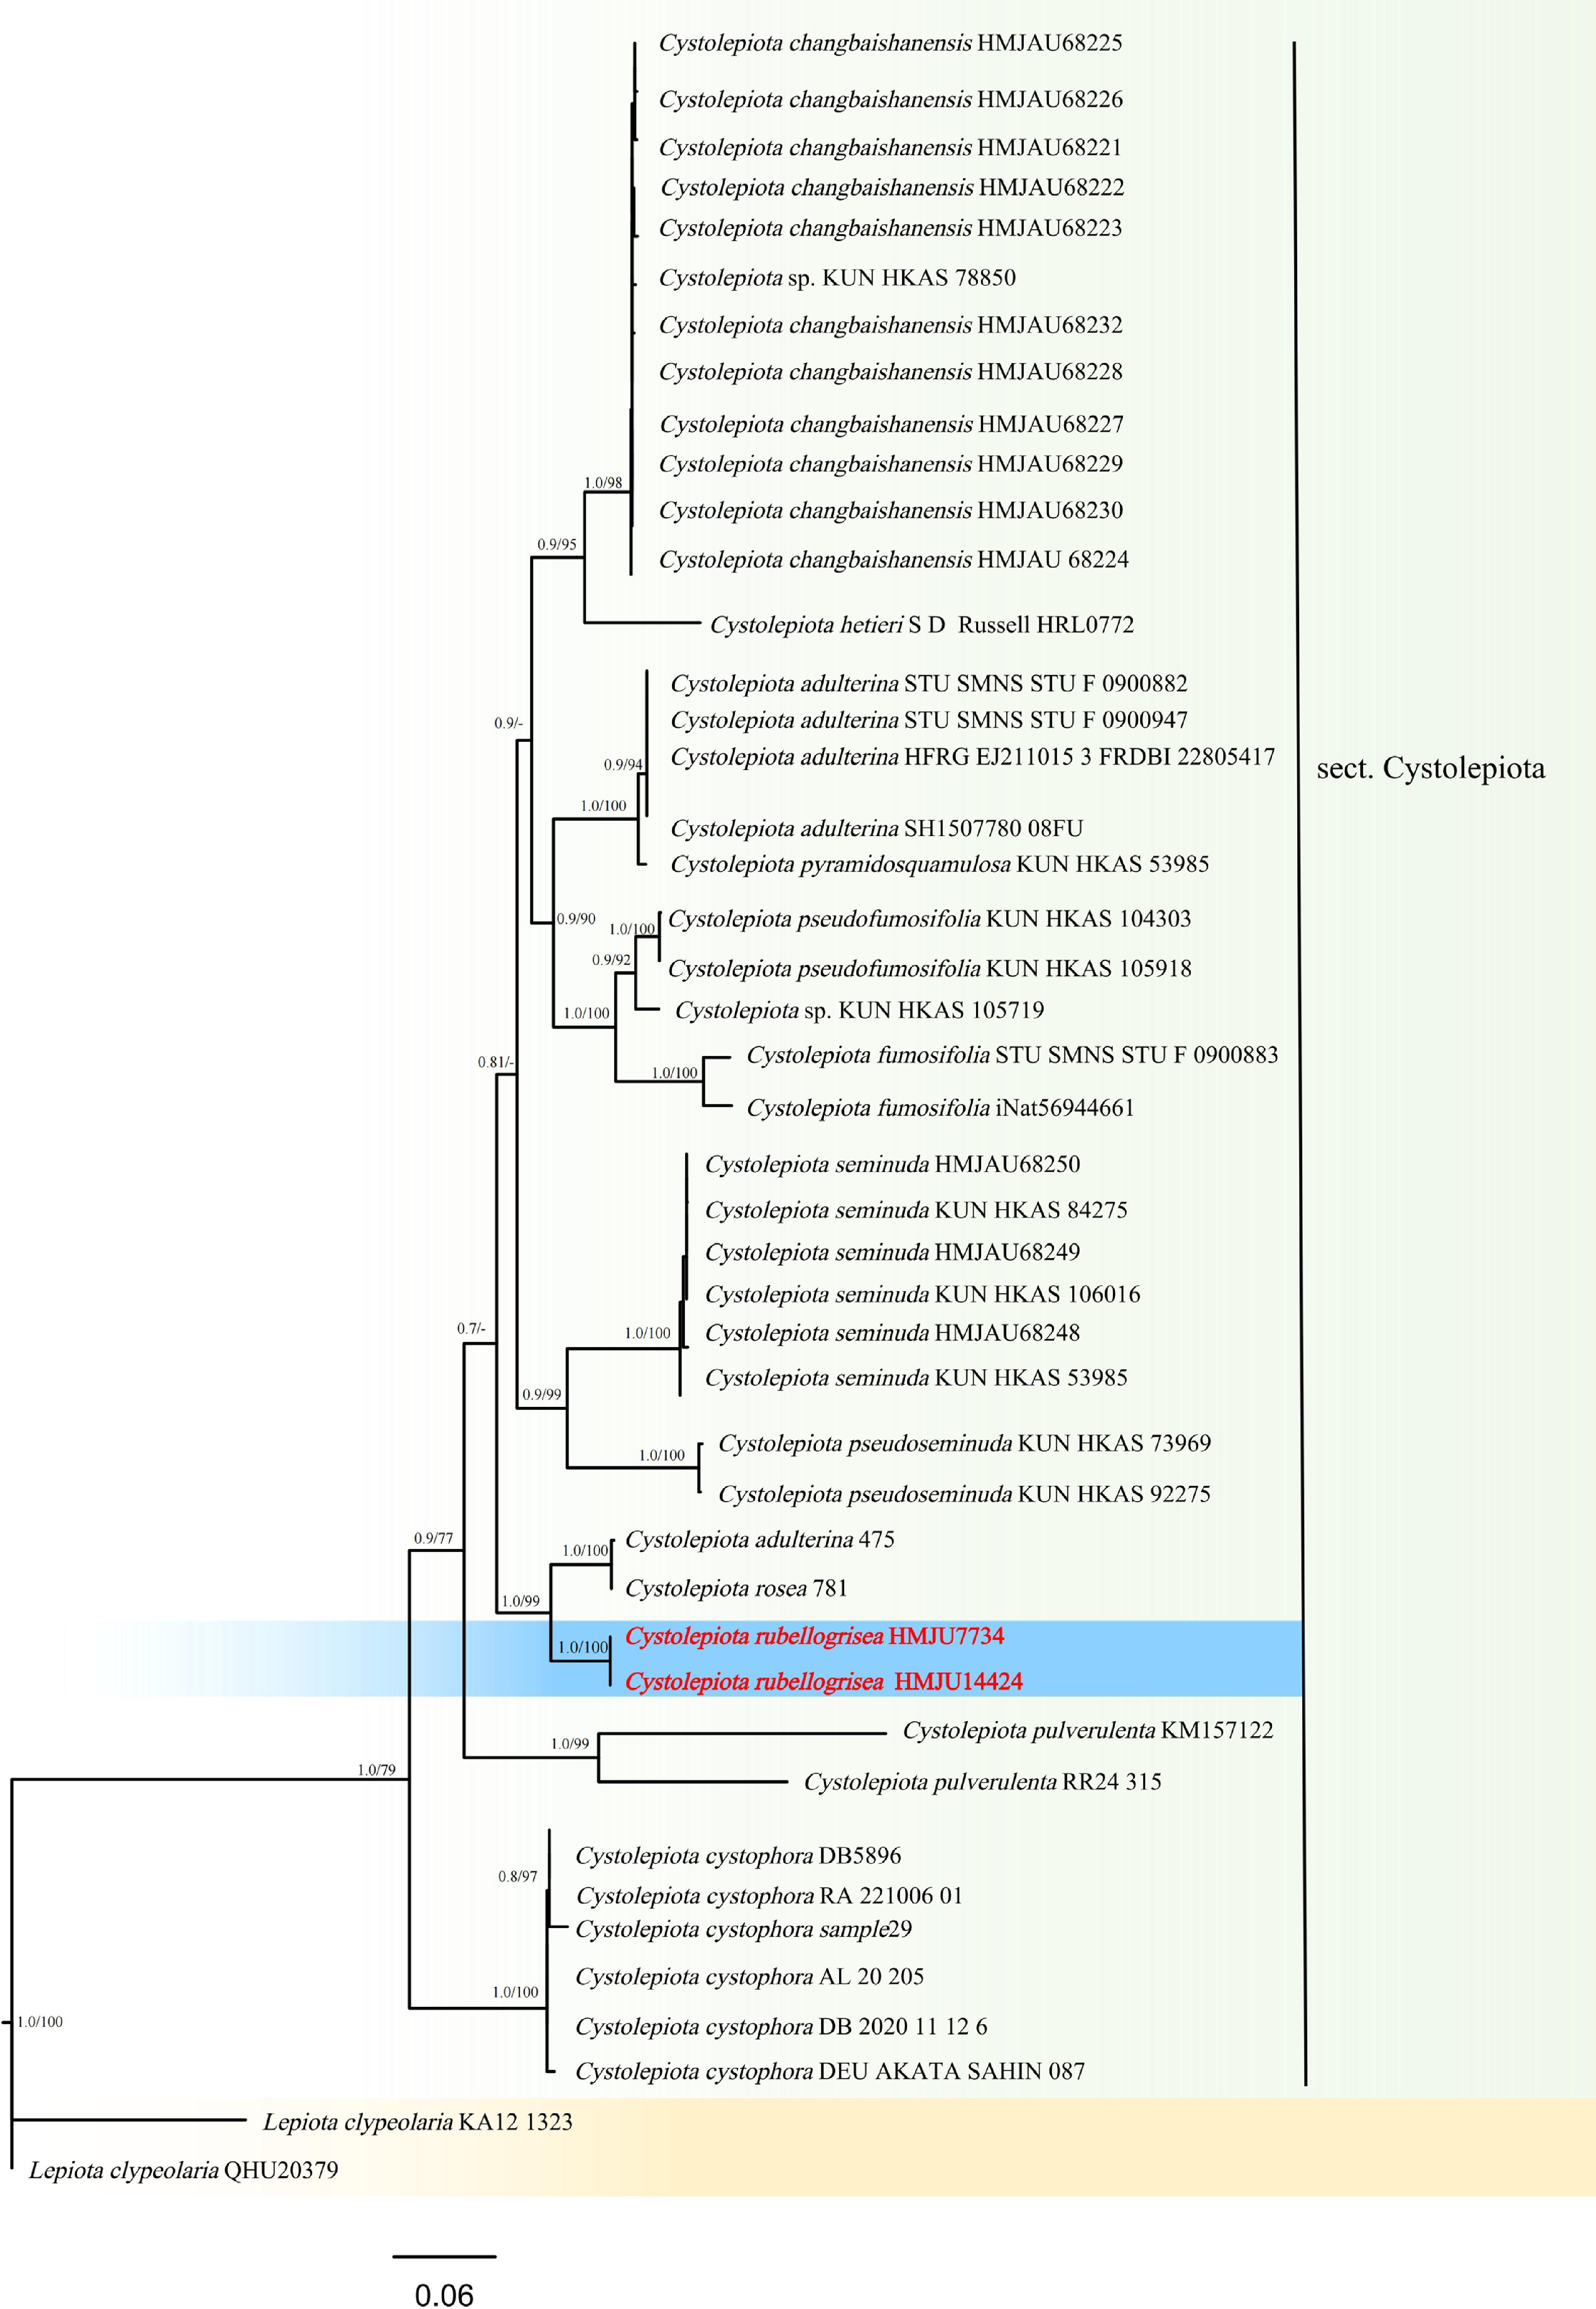
Figure 4.
Phylogram of Maximum Likelihood phylogenetic analysis based on combined ITS, nLSU, rpb2, and tef-1α sequences. The analysis includes 59 strains; total characters: 2,464 (ITS: 517, nLSU: 824, rpb2:616, tef-1α: 507). Lepiota clypeolaria (Bull.) P. Kumm. (KA12 1323) and Le. clypeolaria (QHU20379) were used as the outgroup taxa. The best model was TIM2e + I + G4. Estimated base frequencies were as follows: A = 0.251, C = 0.225, G = 0.253, T = 0.272. Bootstrap values for ML equal to or greater than 70% and BYPP values equal to or greater than 0.70 are labelled on the nodes. The type strains are in bold.
-
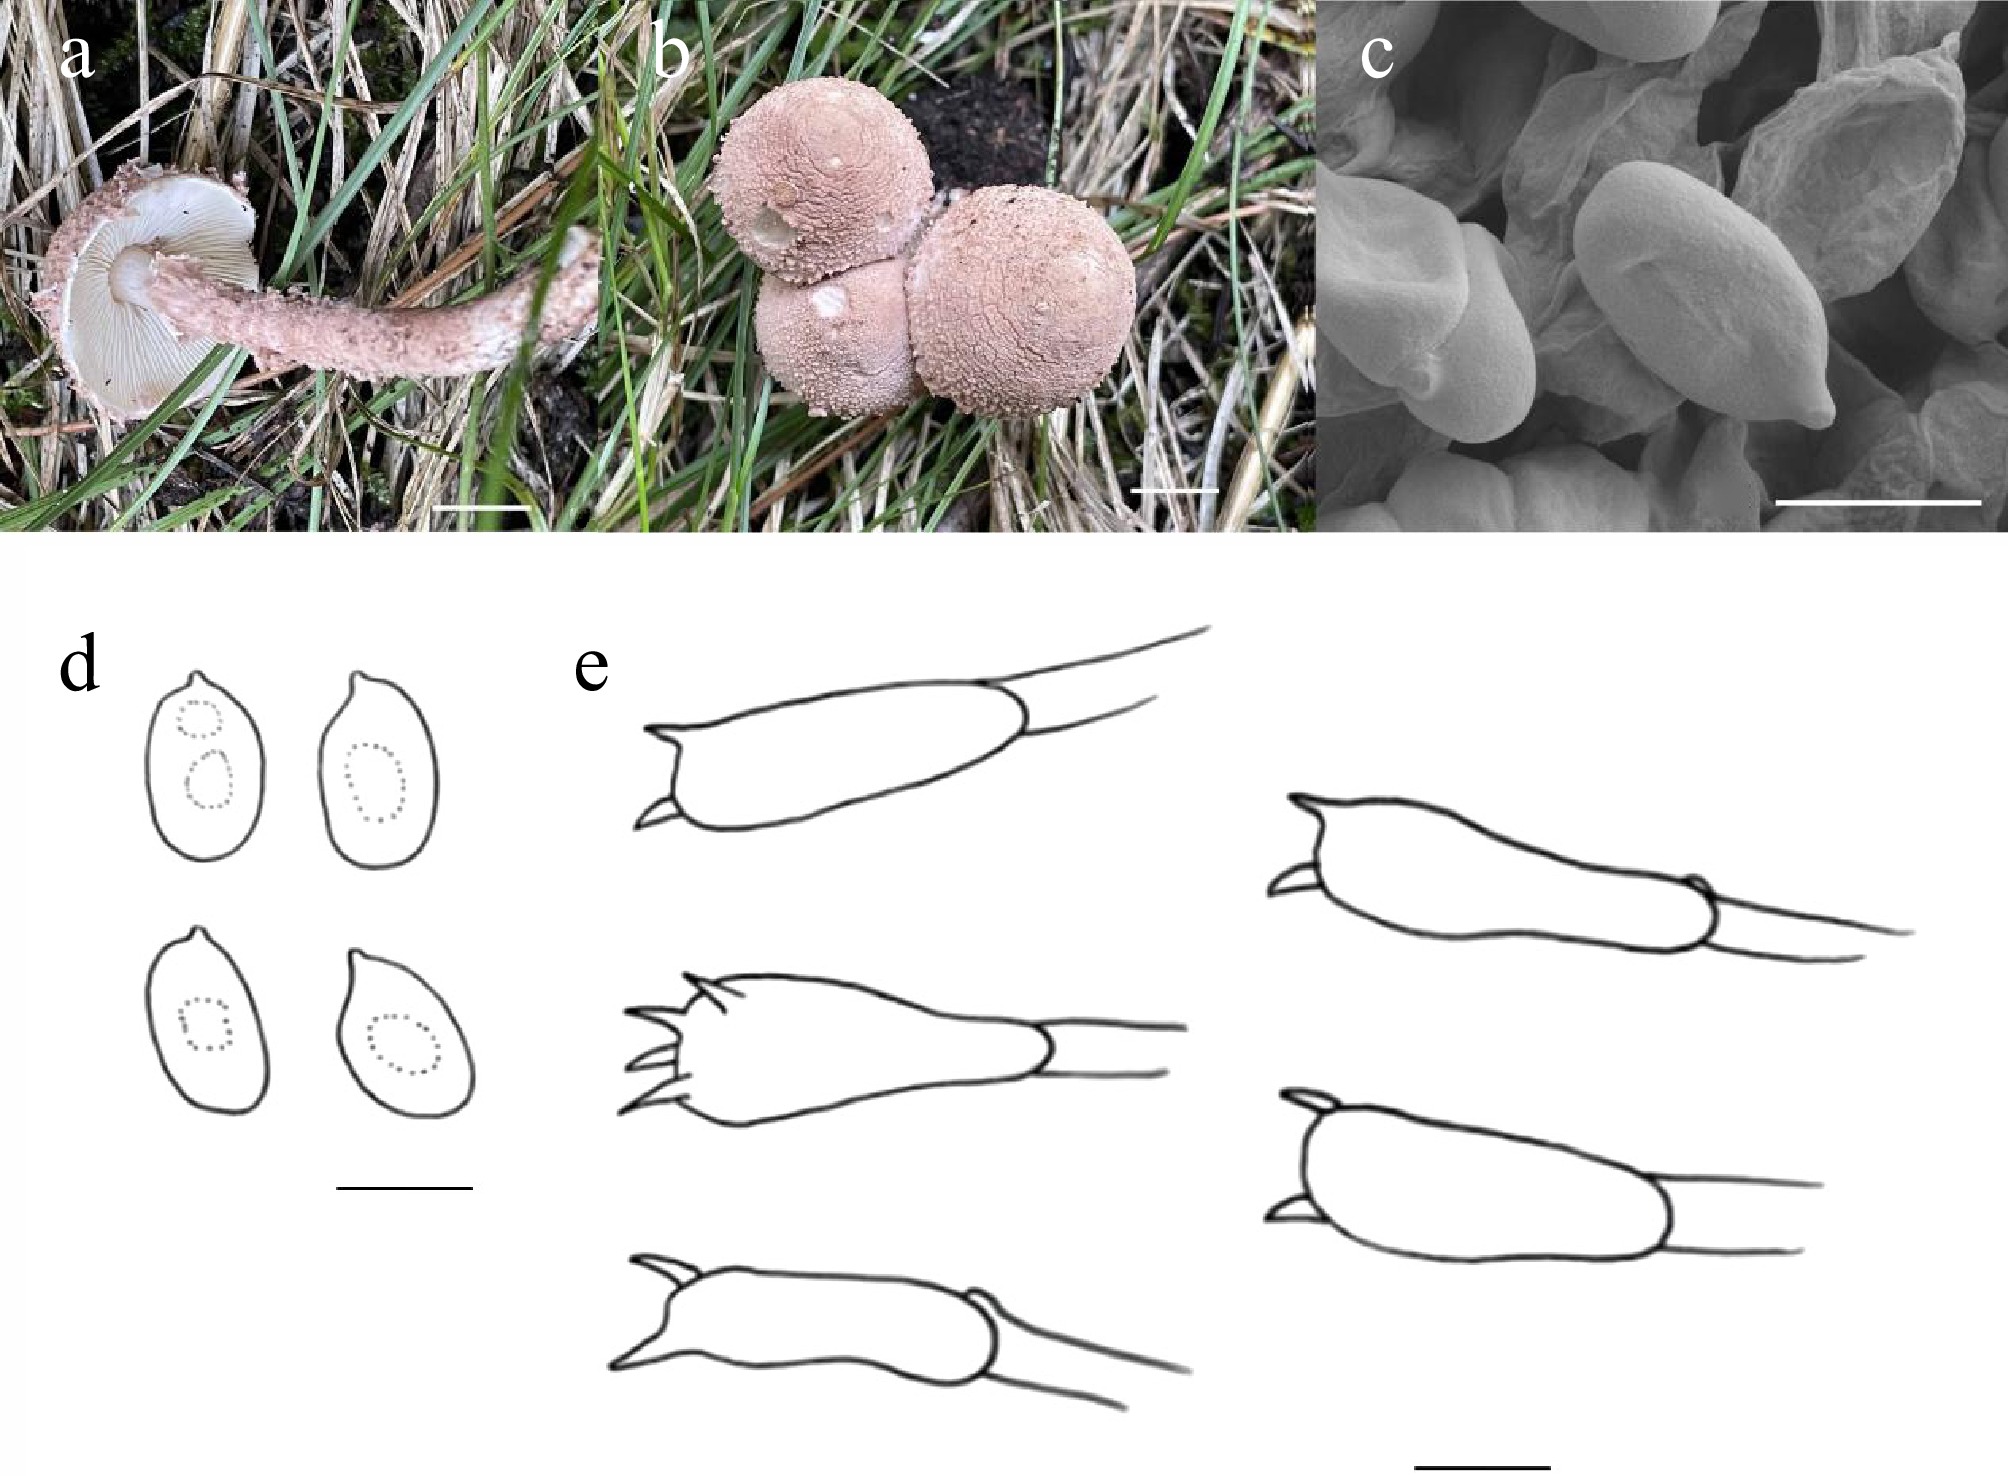
Figure 5.
Cystolepiota rubellogrisea (HMJU 7734, holotype). (a), (b) Basidiocarps. (c) SEM images of basidiospores. (d) Basidiospores. (e) Basidia. Scale bars: (a), (b) 1 cm; (c), (d) 3 µm; and (e) 5 µm.
-
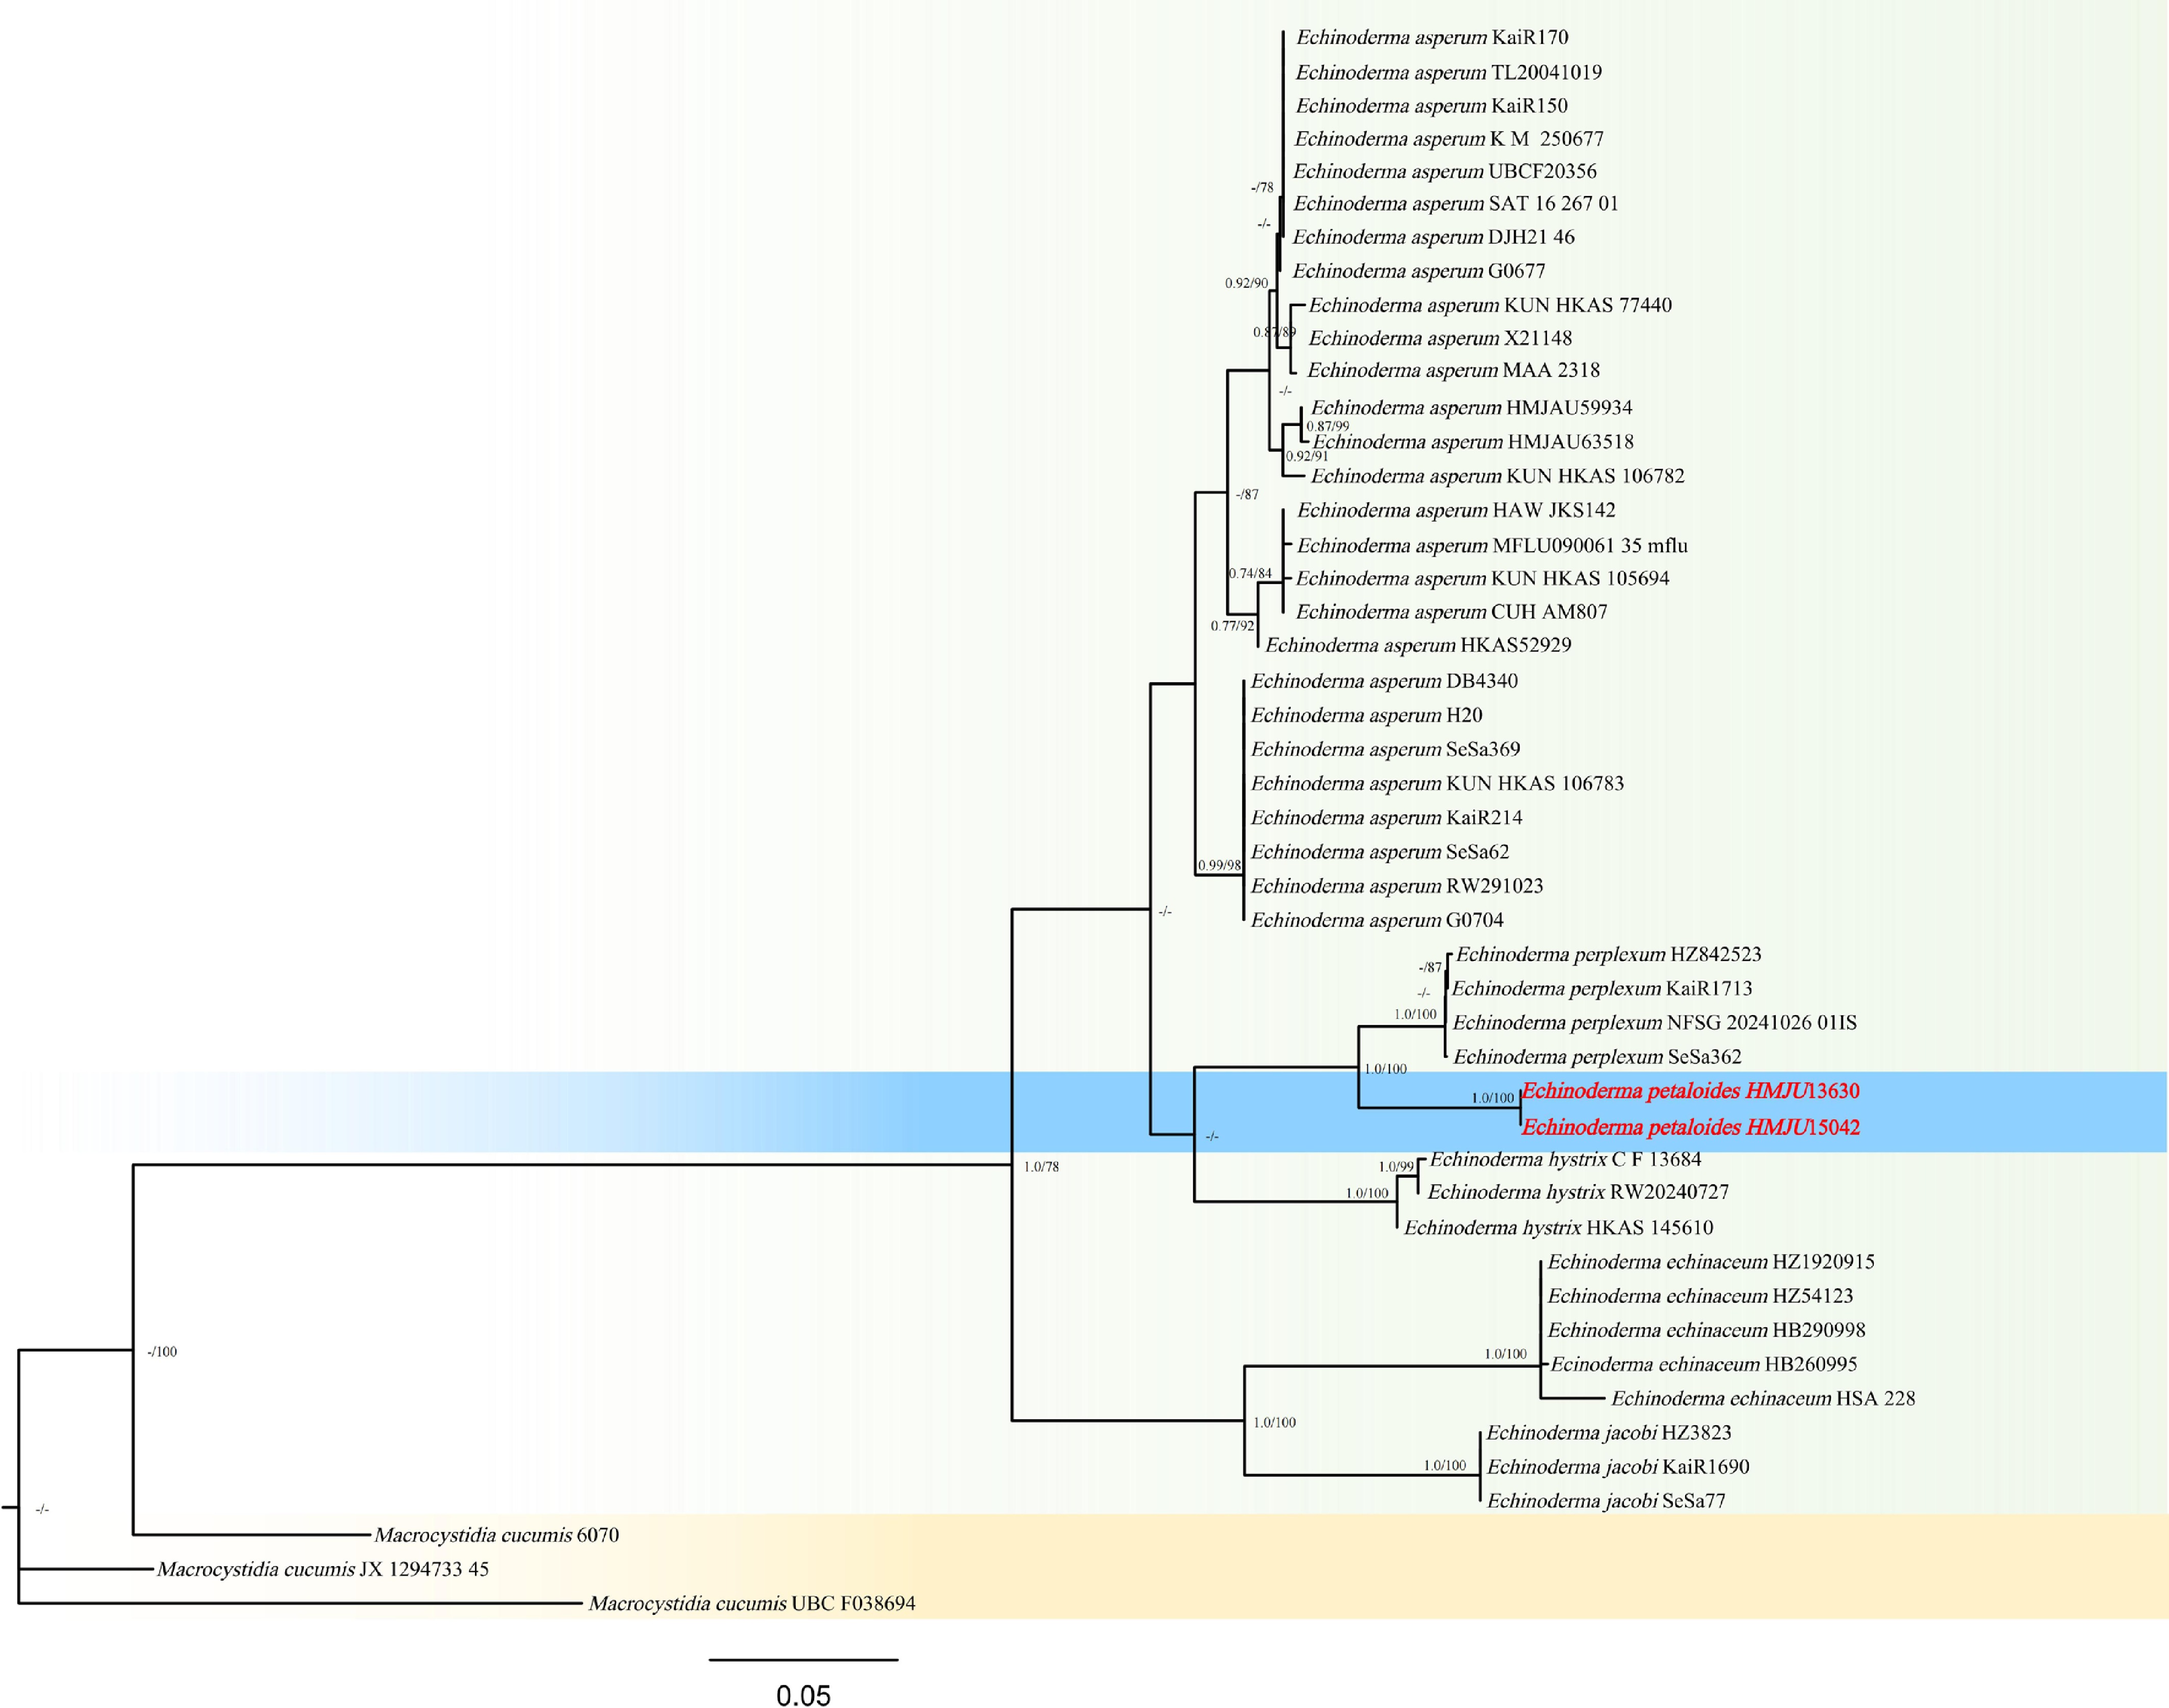
Figure 6.
Phylogram of Maximum Likelihood phylogenetic analysis based on combined ITS, nLSU, rpb2. The analysis includes 48 strains; total characters: 2,170 (ITS: 724, nLSU: 789, rpb2: 657). Macrocystidia cucumis (Pers.) Joss. (6070), and Ma. cucumis (JX 1294733 45), and Ma. cucumis (UBCF038694) were used as the outgroup taxa. The best model was TIM3e + G4. Estimated base frequencies were as follows: A = 0.250, C = 0.250, G = 0.250, T = 0.250. Bootstrap values for ML equal to or greater than 70% and BYPP values equal to or greater than 0.70 are labelled on the nodes. The type strains are in bold.
-
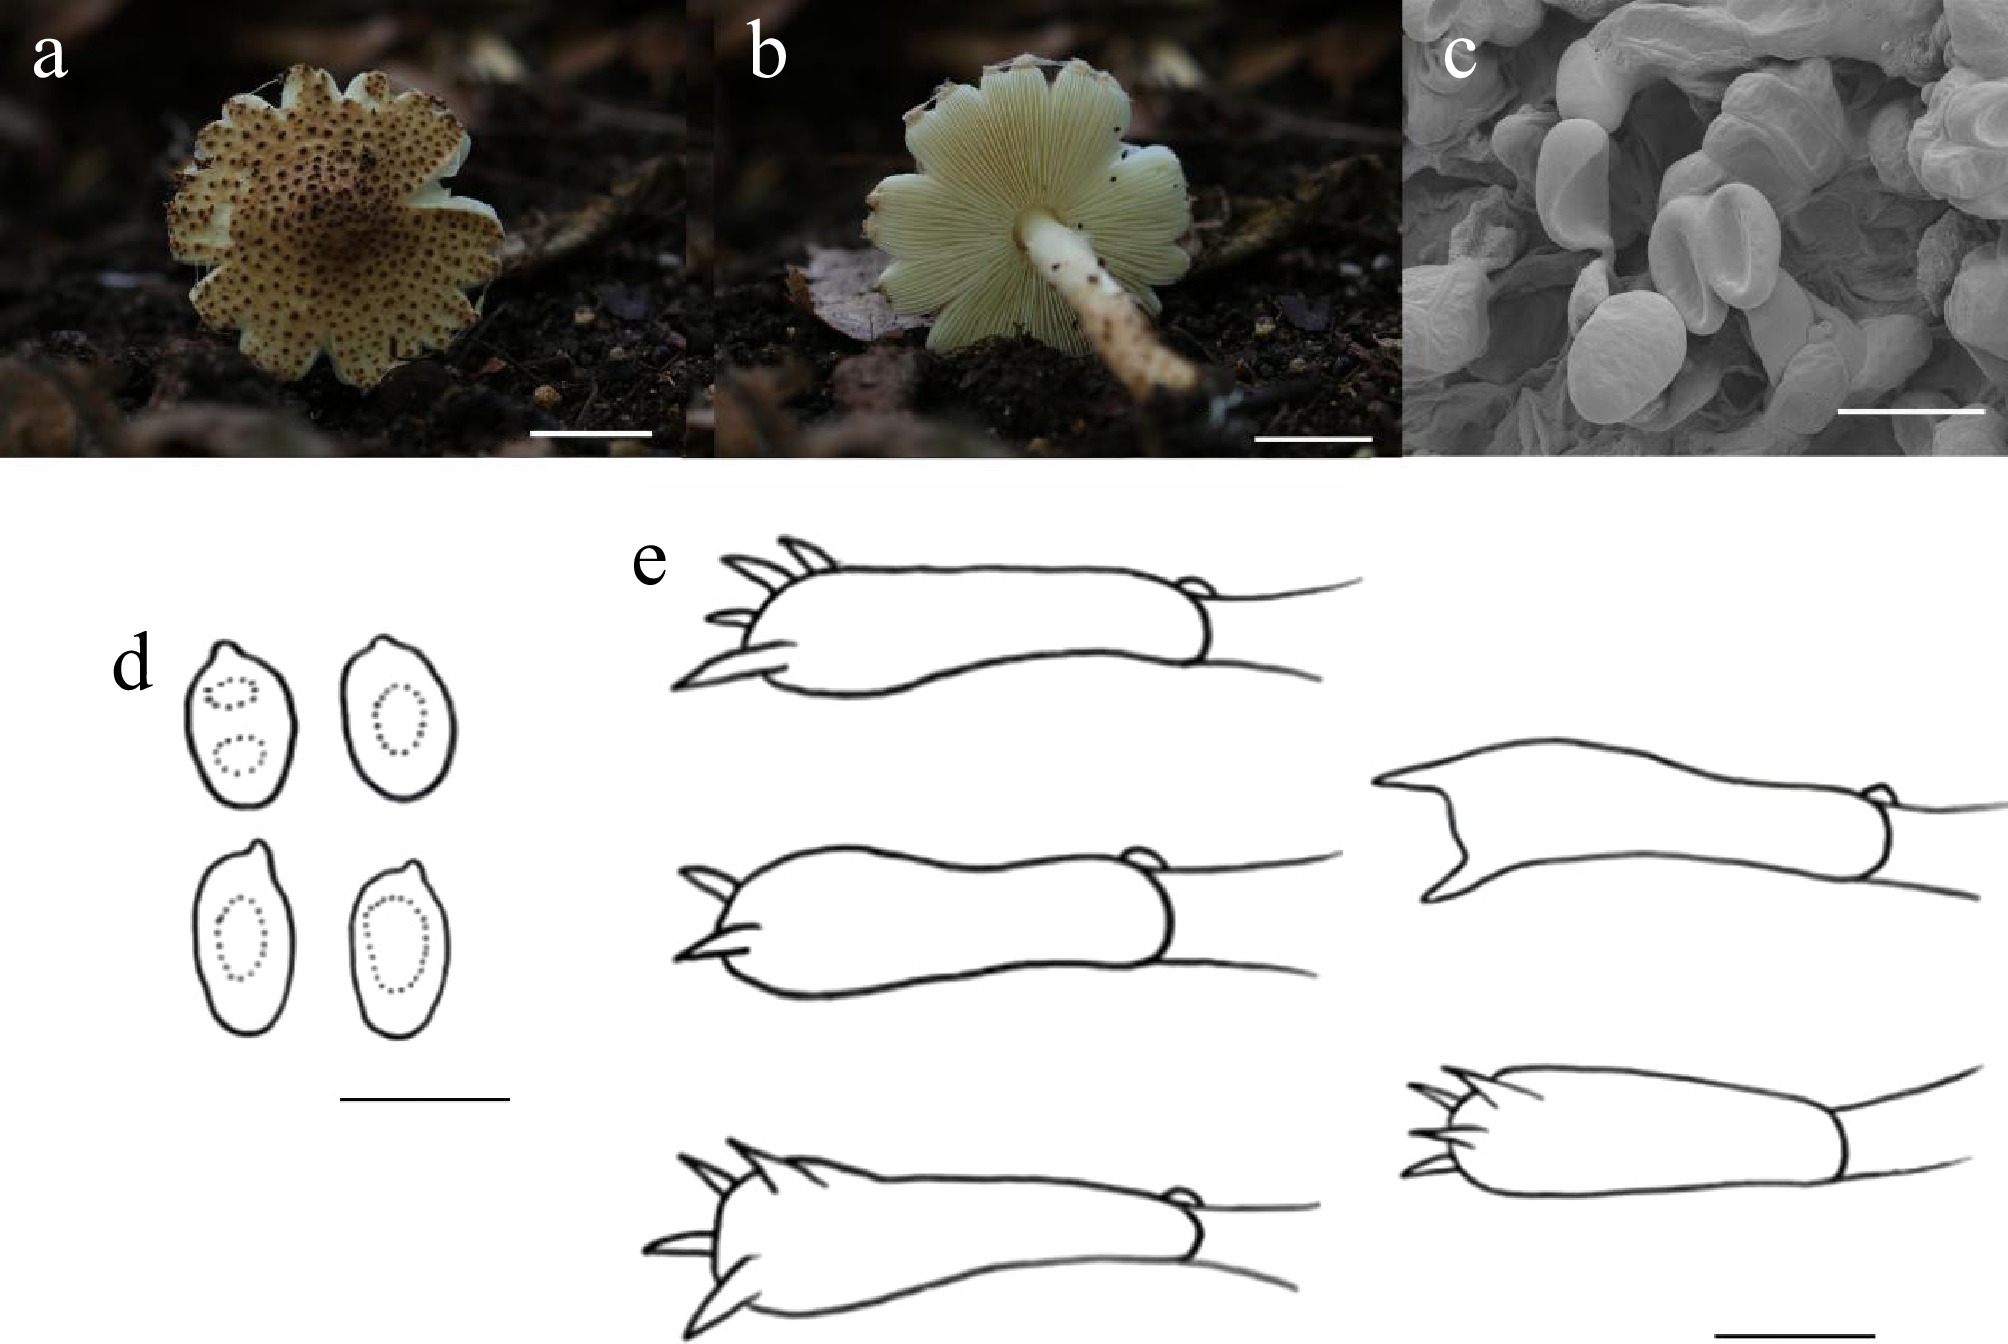
Figure 7.
Echinoderma petaloides (HMJU13630, holotype). (a), (b) Basidiocarps. (c) SEM images of basidiospores. (d) Basidiospores. (e) Basidia. Scale bars: (a), (b) 1 cm; (c)–(e) 5 µm.
-
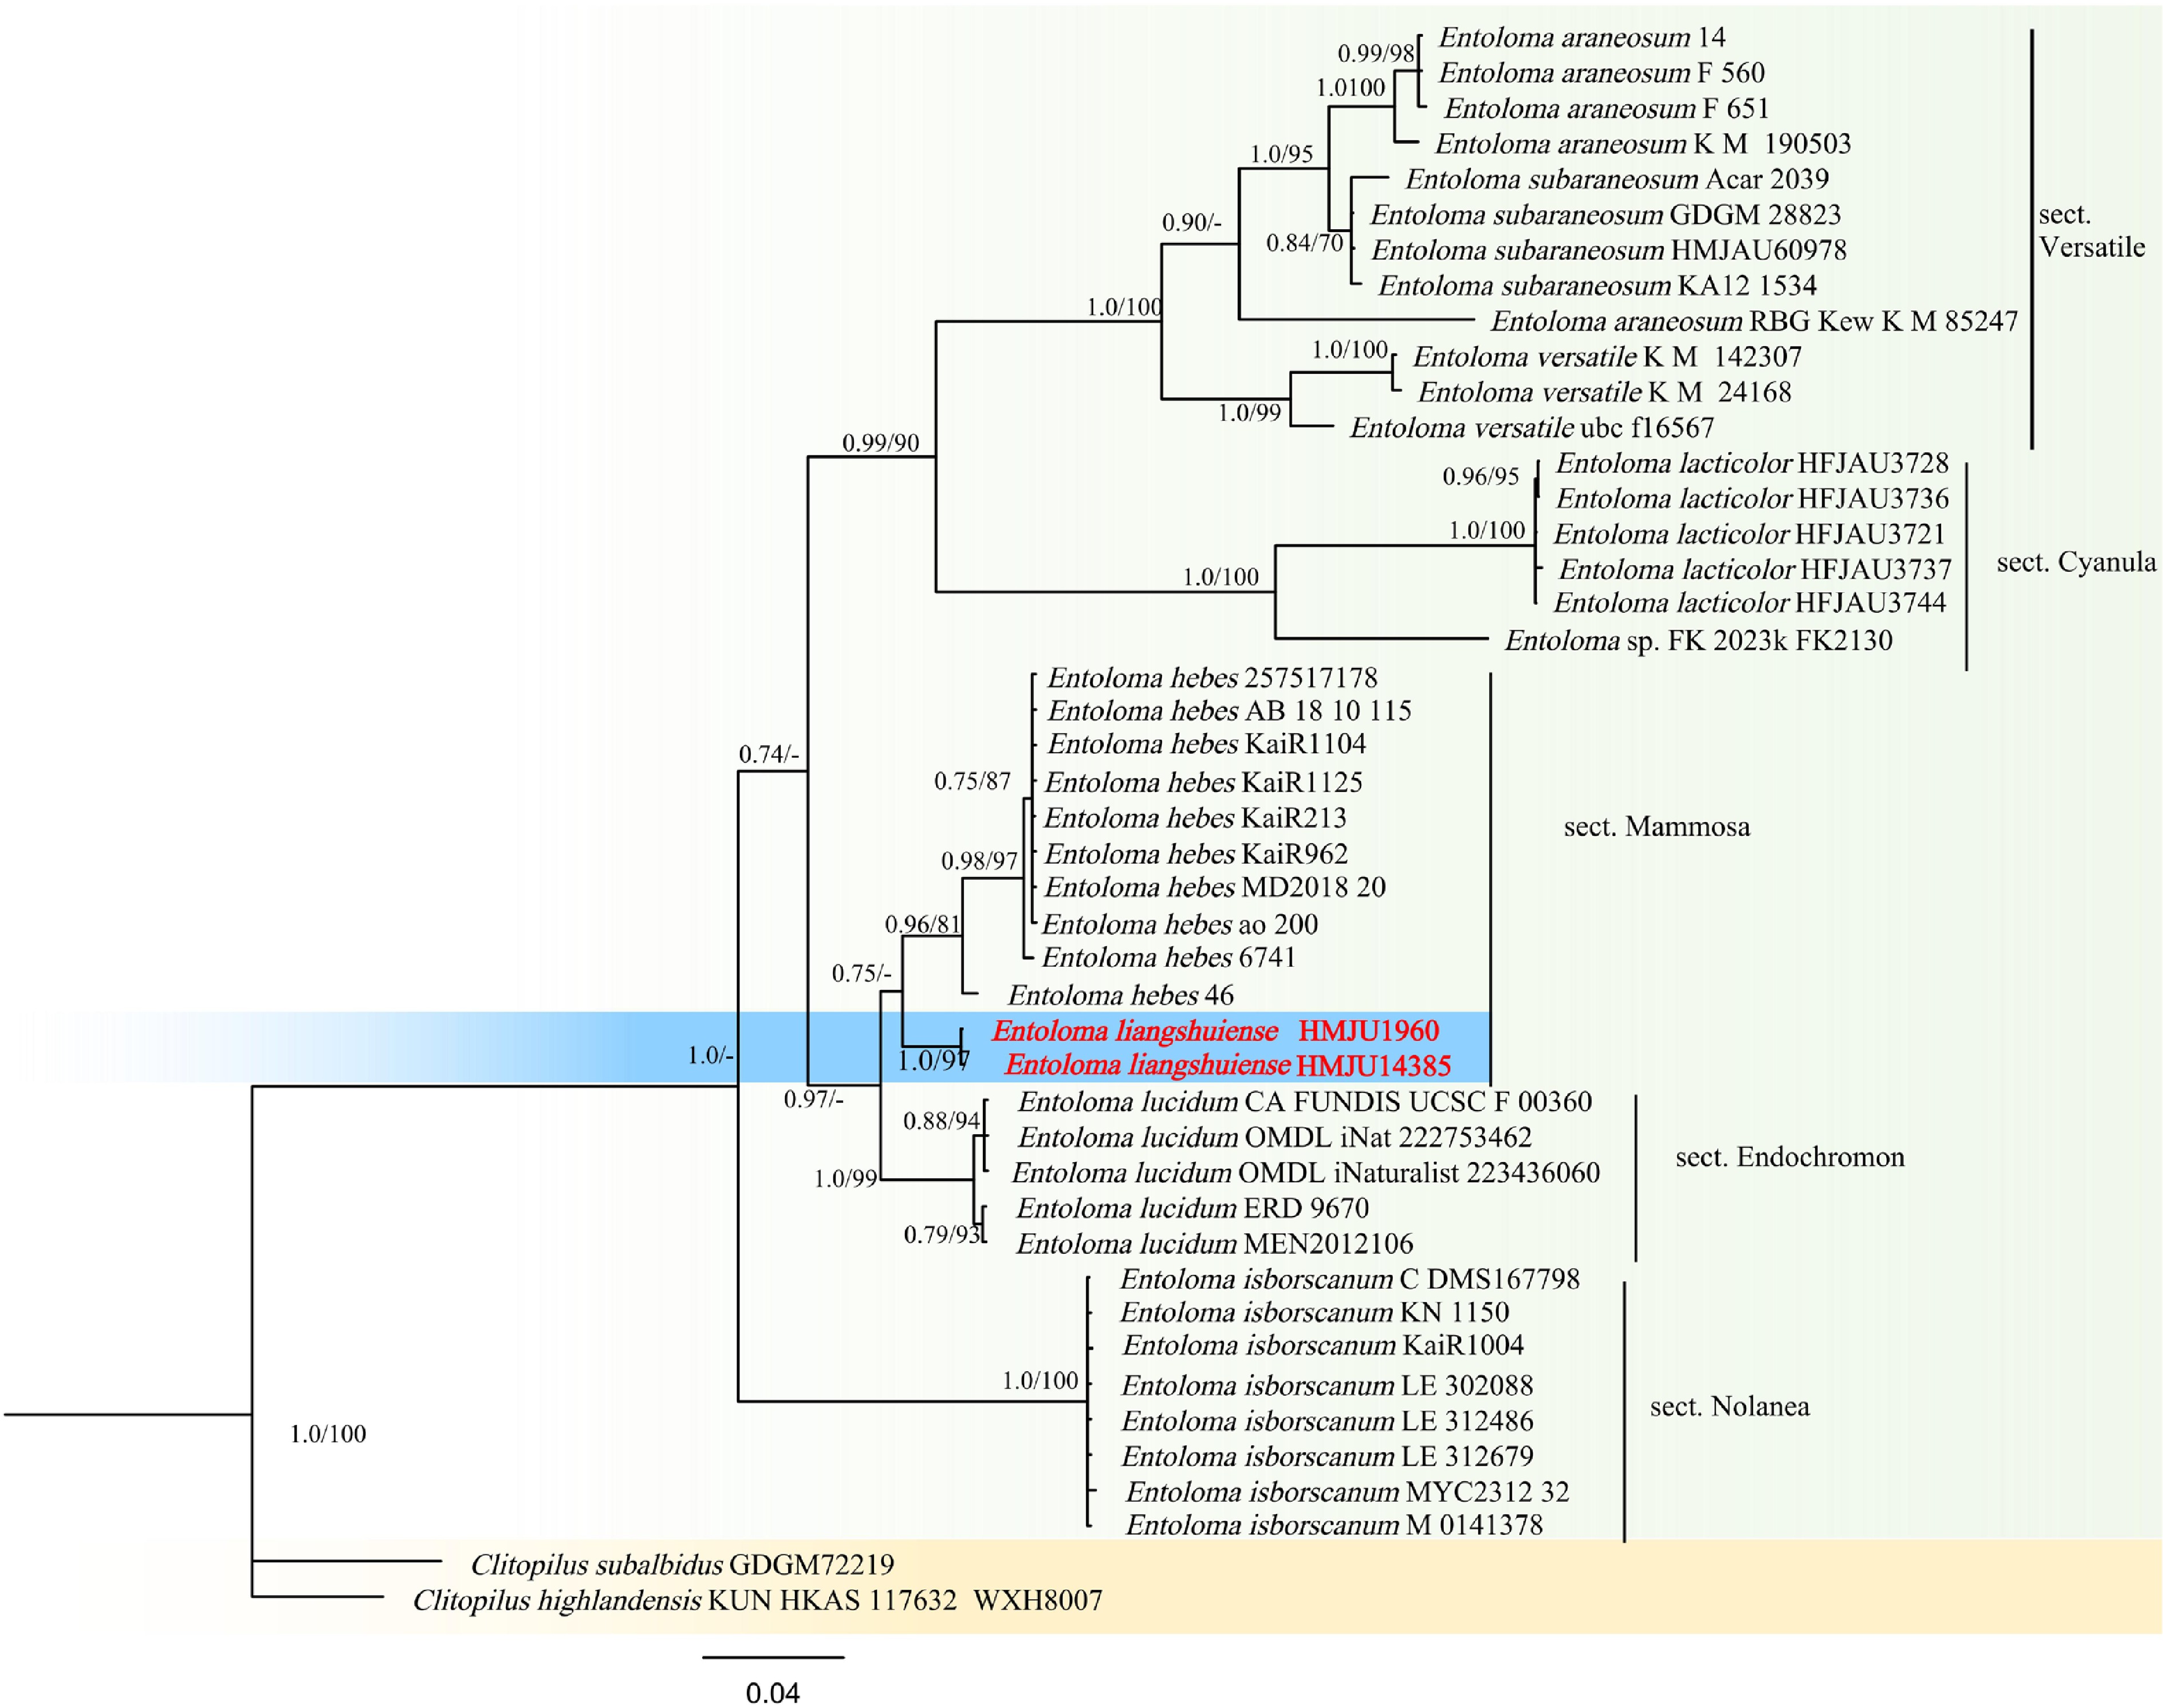
Figure 8.
Phylogram of Maximum Likelihood phylogenetic analysis based on combined ITS, nLSU, rpb2. The analysis includes 46 strains; total characters: 1,741 (ITS: 627, nLSU: 570, rpb2: 544). Clitopilus highlandensis (KUN HKAS 117632 WXH8007) and Clitopilus subalbidus (GDGM72219) were used as the outgroup taxa. The best model was TIM2 + G4 + F. Estimated base frequencies were as follows: A = 0.274, C = 0.193, G = 0.221, T = 0.312. Bootstrap values for ML equal to or greater than 70% and BYPP values greater than 0.70 are labelled on the nodes. Type strains are highlighted in bold
-
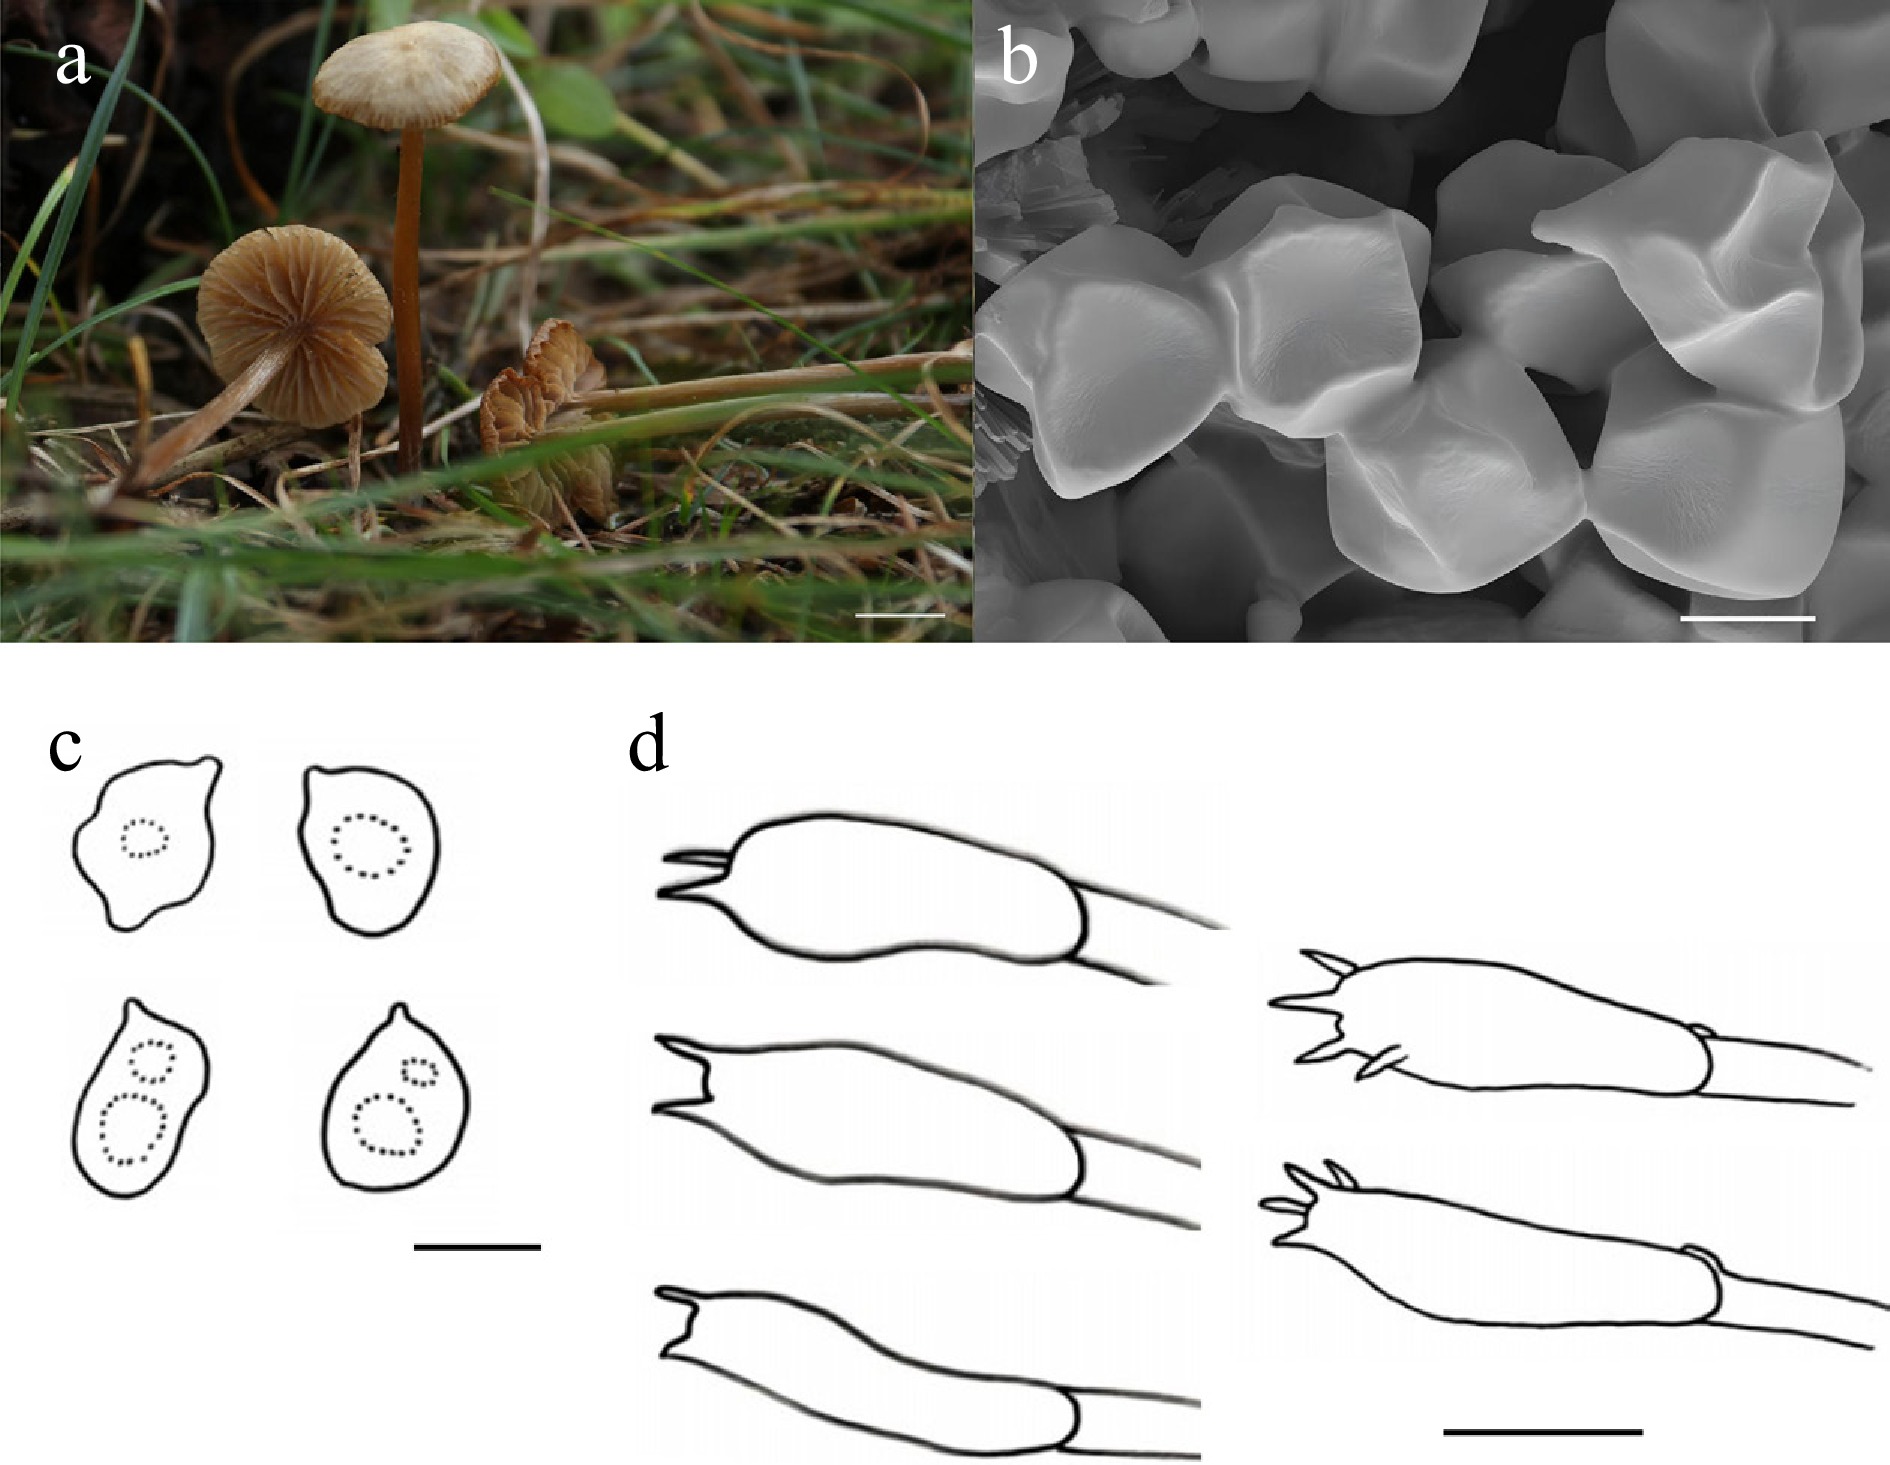
Figure 9.
Entoloma liangshuiense (HMJU 1960, holotype). (a) Basidiocarps. (b) SEM images of basidiospores. (c) Basidiospores. (d) Basidia. Scale bars: (a) 1cm; (b)–(d) 5 µm.
-
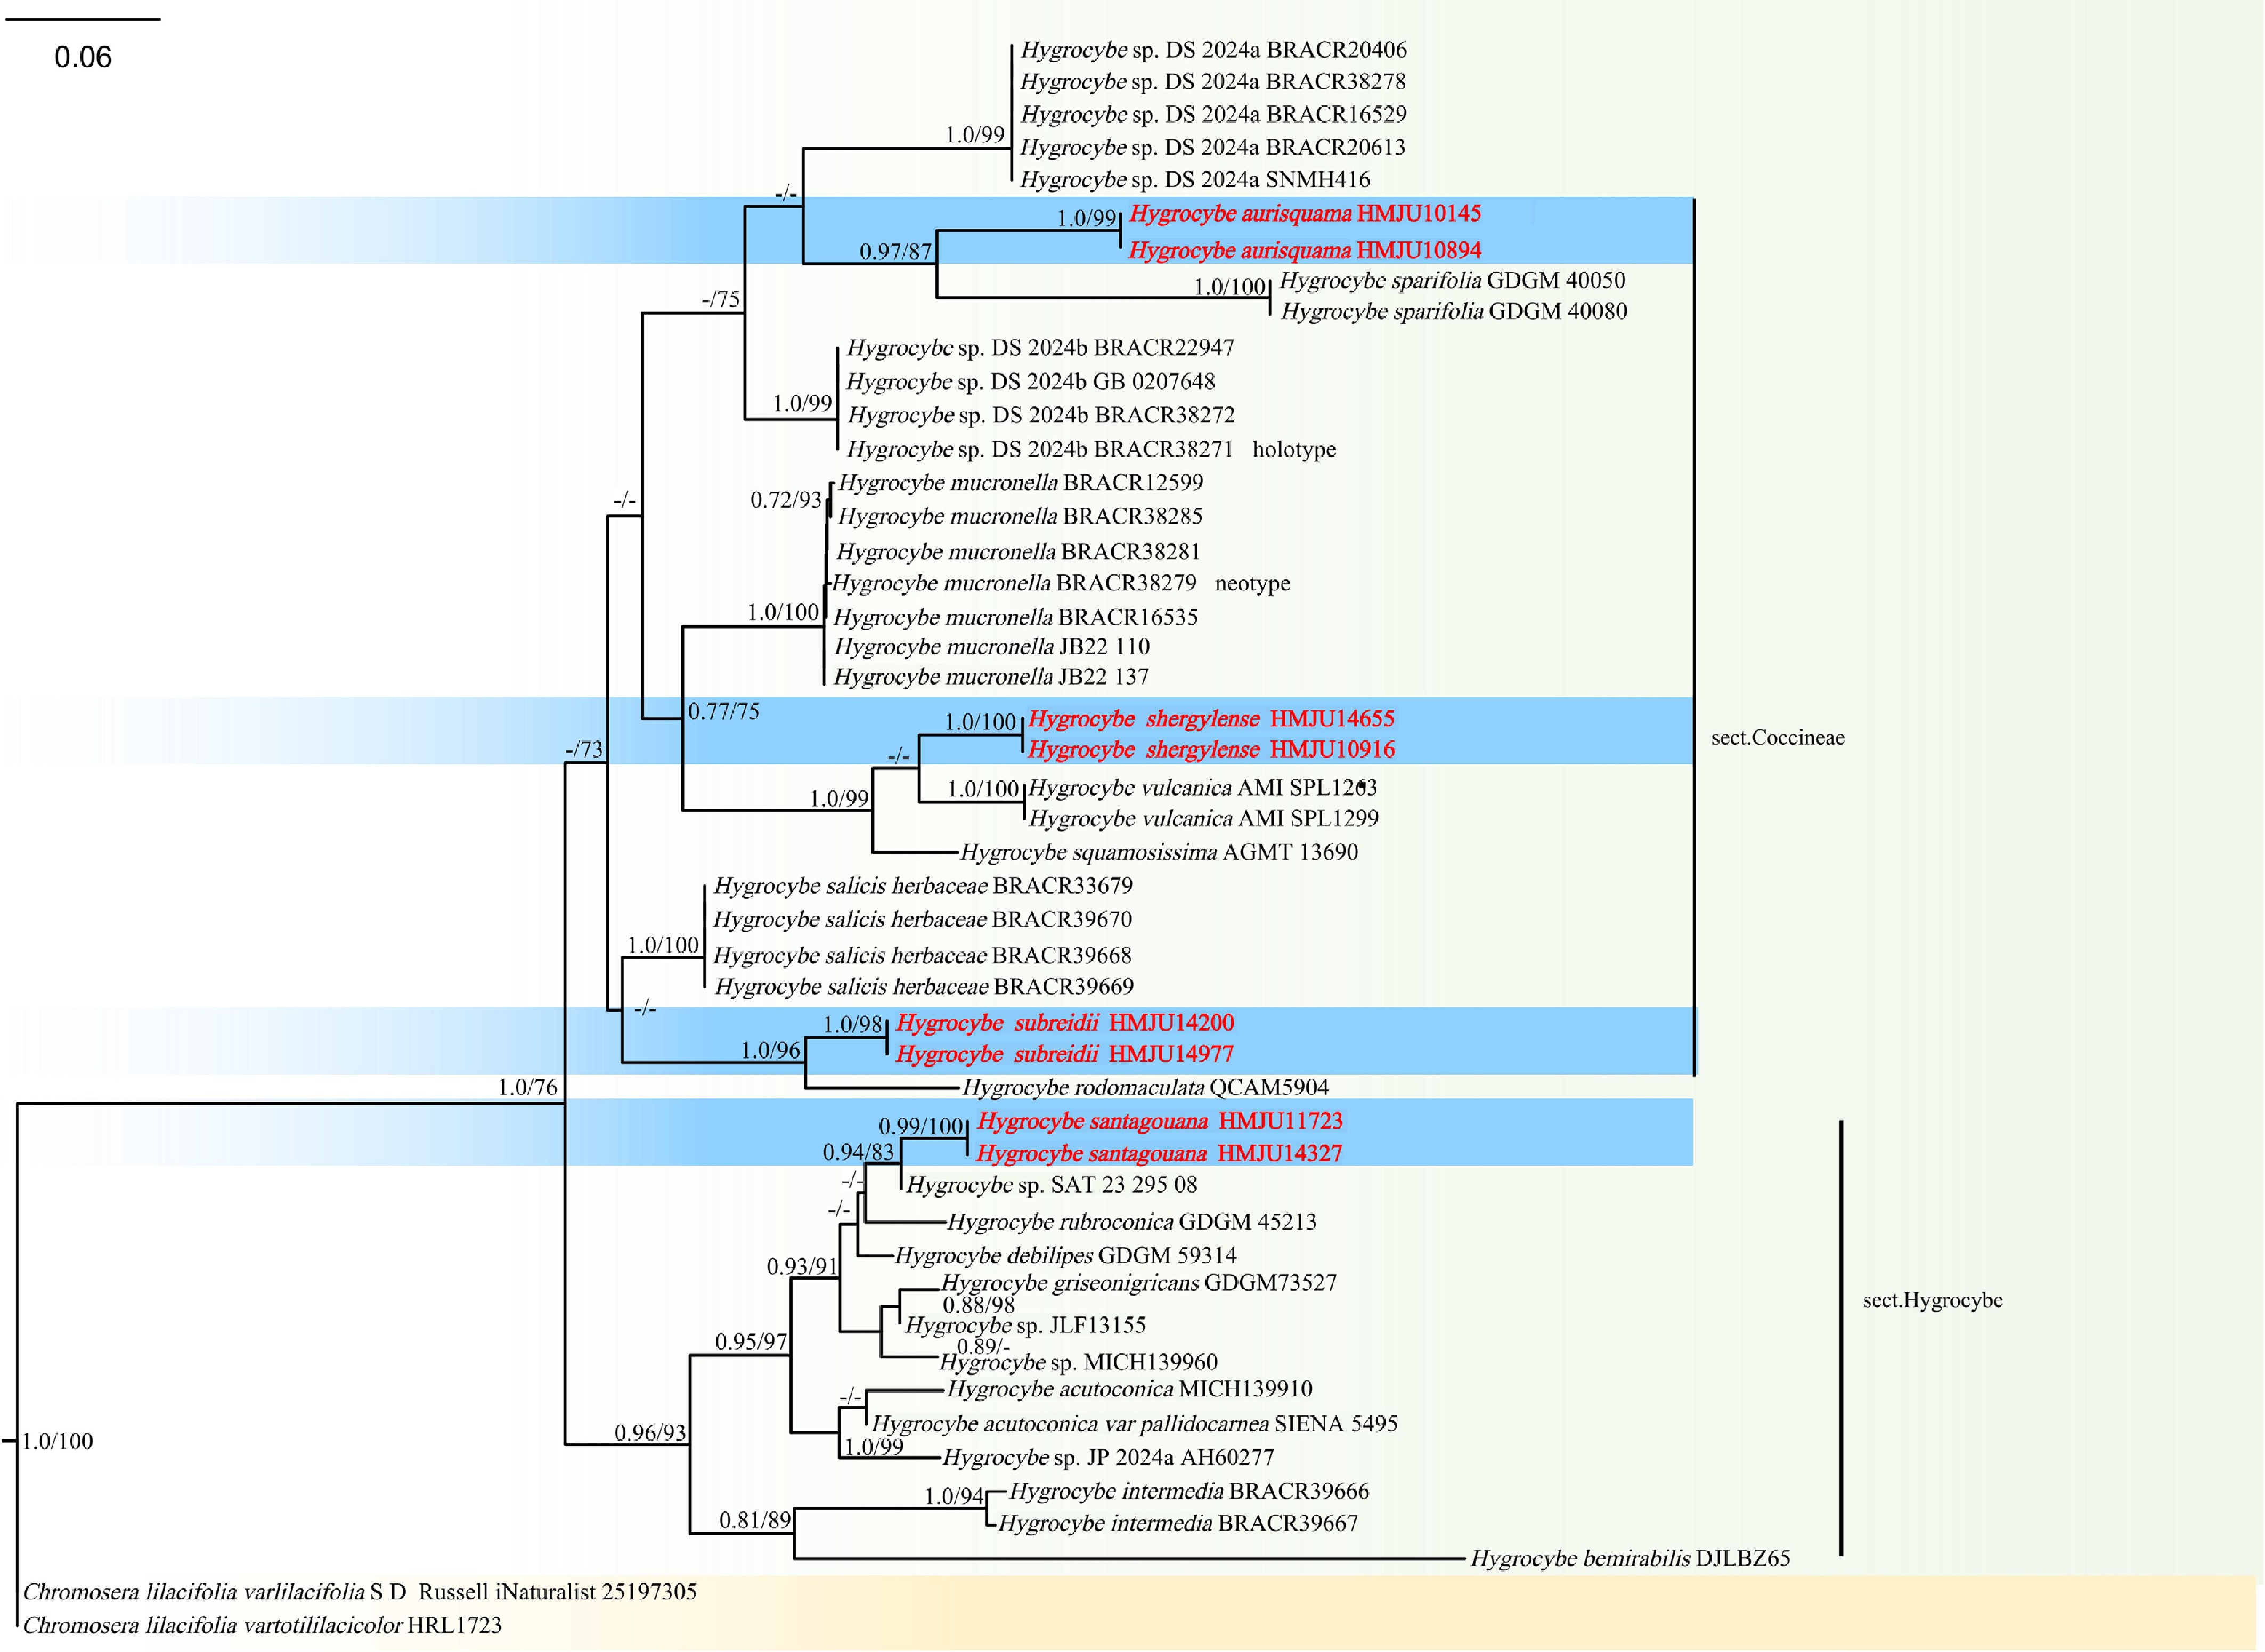
Figure 10.
Phylogram of Maximum Likelihood phylogenetic analysis based on combined ITS, nLSU, rpb2, and tef-1α sequences. The analysis includes 48 strains; total characters: 3,501 (ITS: 278, nLSU: 789, rpb2:1891, tef-1α: 543). Chromosera lilacifolia (varlilacifolia S D Russell iNaturalist 25197305) and Chromosera lilacifolia (vartotililacicolor HRL1723) were used as the outgroup taxa. The the best model being TIM2e + I + G4. Estimated base frequencies were as follows: A = 0.259, C = 0.221, G = 0.267, T = 0.253. Bootstrap values for ML equal to or greater than 70% and BYPP values equal to or greater than 0.70 are labelled on the nodes.The type strains are in bold.
-
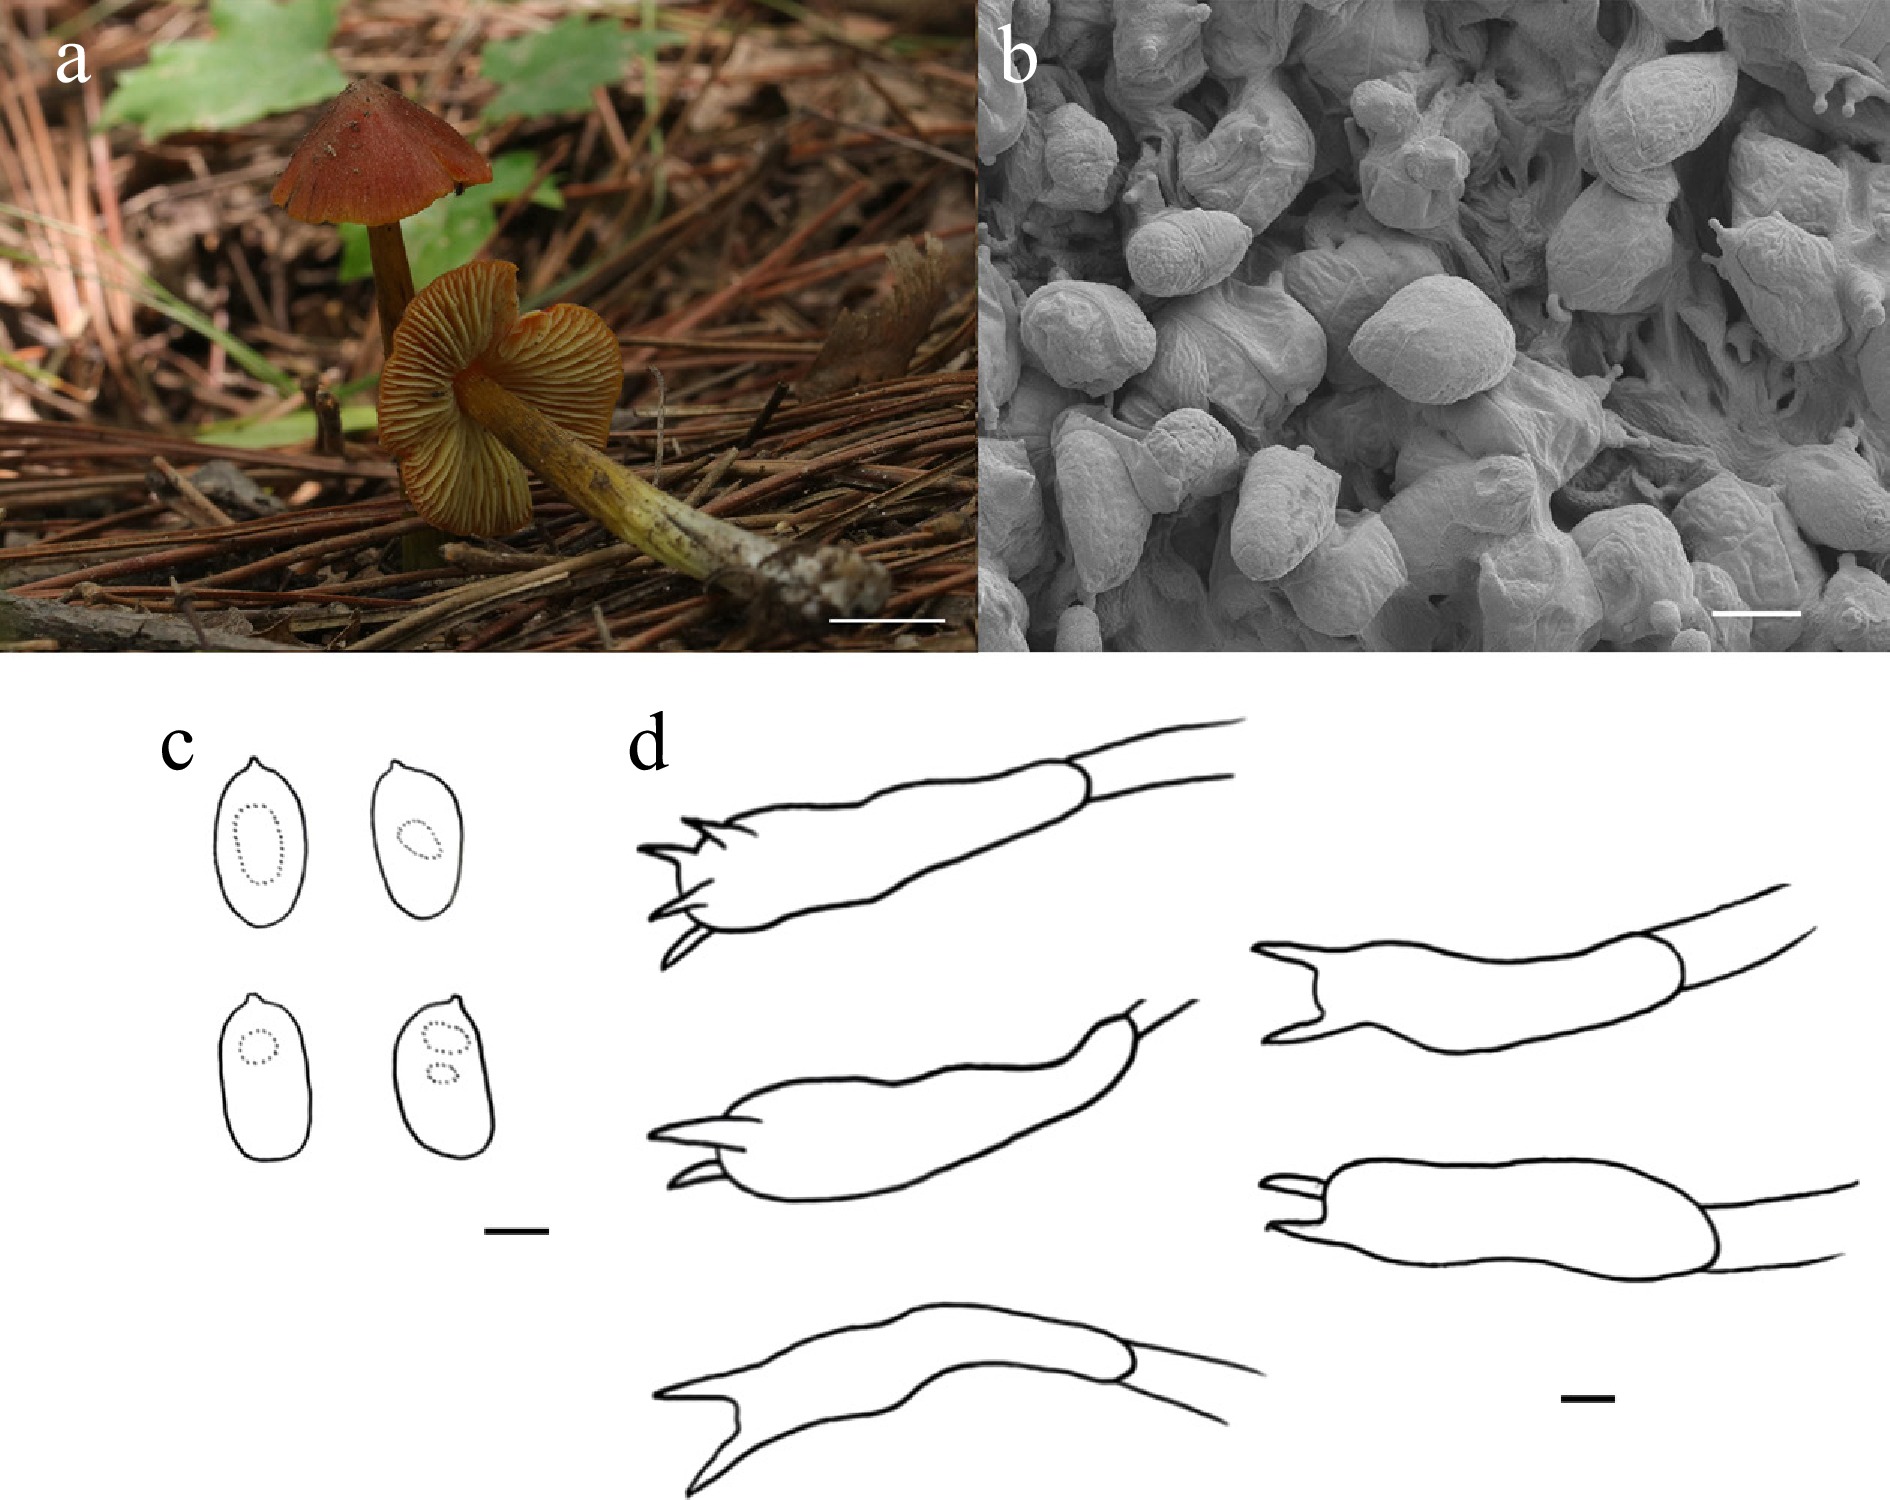
Figure 11.
Hygrocybe santagouana (HMJU 11723, holotype). (a) Basidiocarps. (b) SEM images of basidiospores. (c) Basidiospores. (d) Basidia. Scale bars: (a) 1 cm; (b)–(d) 5 µm.
-
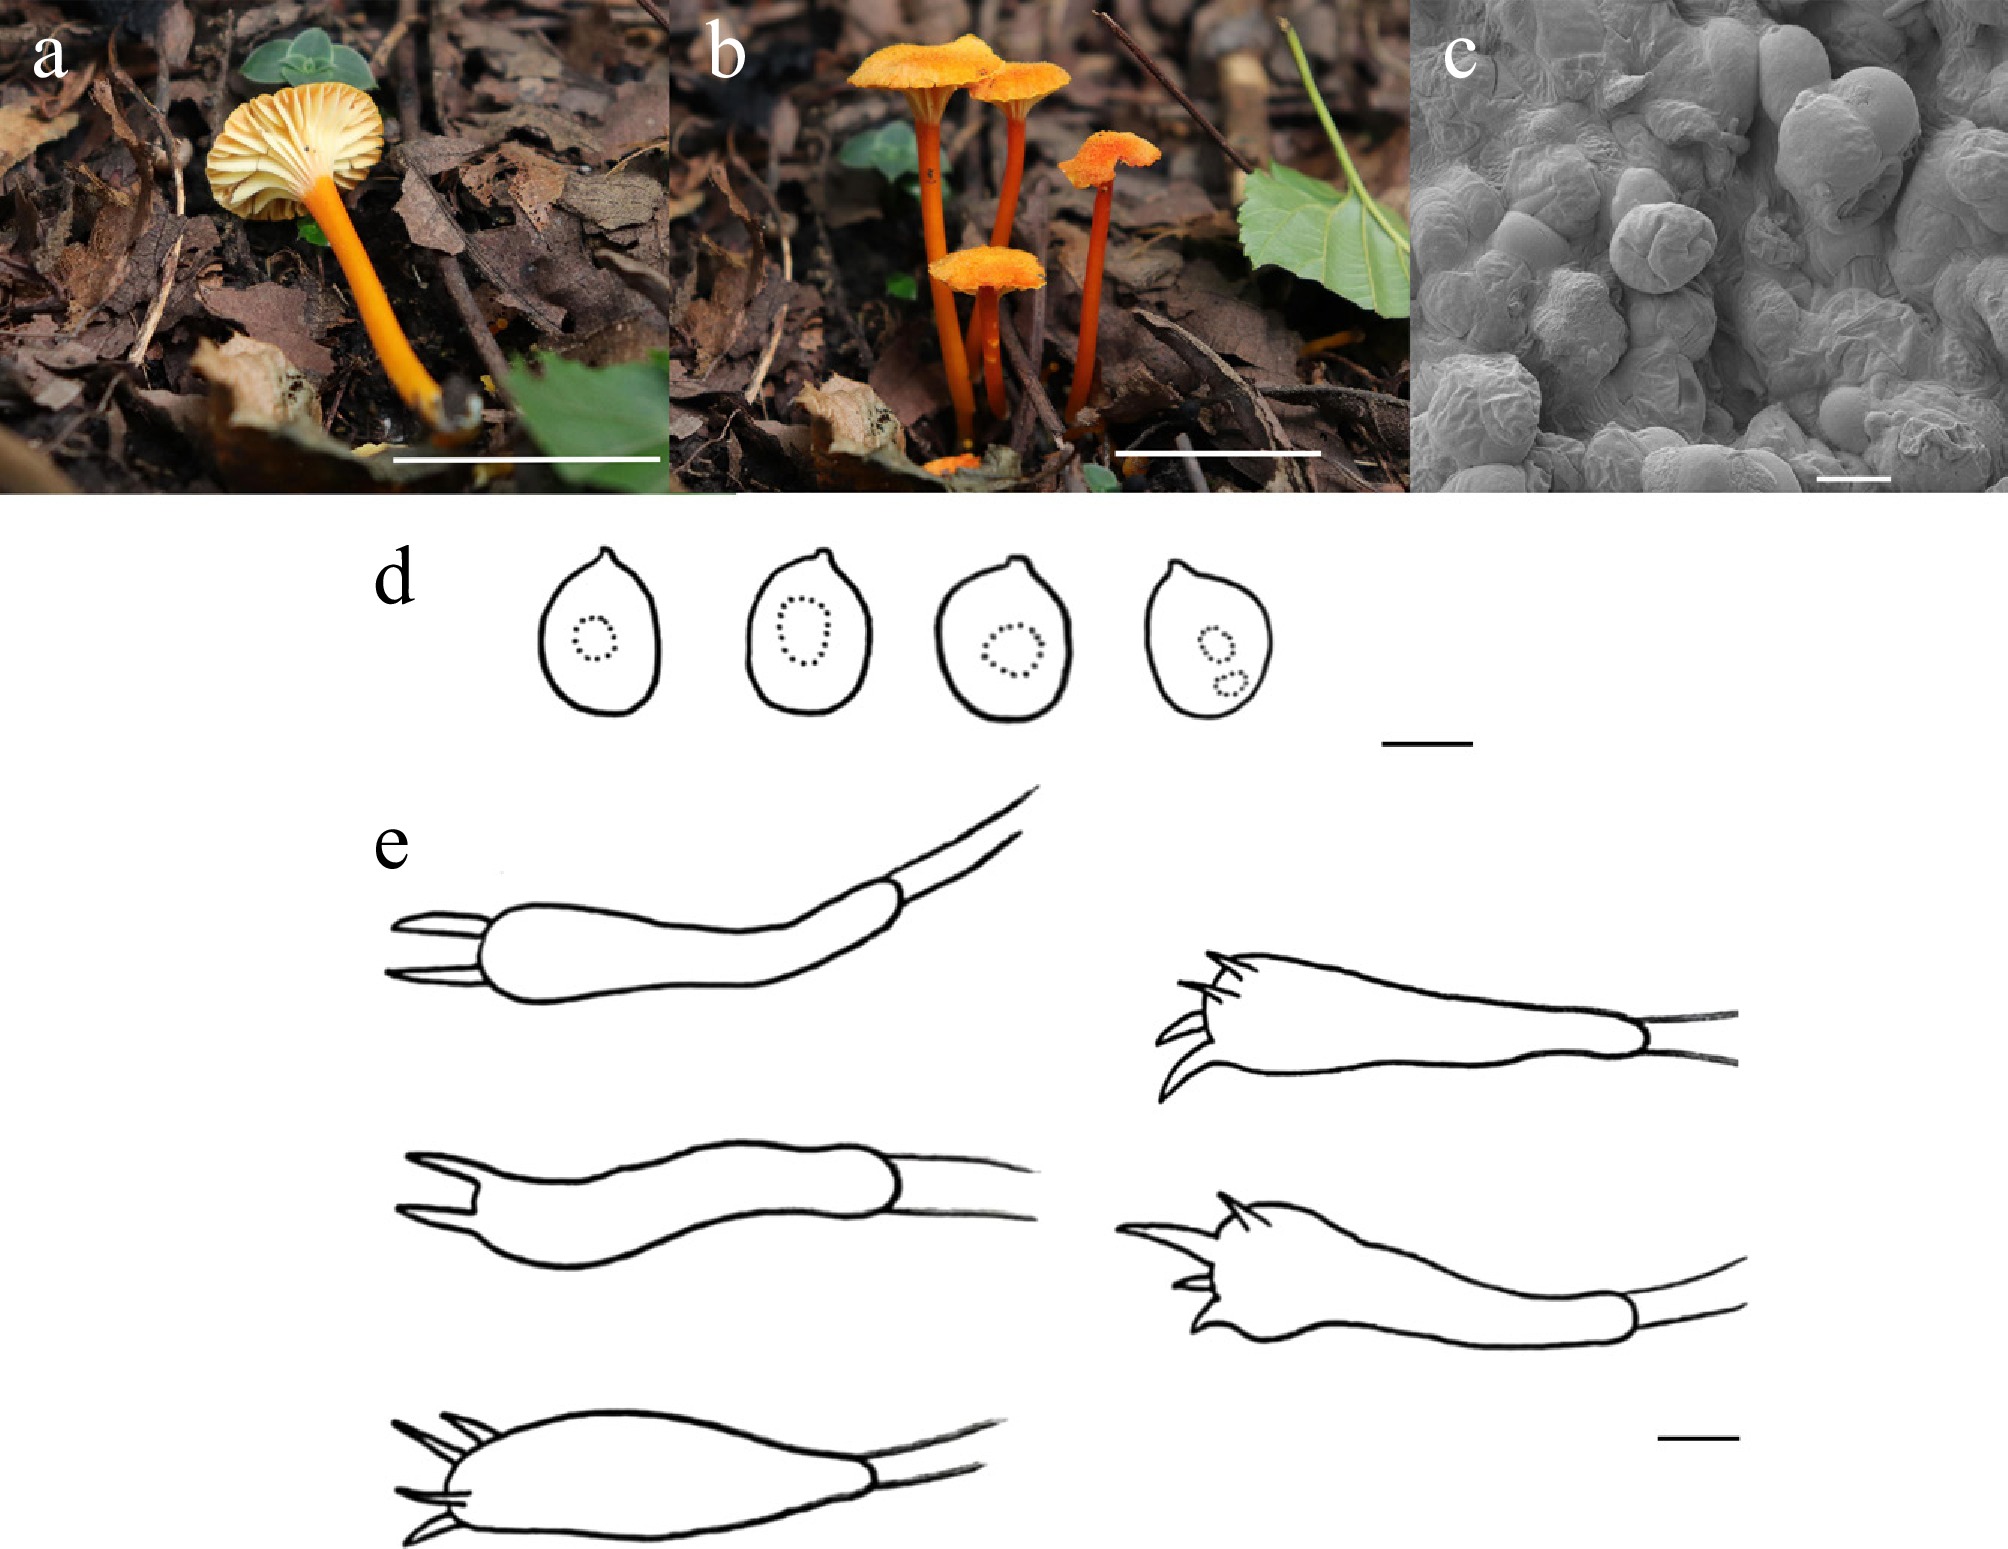
Figure 12.
Hygrocybe aurisquama (HMJU 10145, holotype). (a), (b) Basidiocarps. (c) SEM images of basidiospores. (d) Basidiospores. (e) Basidia. Scale bars: (a), (b) 2 cm; (c), (d) 5 µm; and (e) 10 µm.
-
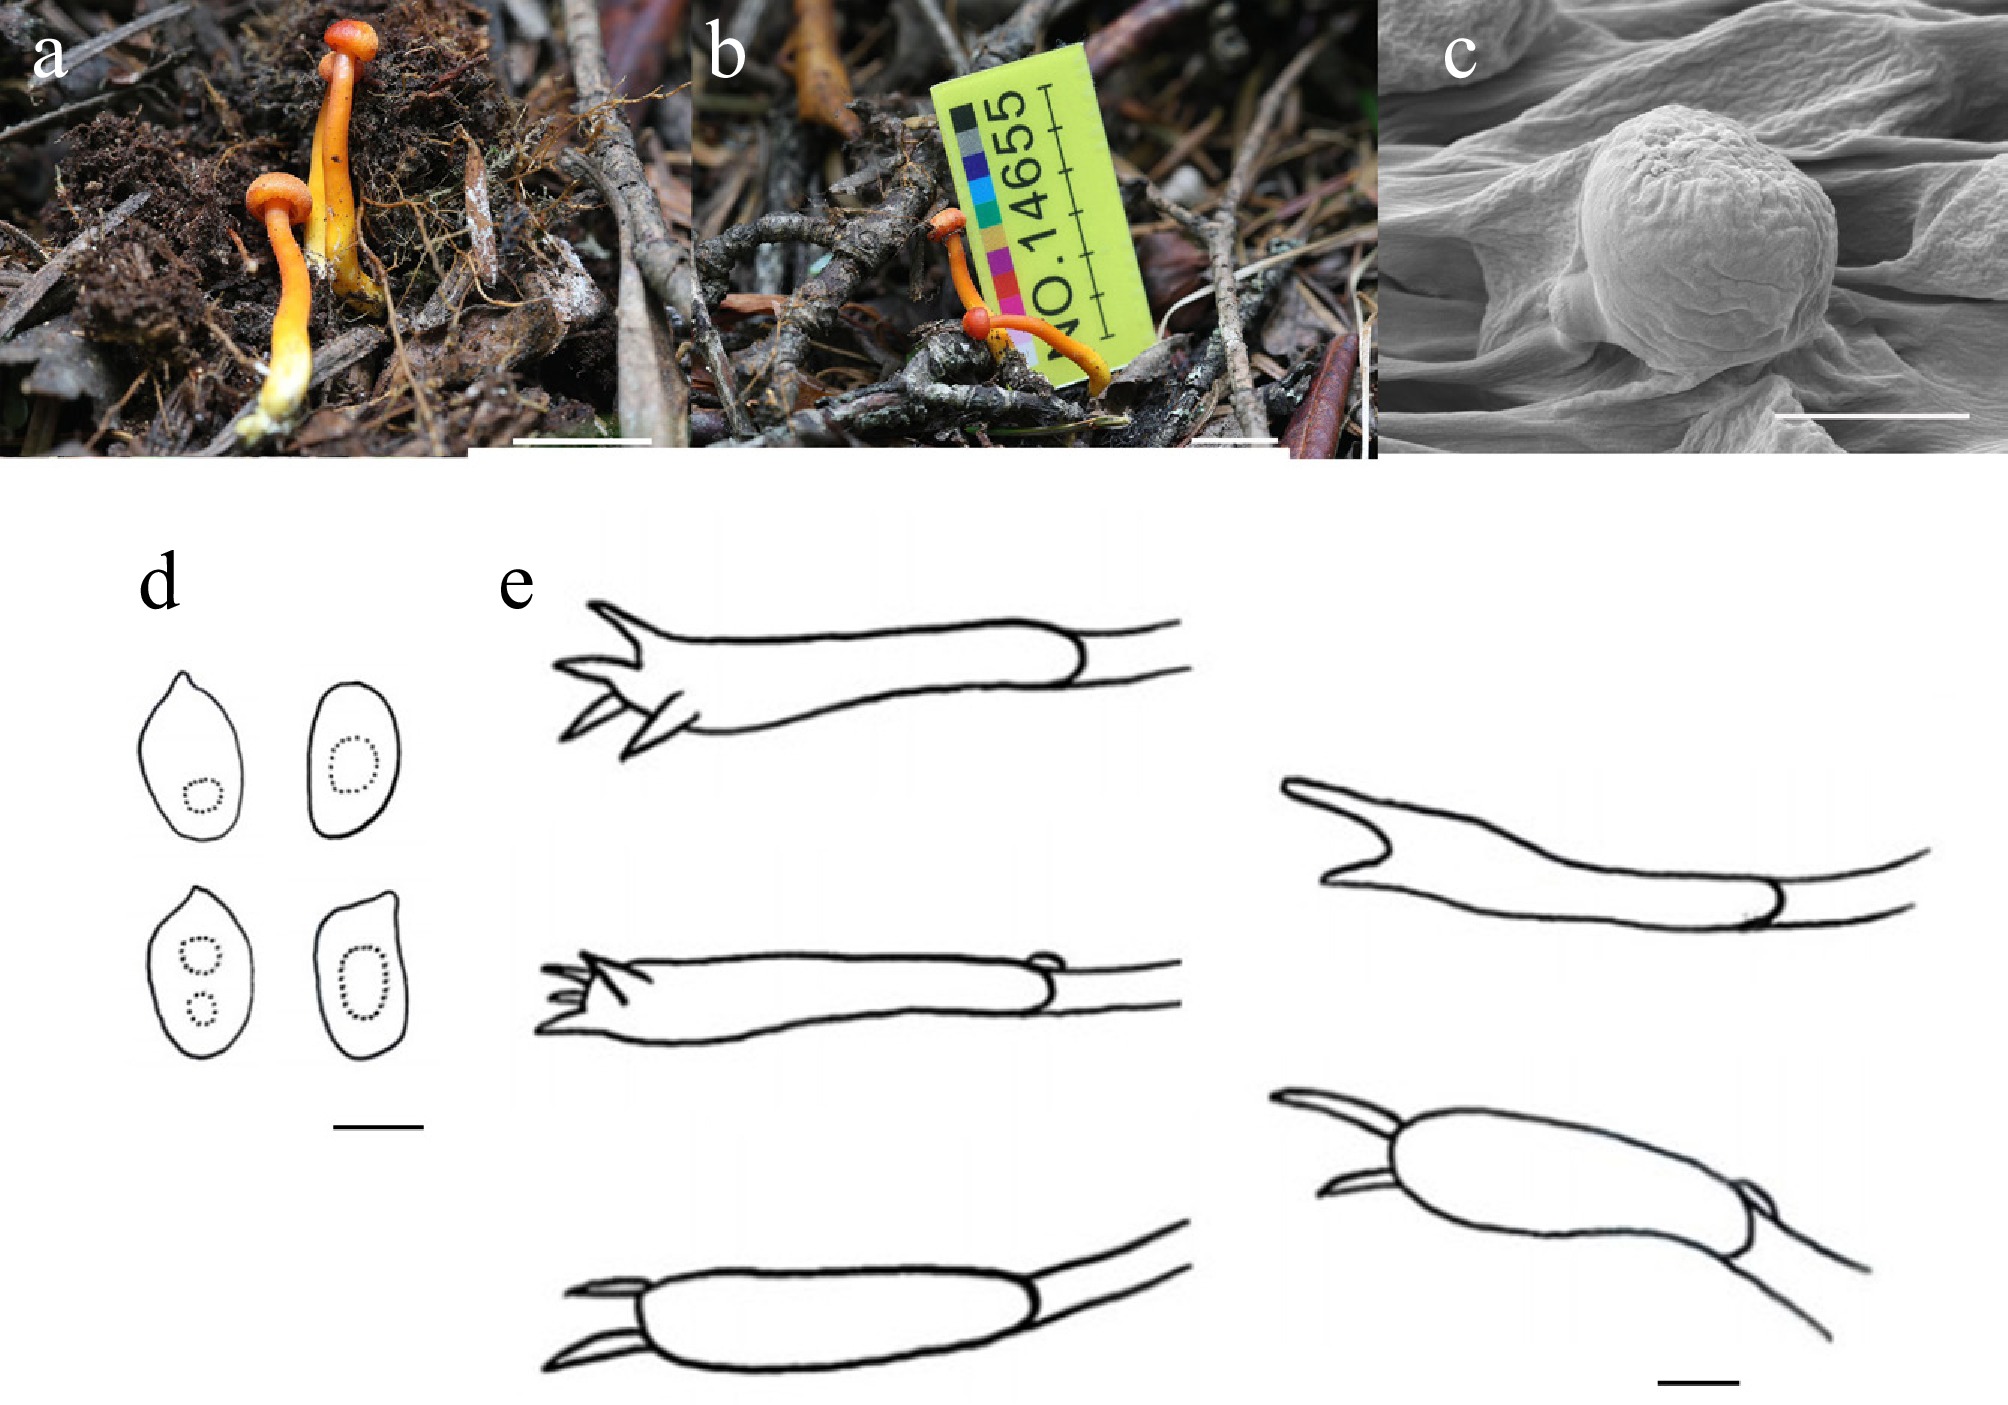
Figure 13.
Hygrocybe sejilensis (HMJU 14655, holotype). (a), (b) Basidiocarps. (c) SEM images of basidiospores. (d) Basidiospores. (e) Basidia. Scale bars: (a), (b) 1 cm; (c)–(e) 5 µm.
-
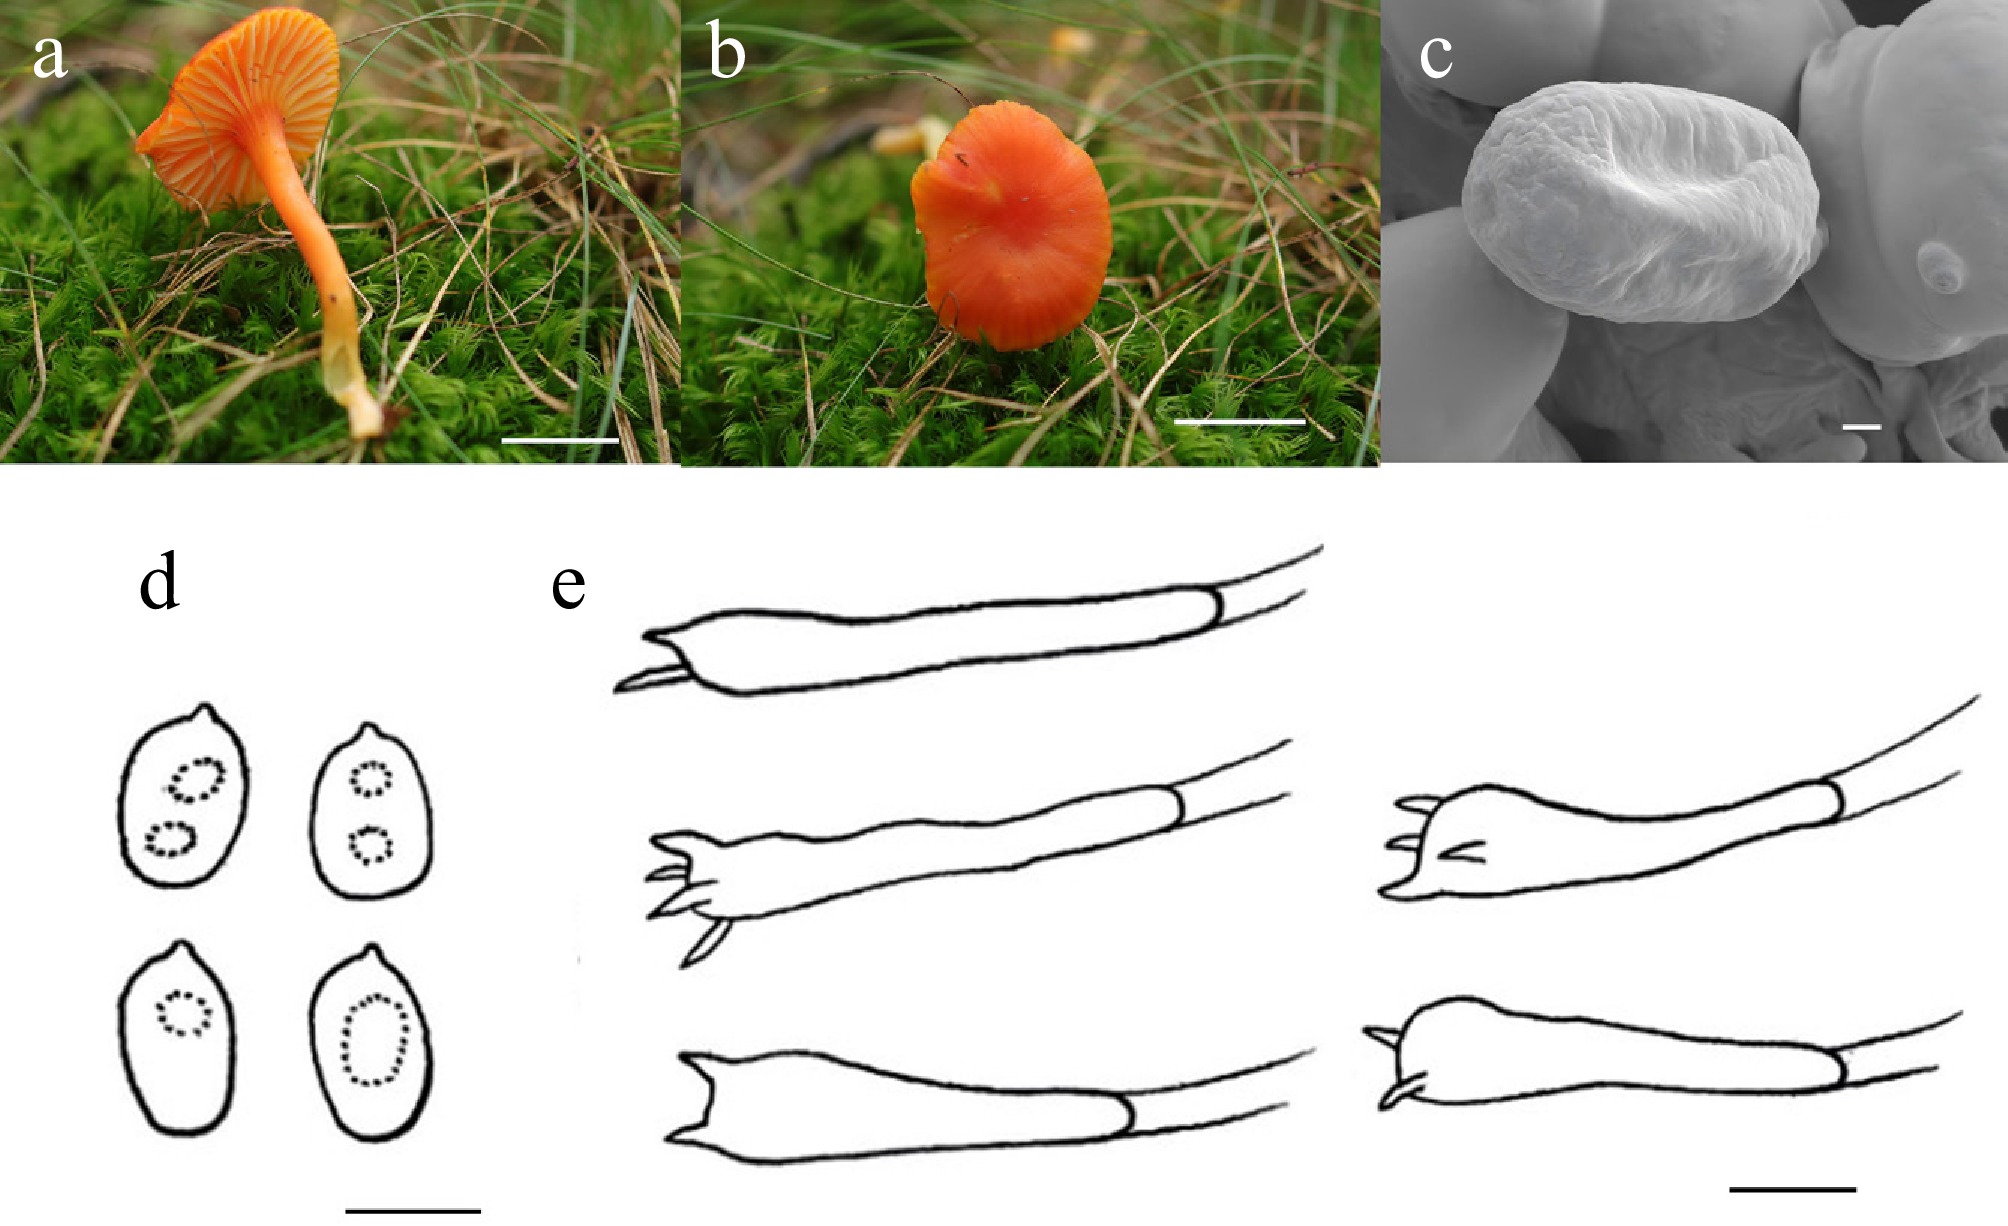
Figure 14.
Hygrocybe subreidii (HMJU 14200, holotype). (a), (b) Basidiocarps. (c) SEM images of basidiospores. (d) Basidiospores. (e) Basidia. Scale bars: (a), (b) 1 cm; (c)–(e) 5 µm.
-
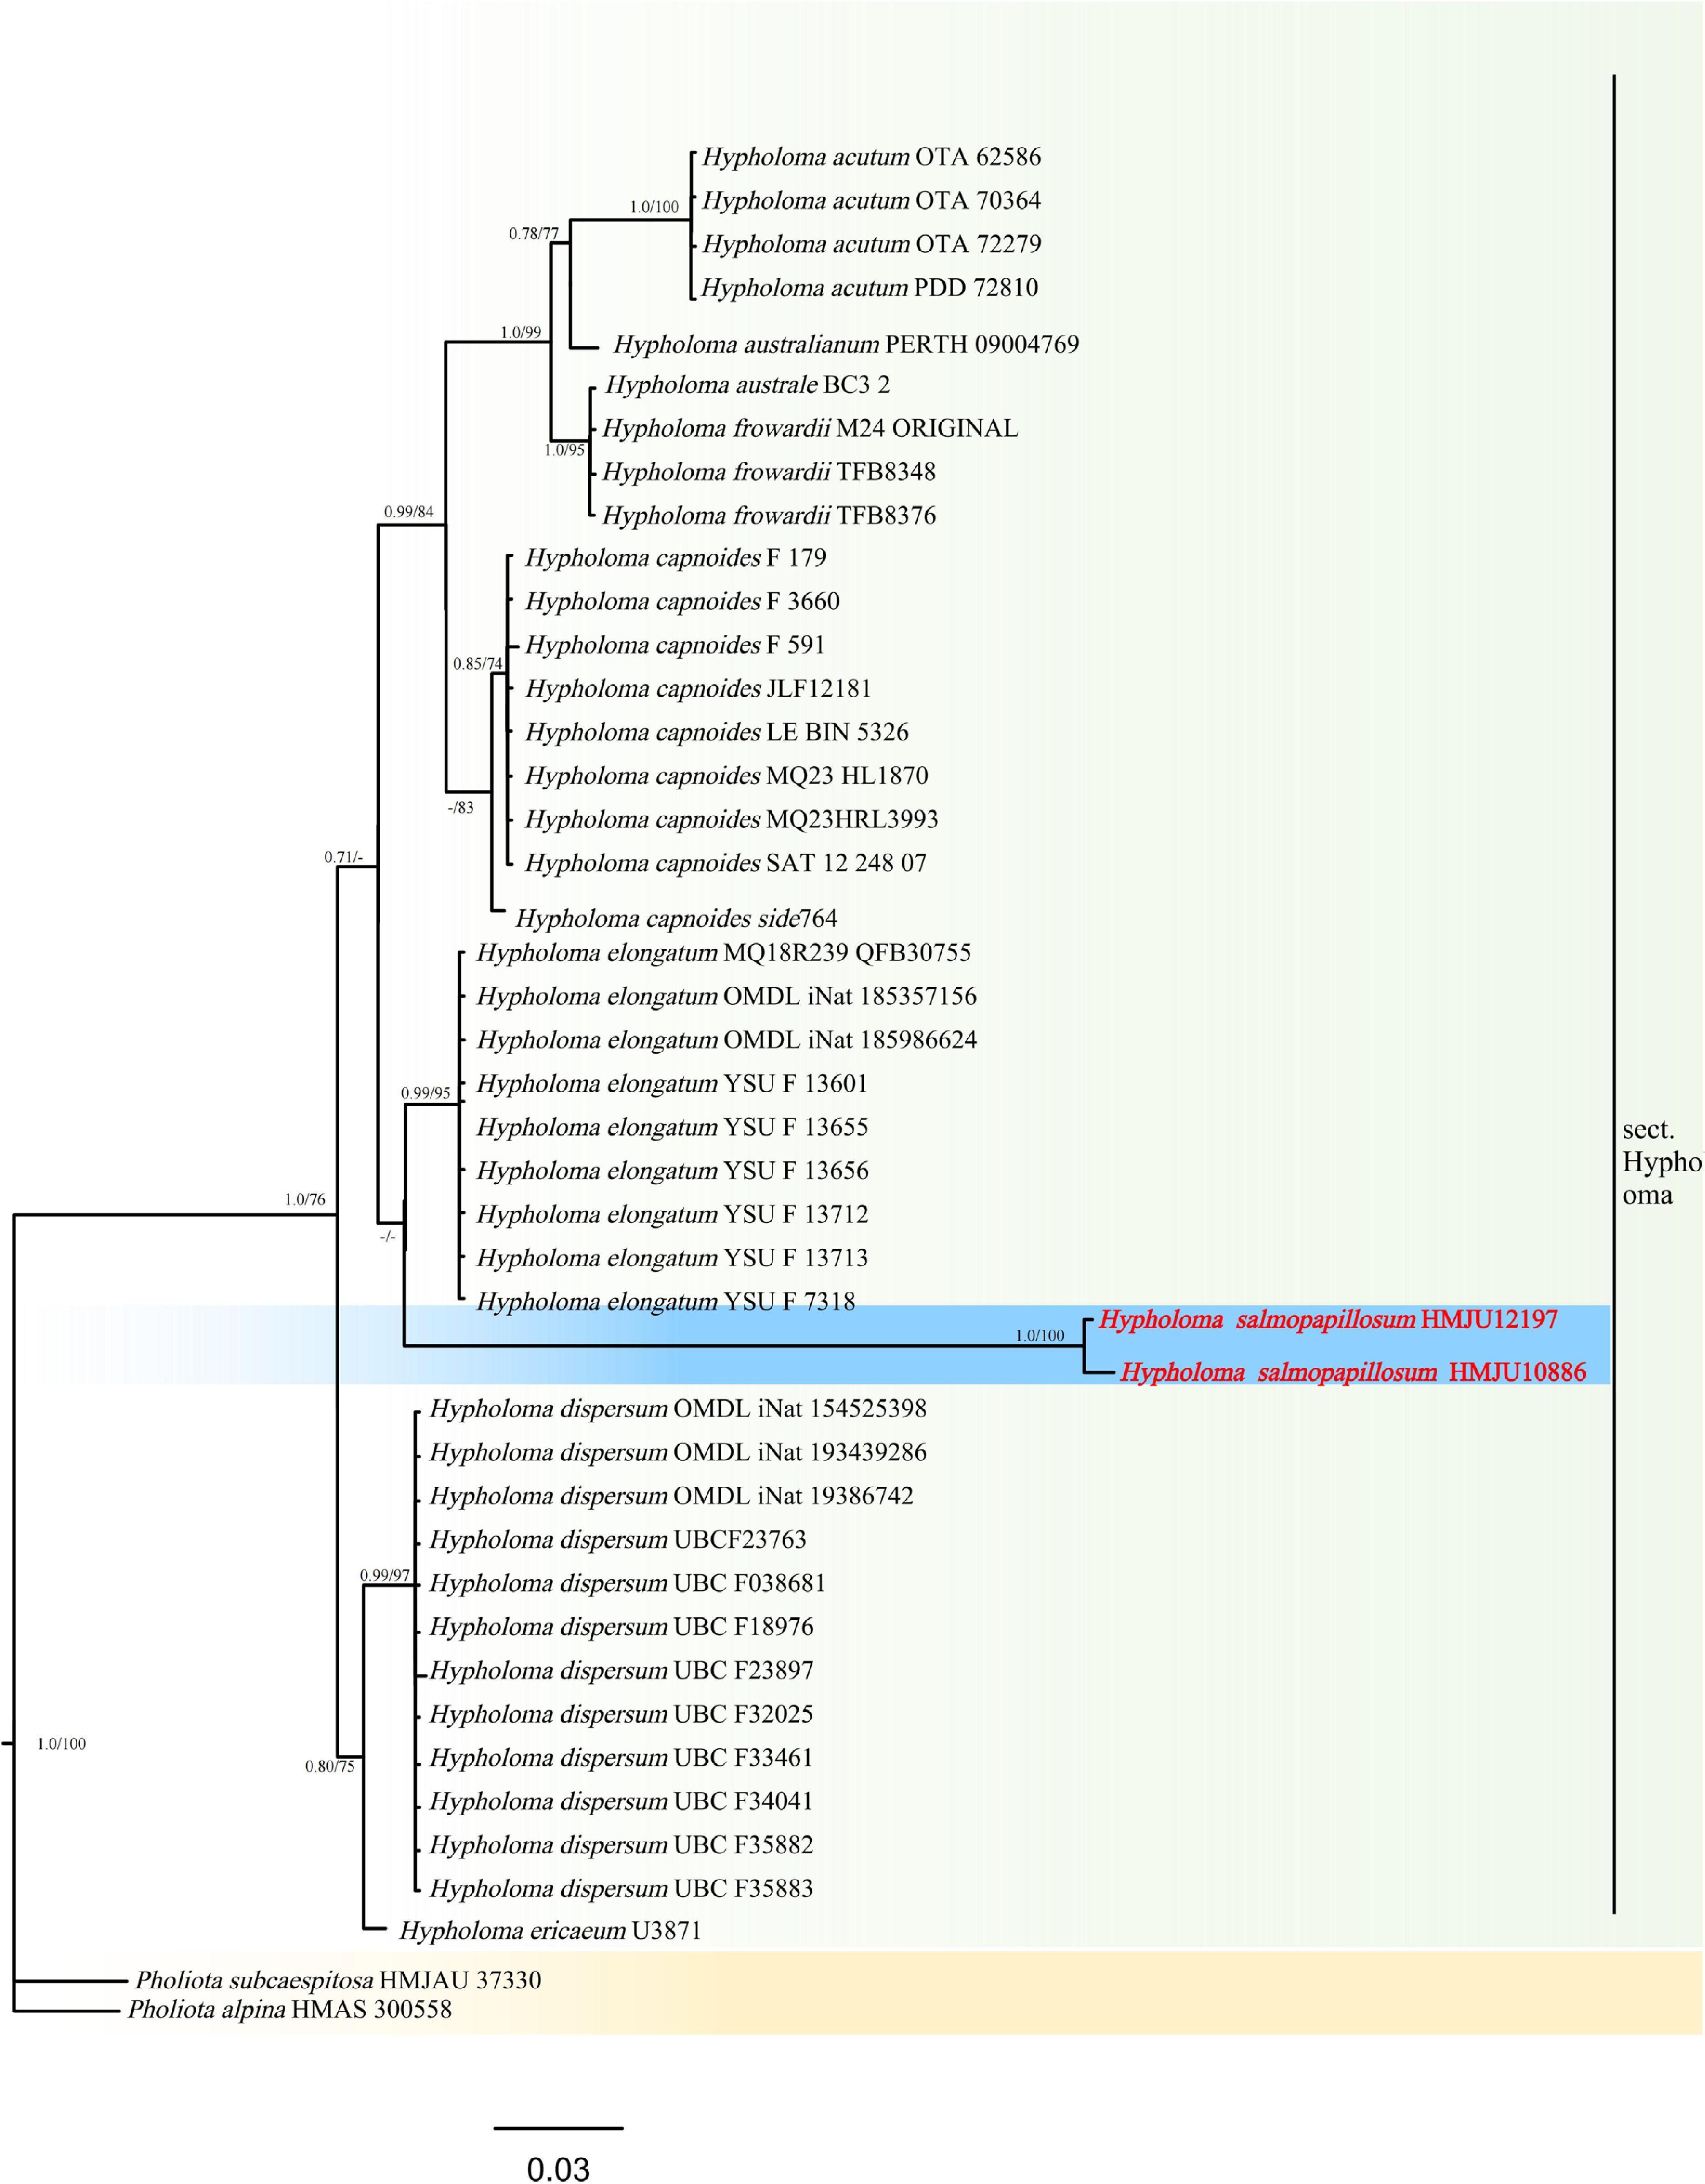
Figure 15.
Phylogram of Maximum Likelihood phylogenetic analysis based on combined ITS, nLSU, rpb2, and tef-1 sequences. The analysis includes 44 strains; total characters: 2,597 (ITS: 535, nLSU: 714, rpb2: 776, tef-1: 572). Pholiota subcaespitosa (HMJAU 37330) and Pholiota alpina (HMAS 300558) were used as the outgroup taxa. The best model was TPM2 + G4. Estimated base frequencies were as follows: A = 0.250, C = 0.250, G = 0.250, T = 0.250. Bootstrap values for ML equal to or greater than 70% and BYPP values equal to or greater than 0.70 are labelled on the nodes. The type strains are in bold.
-
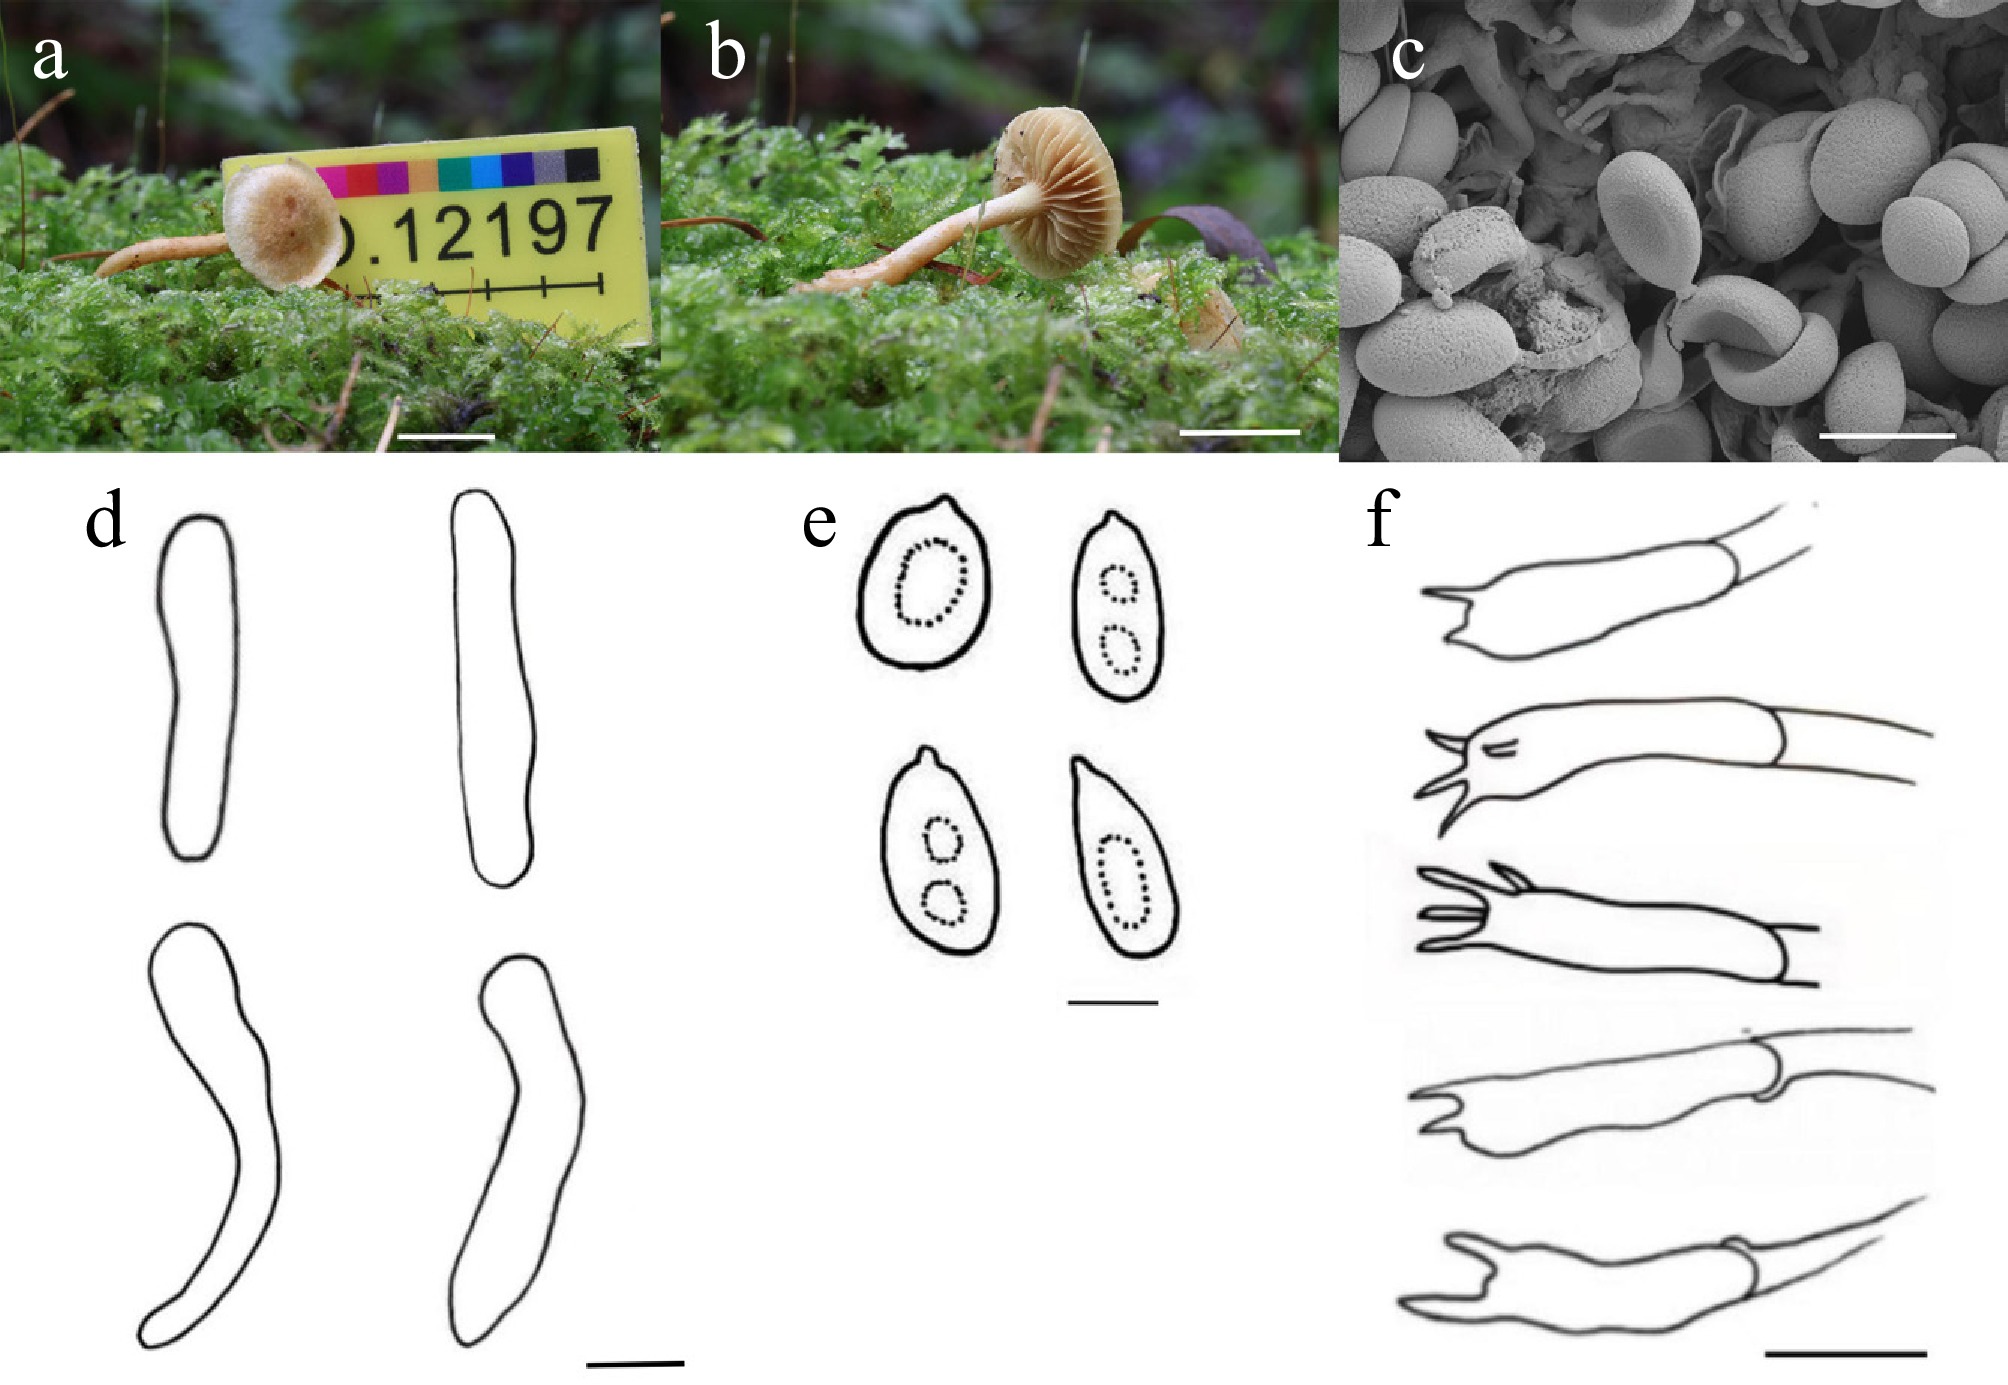
Figure 16.
Hypholoma salmopapillosum (HMJU 12197, holotype). (a), (b) Basidiocarps. (c) SEM images of basidiospores. (d) Basidiospores. (e) Basidia. Scale bars: (a), (b) 1 cm; (c) 5 µm; (d) 10 µm; (e) 3 µm; and (f) 10 µm.
-
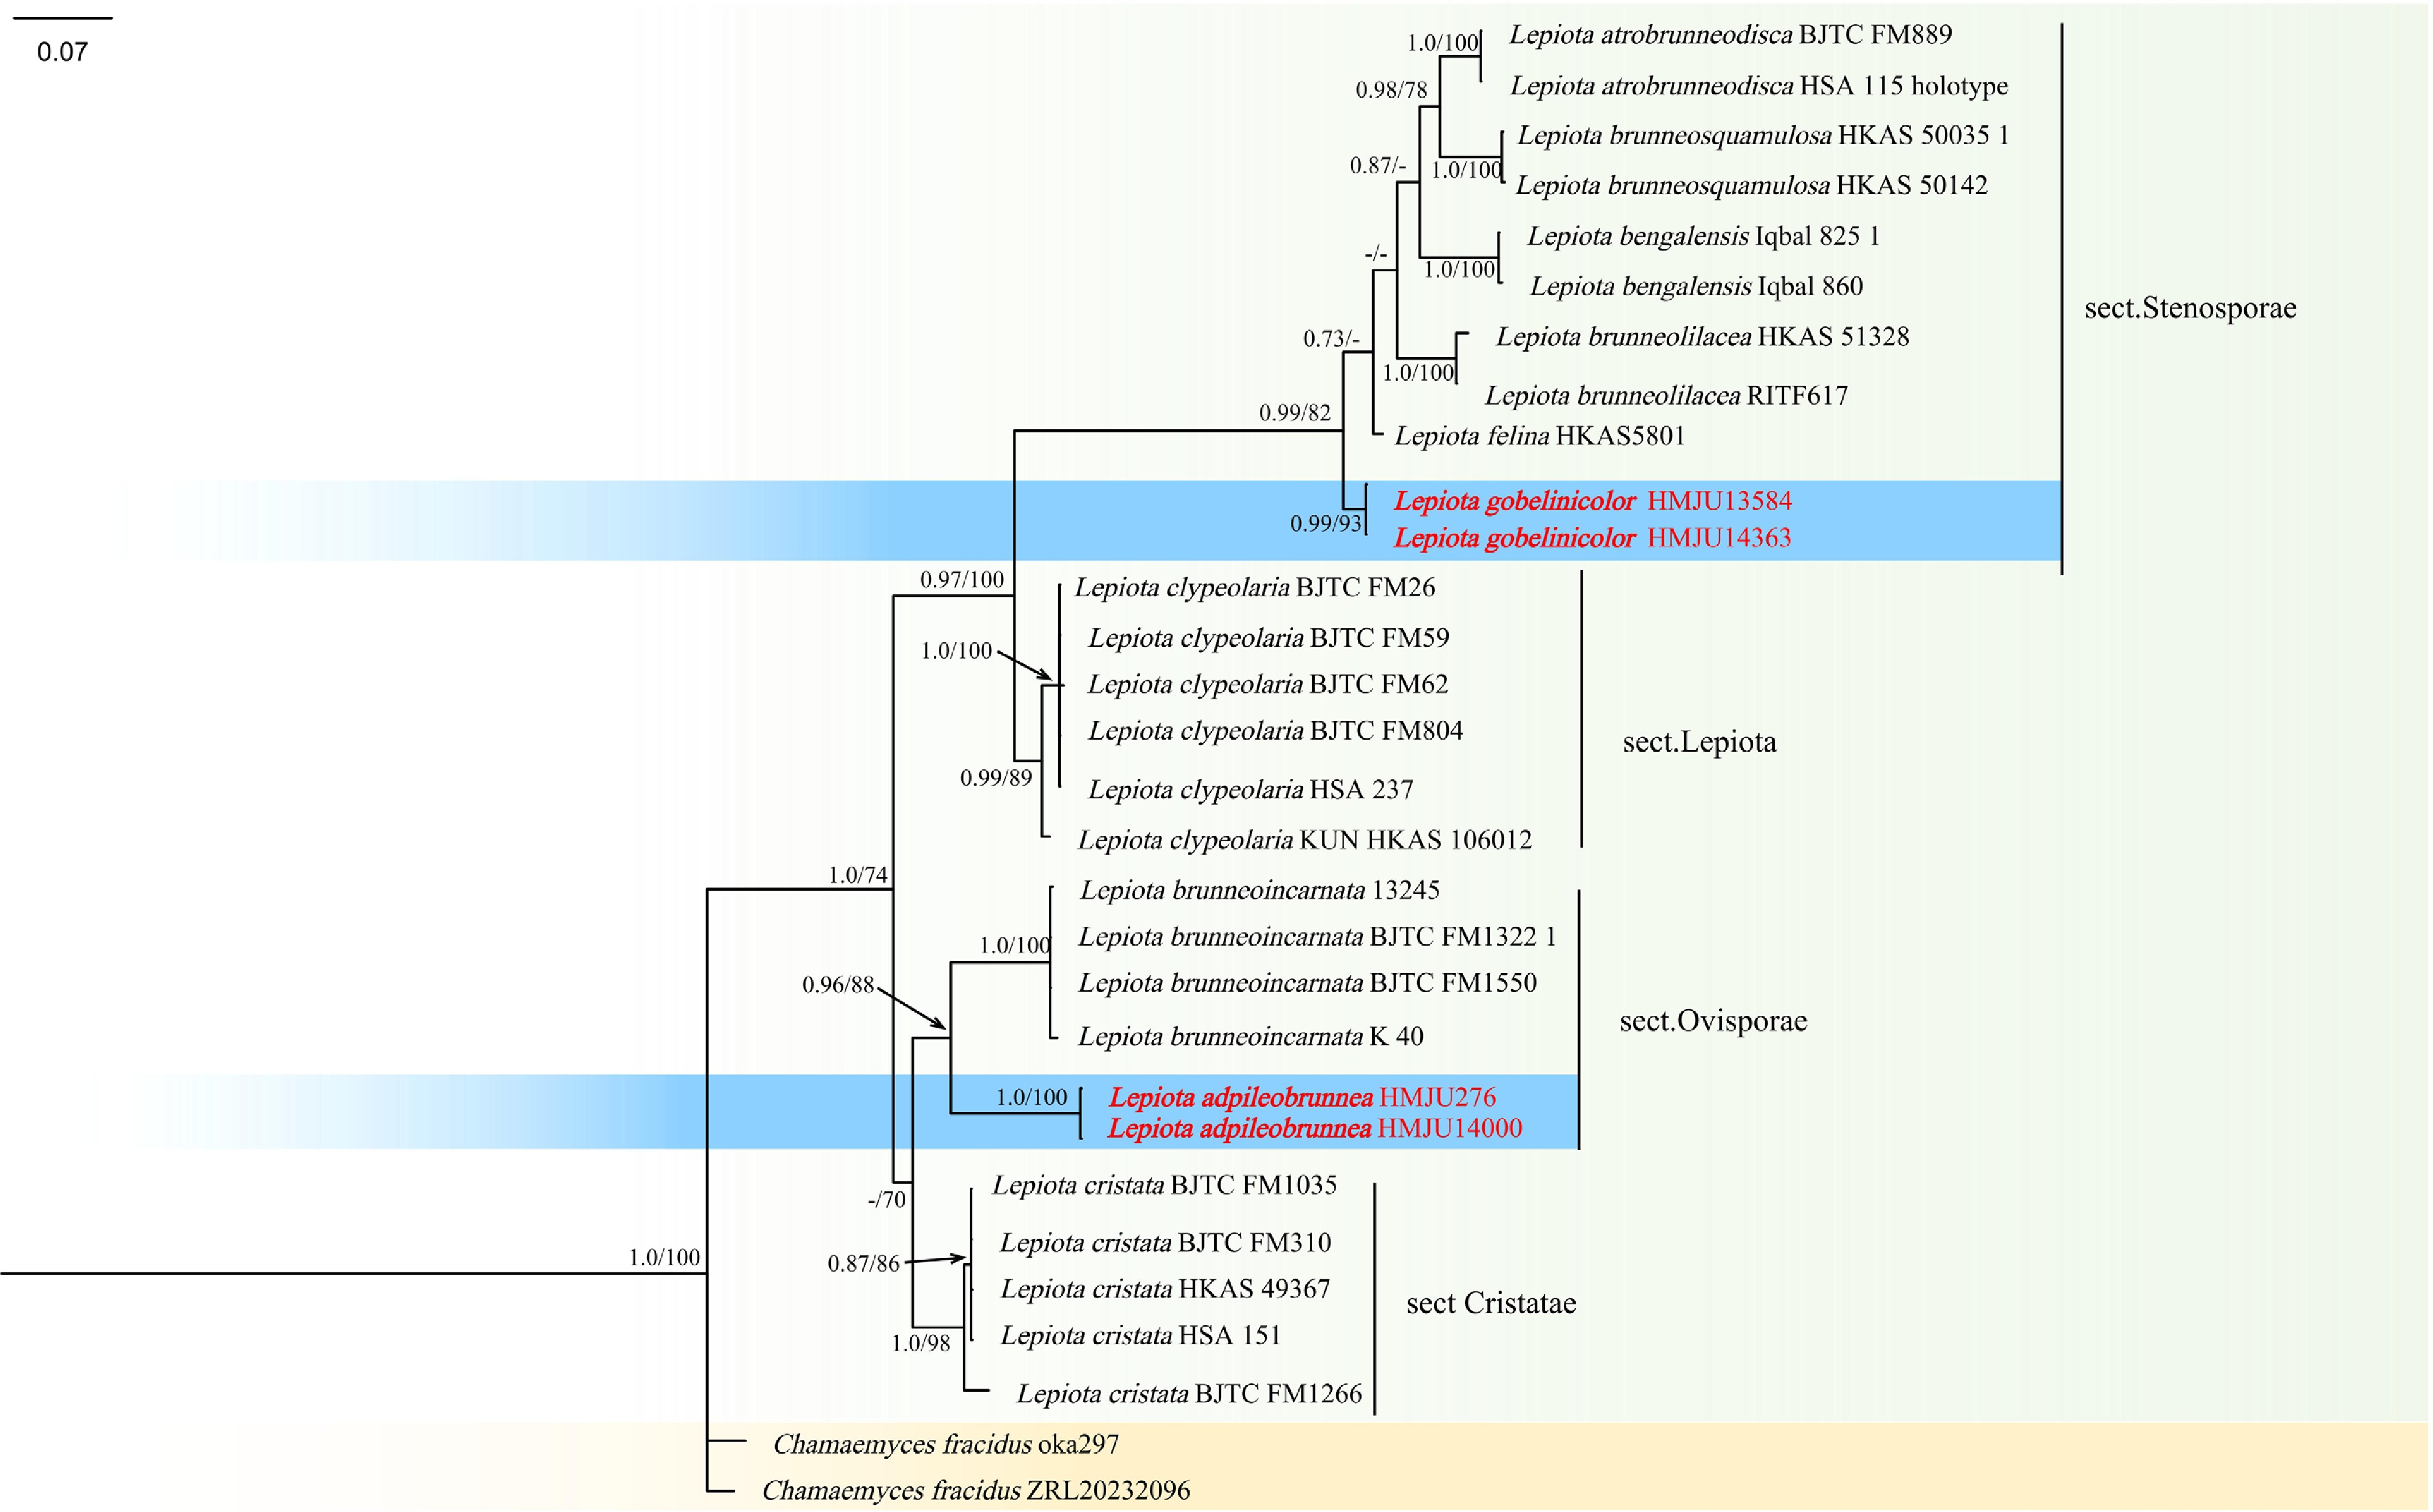
Figure 17.
Phylogram of maximum likelihood phylogenetic analysis based on combined ITS, LSU, rpb2, and tef-1α sequences. The analysis includes 37 strains; total characters: 1842 (ITS: 408, LSU: 390, rpb2:585, tef-1α: 459). Leucoagaricus naucinus (HMAS 8885) and Leucoagaricus naucinus (HMAS 88854) were used as the outgroup taxa. The best model was MIX{TPM2, TPM2} + I. Estimated base frequencies were as follows: A = 0.250, C = 0.250, G = 0.250, T = 0.250. The tree topology of the ML analysis is similar to the Bayesian analysis. Bootstrap values for ML equal to or greater than 70% and BYPP values equal to or greater than 0.70 are labelled on the nodes. The type strains are in bold.
-
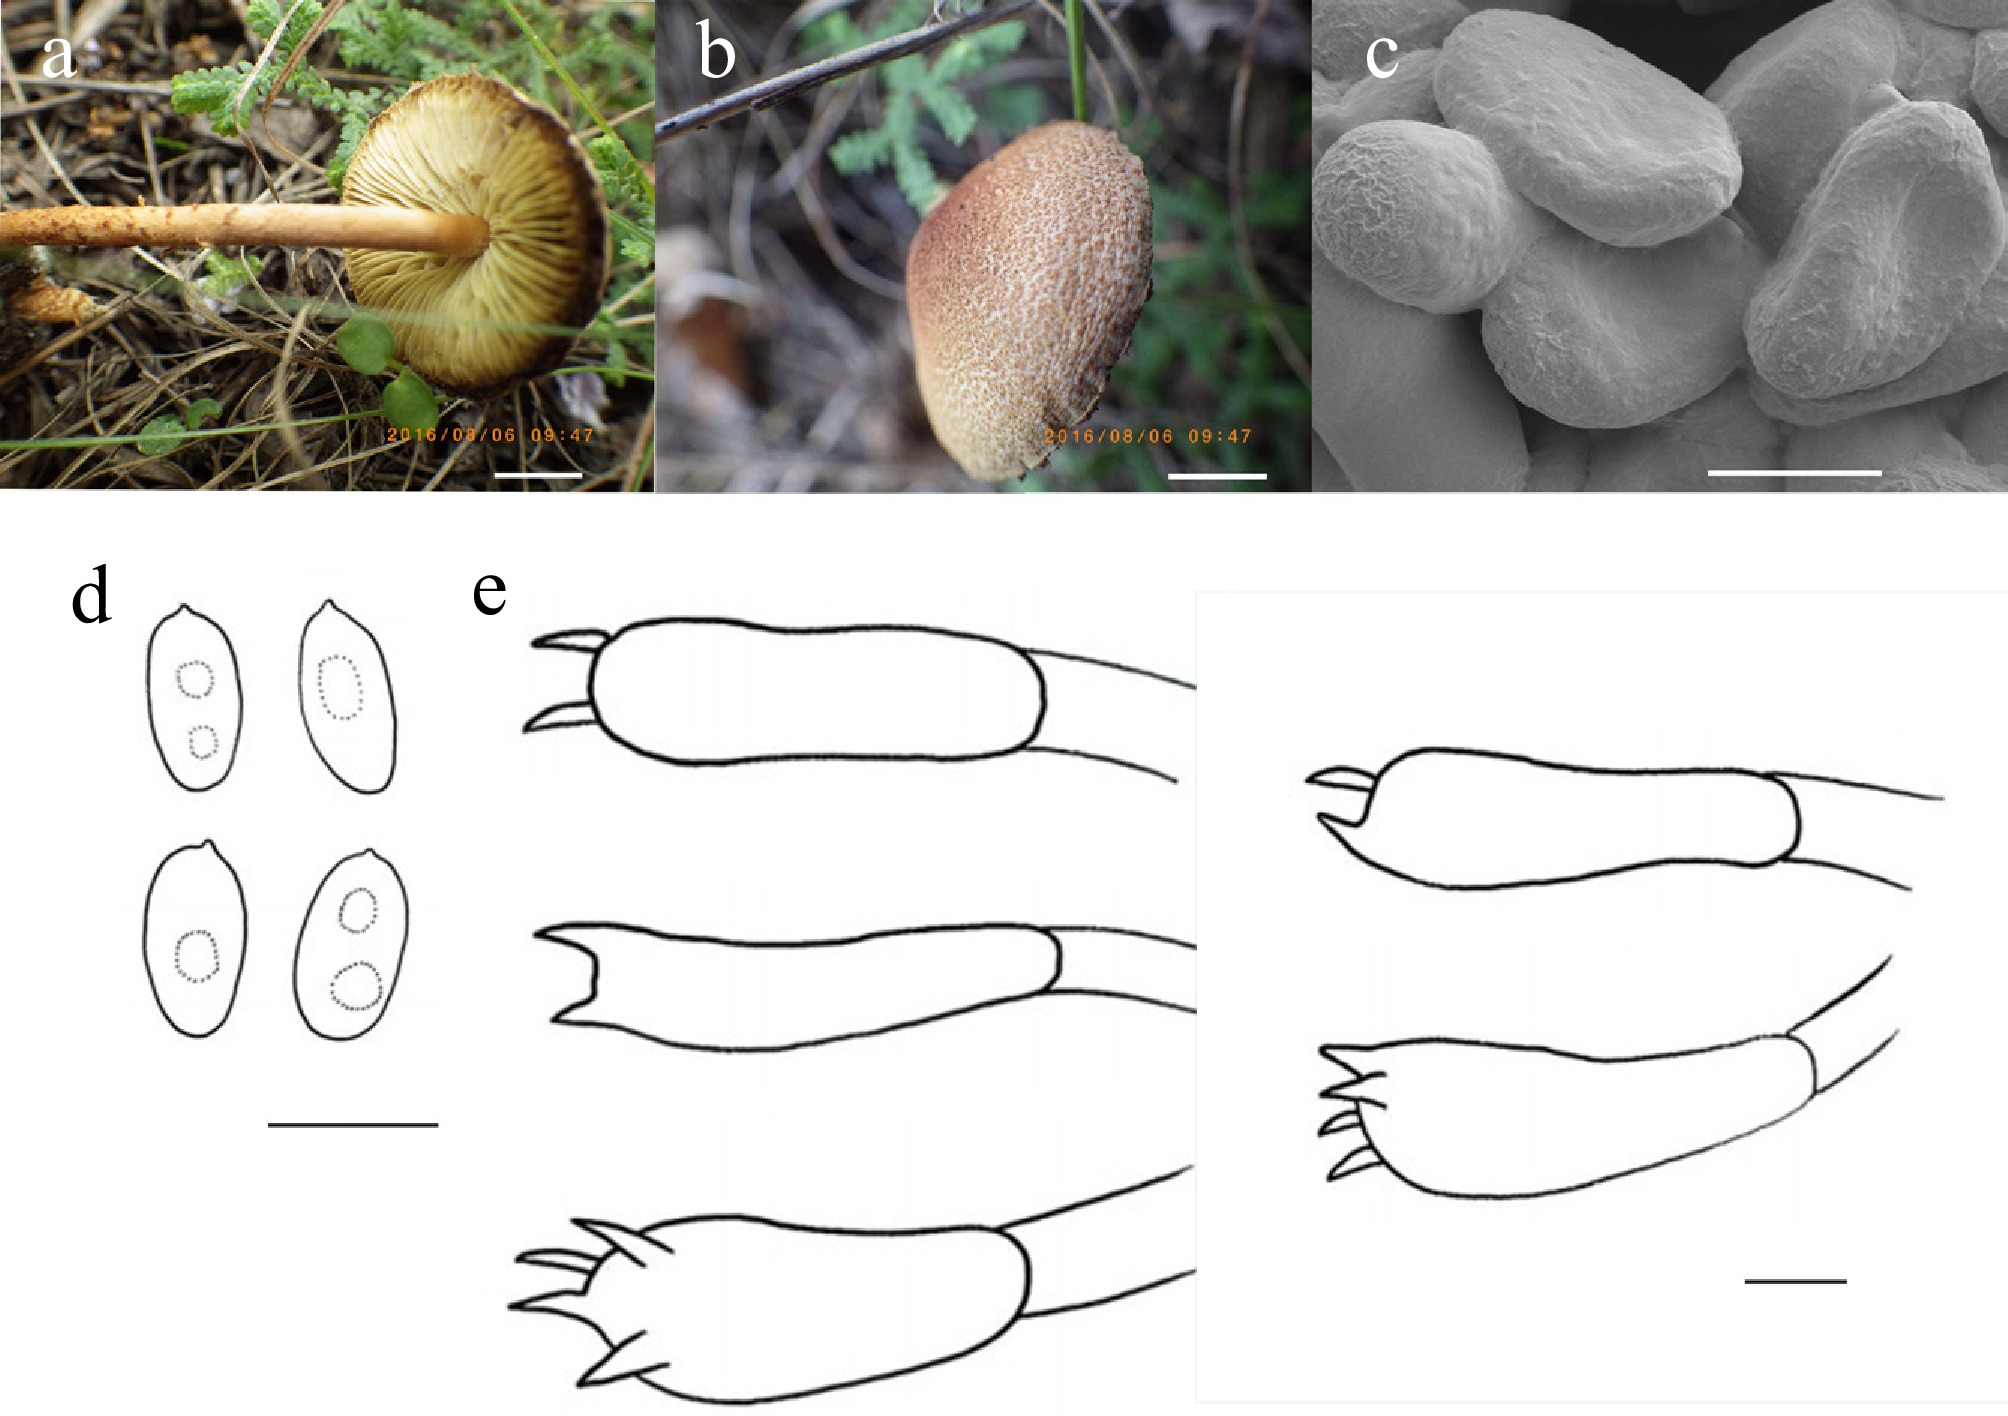
Figure 18.
Lepiota adpileobrunnea (HMJU276, holotype). (a), (b) Basidiocarps. (c) SEM images of basidiospores. (d) Basidiospores. (e) Basidia. Scale bars: (a), (b) 0.5 cm; (c)–(e) 3 µm.
-
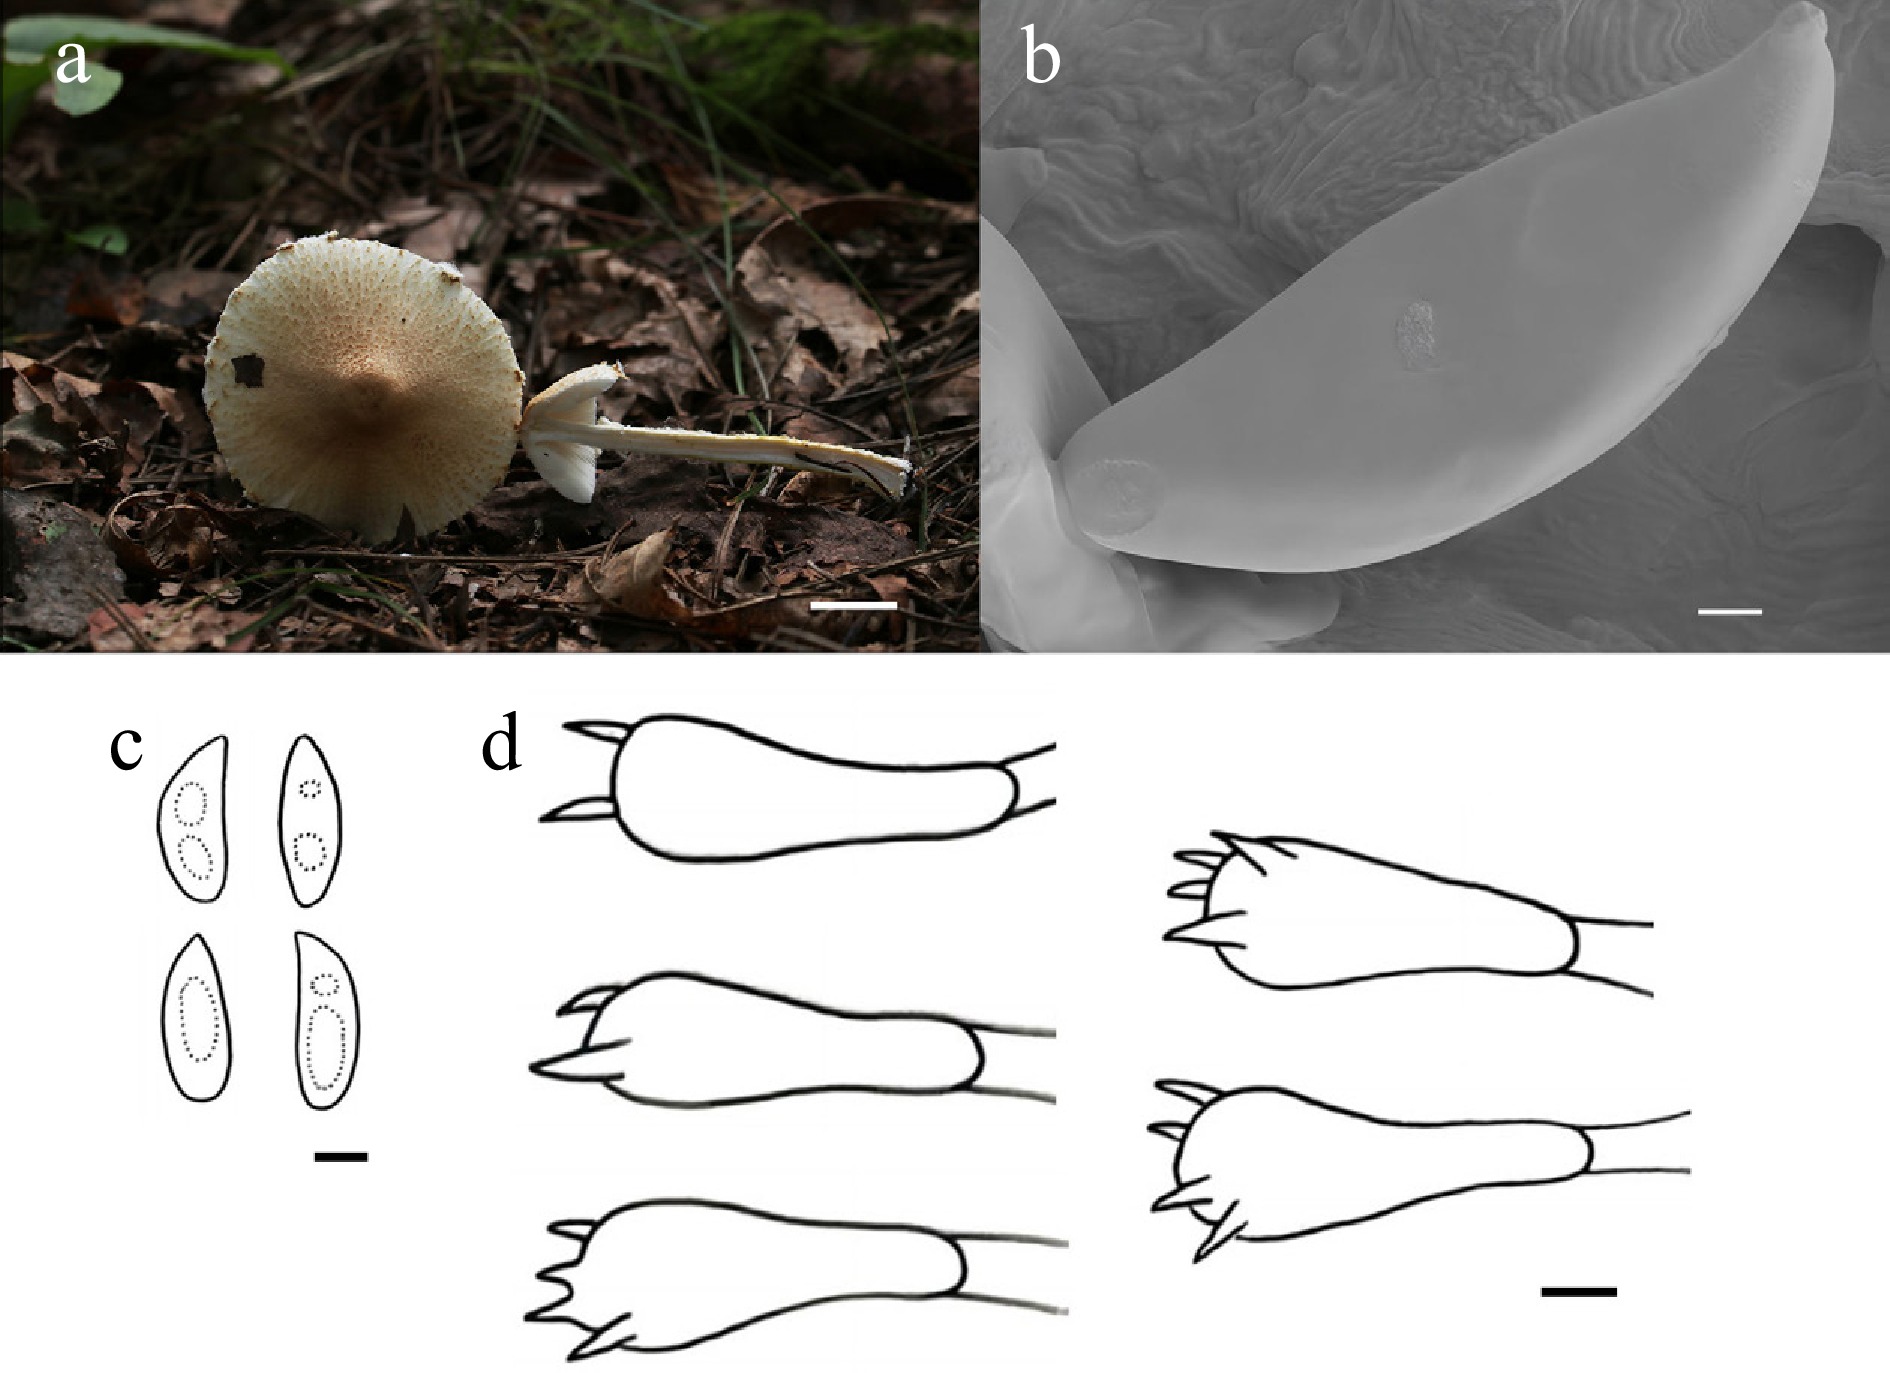
Figure 19.
Lepiota gobelinicolor (HMJU13584, holotype). (a) Basidiocarps. (b) SEM images of basidiospores. (c) Basidiospores. (d) Basidia. Scale bars: (a) 1 cm; (b)–(d) 5 µm.
-
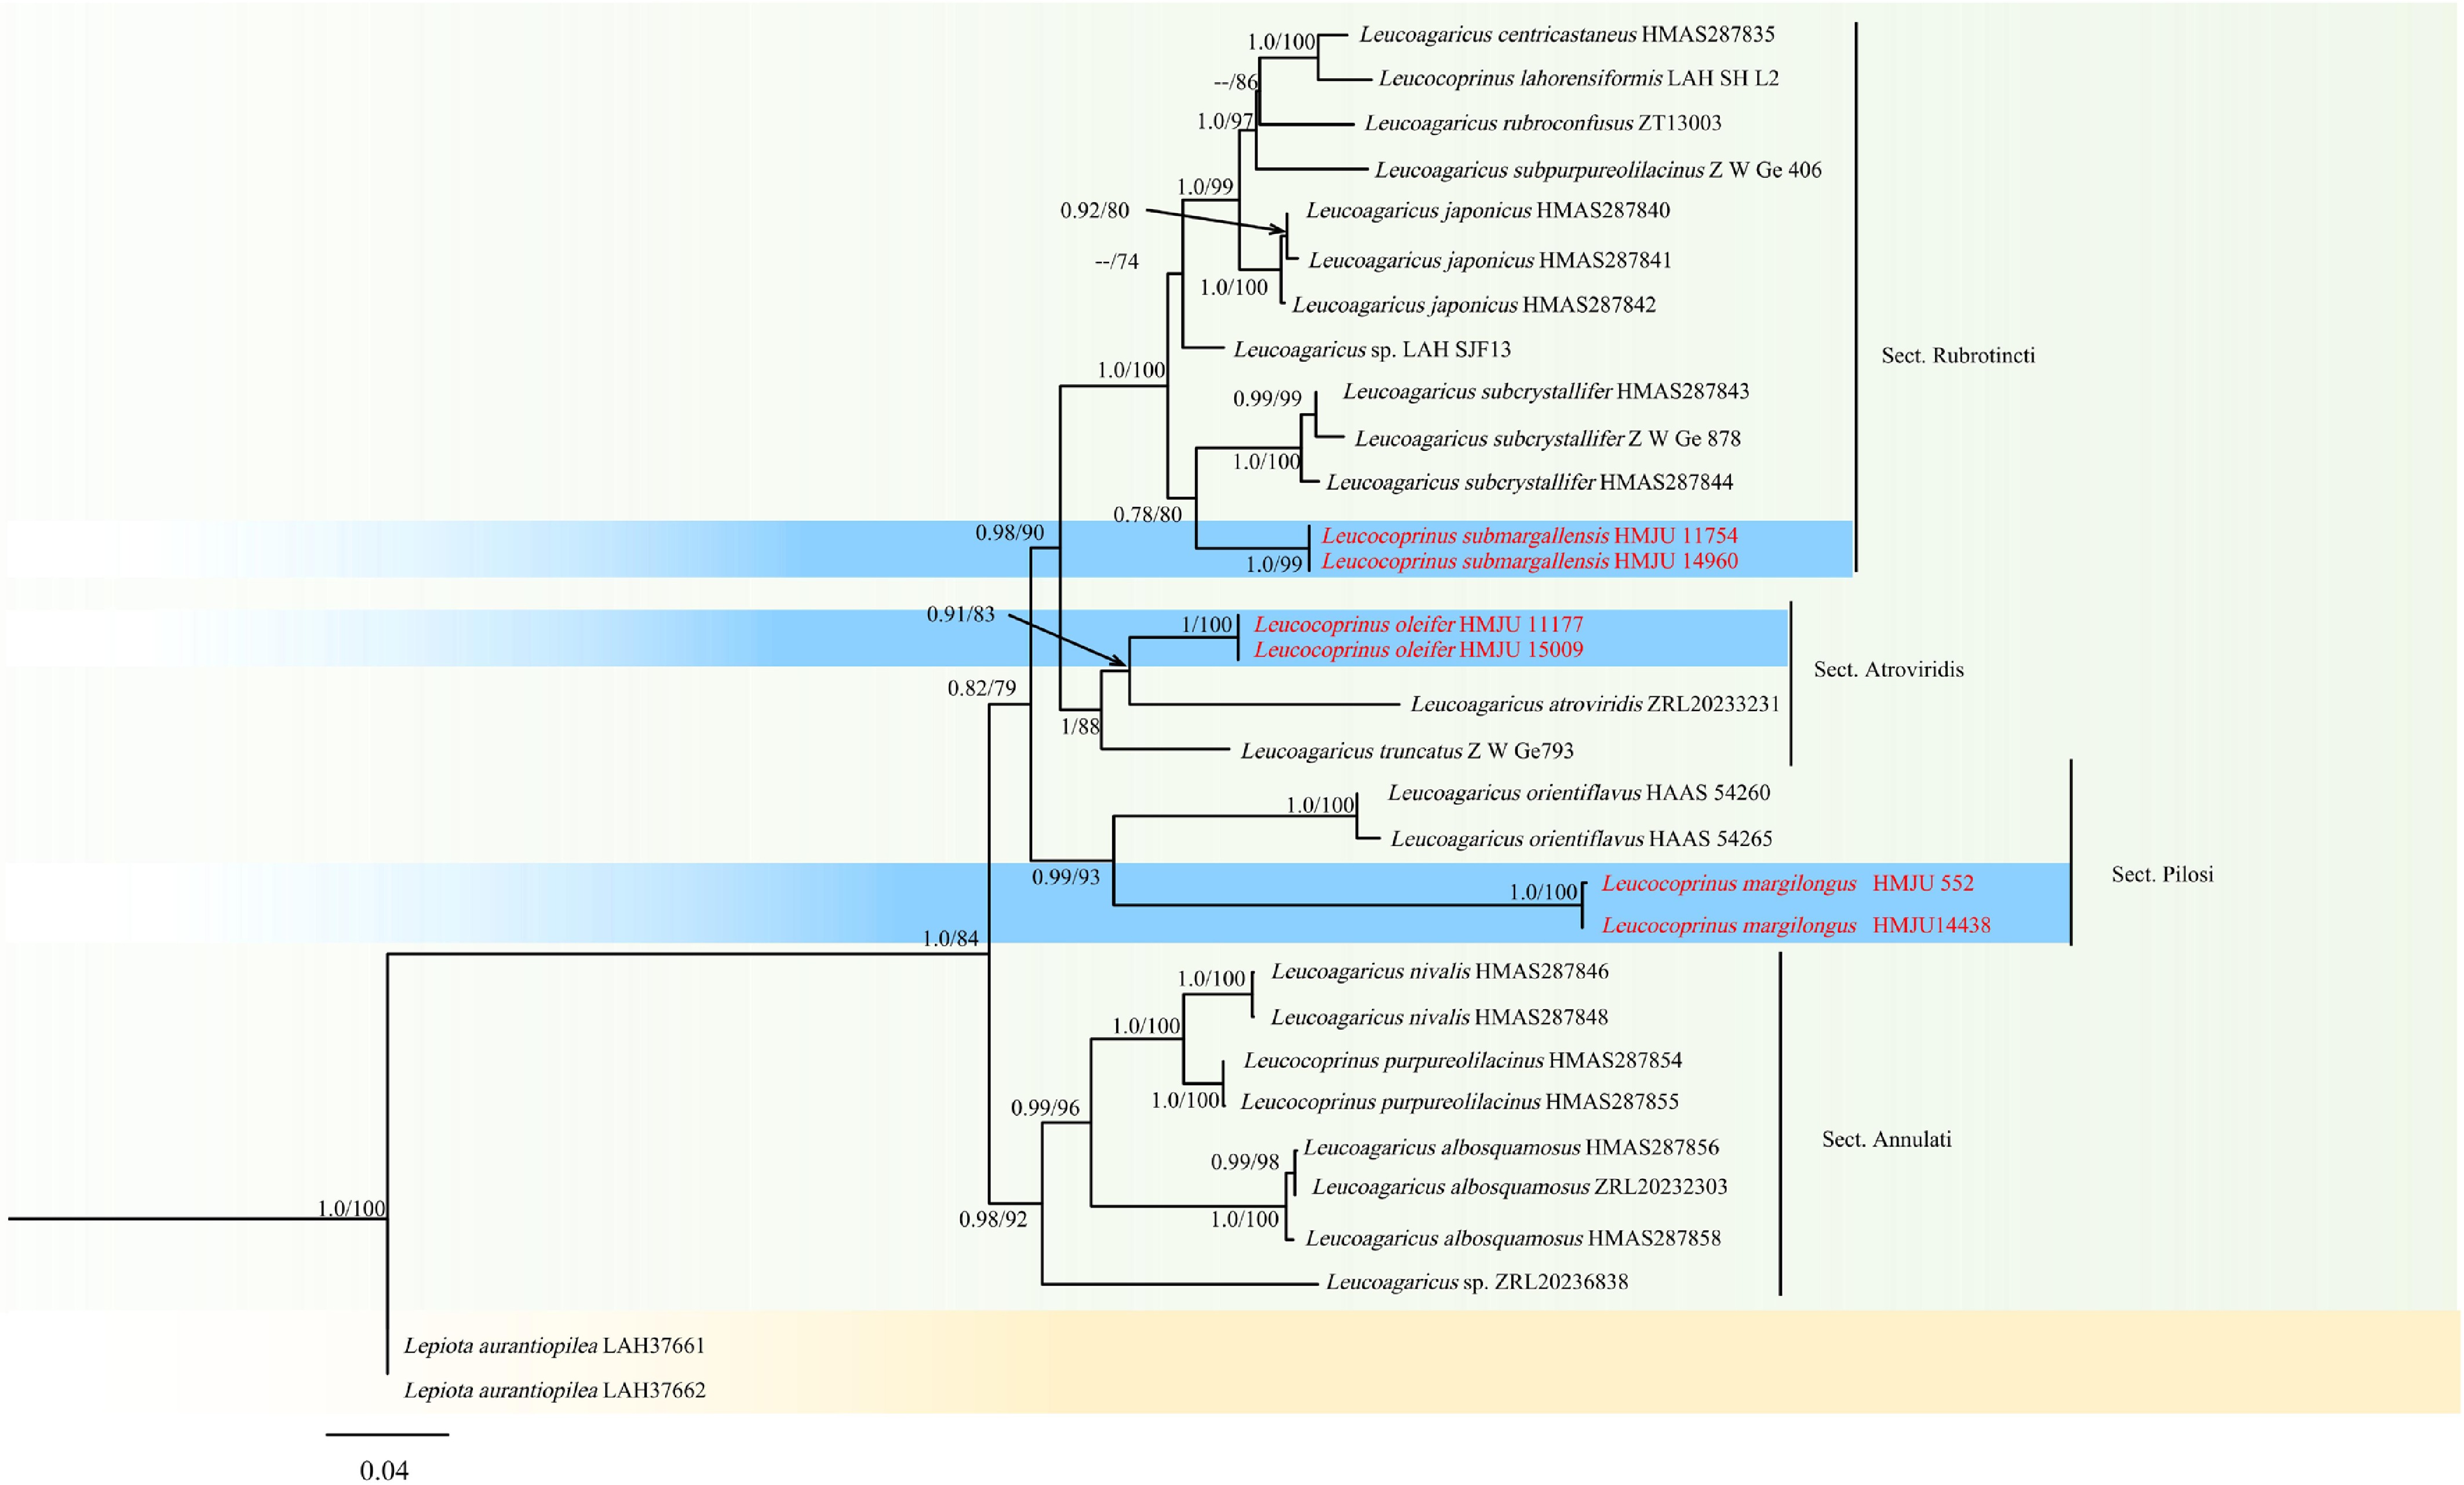
Figure 20.
Phylogram of Maximum Likelihood phylogenetic analysis based on combined ITS, nLSU, rpb2, and tef-1α sequences. The analysis includes 31 strains; total characters: 2,699 (ITS: 753, nLSU: 792, rpb2:659, tef-1α: 495). Lepiota aurantiopilea (LAH37661) and Lepiota aurantiopilea (LAH37662) were used as the outgroup taxa. The best model was SYM + I + G4. Estimated base frequencies were as follows: A = 0.250, C = 0.250, G = 0.250, T = 0.250. Bootstrap values for ML equal to or greater than 70% and BYPP values equal to or greater than 0.70 are labelled on the nodes. The type strains are in bold.
-
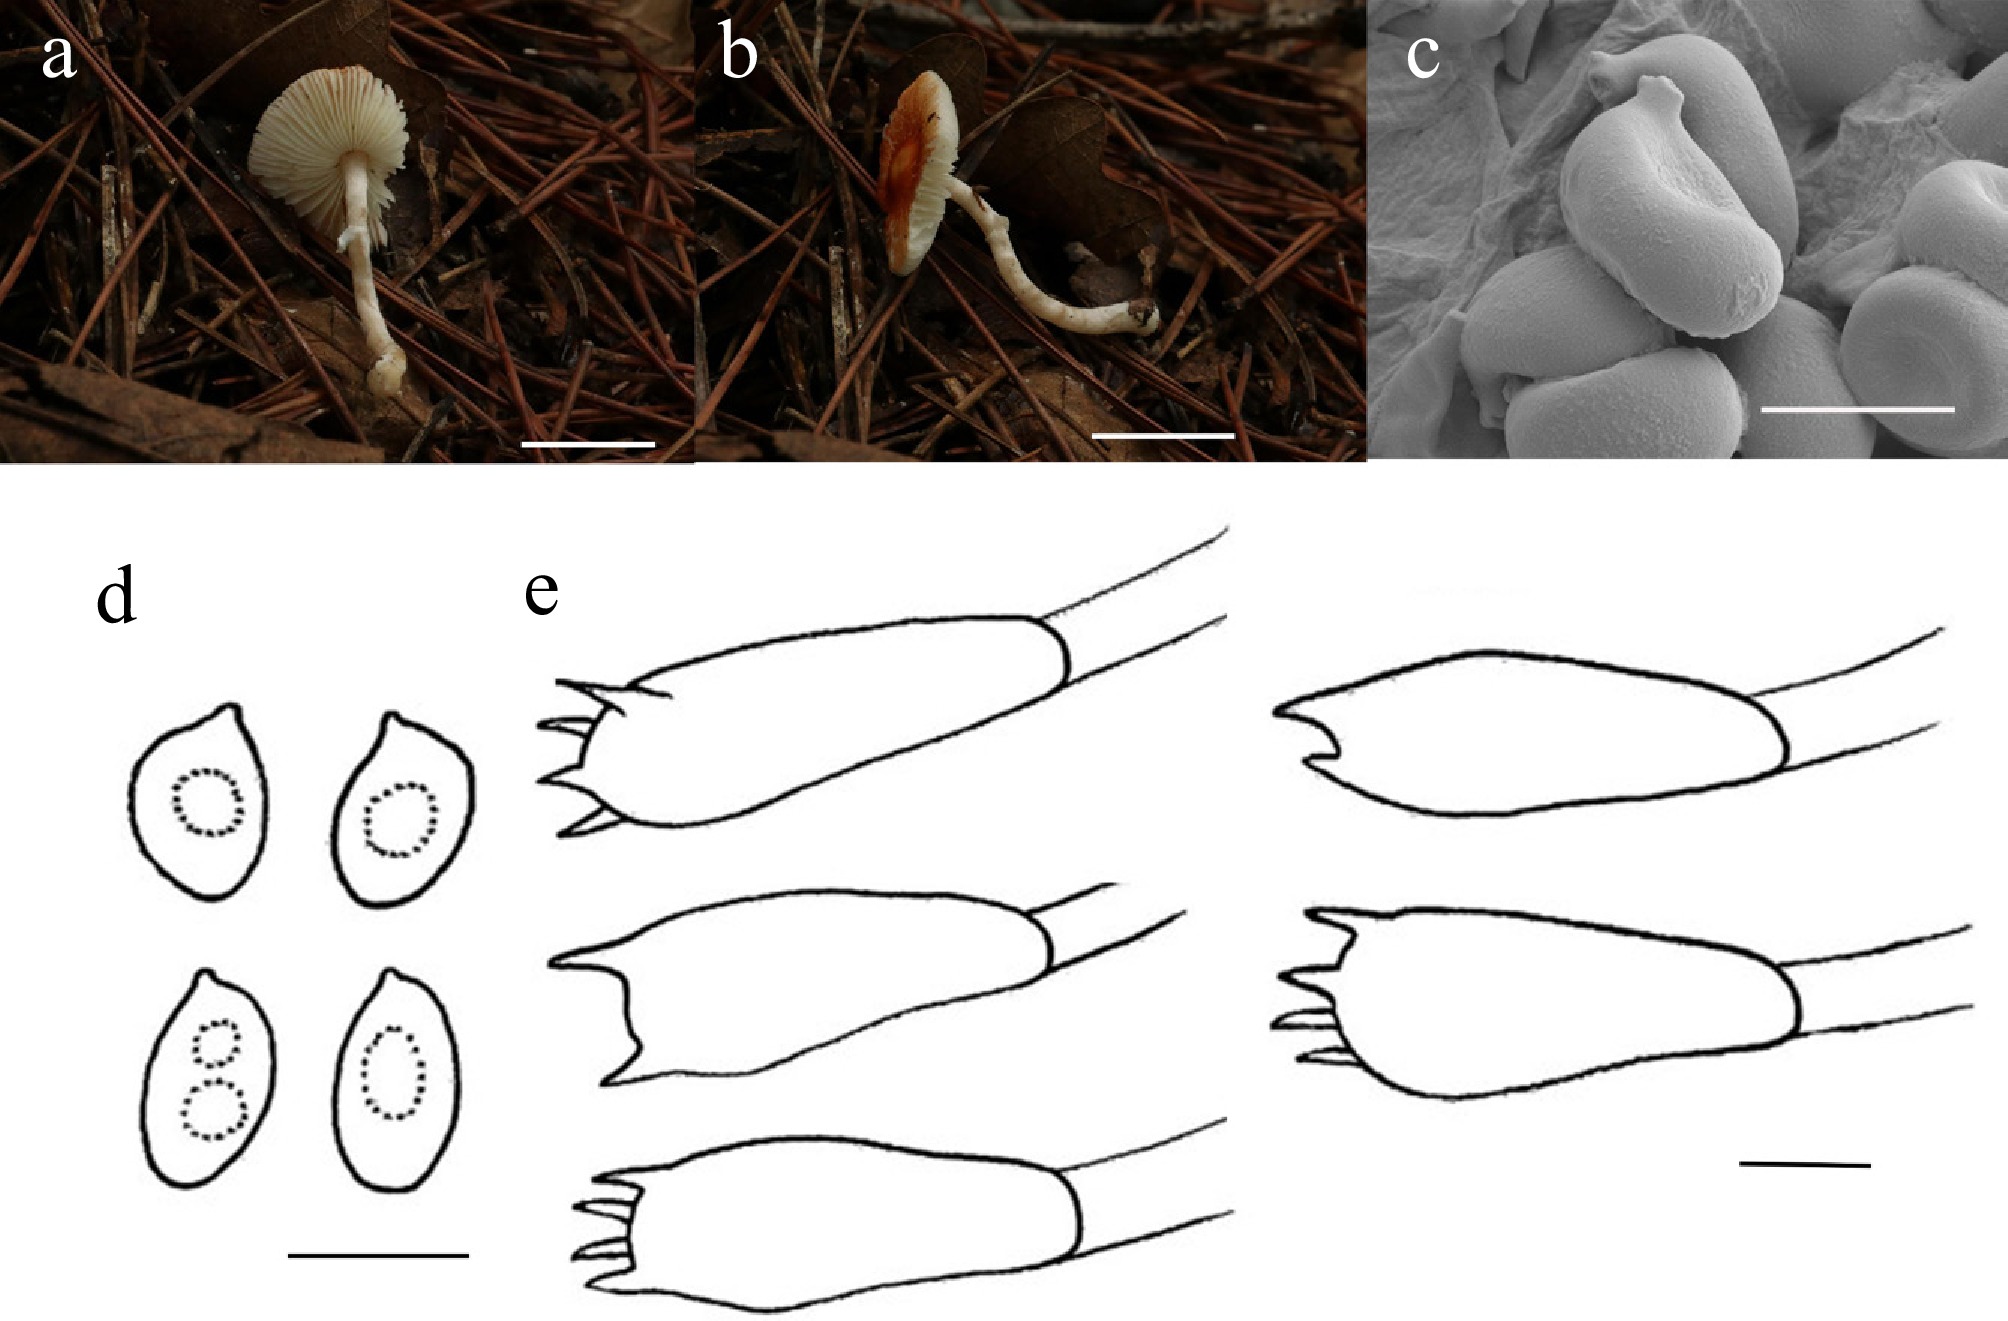
Figure 21.
Leucocoprinus margilongus (HMJU 552, holotype). (a), (b) Basidiocarps. (c) SEM images of basidiospores. (d) Basidiospores. (e) Basidia. Scale bars: (a), (b) 1 cm; (c)–(e) 5 µm.
-
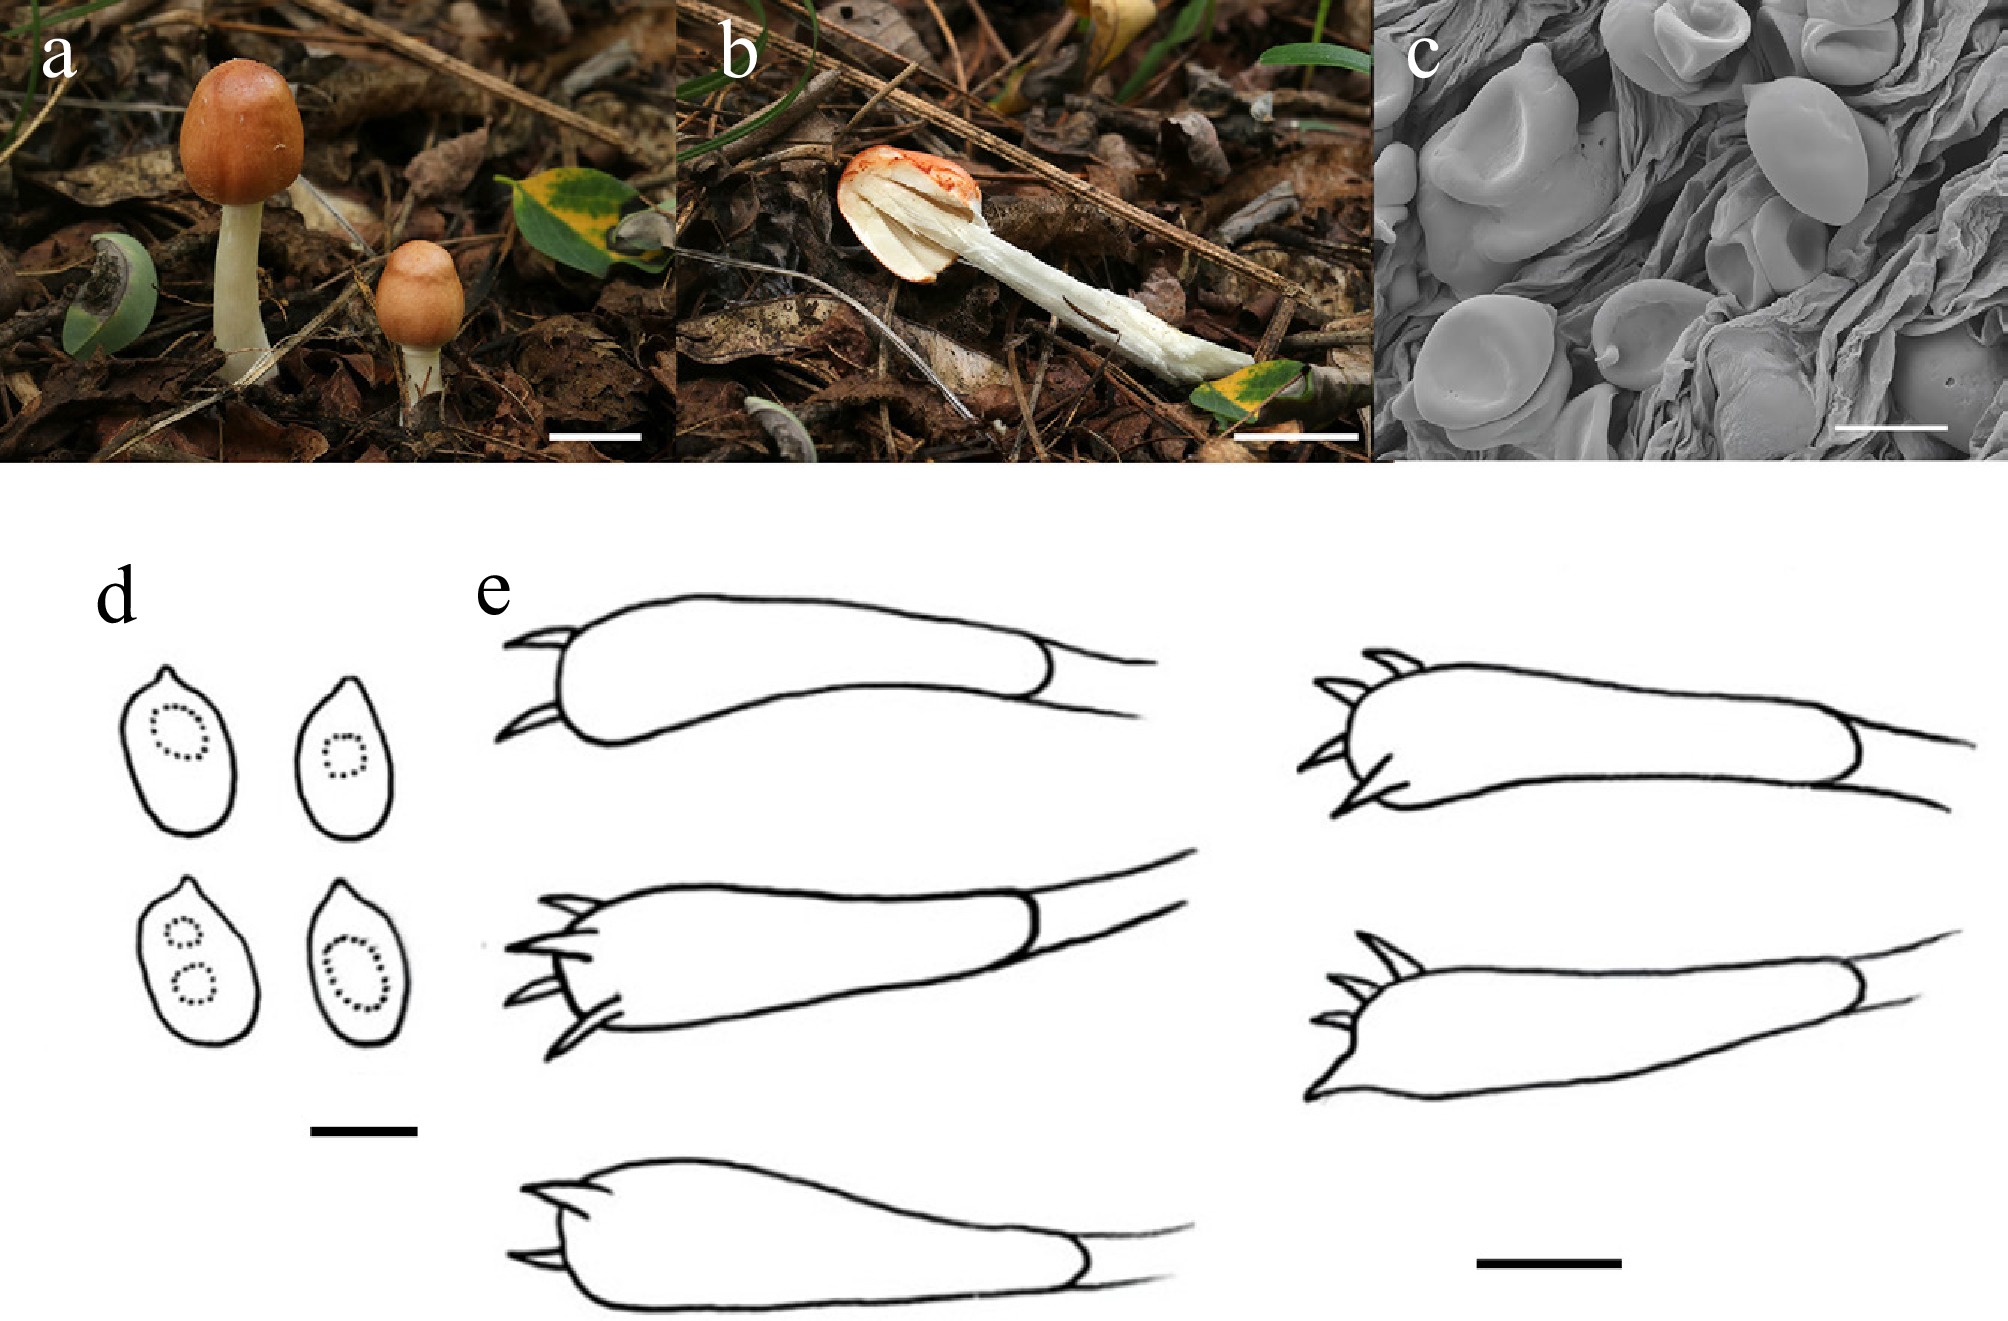
Figure 22.
Leucocoprinus submargallensis (HMJU 11754, holotype). (a), (b) Basidiocarps. (c) SEM images of basidiospores. (d) Basidiospores. (e) Basidia. Scale bars: (a) 1 cm; (b) 2 cm; and (c)–(e) 5 µm.
-
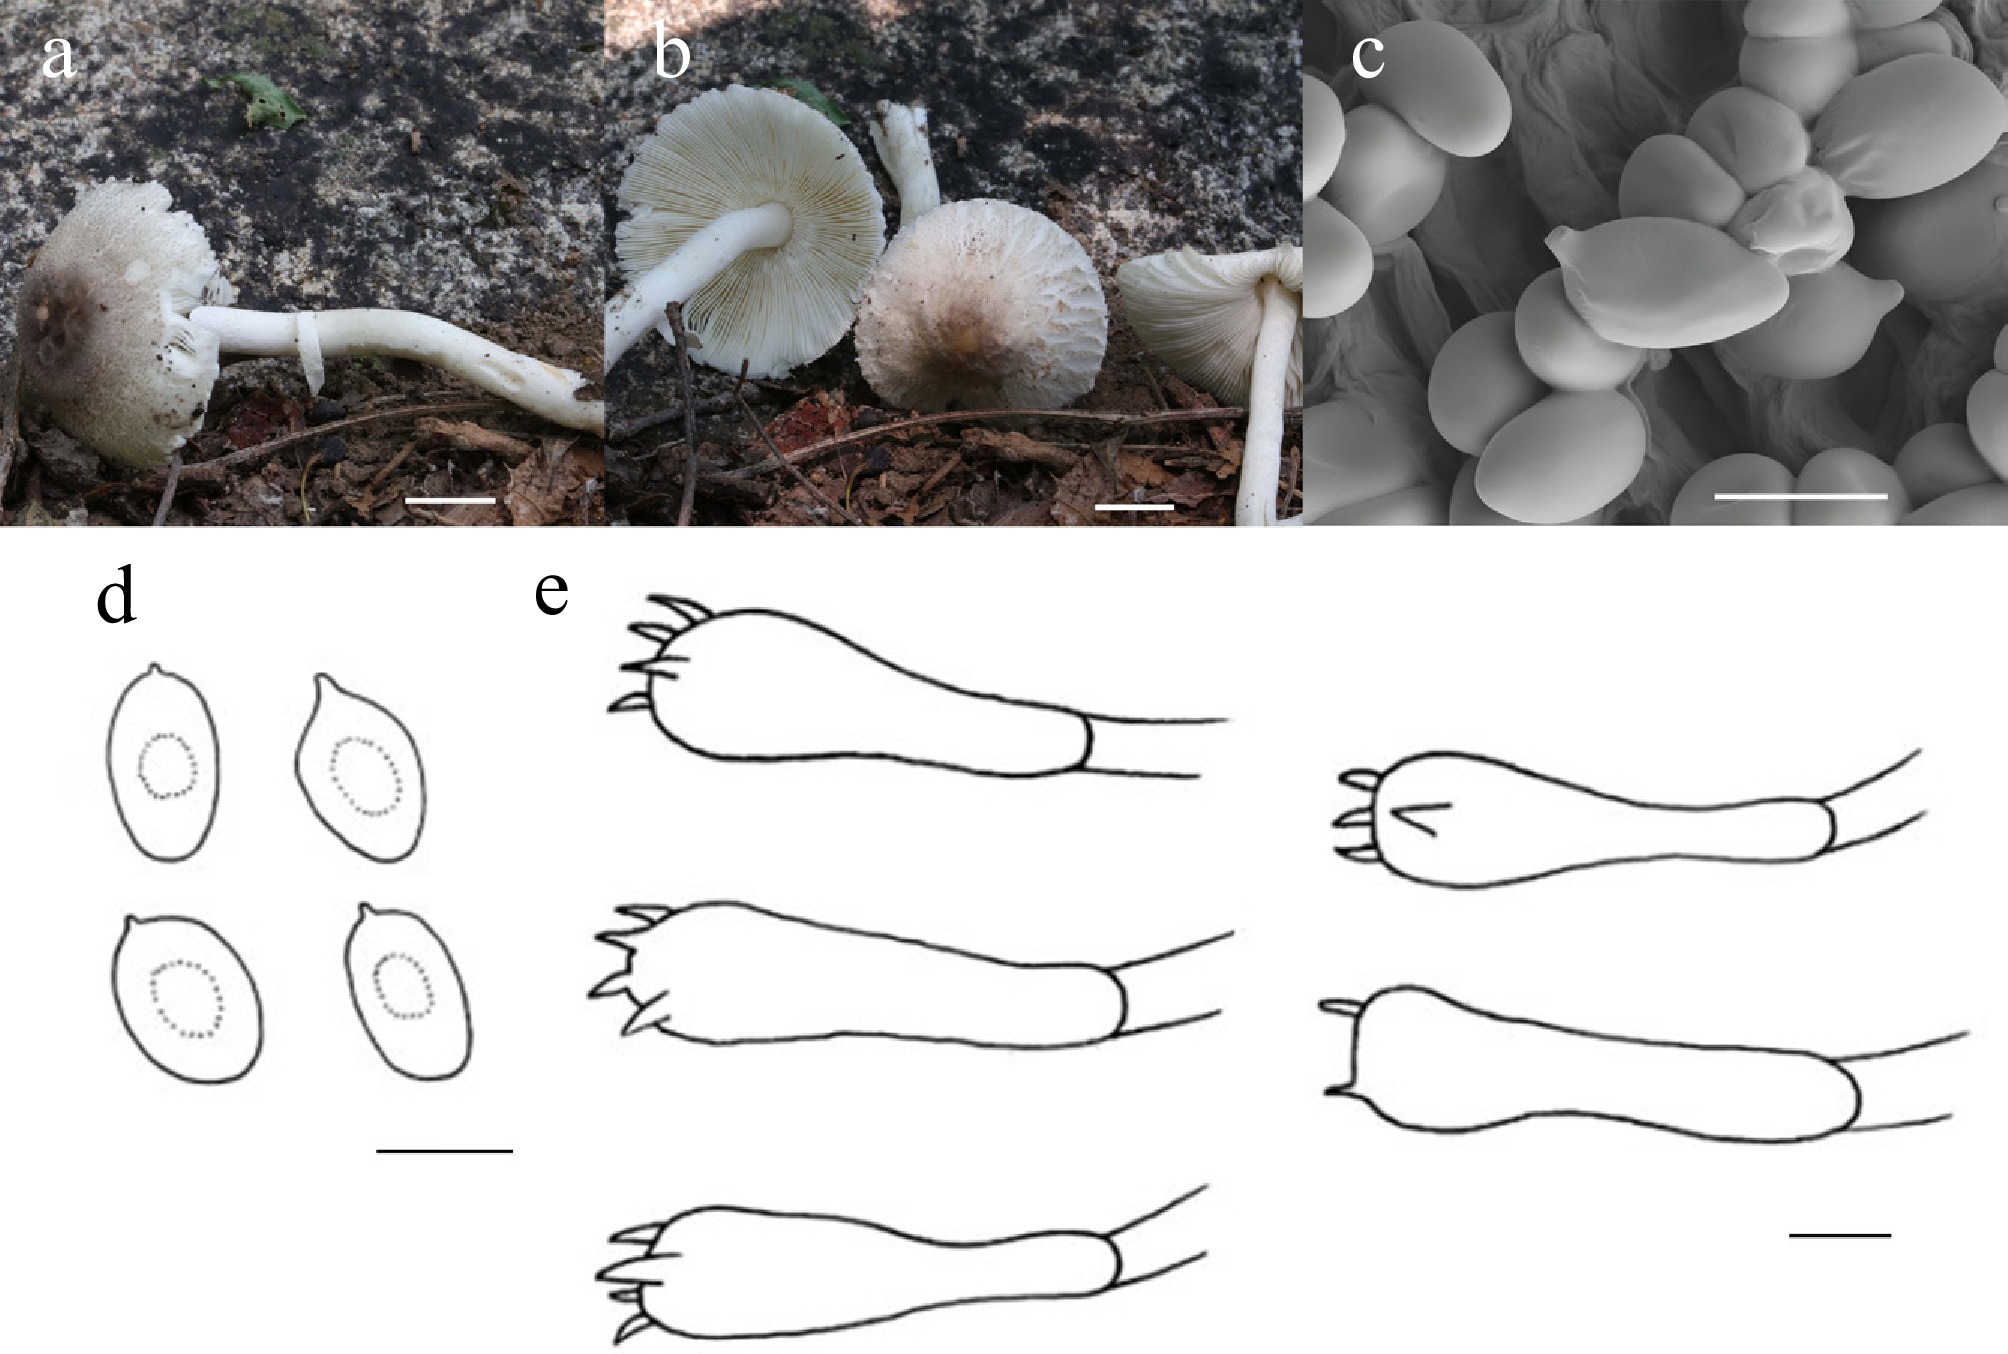
Figure 23.
Leucocoprinus oleifer (HMJU 11177, holotype). (a), (b) Basidiocarps; (c) SEM images of basidiospores; (d) Basidiospores; (e) Basidia. Scale bars: (a), (b) 1 cm; (c)–(e) 5 µm.
-
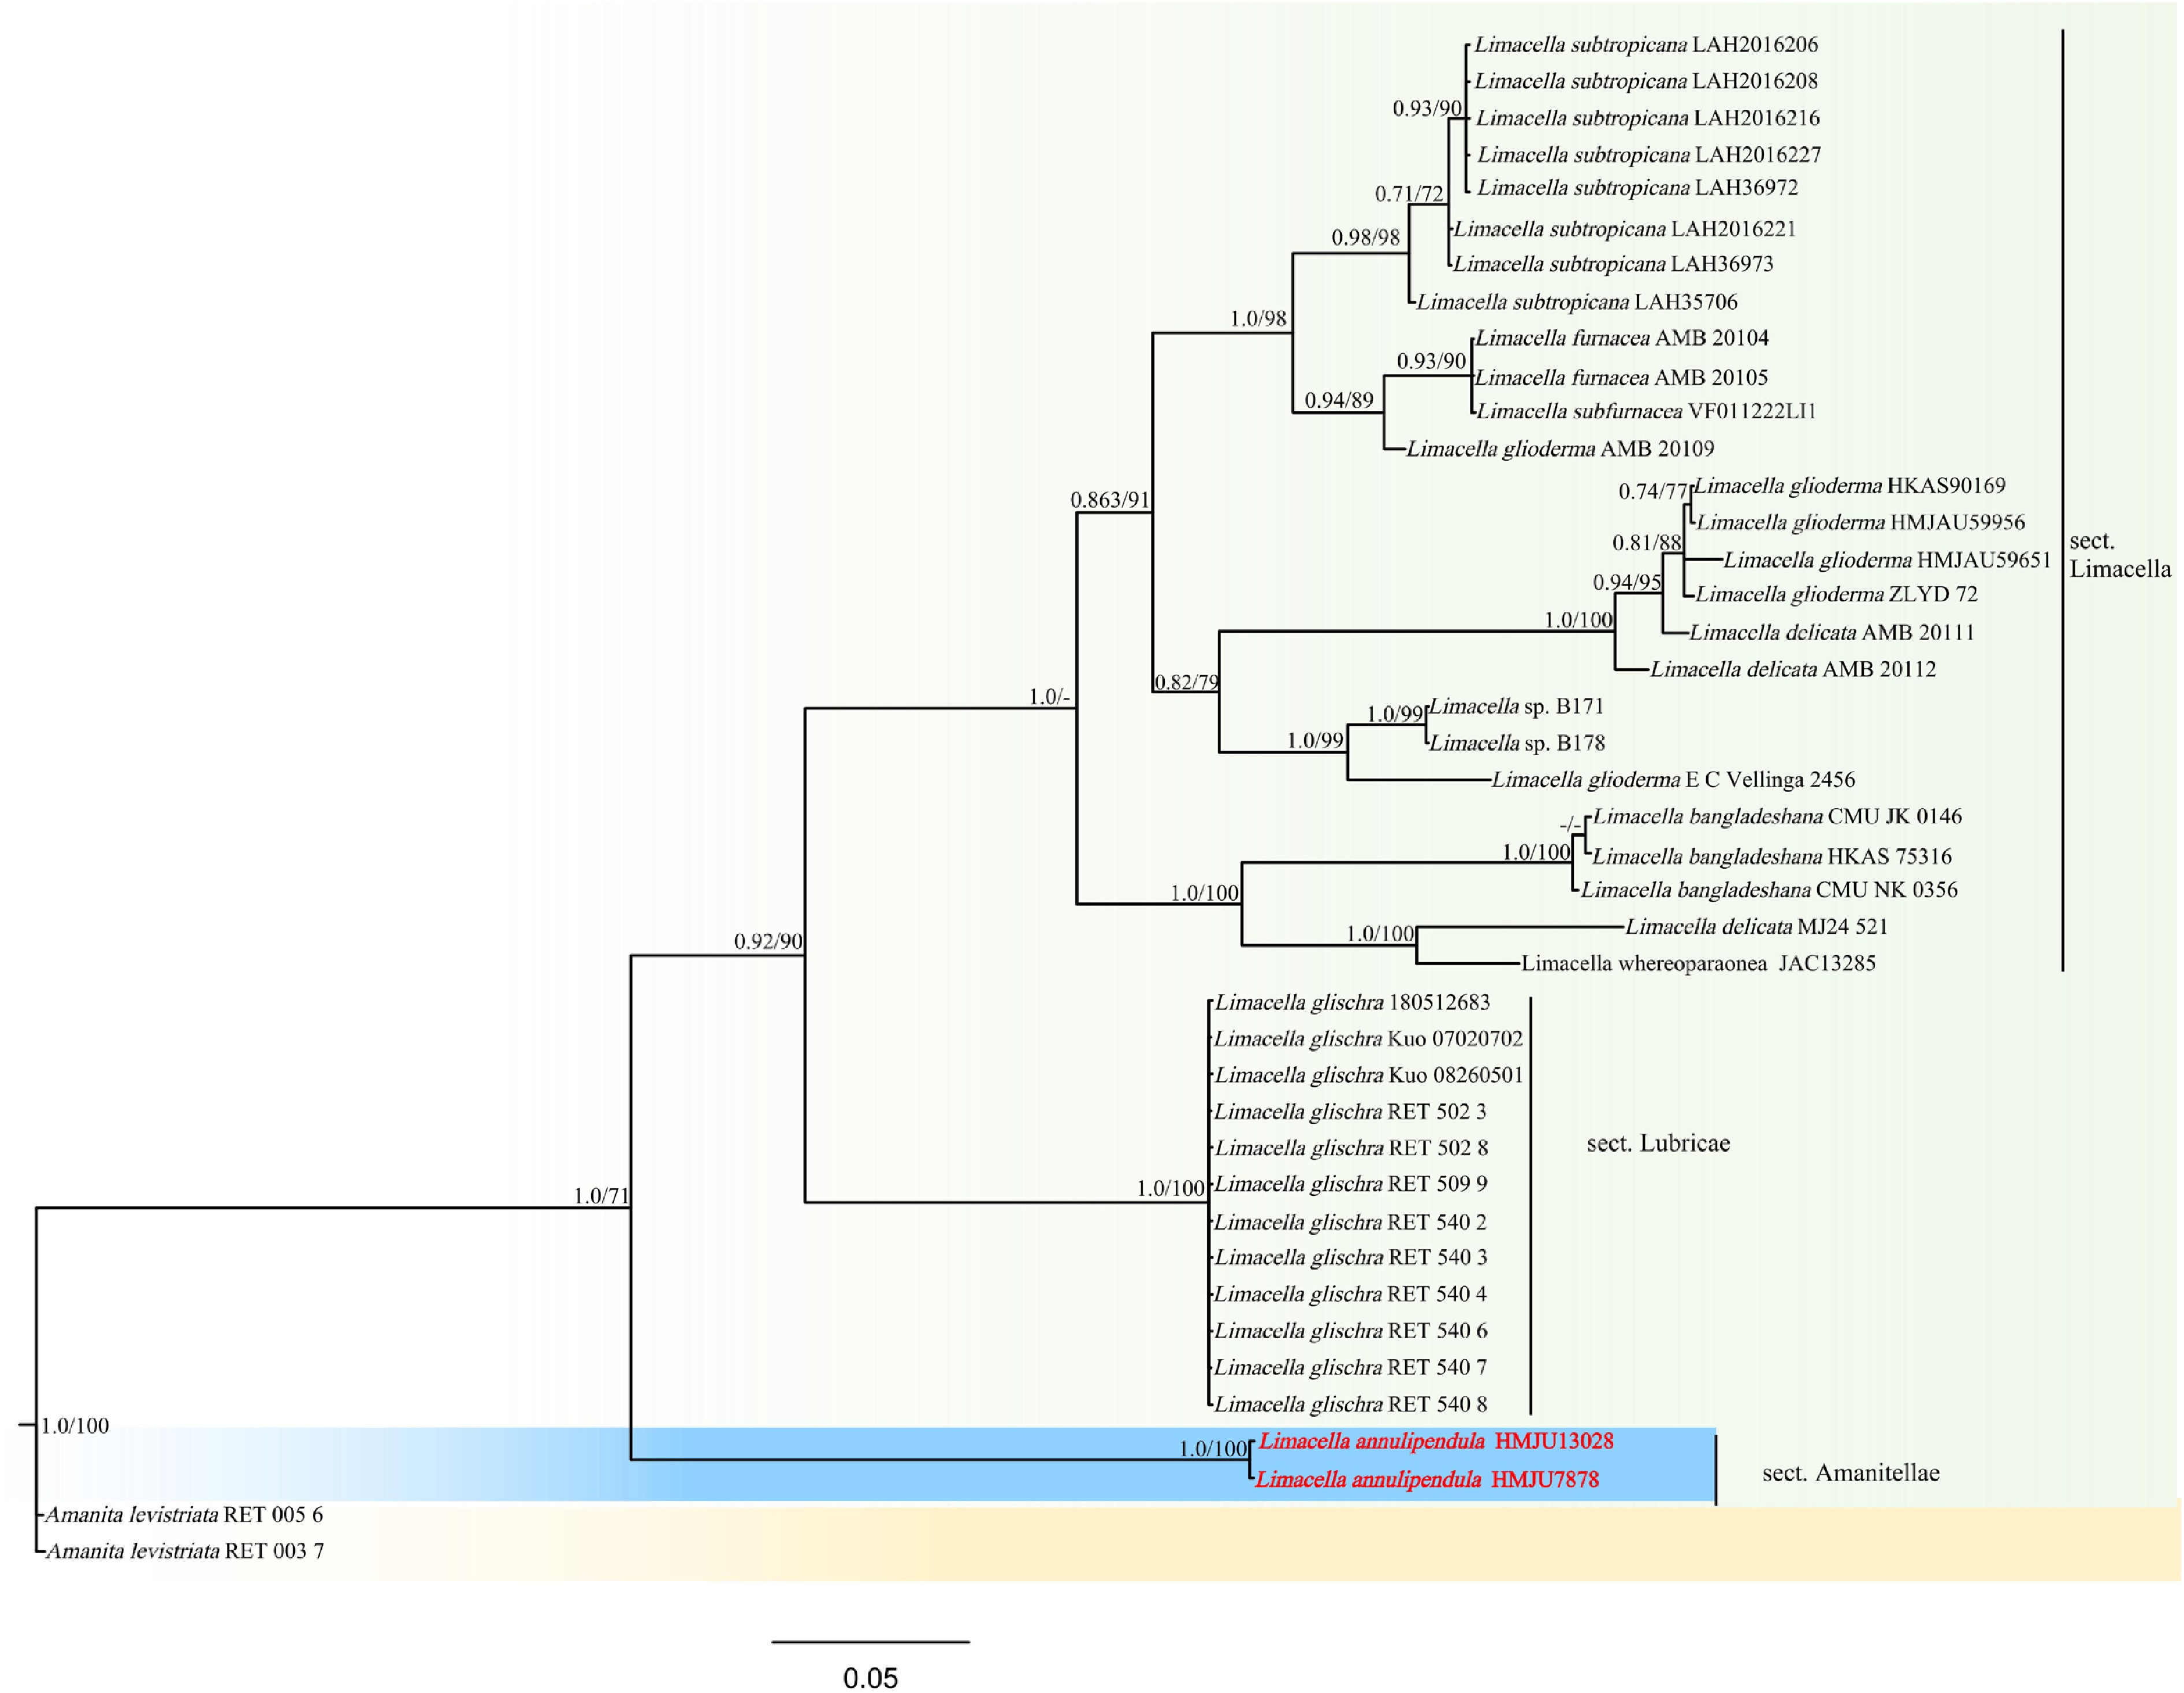
Figure 24.
Phylogram of Maximum Likelihood phylogenetic analysis based on combined ITS, nLSU, and sequences. The analysis includes 41 strains; total characters: 1,560 (ITS: 765, nLSU: 795). Amanita levistriata (RET 005 6) and Amanita levistriata (RET 003 7) were used as the outgroup taxa. The best model was TVM + F + I + G4. Estimated base frequencies were as follows: A = 0.299, C = 0.165, G = 0.227, T = 0.310. Bootstrap values for ML equal to or greater than 70% and BYPP values equal to or greater than 0.70 are labelled on the nodes. The type strains are in bold.
-
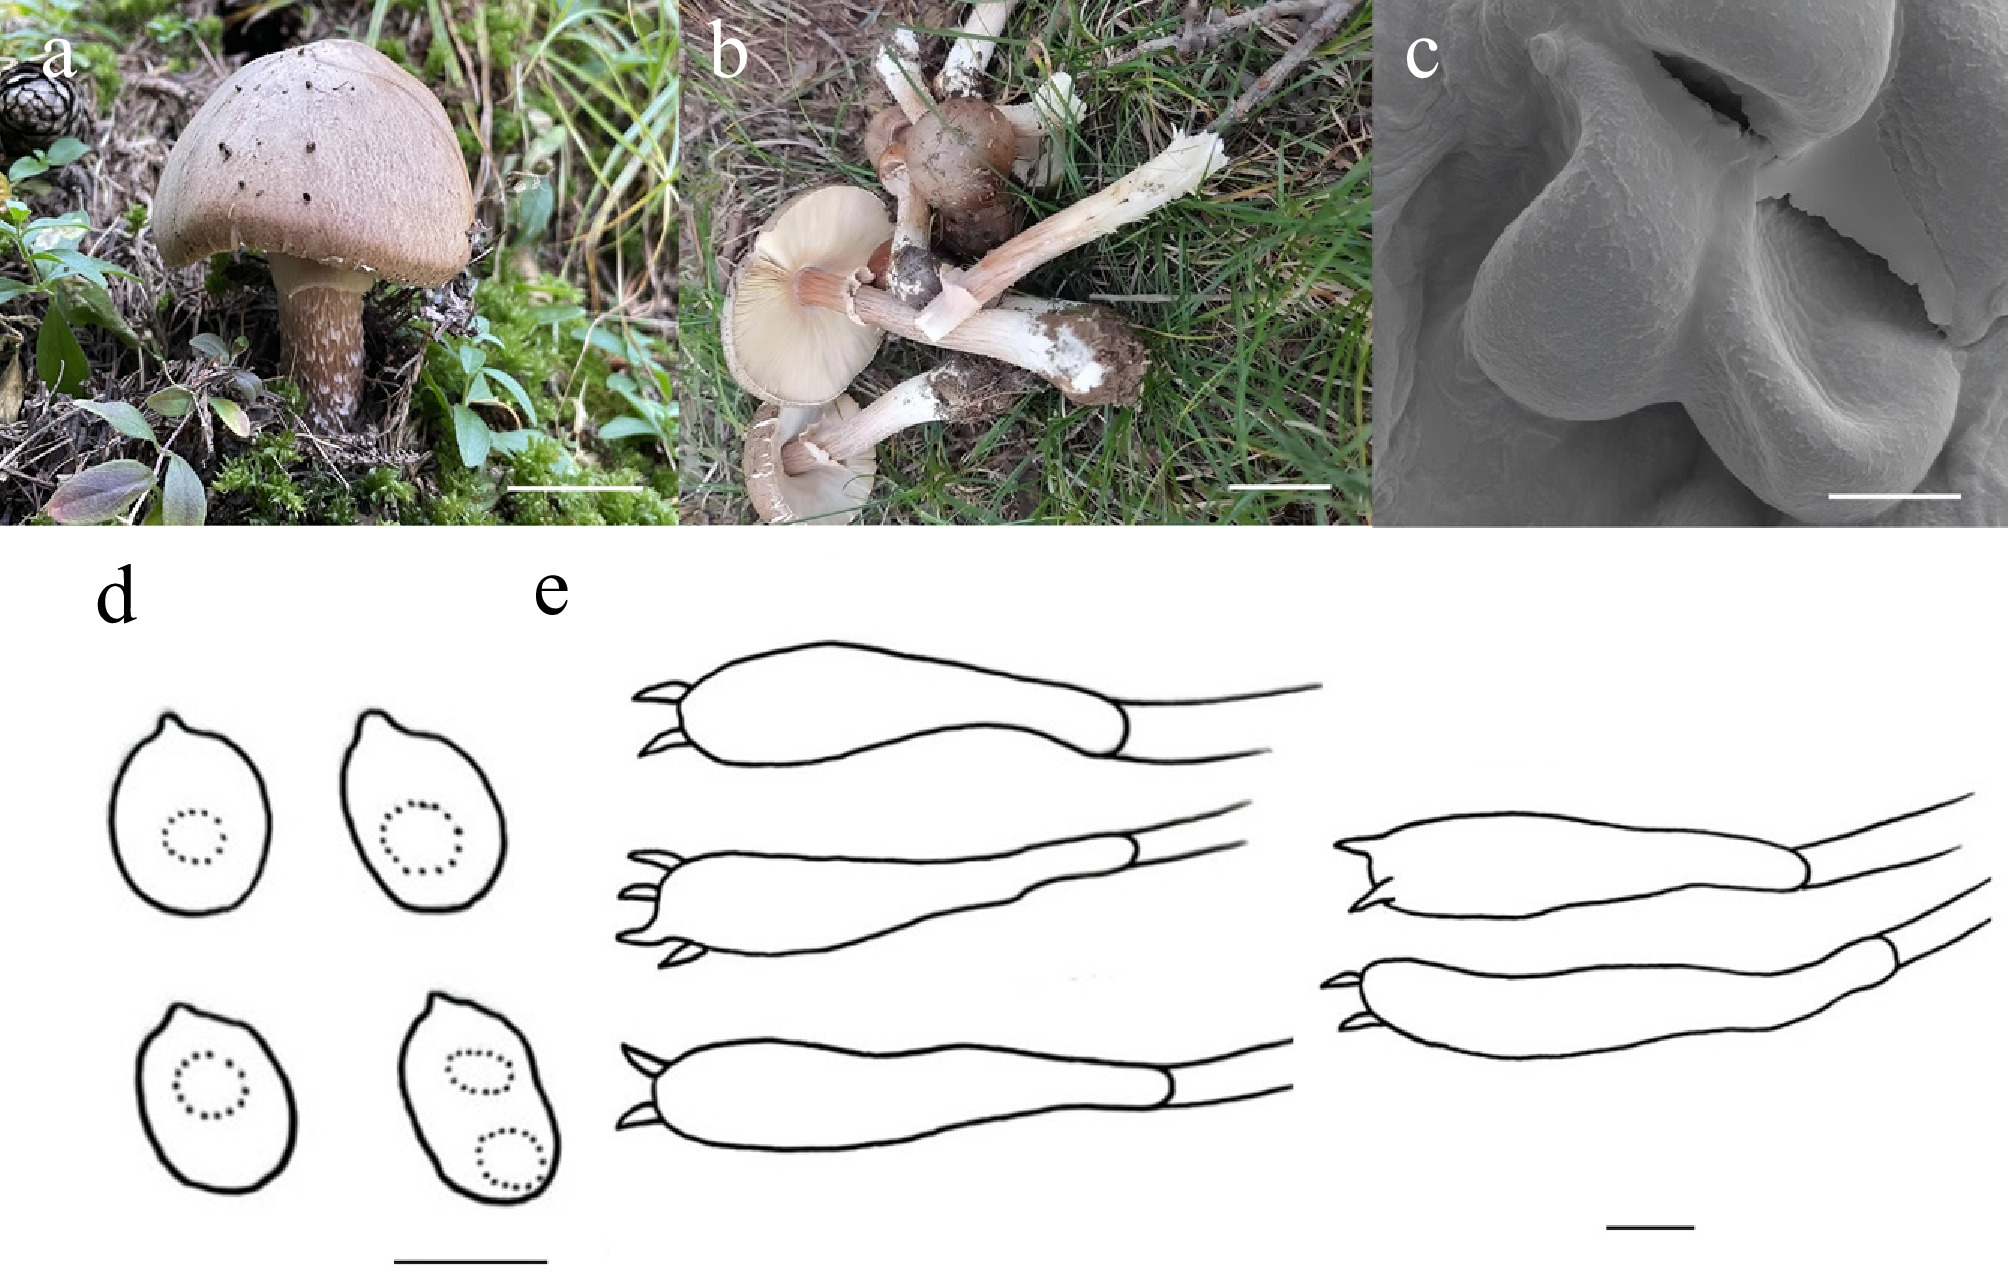
Figure 25.
Limacella annulipendula (HMJU 13028, holotype). (a), (b) Basidiocarps. (c) SEM images of basidiospores. (d) Basidiospores. (e) Basidia. Scale bars: (a), (b) 3 cm; (c)–(e) 5 µm.
-
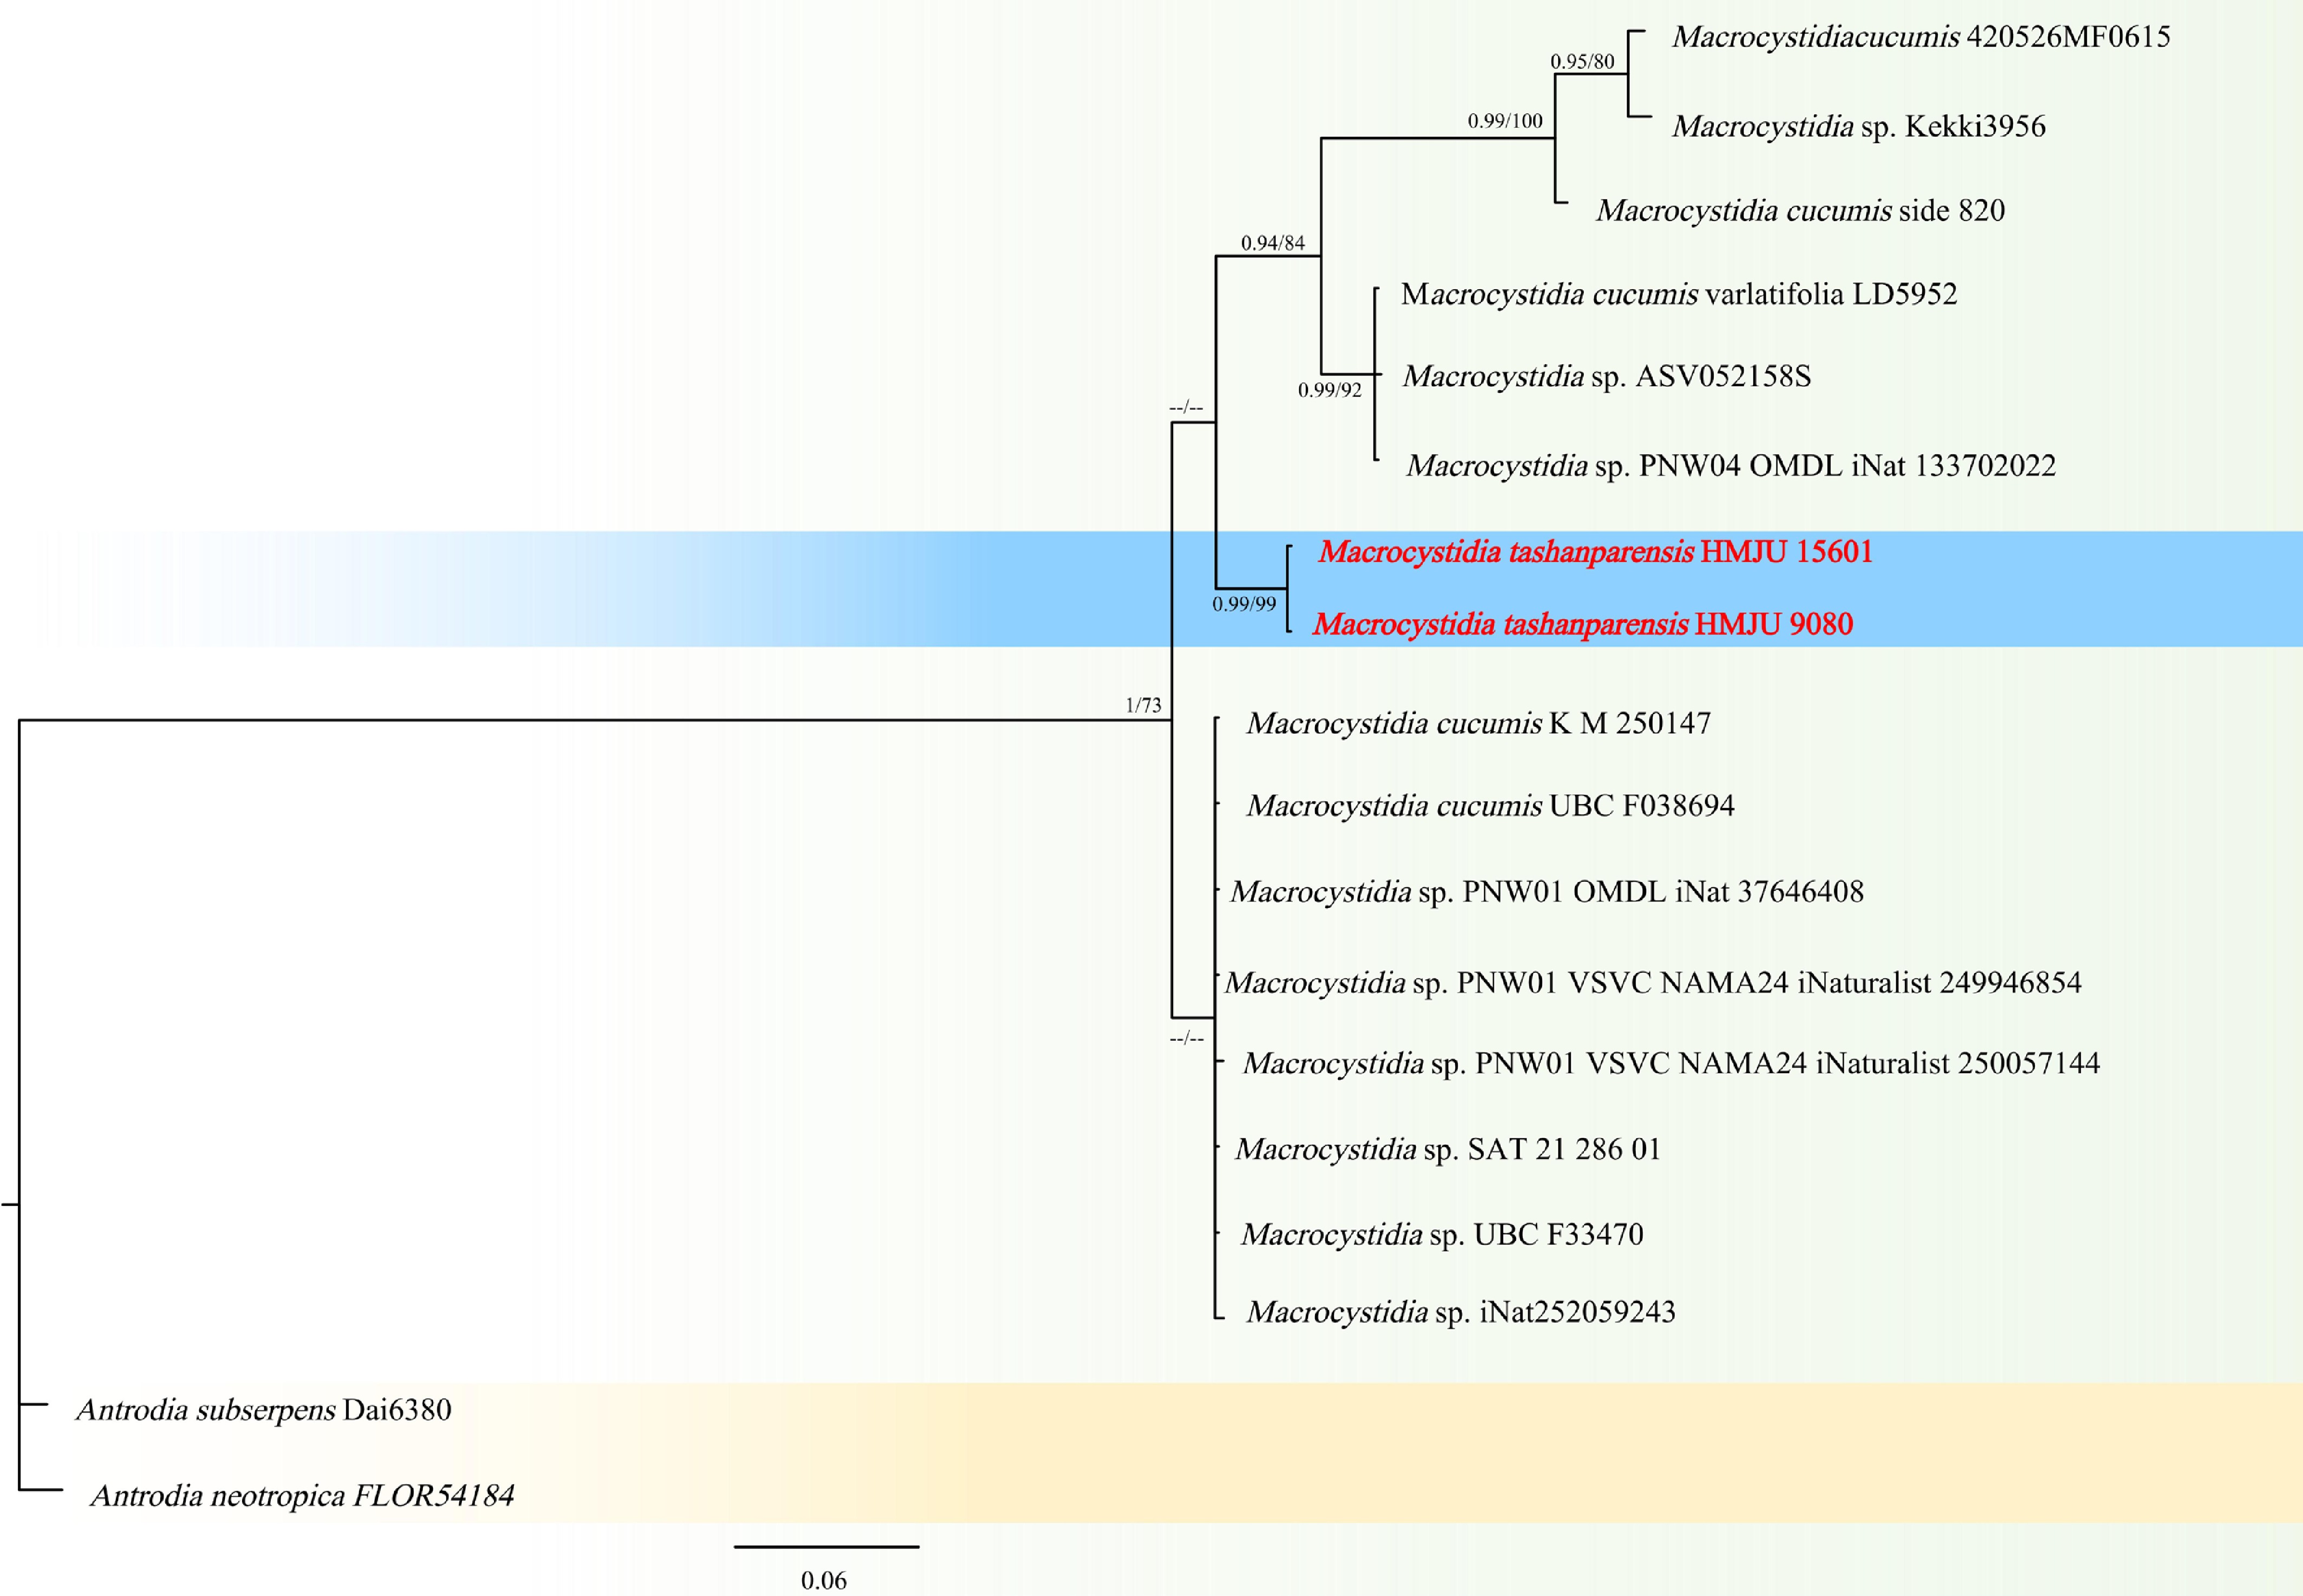
Figure 26.
Phylogram of Maximum Likelihood phylogenetic analysis based on combined ITS sequences. The analysis includes 18 strains; total characters: 586 (ITS: 586). Antrodia neotropica (FLOR 54184), and Antrodia subserpens (Dai 6380) were used as the outgroup taxa. The best model was HKY + F + I. Estimated base frequencies were as follows: A = 0.227, C = 0.232, G = 0.224, T = 0.317. Bootstrap values for ML equal to or greater than 70% and BYPP values equal to or greater than 0.70 are labelled on the nodes. The type strains are in bold.
-
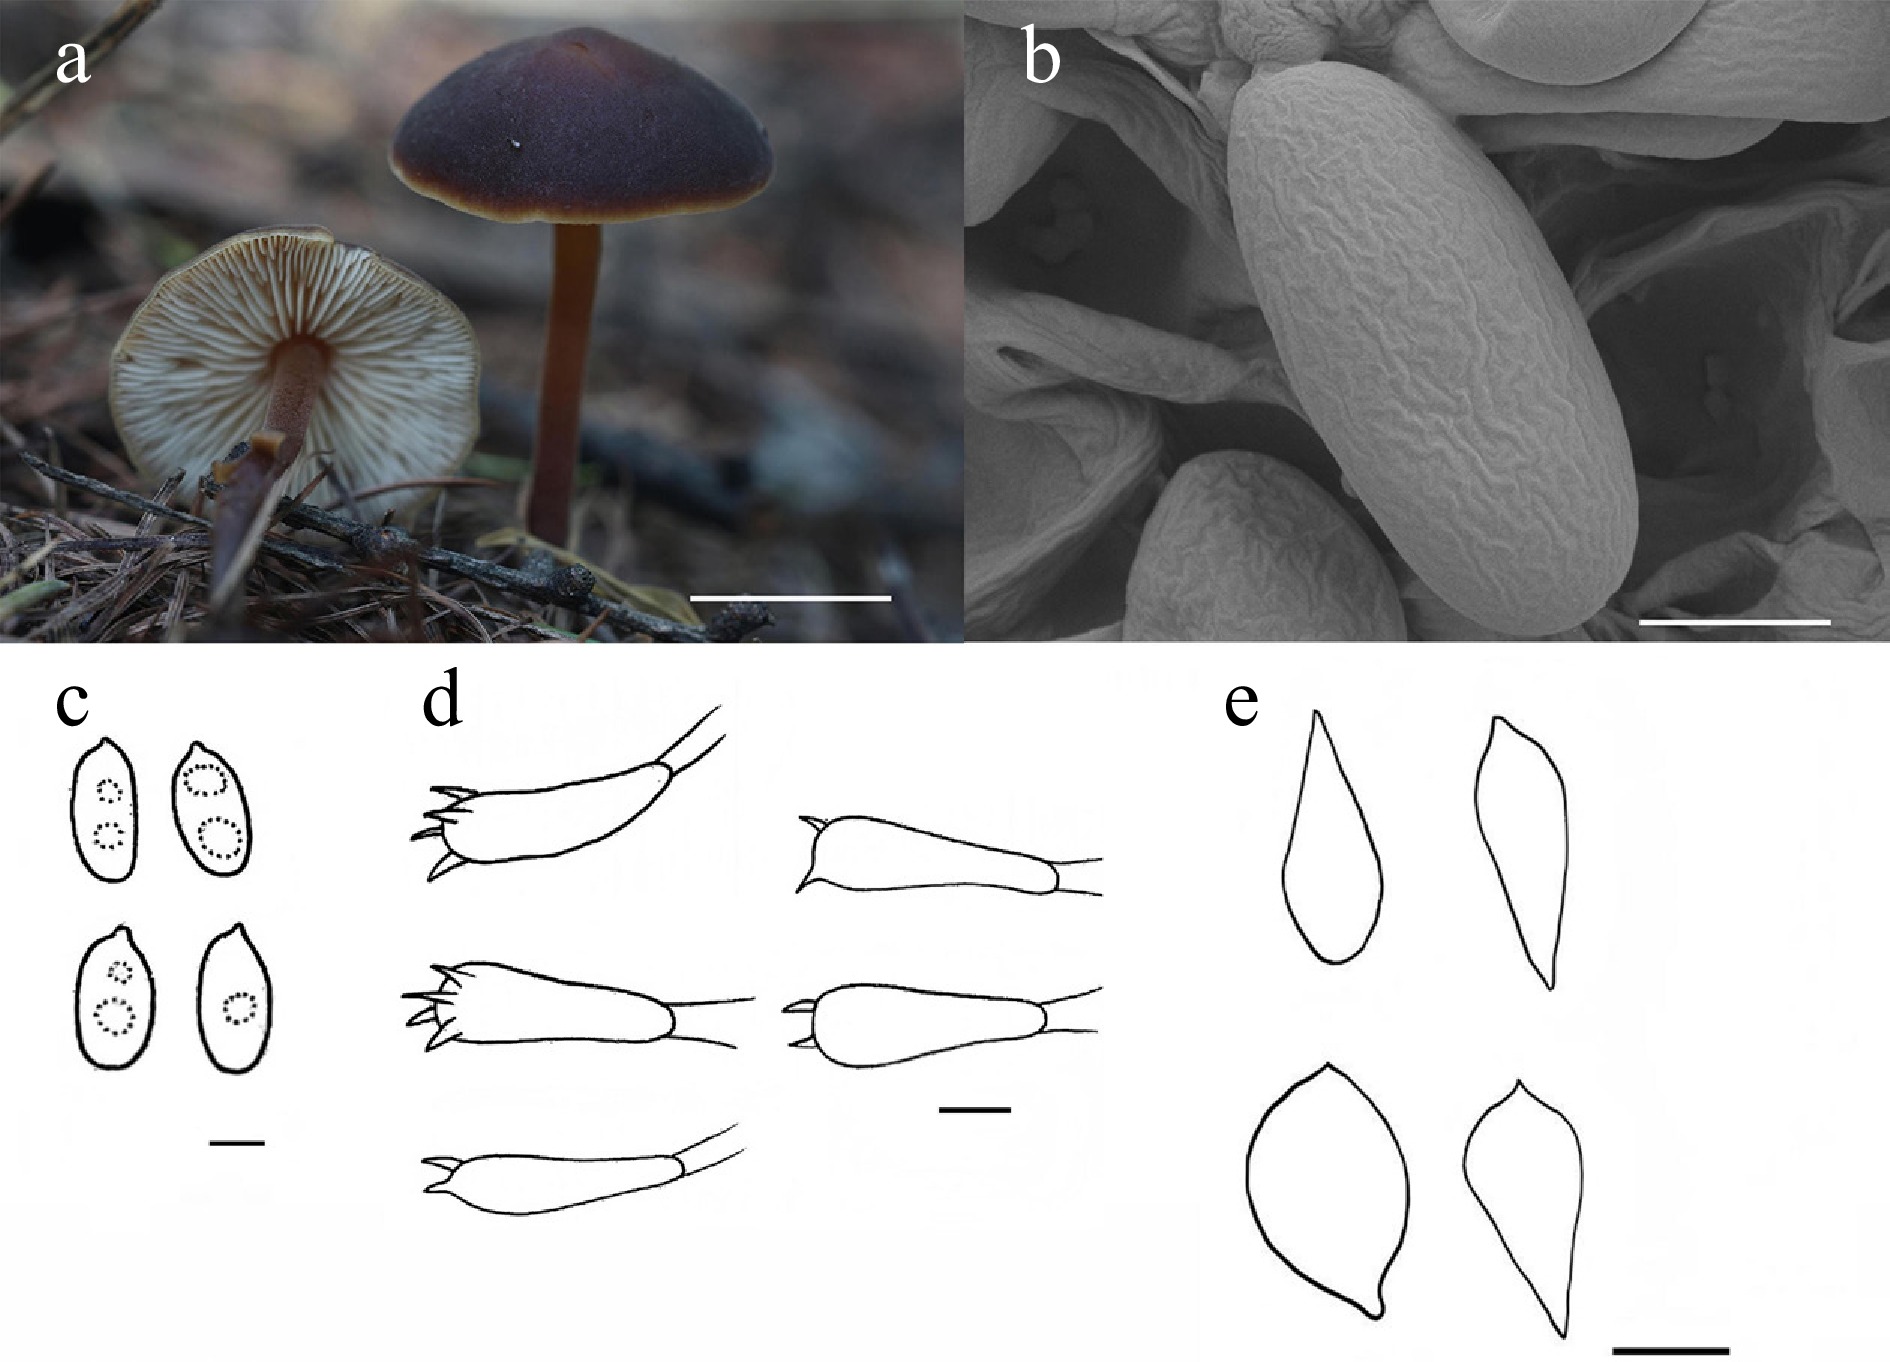
Figure 27.
Macrocystidia tashanparensis (HMJU 15601, holotype). (a) Basidiocarps. (b) SEM images of basidiospores. (c) Basidiospores. (d) Basidia. (e) Cheilocystidia. Scale bars: (a) 1 cm; (b), (c) 3 µm; and (d) 10 µm.
-
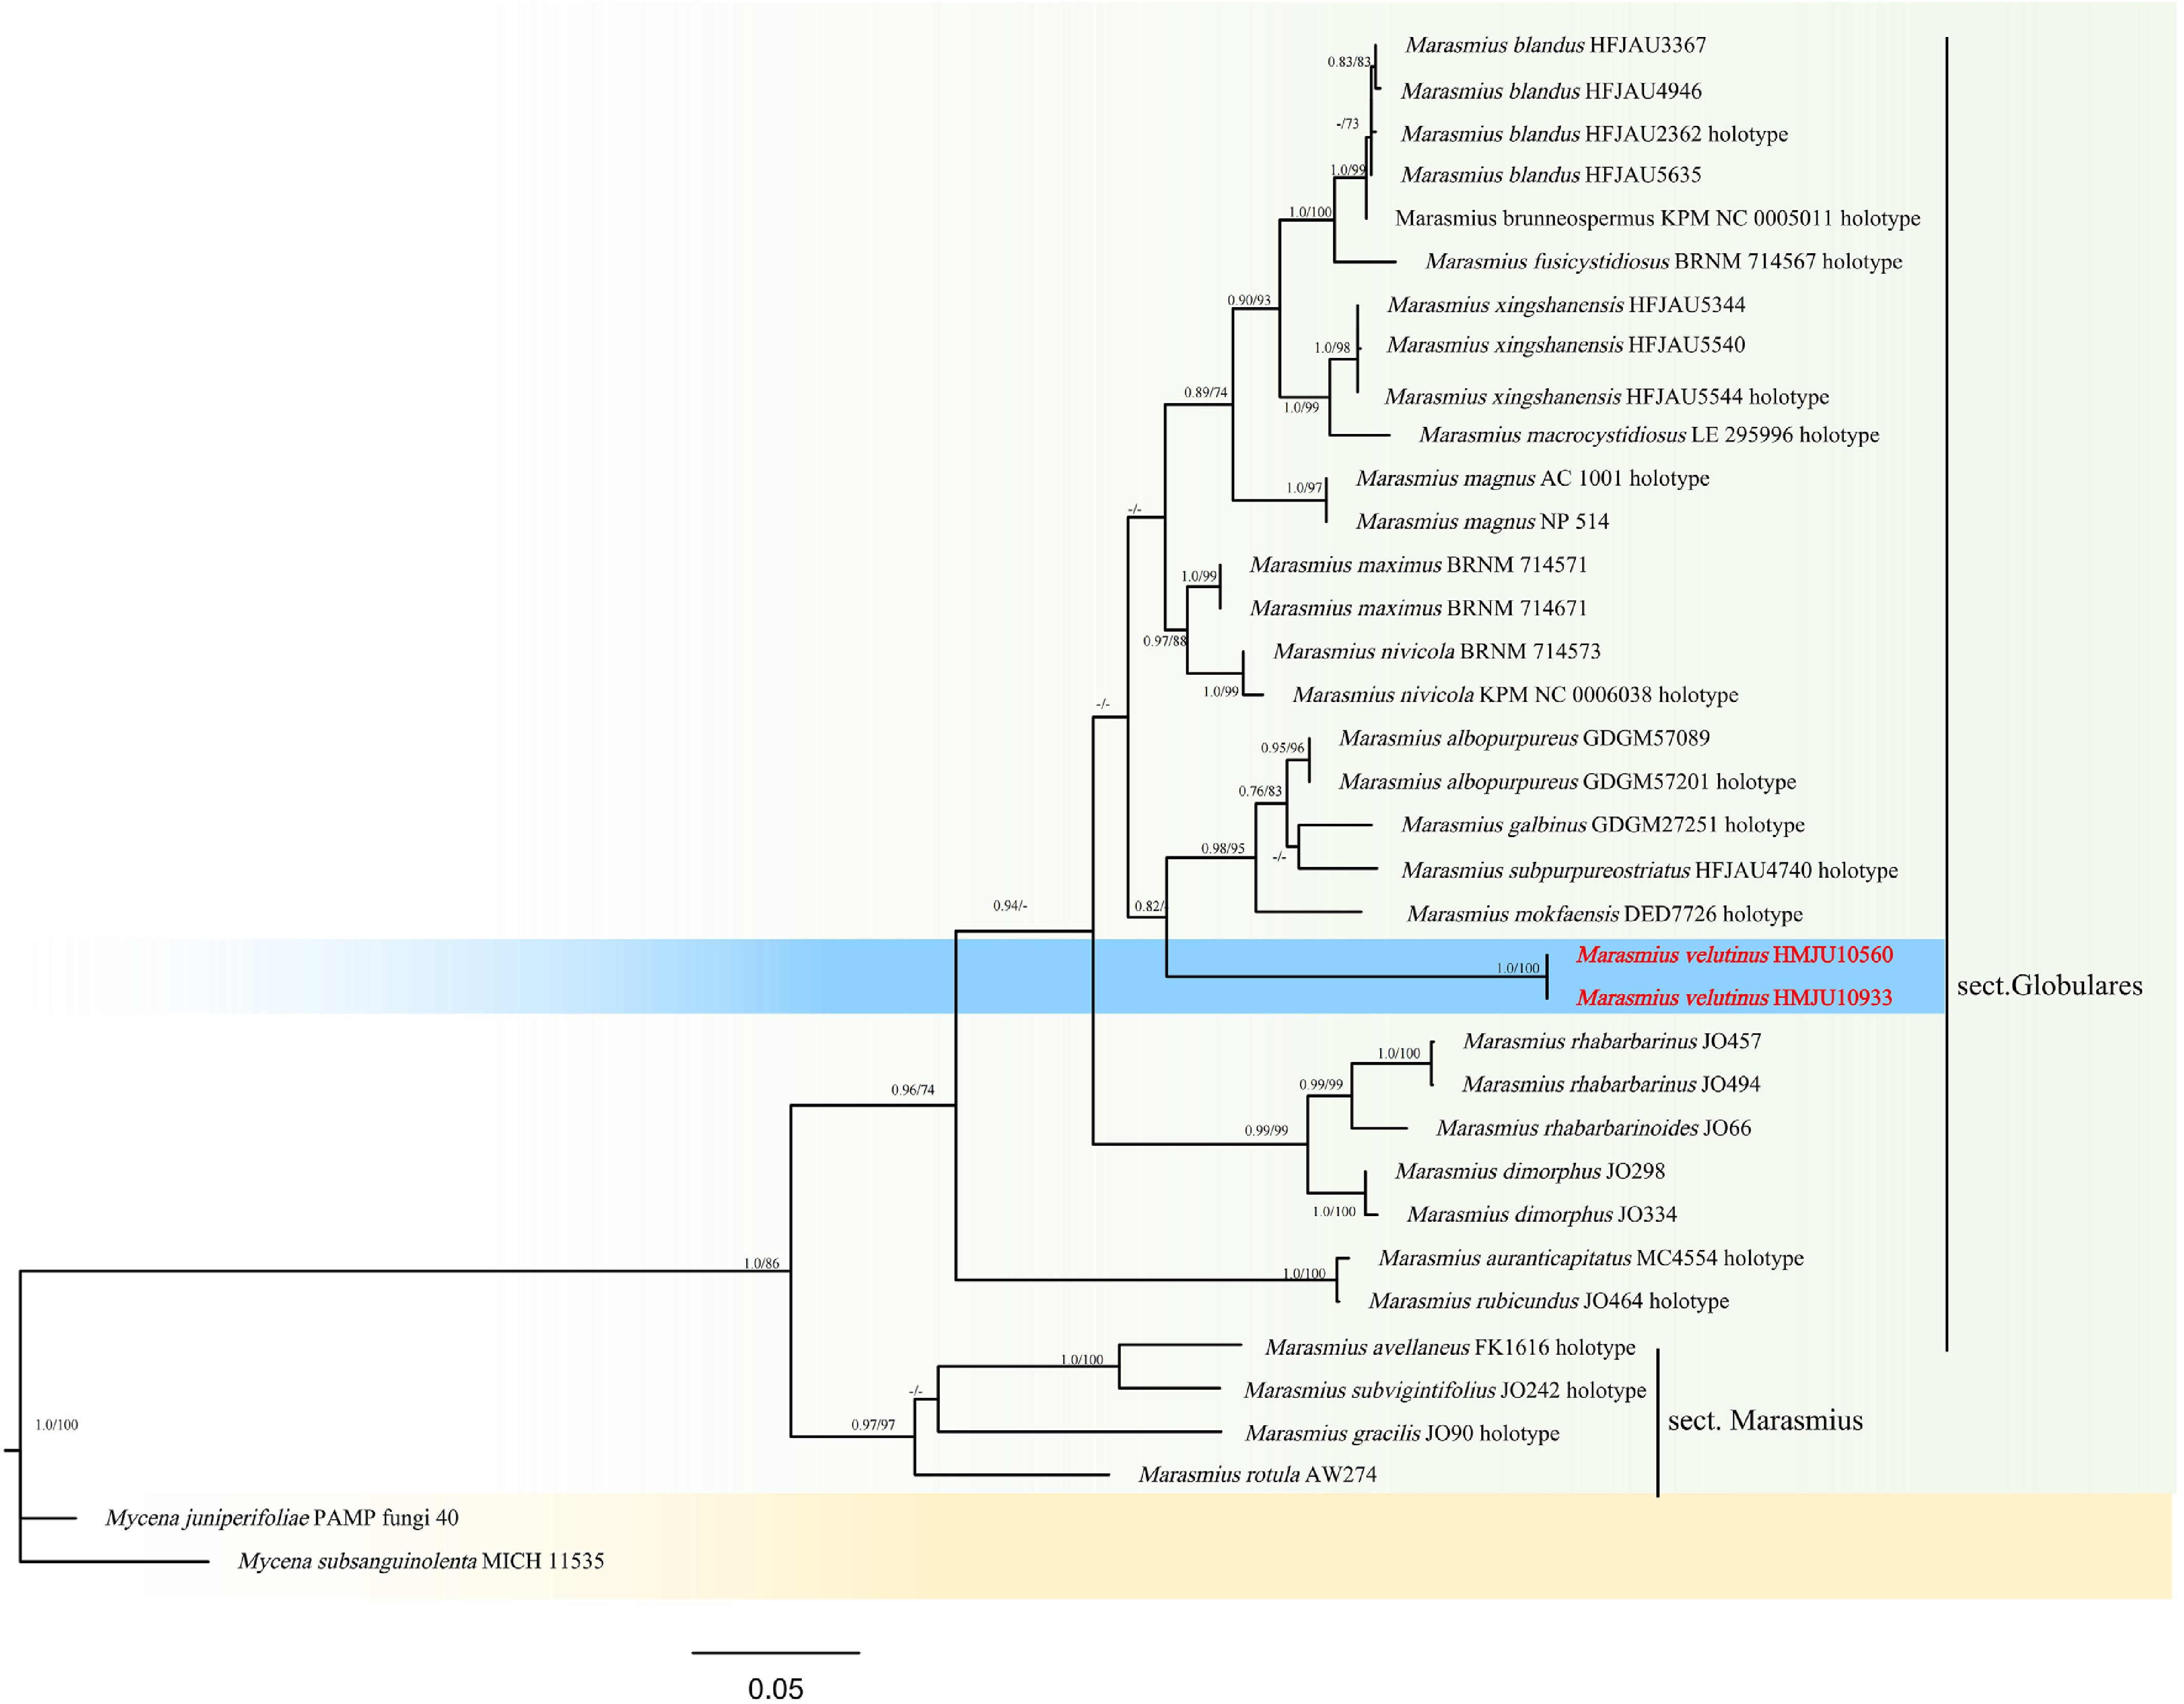
Figure 28.
Phylogram of Maximum Likelihood phylogenetic analysis based on combined ITS, nLSU, rpb2, and tef-1 sequences. The analysis includes 36 strains; total characters: 2,166 (ITS: 290, nLSU: 772, rpb2: 637, tef-1: 467). Mycena juniperifoliae (PAMP fungi 40) and Mycena subsanguinolenta (MICH 11535) were used as the outgroup taxa. The best model was TIM2 + F + I + G4. Estimated base frequencies were as follows: A = 0.258, C = 0.210, G = 0.273, T = 0.259. Bootstrap values for ML equal to or greater than 70% and BYPP values equal to or greater than 0.70 are labelled on the nodes. The type strains are in bold.
-
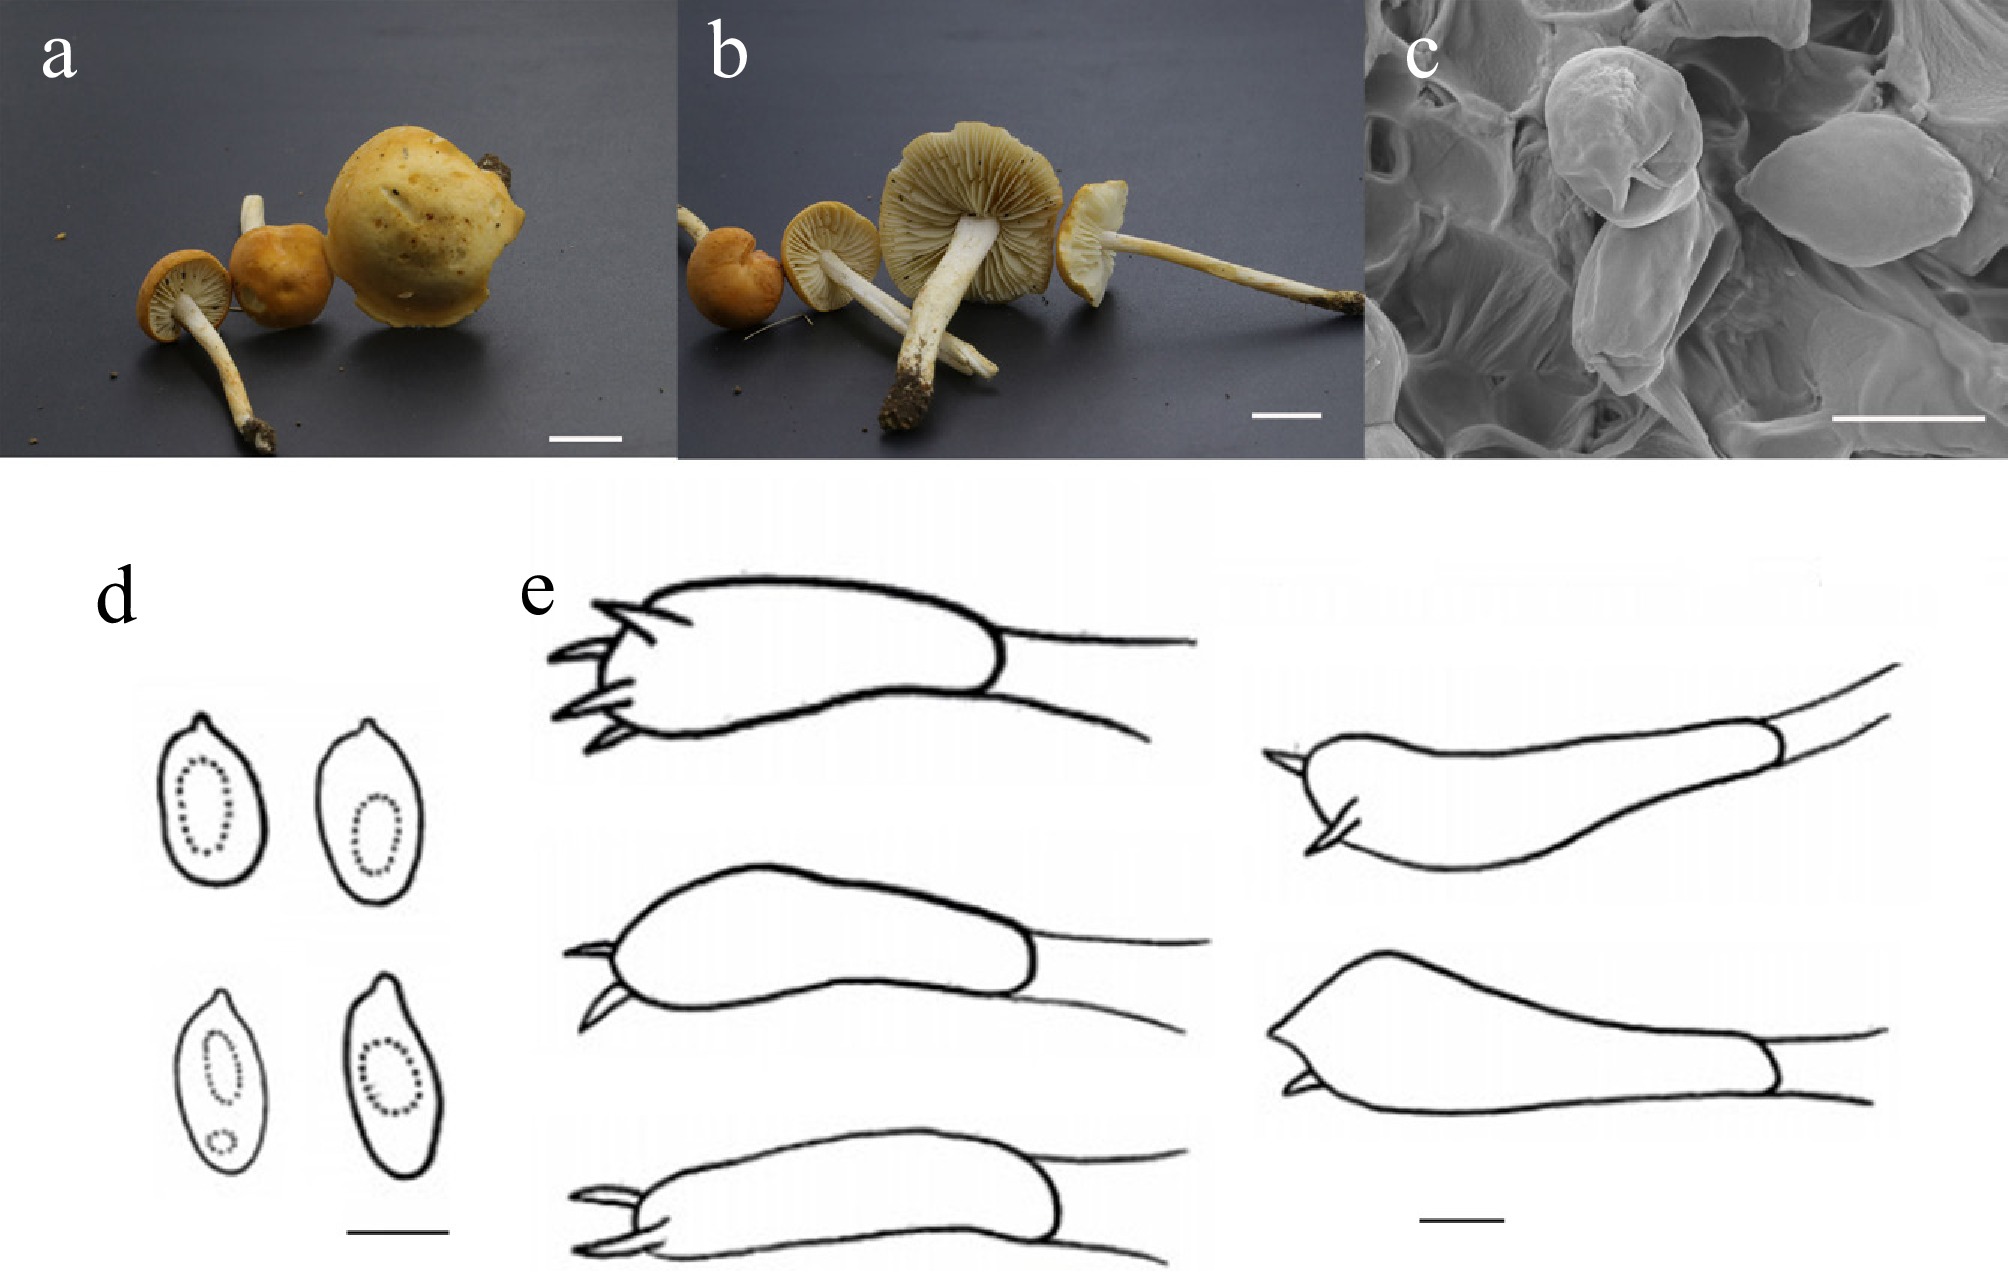
Figure 29.
Marasmius velutinus (HMJU 10560, holotype). (a), (b) Basidiocarps. (c) SEM images of basidiospores. (d) Basidiospores. (e) Basidia. Scale bars: (a), (b) 1 cm; (c)–(e) 5 µm.
-
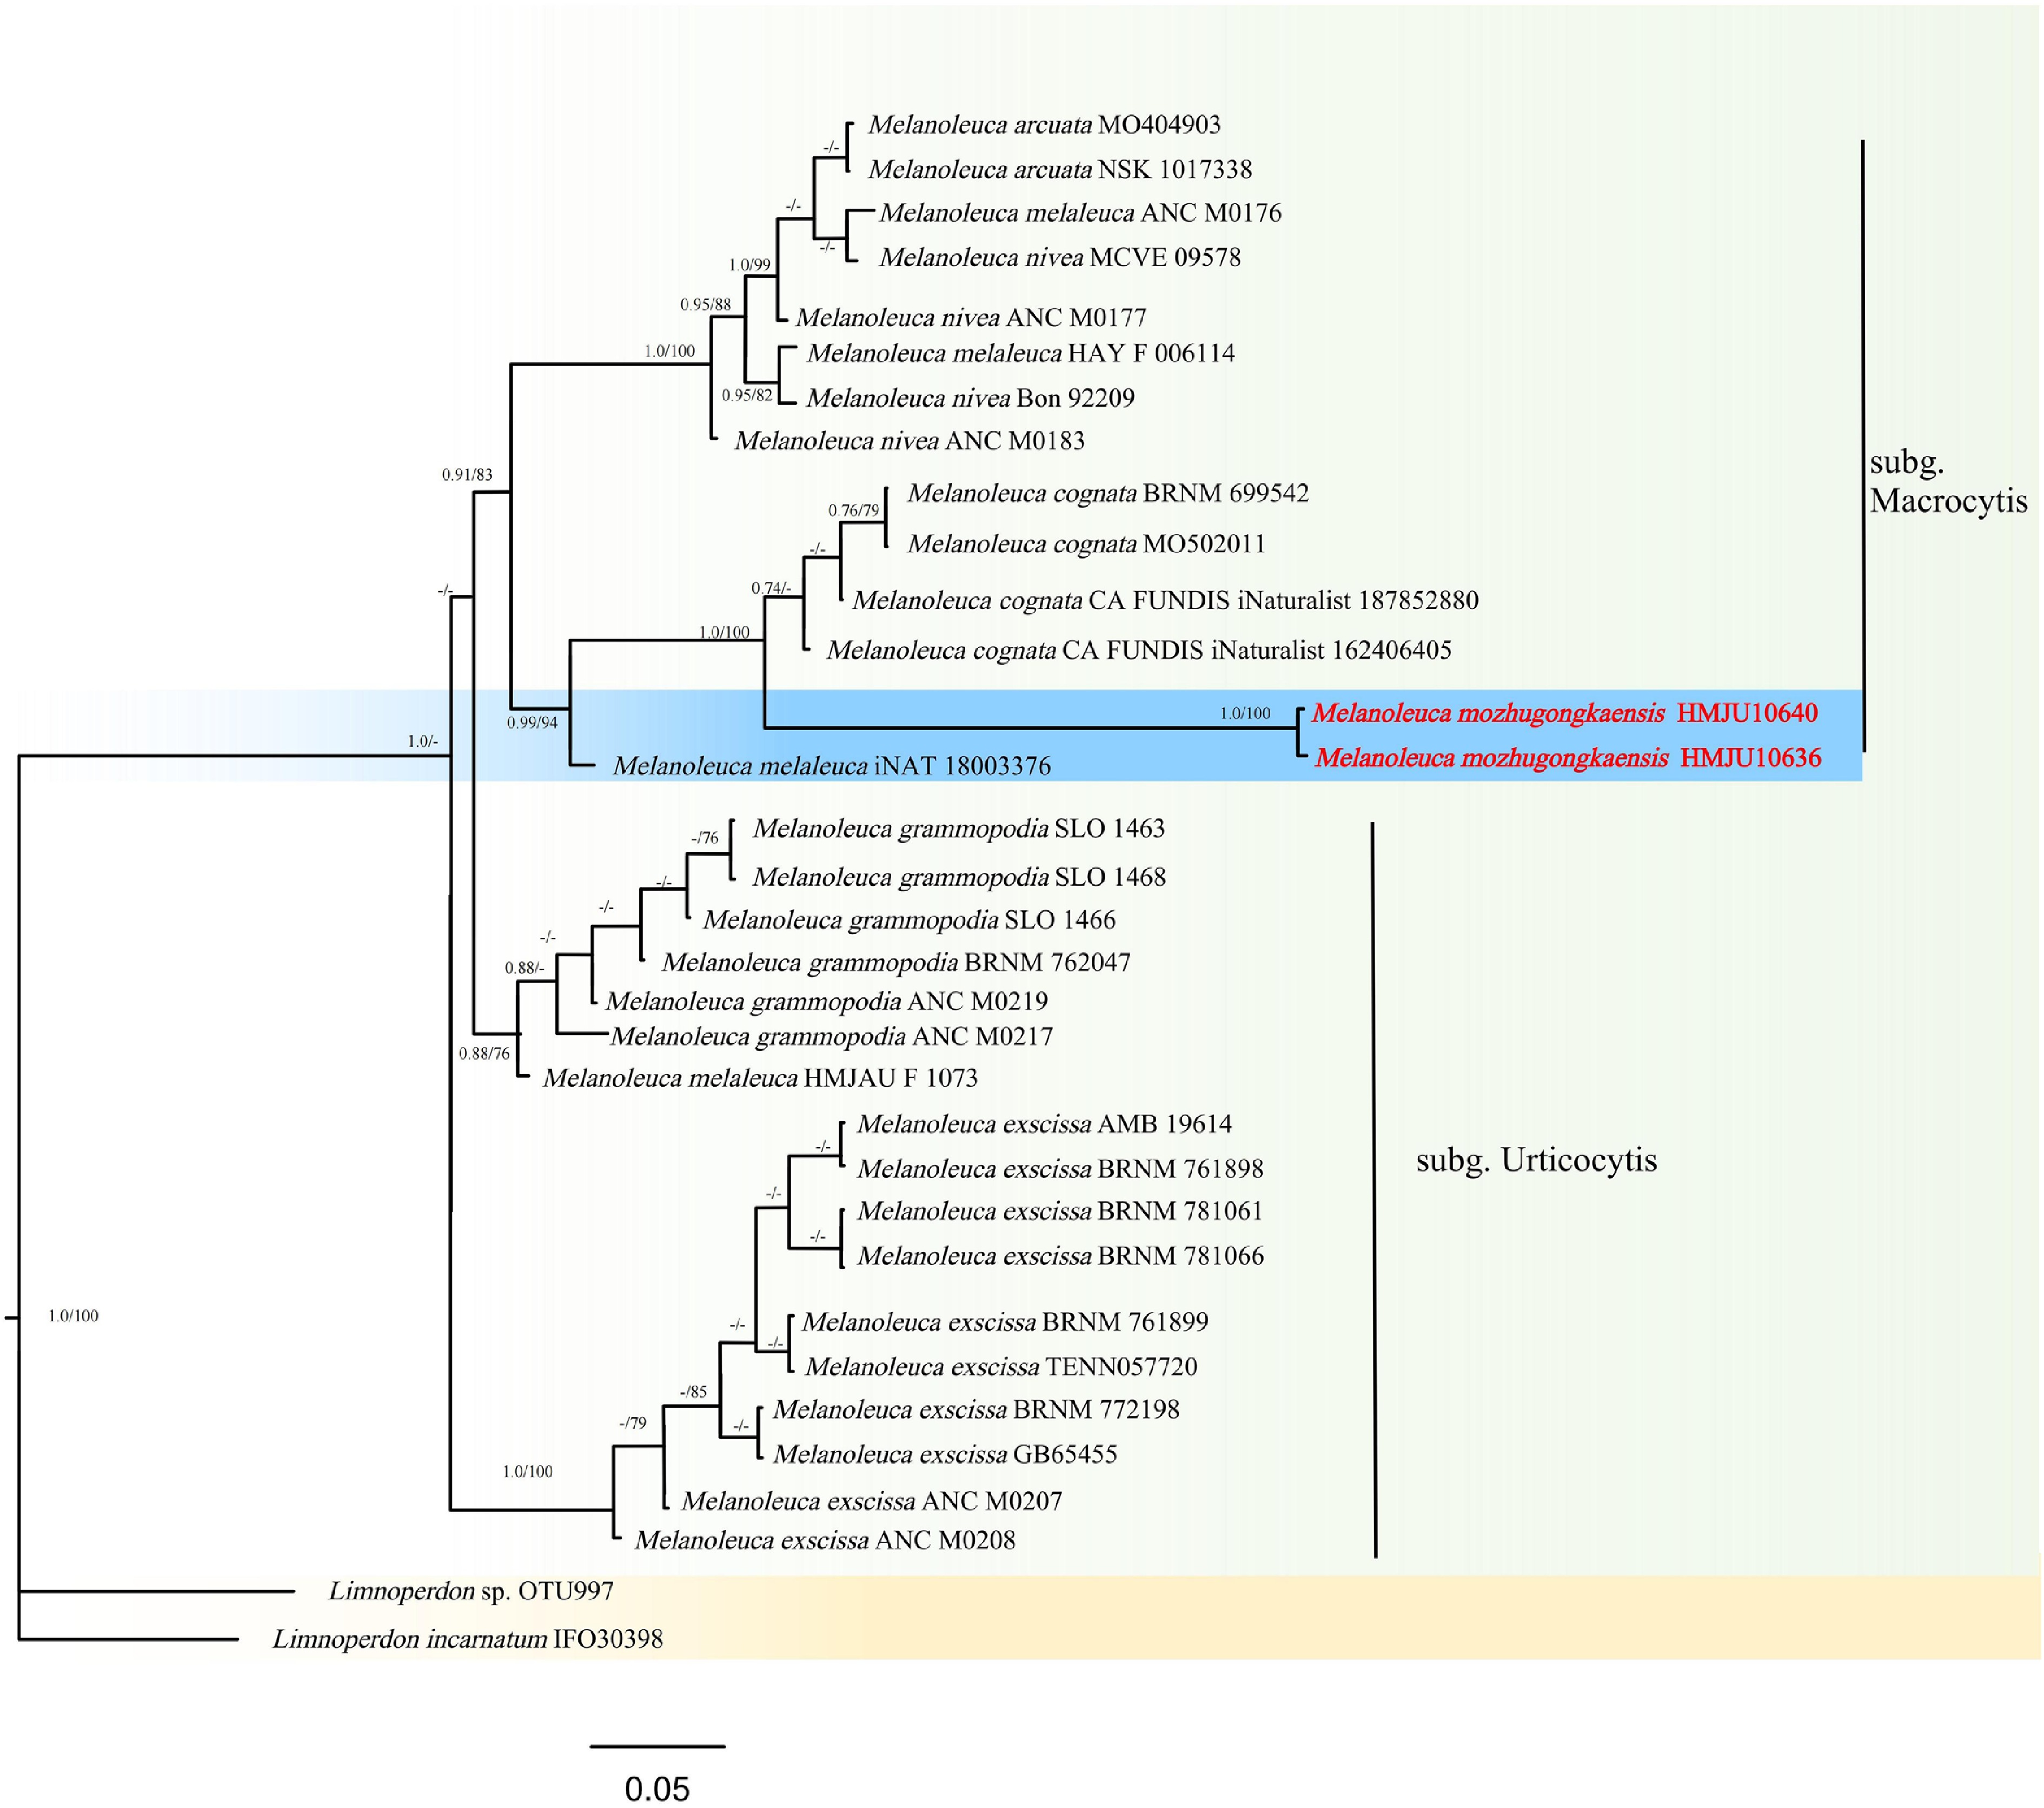
Figure 30.
Phylogram of Maximum Likelihood phylogenetic analysis based on combined ITS, nLSU, rpb2, and tef-1α sequences. The analysis includes 34 strains; total characters: 2,256 (ITS: 510, nLSU: 519, rpb2:720, tef-1α: 507). Limnoperdon sp. (OTU997) and Limnoperdon incarnatum (IFO30398) were used as the outgroup taxa. The best model was HKY + FO + G4. Estimated base frequencies were as follows: A = 0.257, C = 0.225, G = 0.232, T = 0.286. Bootstrap values for ML equal to or greater than 70% and BYPP values equal to or greater than 0.70 are labelled on the nodes. The type strains are in bold.
-
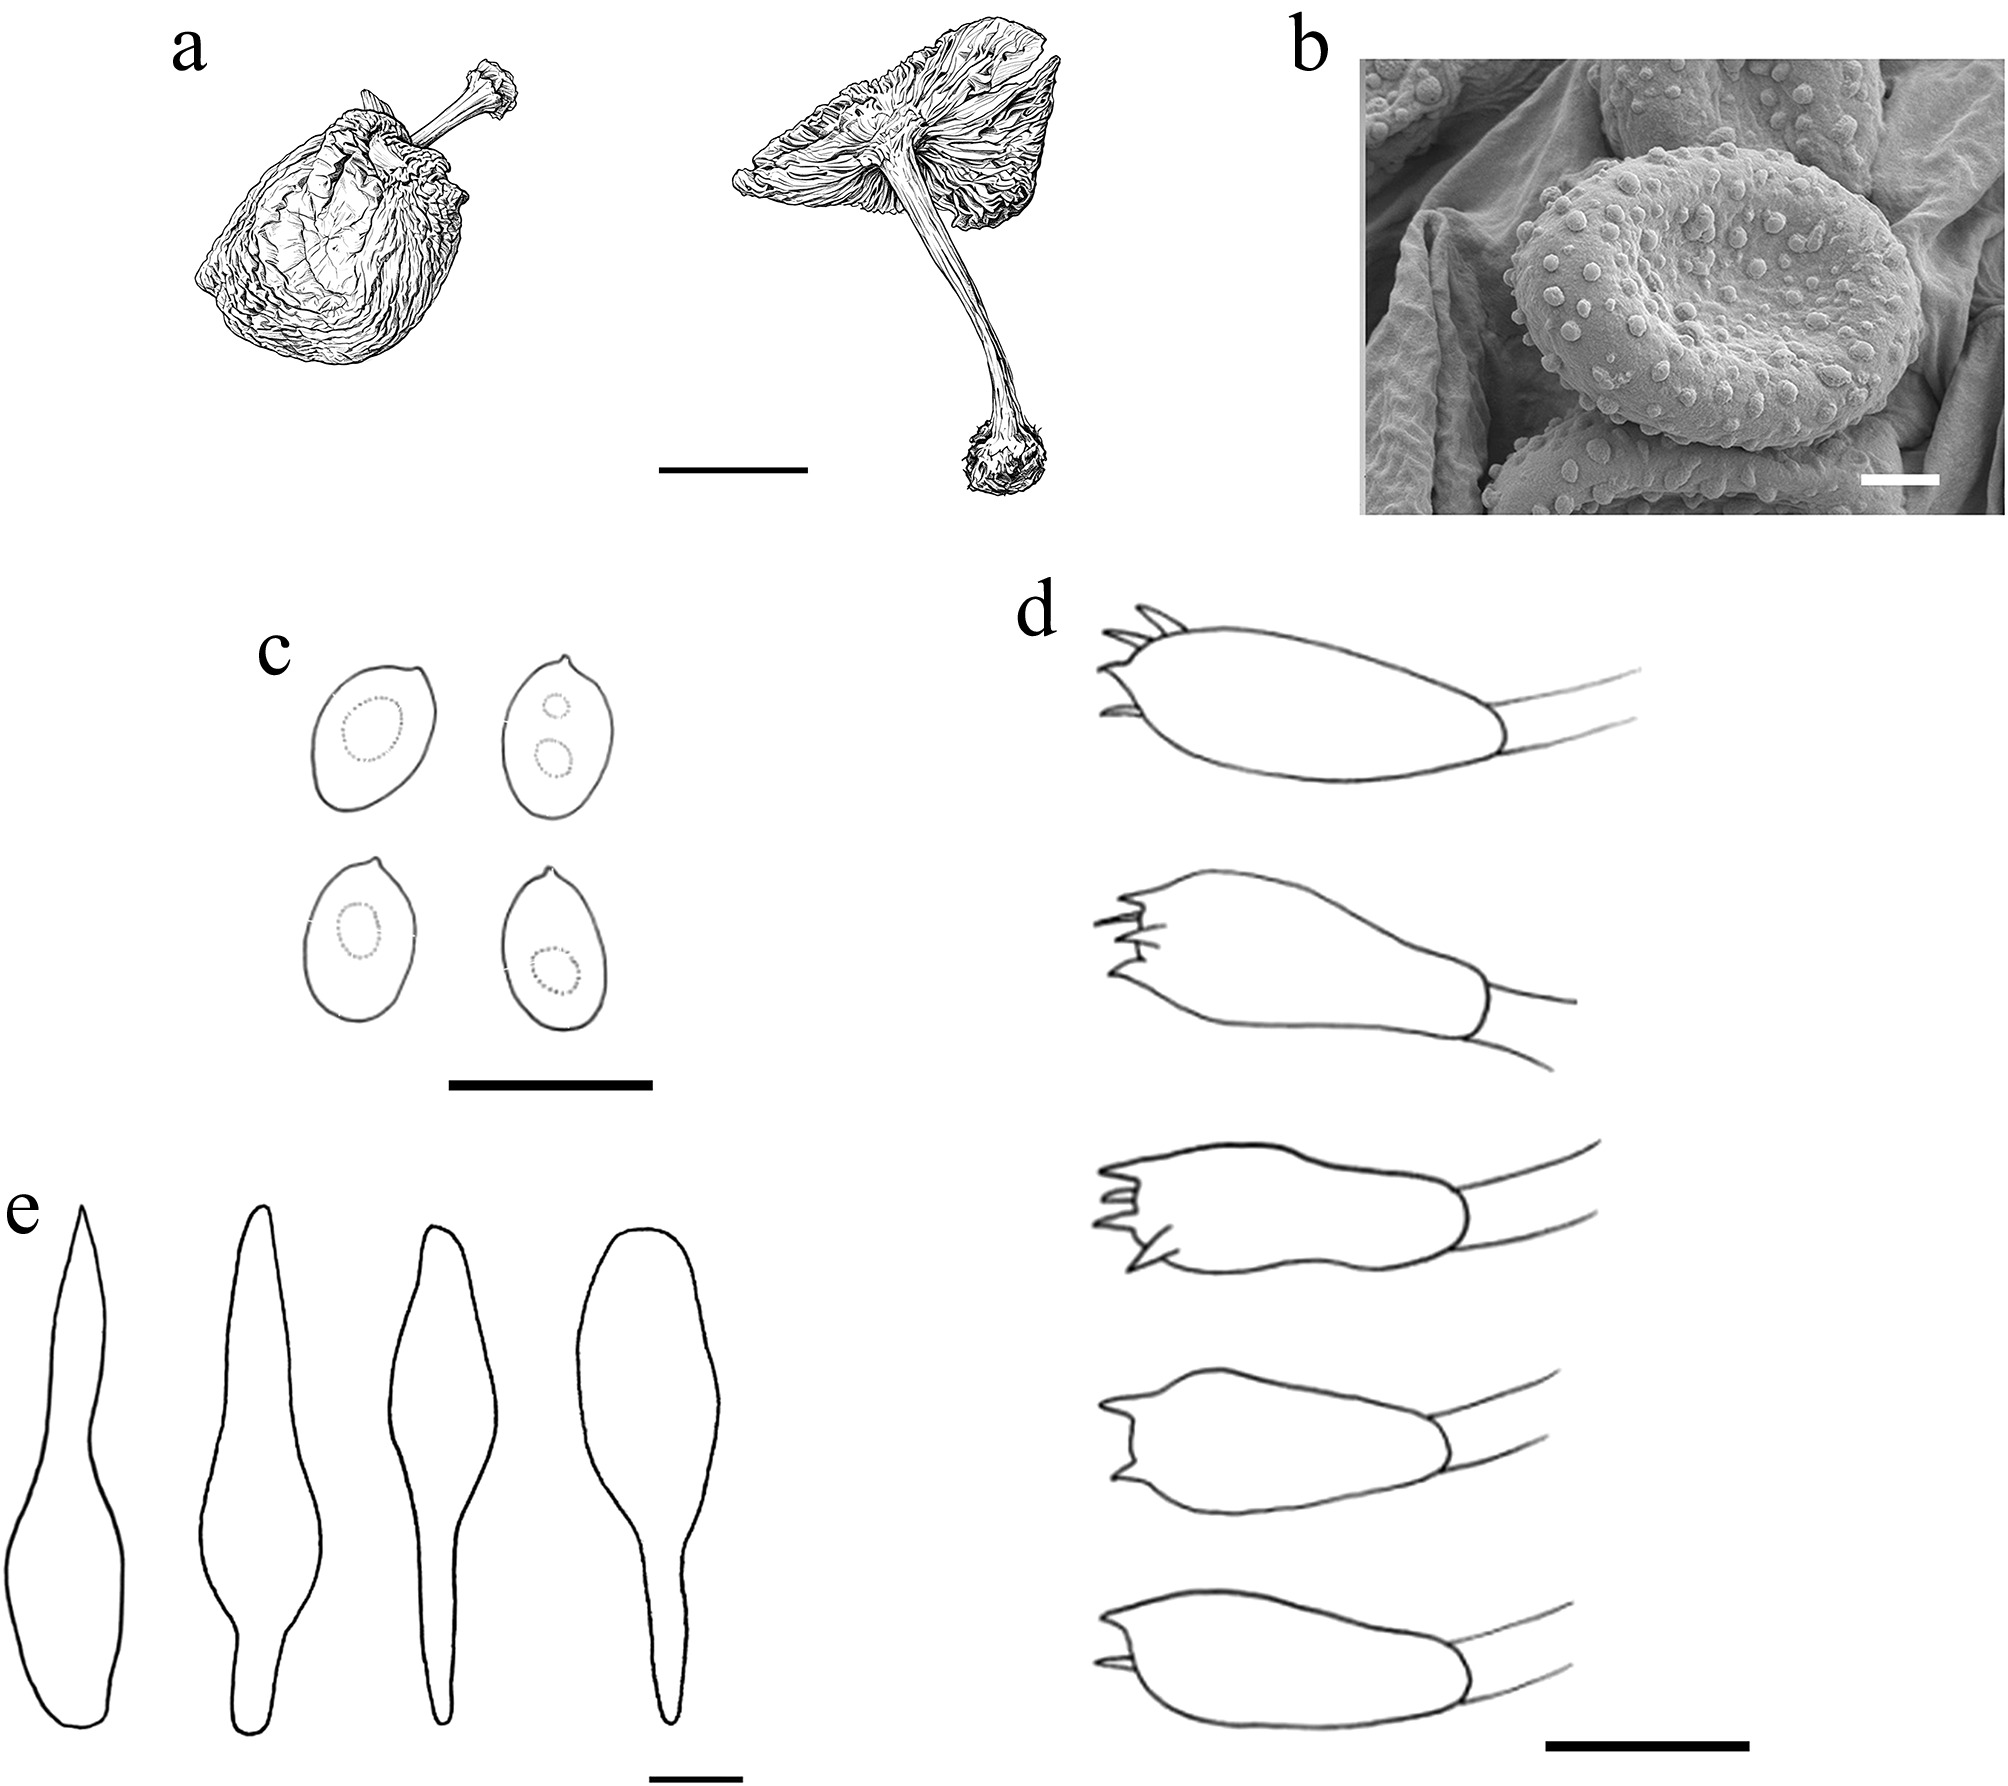
Figure 31.
Melanoleuca mozhugongkaensis (HMJU 10640, holotype). (a) Basidiocarps. (b) SEM images of basidiospores. (c) Basidiospores. (d) Basidia. (e) Pleurocystidia. Scale bars: (a) 5 cm; (b) 3µm; (c)–(e) 10 µm.
-
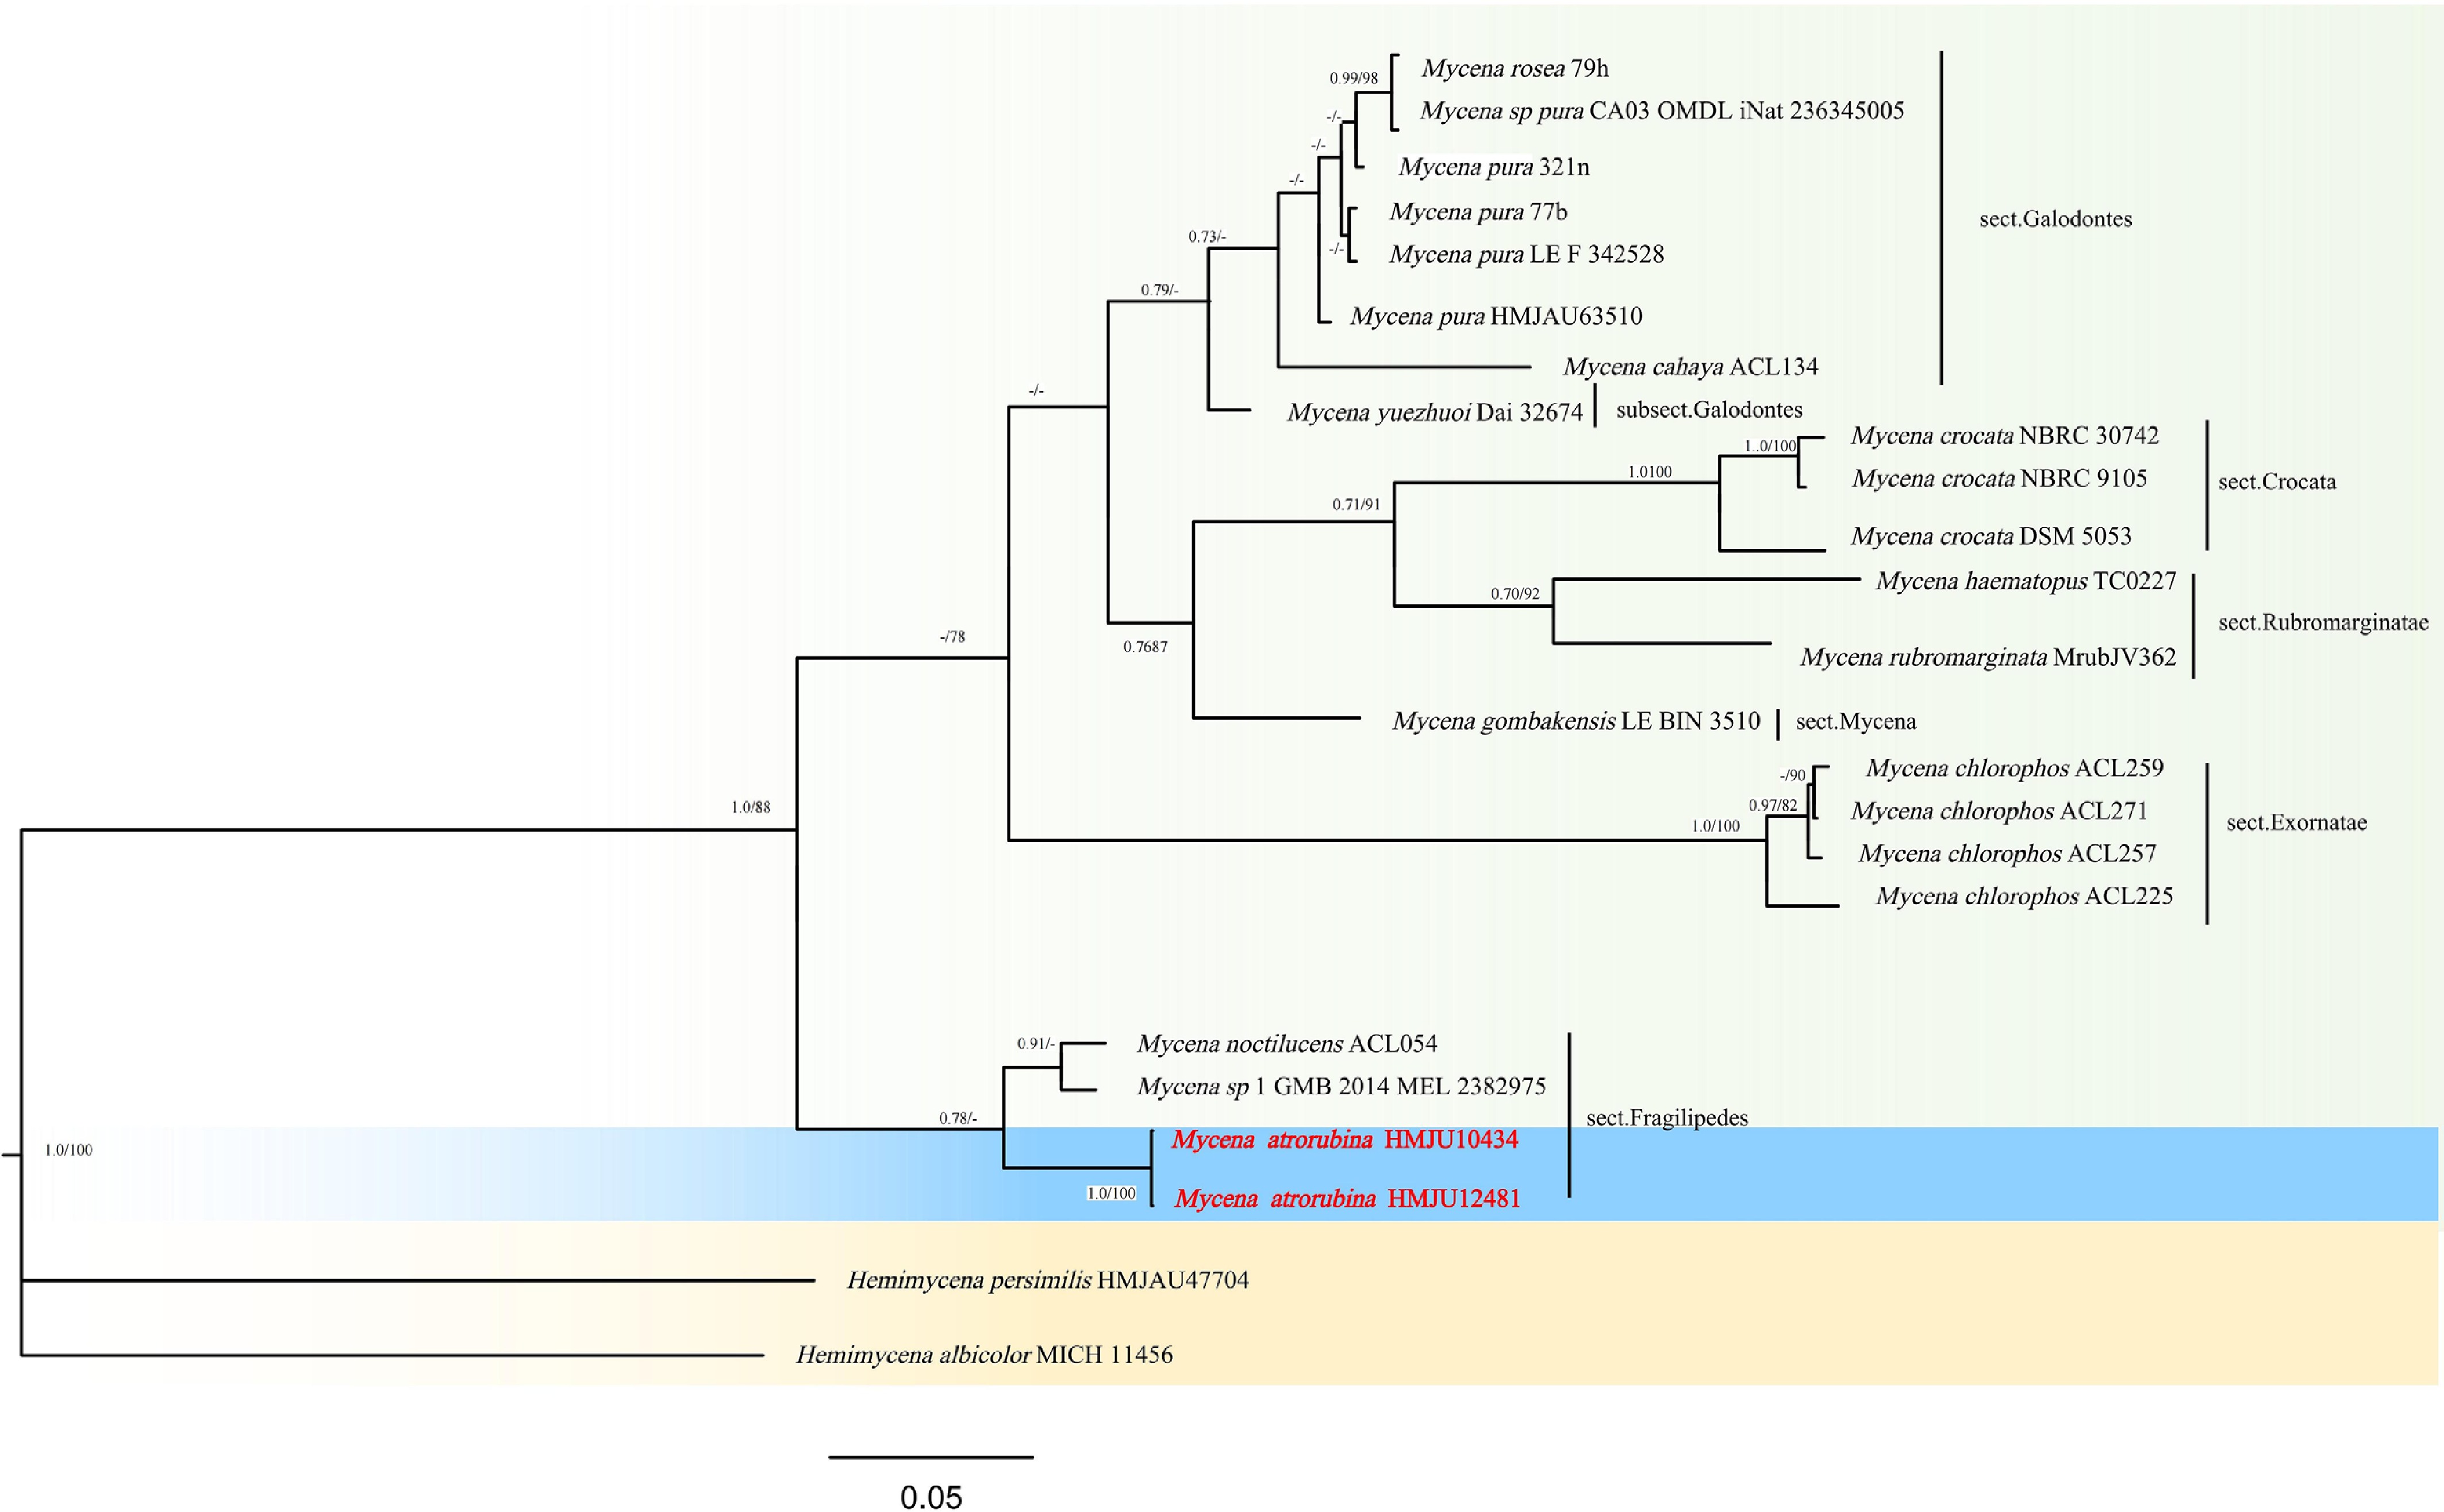
Figure 32.
Phylogram of Maximum Likelihood phylogenetic analysis based on combined ITS, nLSU, rpb2, and tef-1 sequences. The analysis includes 24 strains; total characters: 2,457 (ITS: 441, nLSU: 969, rpb2: 642, tef-1: 405). Hemimycena persimilis (HMJAU47704) and Hemimycena albicolor (MICH 11456) were used as the outgroup taxa. The best model was TIM2e + G4. Estimated base frequencies were as follows: A = 0.250, C = 0.250, G = 0.250, T = 0.250. Bootstrap values for ML equal to or greater than 70% and BYPP values equal to or greater than 0.70 are labelled on the nodes. The type strains are in bold.
-
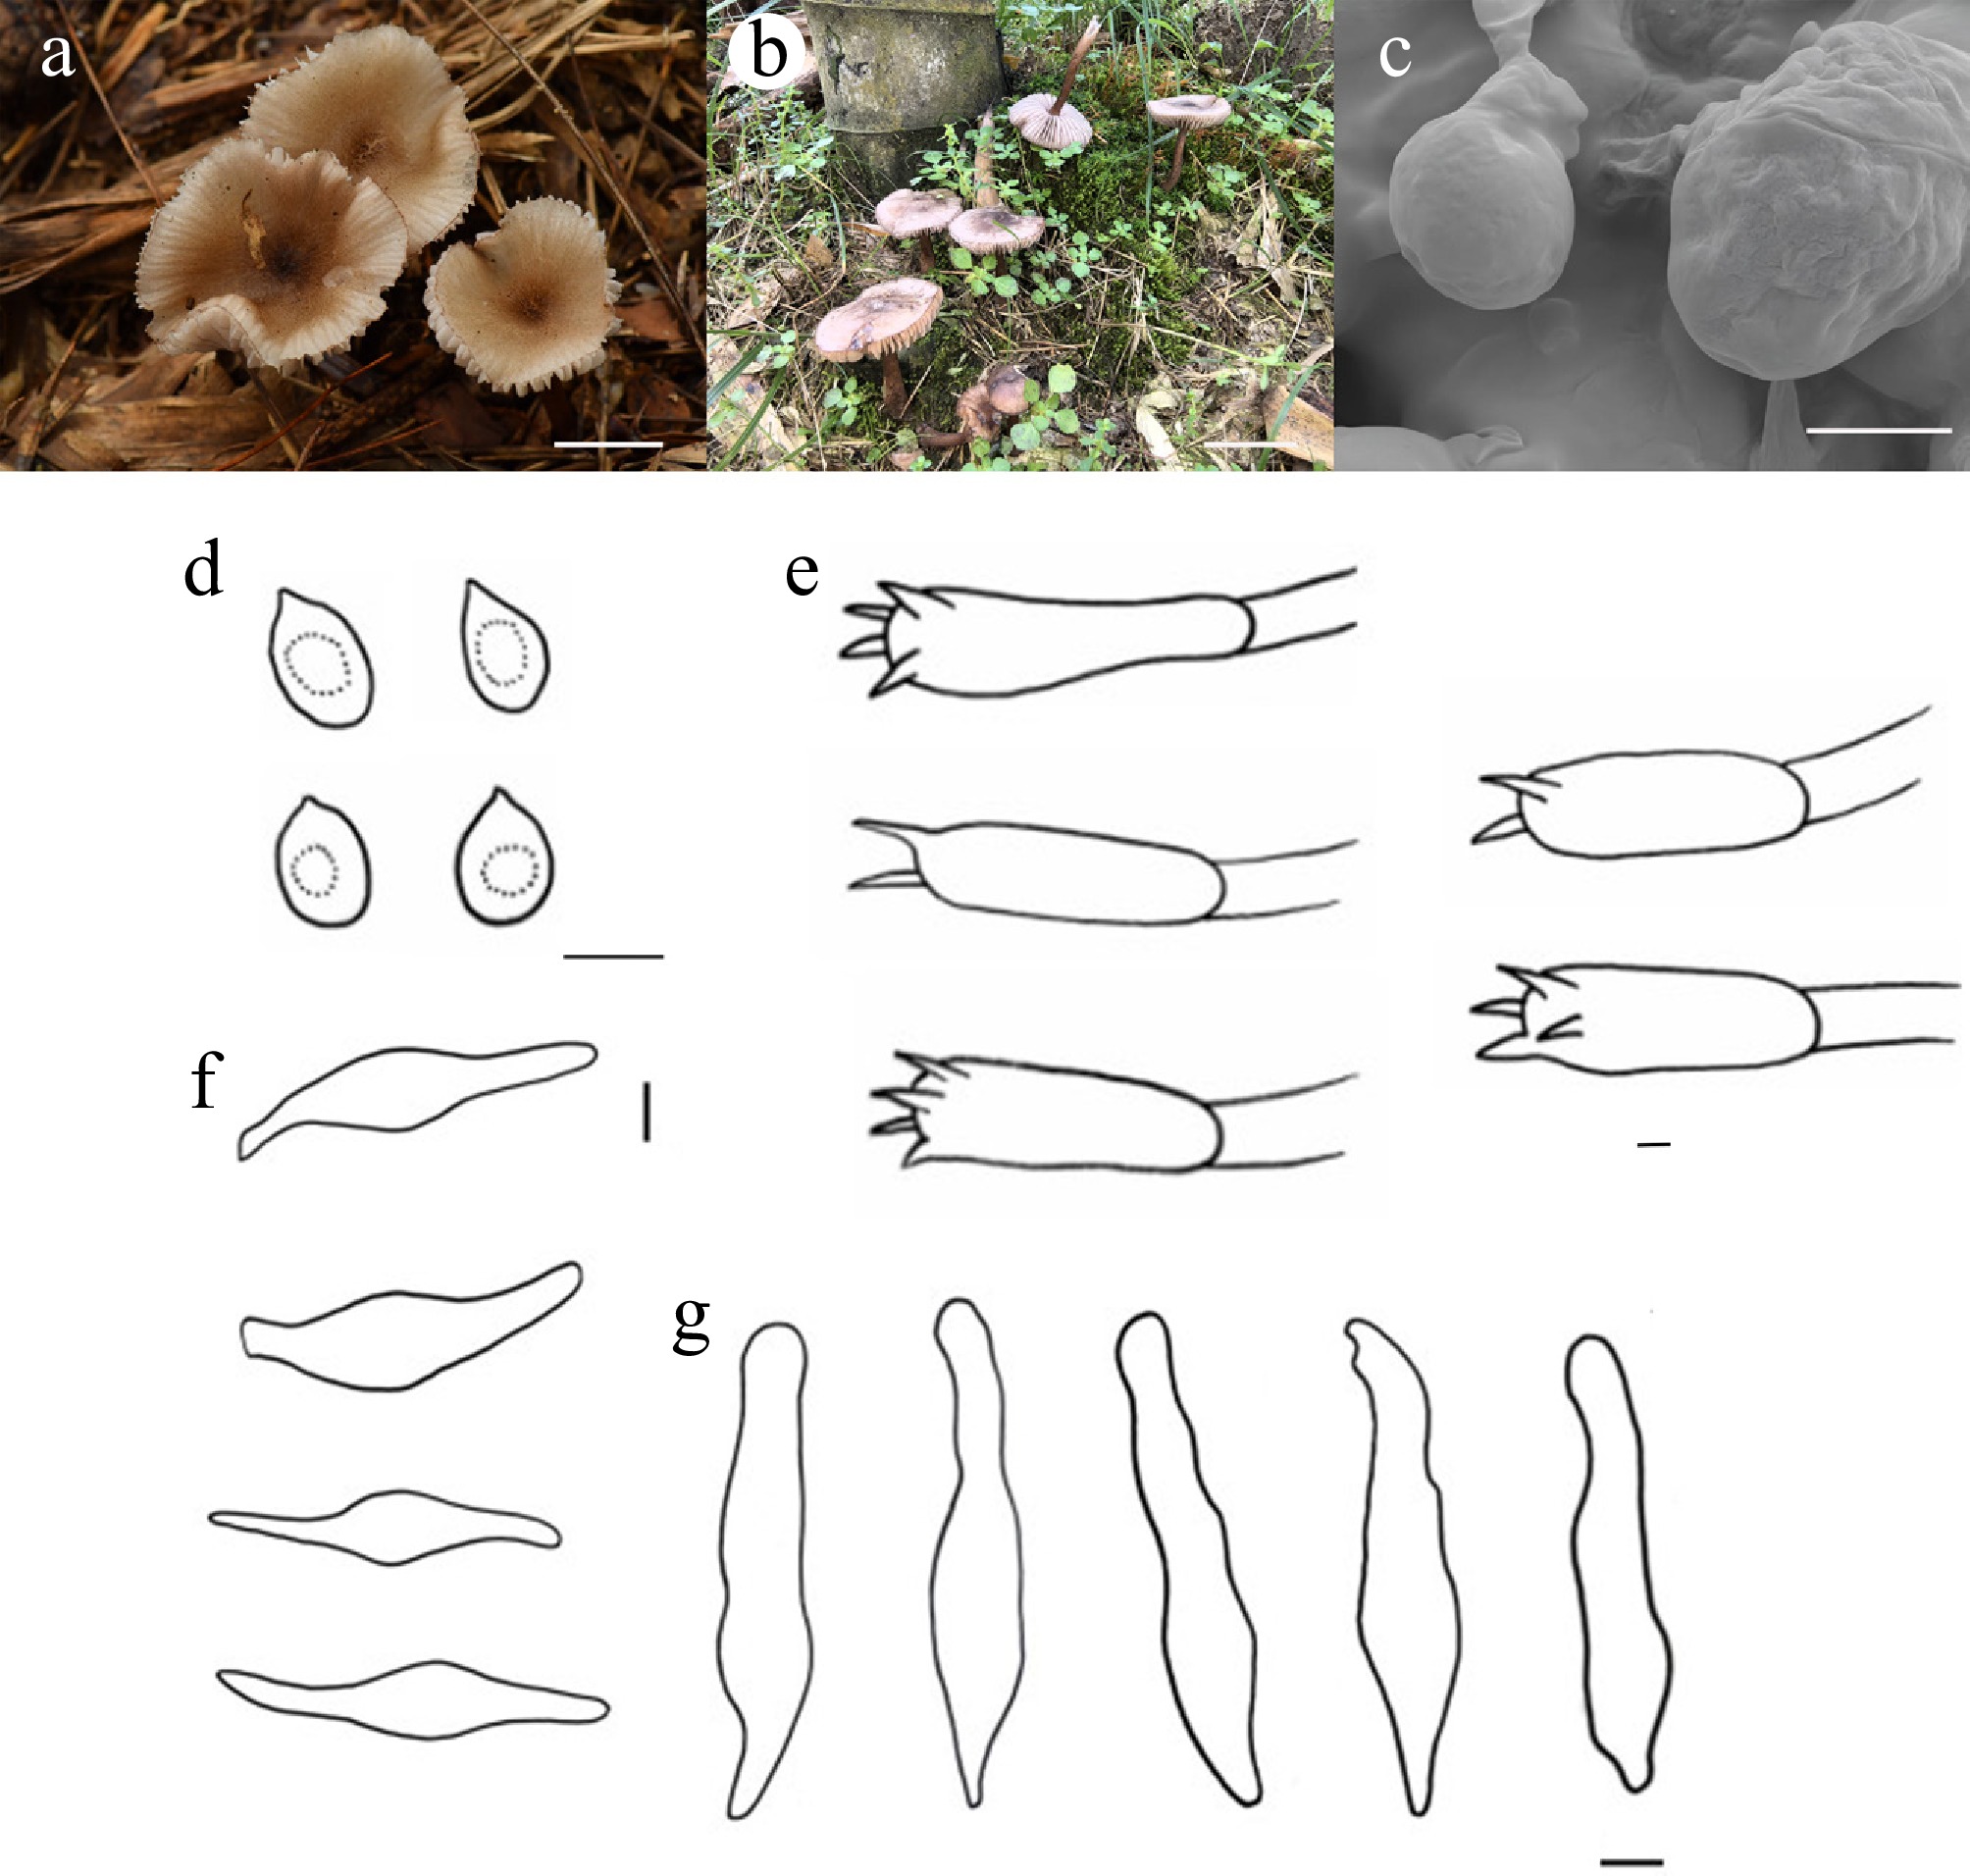
Figure 33.
Mycena atrorubina (HMJU 10434, holotype). (a), (b) Basidiocarps. (c) SEM images of basidiospores. (d) Basidiospores. (e) Basidia. (f) Pleurocystidia. (g) Cheilocystidia. Scale bars: (a) 3 cm; (b) 5 cm; (c)–(e), (g) 5 µm; and (f) 10 µm.
-
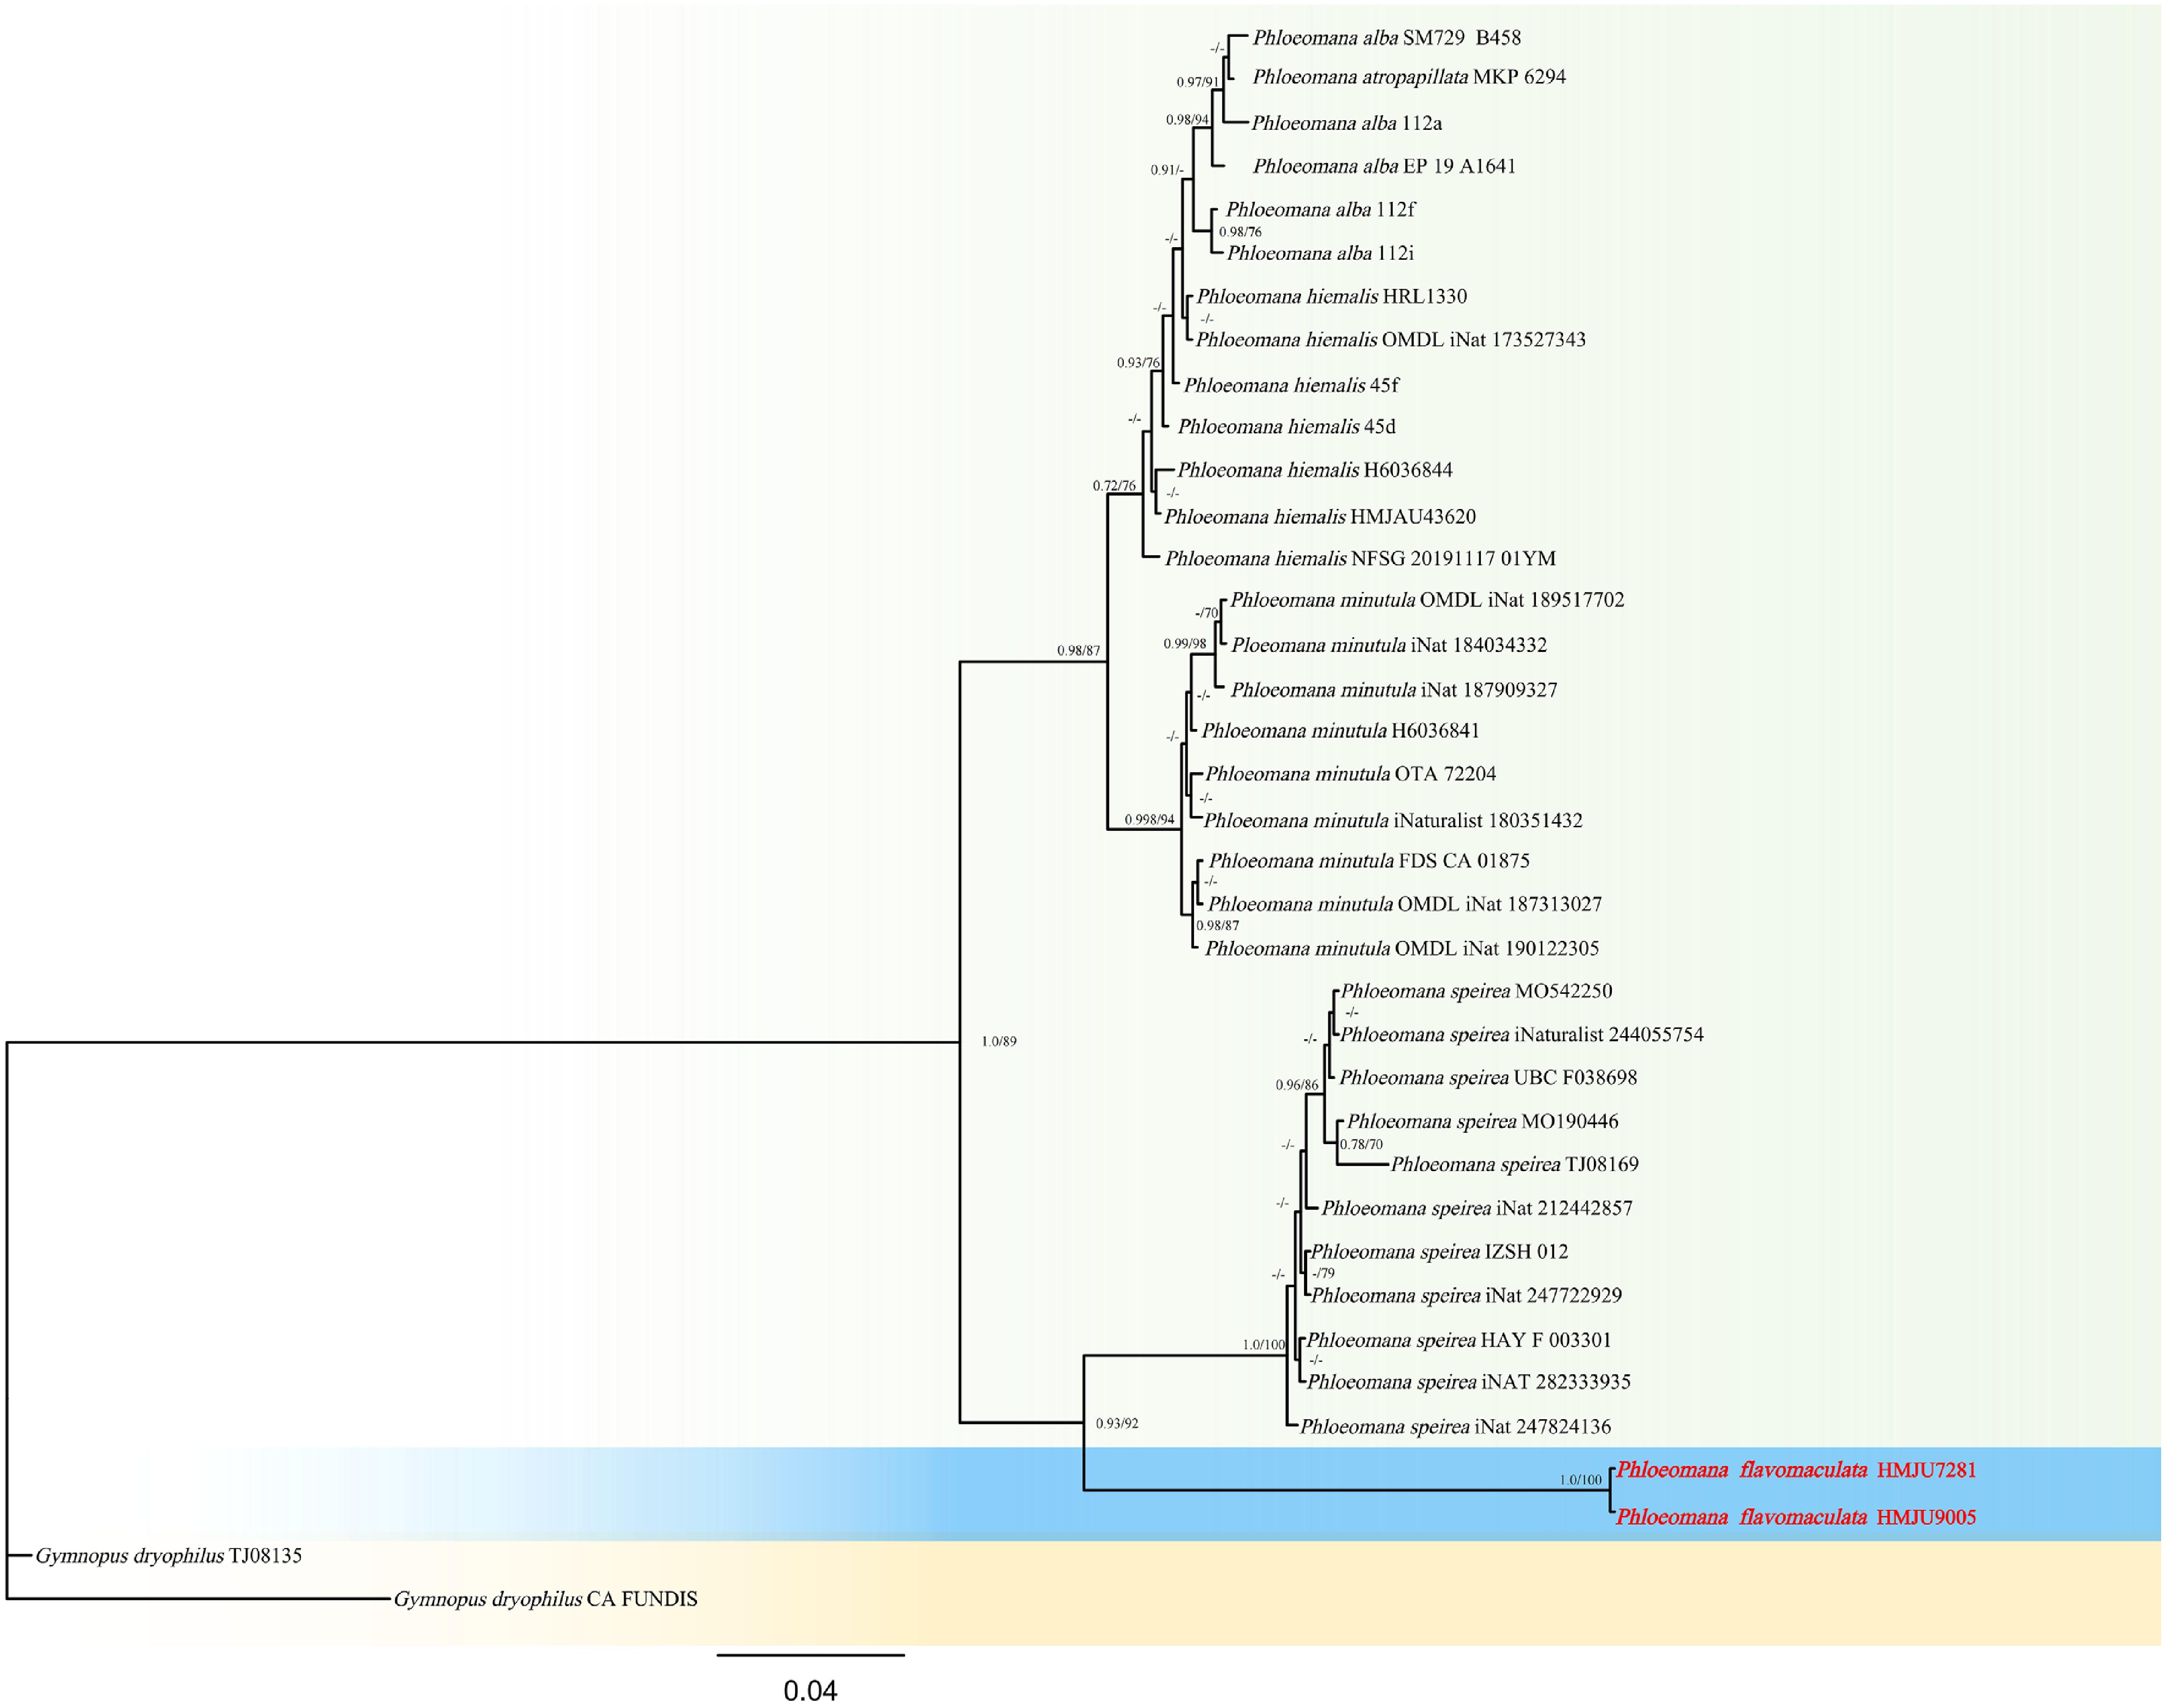
Figure 34.
Phylogram of Maximum Likelihood phylogenetic analysis based on combined ITS, nLSU. The analysis includes 37 strains; total characters: 1,748 (ITS: 920, nLSU: 828). Gymnopus dryophilus (TJ08135) and Gymnopus dryophilus (CA FUNDIS) were used as the outgroup taxa. The best model was TPM2u + F + G4. Estimated base frequencies were as follows: A = 0.258, C = 0.209, G = 0.206, T = 0.327. Bootstrap values for ML equal to or greater than 70% and BYPP values equal to or greater than 0.70 are labelled on the nodes. The type strains are in bold.
-
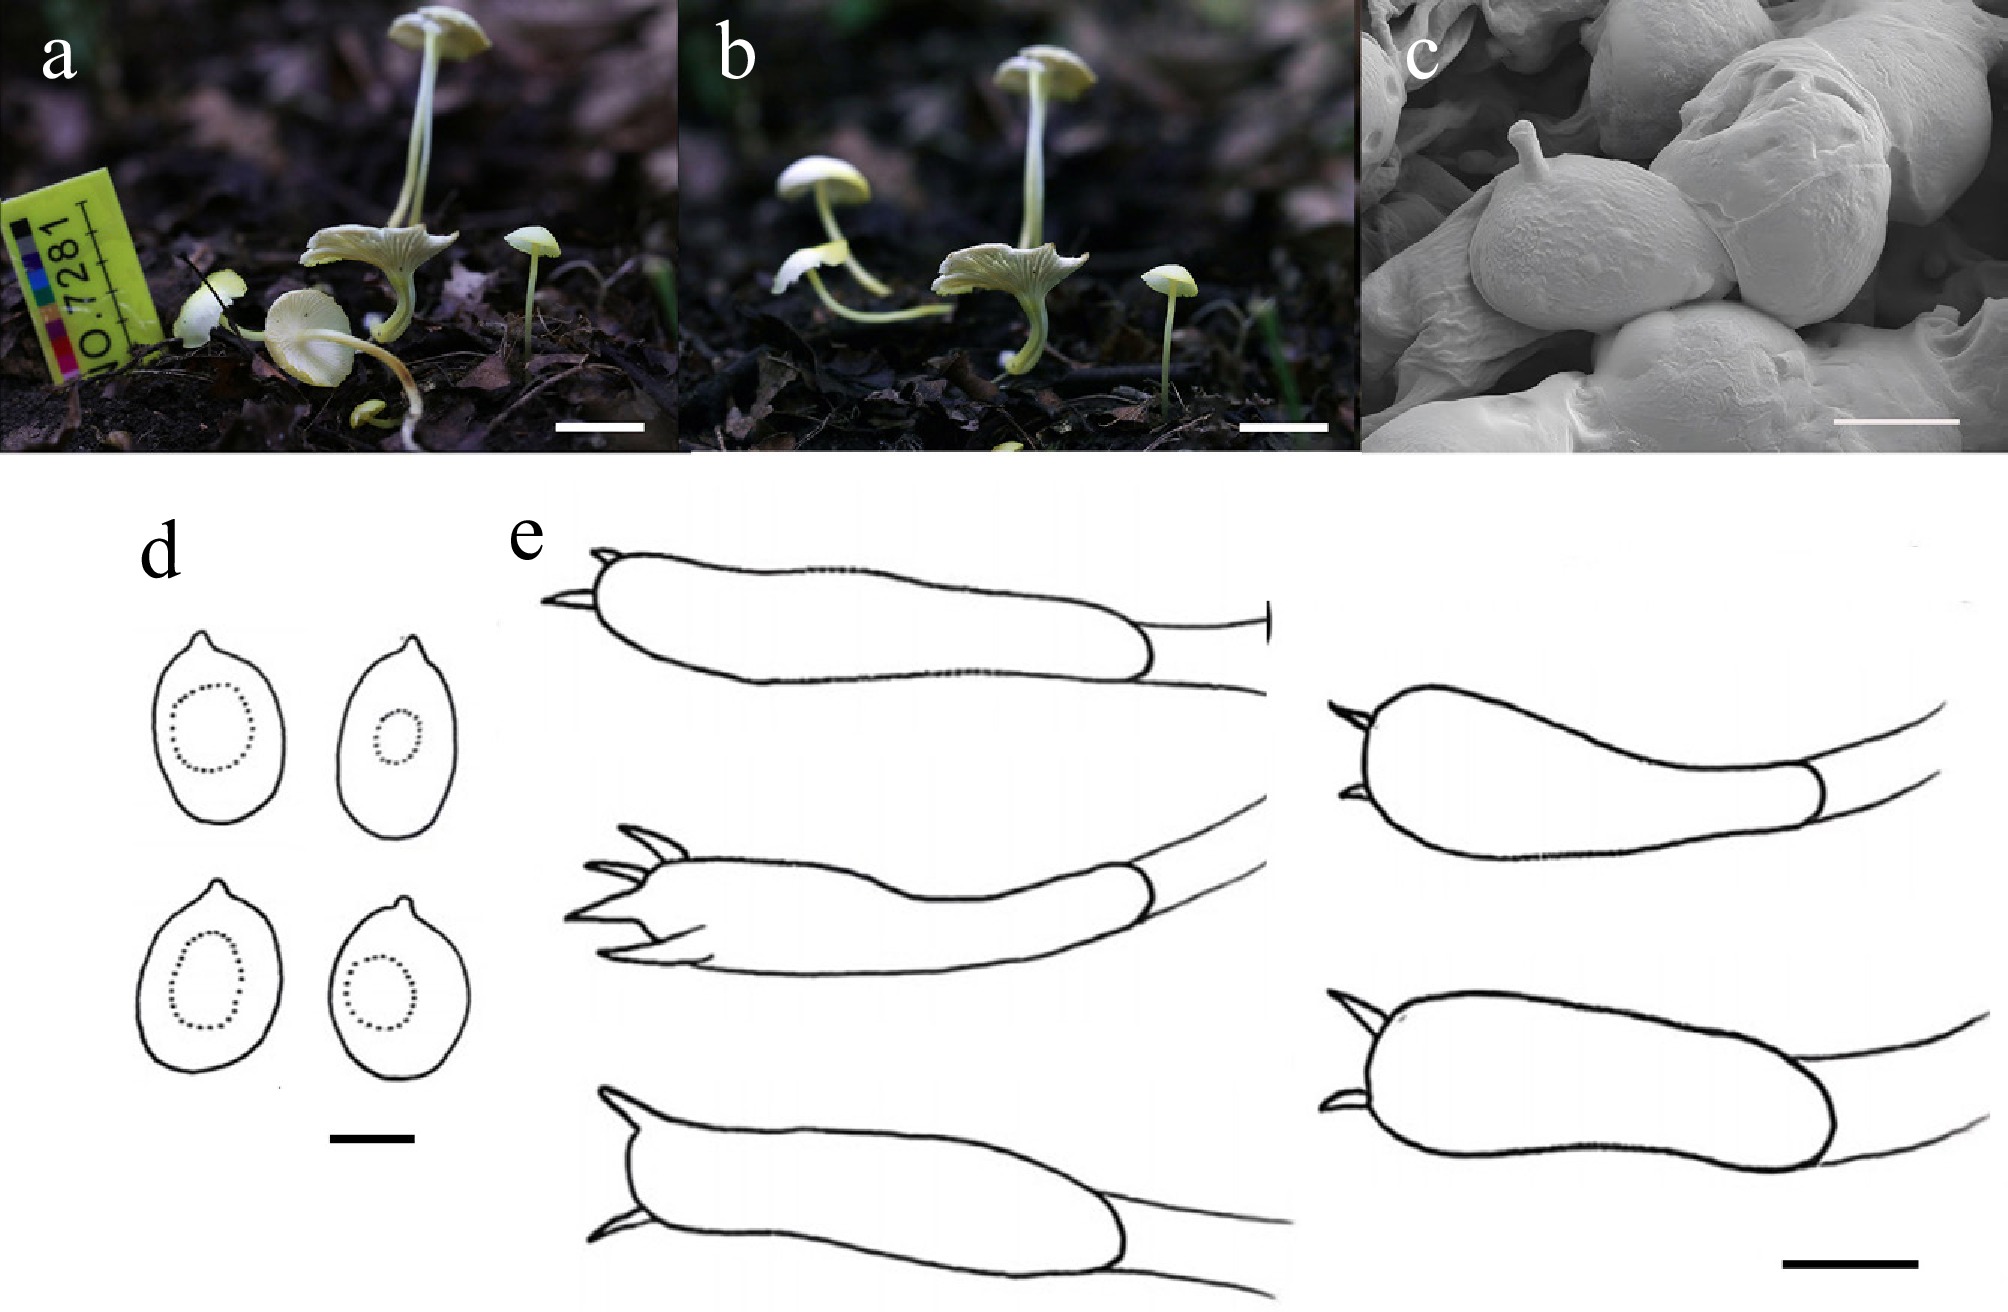
Figure 35.
Phloeomana flavomaculata (HMJU 7281, holotype). (a), (b) Basidiocarps. (c) SEM images of basidiospores. (d) Basidiospores. (e) Basidia. Scale bars: (a), (b) 1 cm; (c) 3 µm; and (d), (e) 5 µm.
-
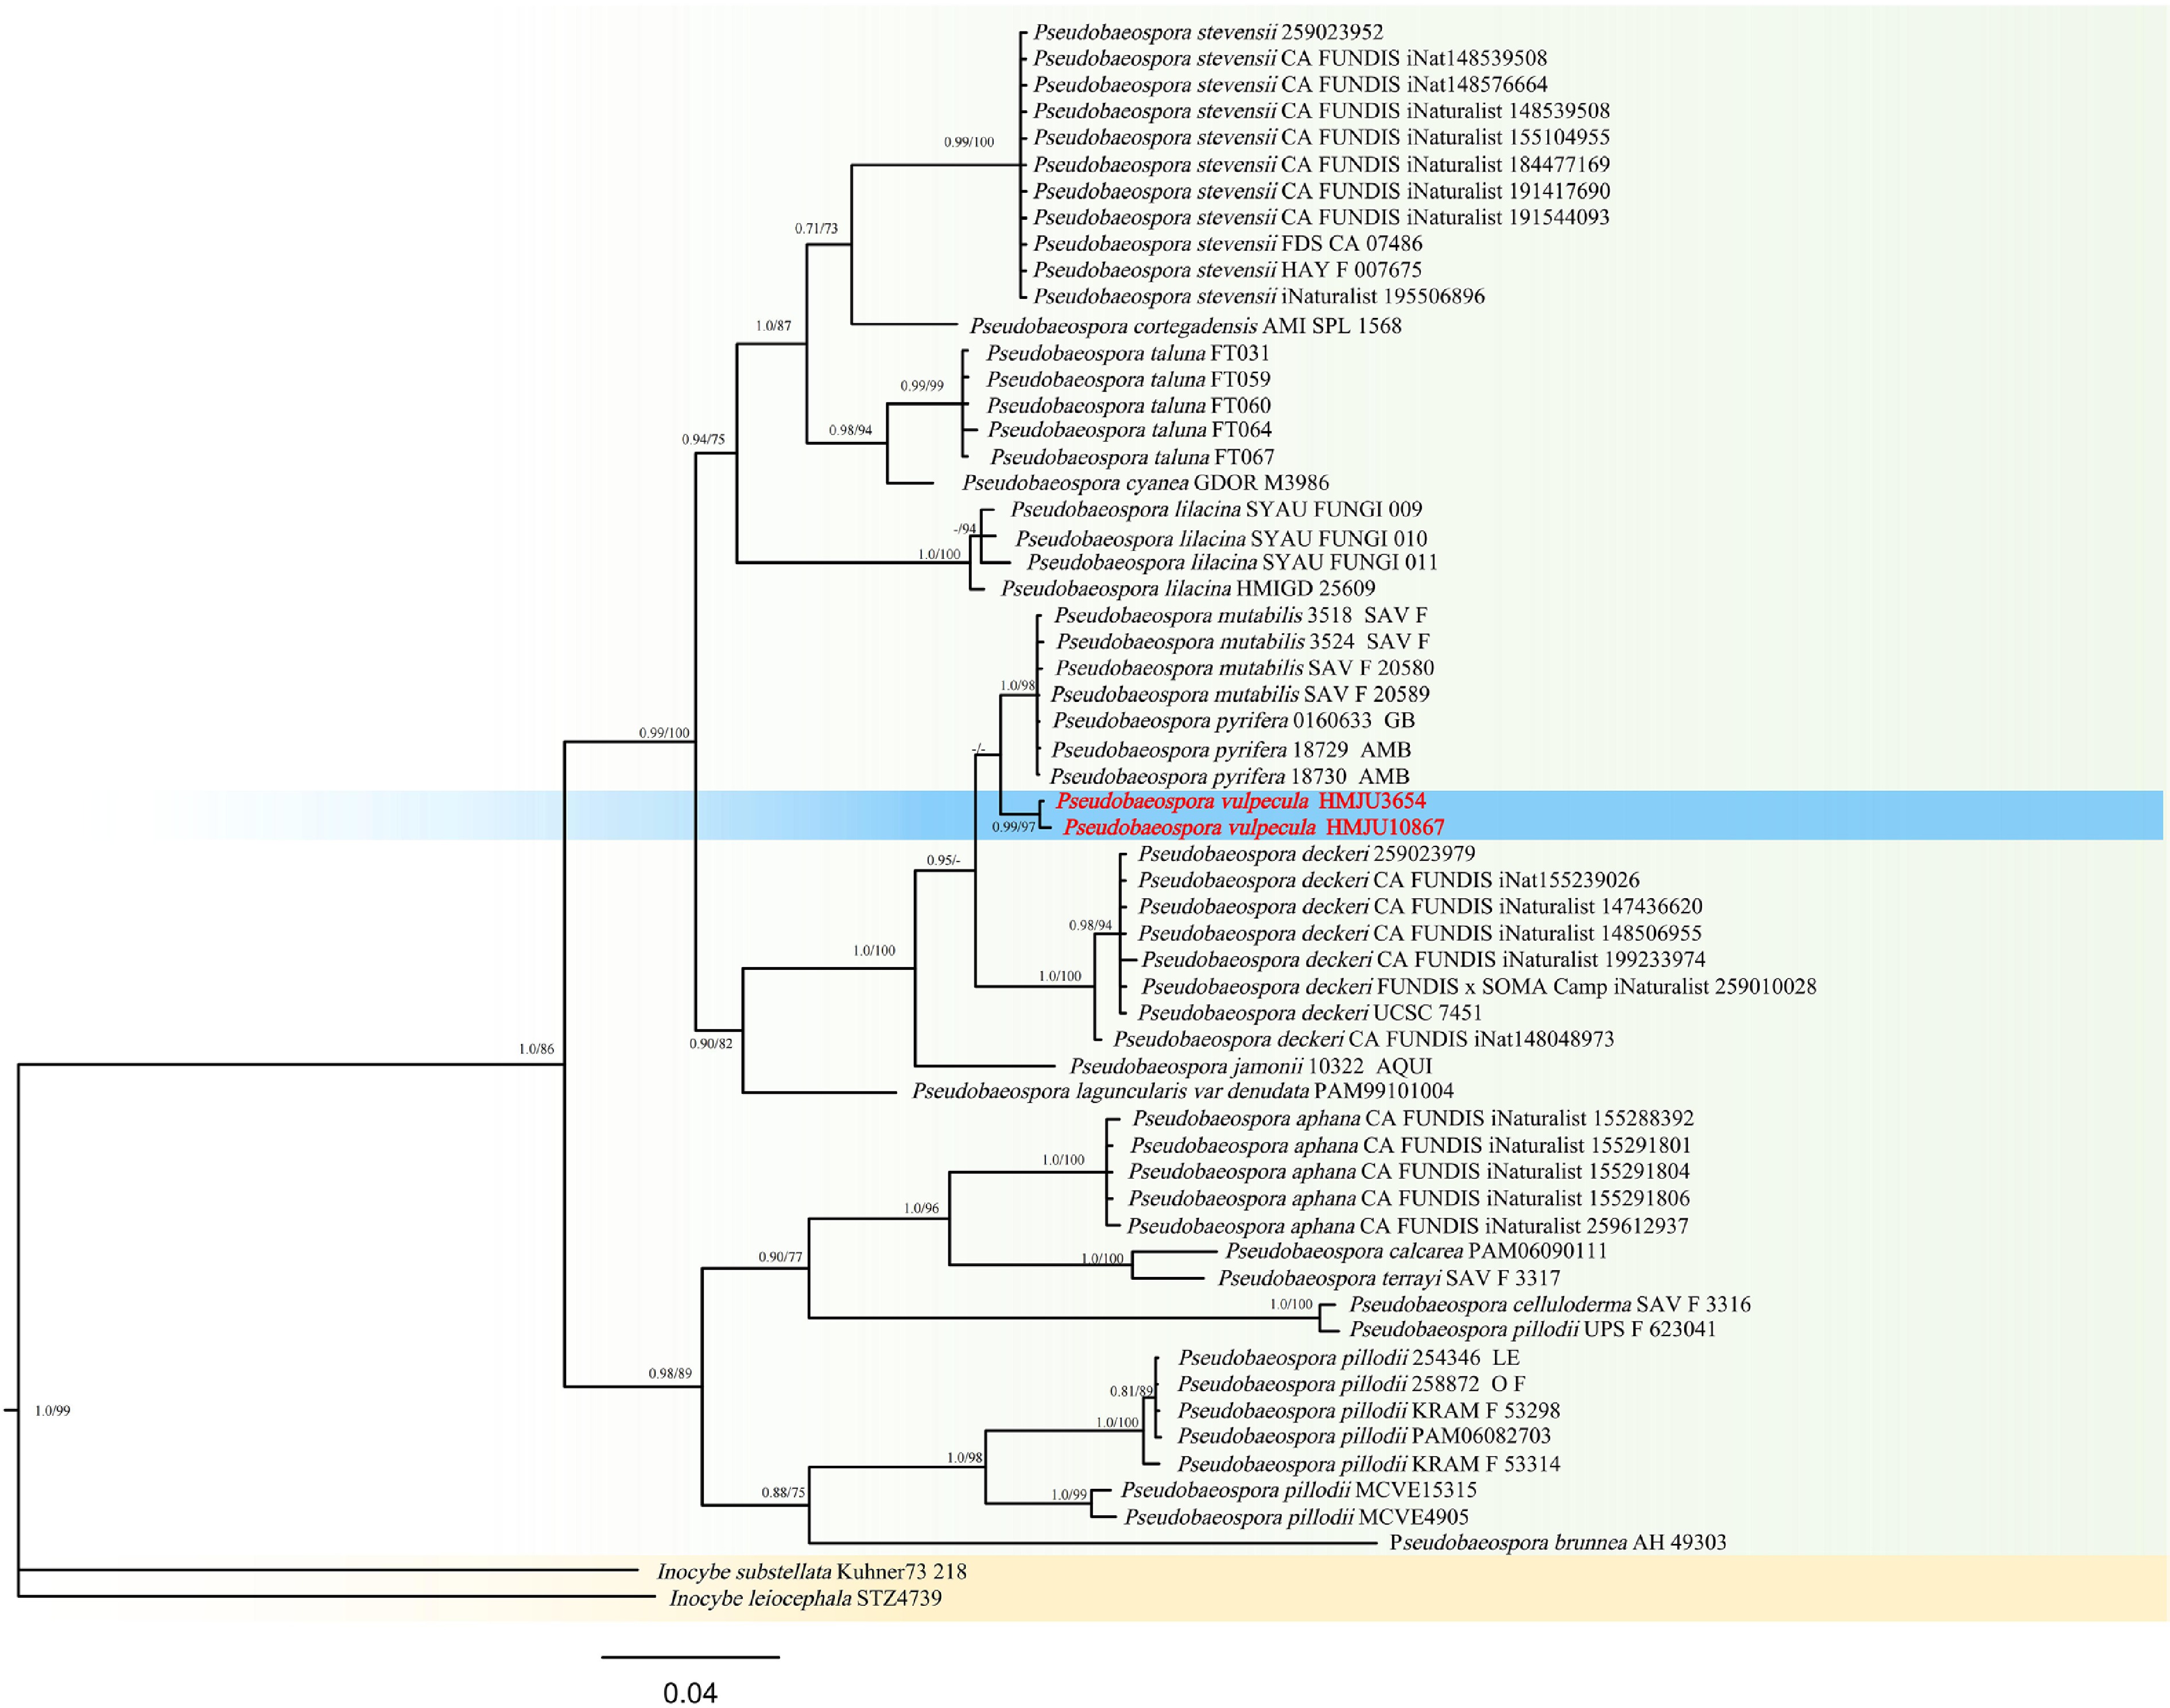
Figure 36.
Phylogram of Maximum Likelihood phylogenetic analysis based on combined ITS, nLSU, rpb2, and tef-1α sequences. The analysis includes 60 strains; total characters: 2,248 (ITS: 570, nLSU: 667, rpb2: 507, tef-1α: 504). Inocybe substellata (Kuhner73 218) and Inocybe leiocephala (STZ4739) were used as the outgroup taxa. The best model was GTR + F + G4. Estimated base frequencies were as follows: A = 0.278, C = 0.191, G = 0.232, T = 0.299. Bootstrap values for ML equal to or greater than 70% and BYPP values equal to or greater than 0.70 are labelled on the nodes. The type strains are in bold.
-
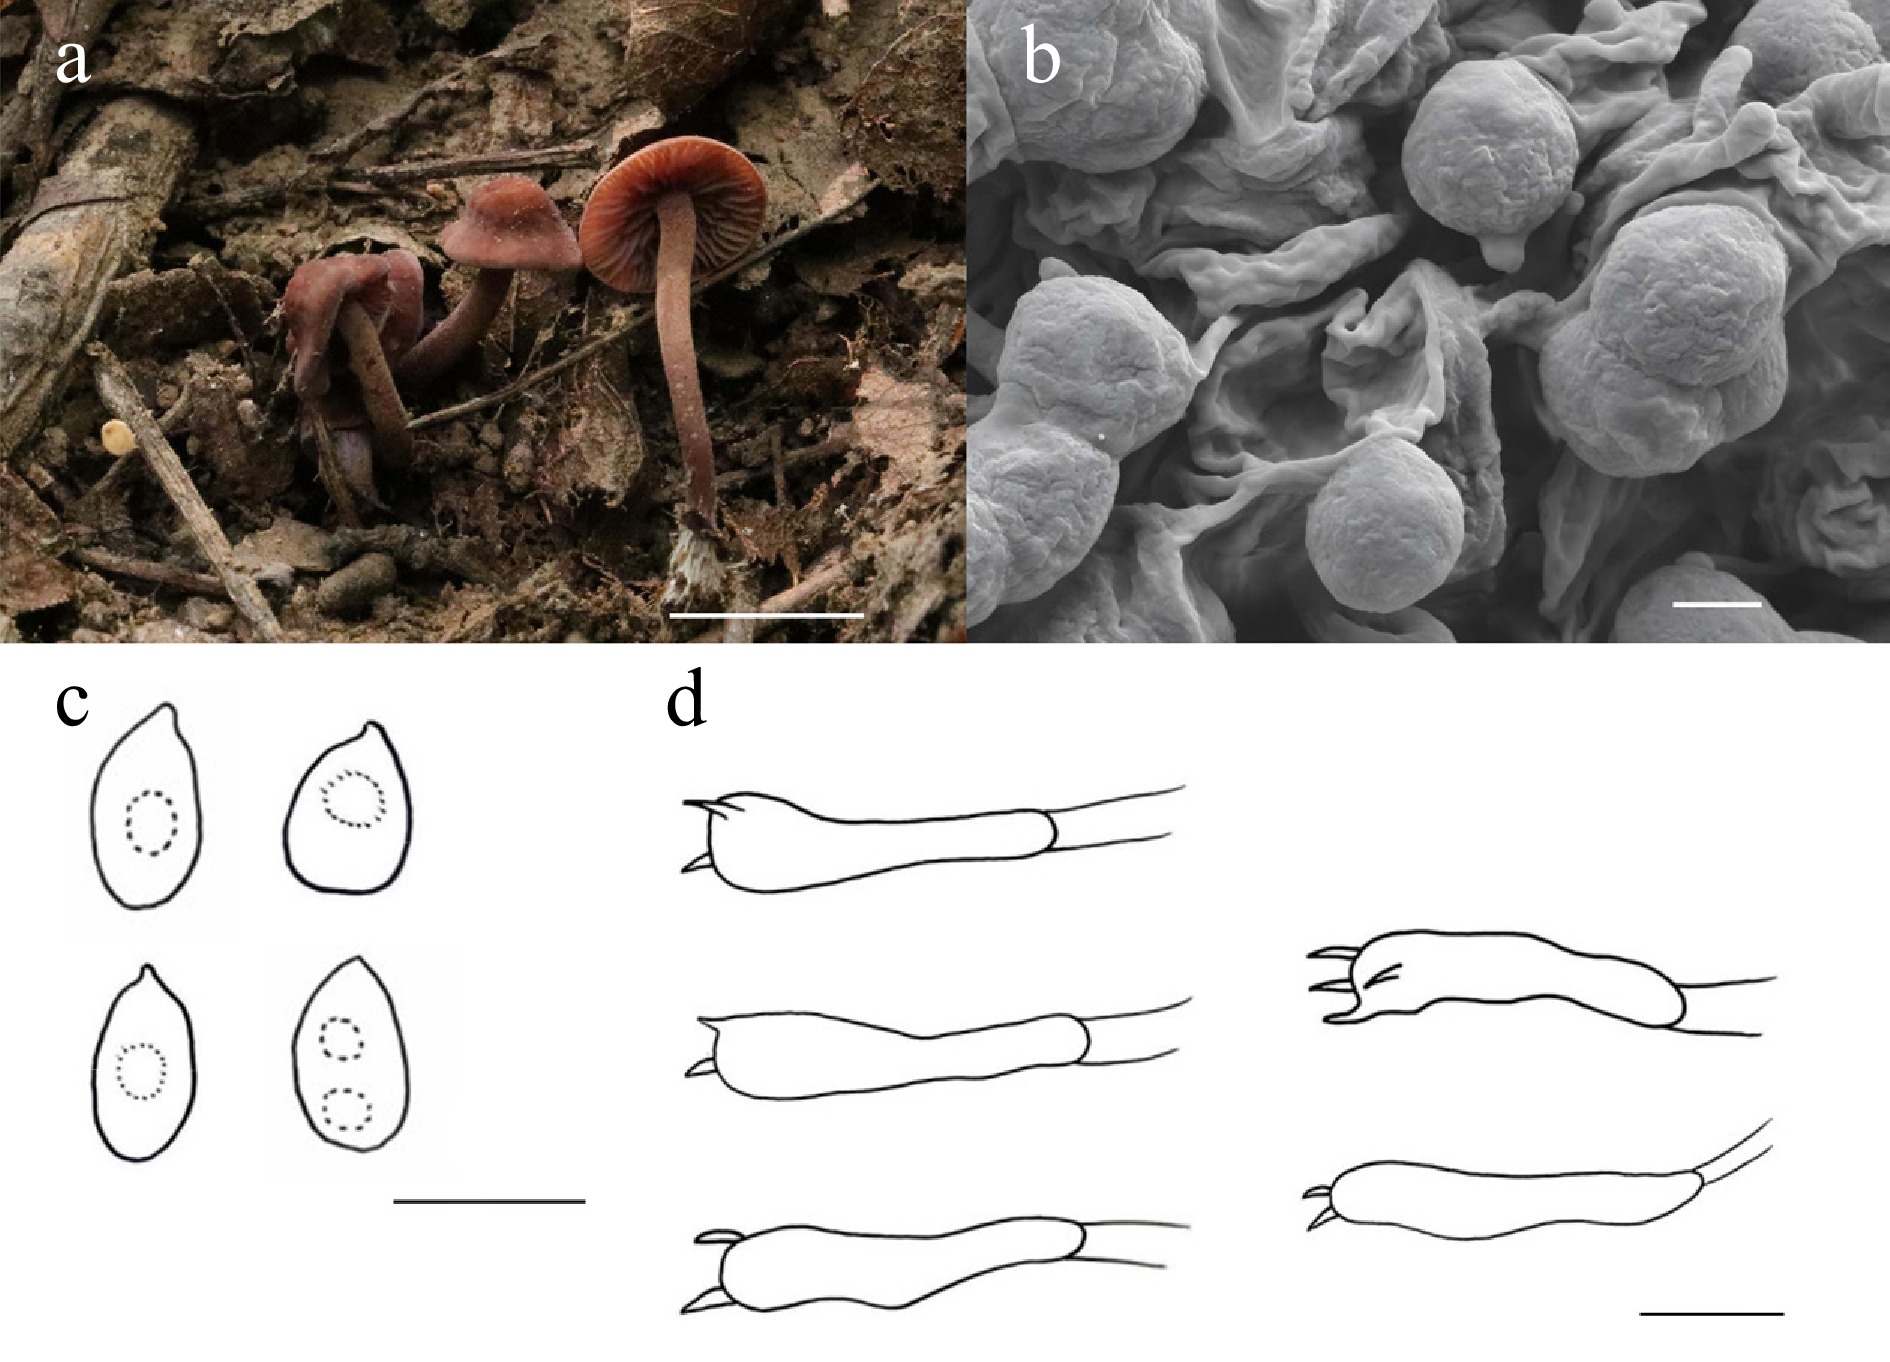
Figure 37.
Pseudobaeospora vulpecula (HMJU 3654, holotype). (a) Basidiocarps. (b) SEM images of basidiospores. (c) Basidiospores. (d) Basidia. Scale bars: (a) 5 cm; (b) 3 µm; and (c), (d) 5 µm.
-
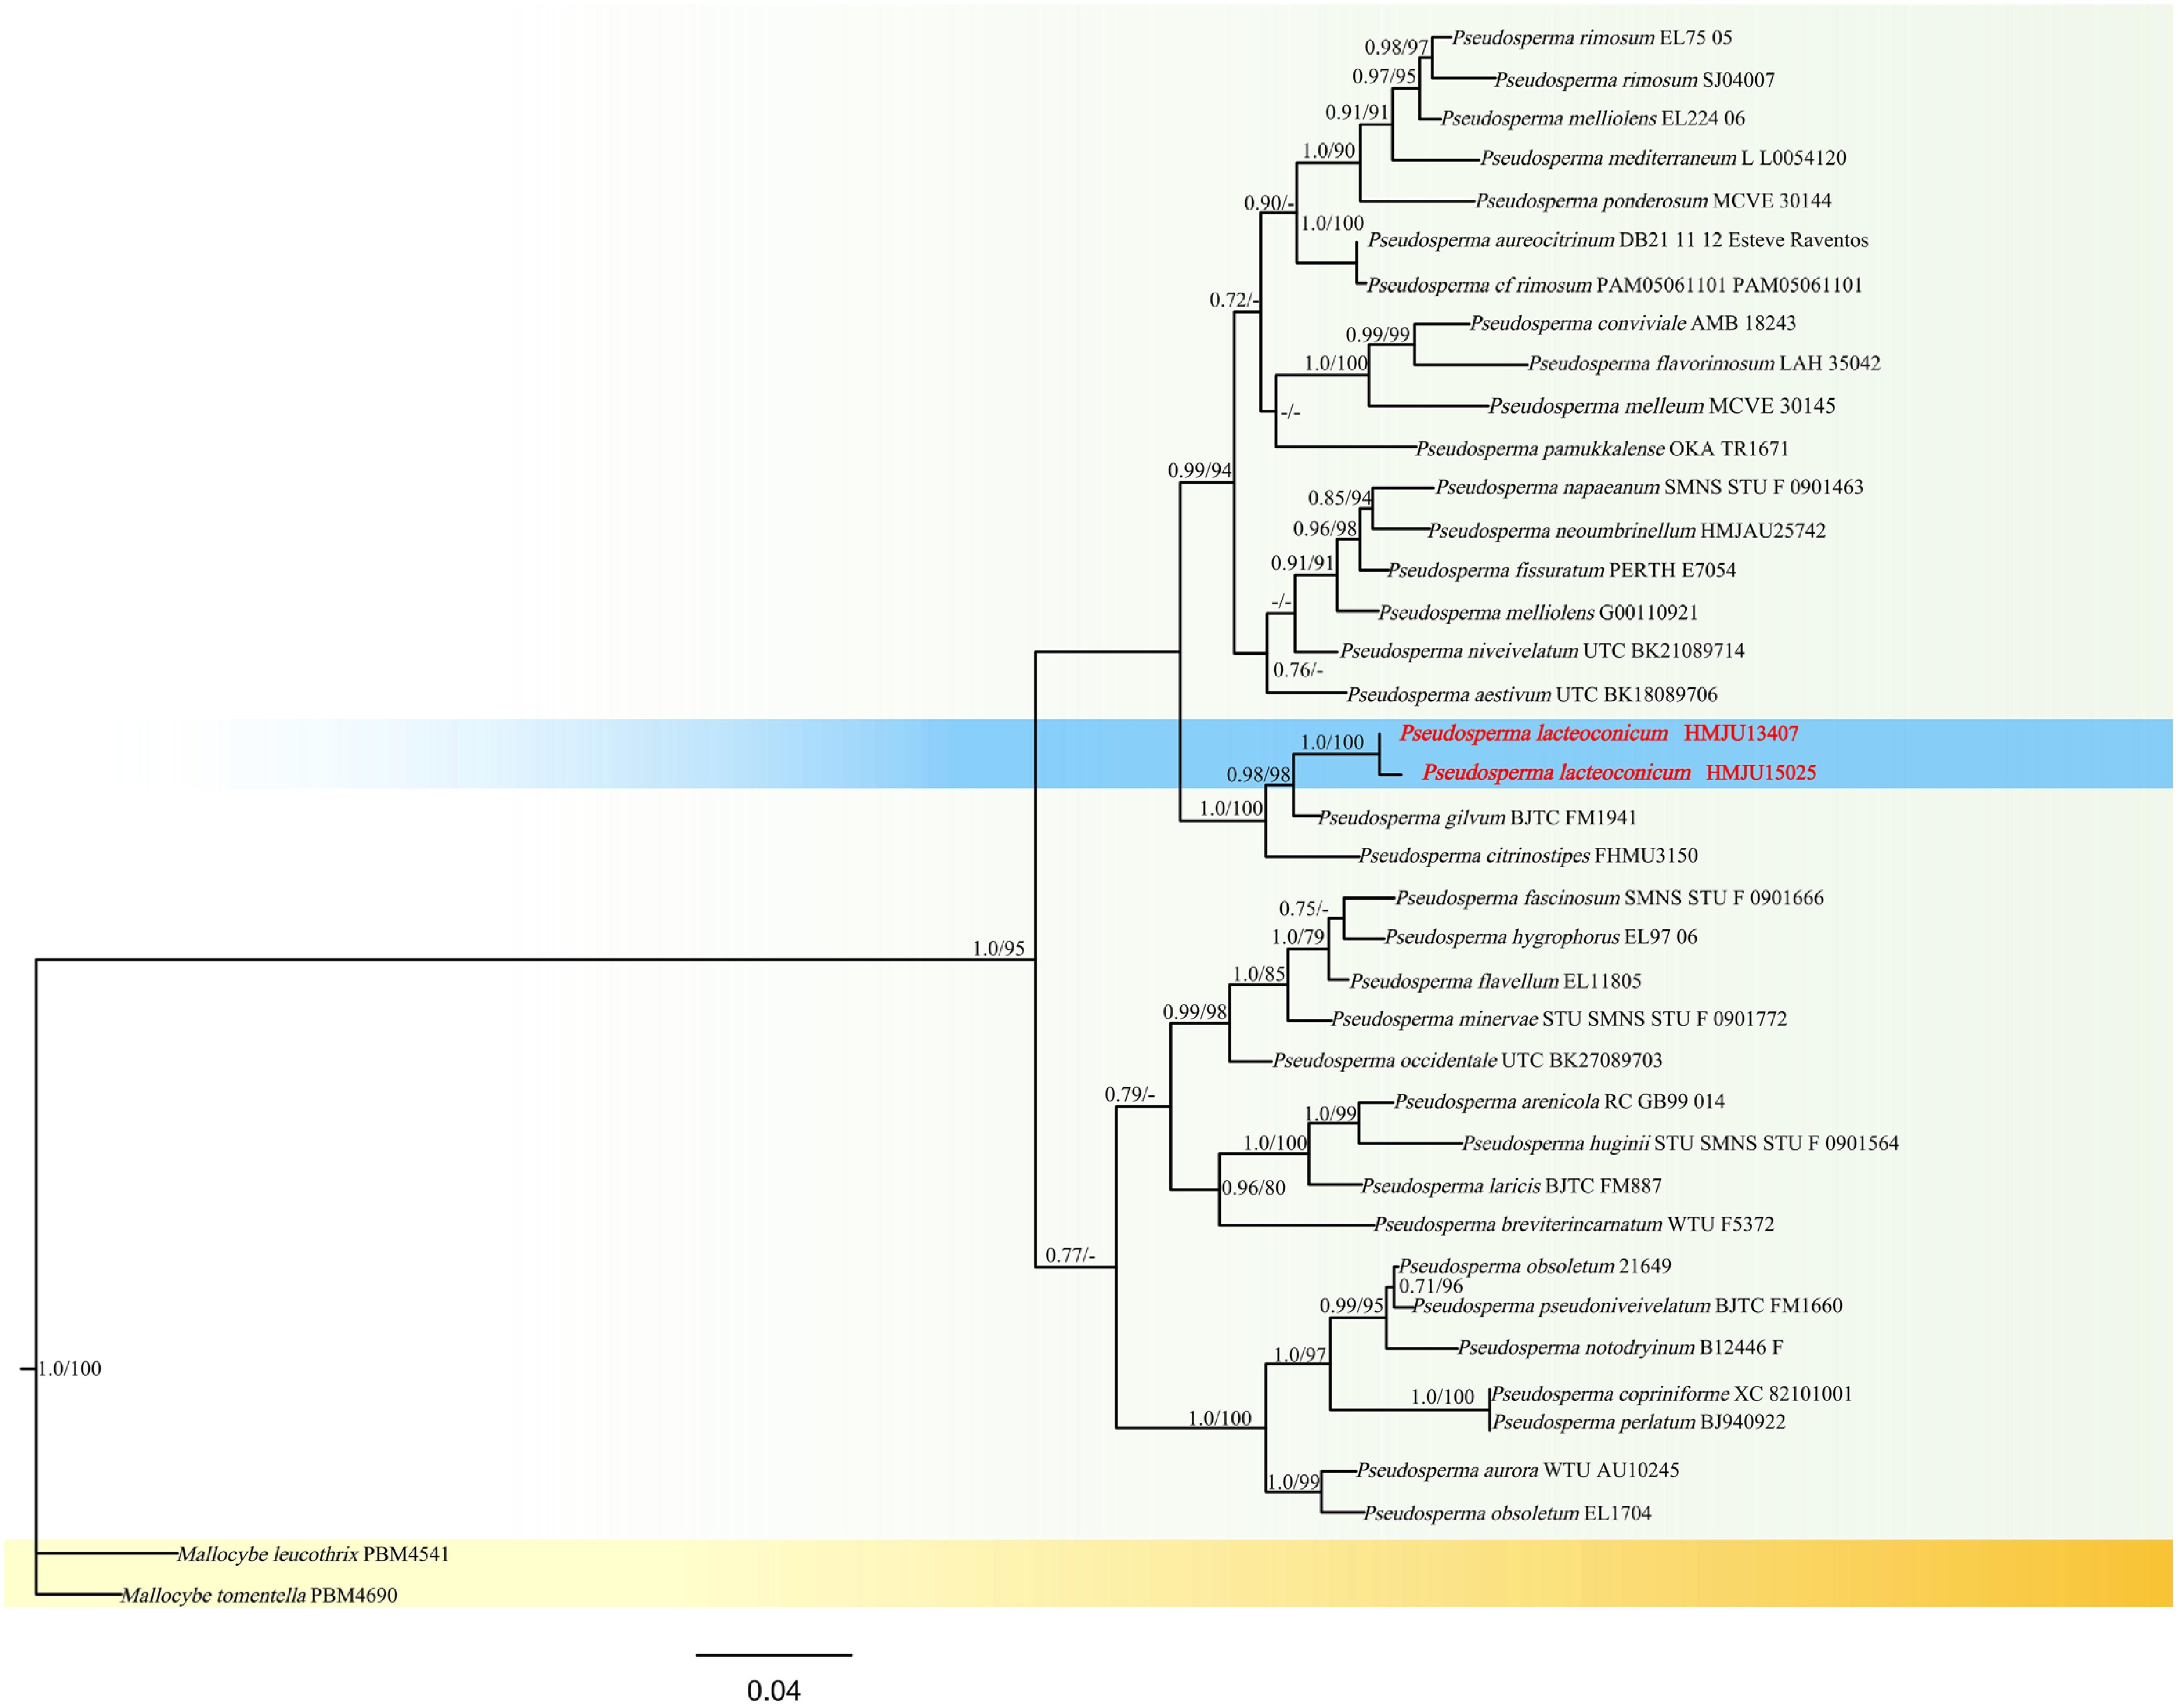
Figure 38.
Phylogram of Maximum Likelihood phylogenetic analysis based on combined ITS, nLSU, rpb2. The analysis includes 39 strains; total characters: 2,115 (ITS: 701, nLSU: 847, rpb2: 567). Mallocybe leucothrix (PBM4541) and Mallocybe tomentella (PBM4690) were used as the outgroup taxa. The best model was TIM2 + F + G4. Estimated base frequencies were as follows: A = 0.258, C = 0.205, G = 0.205, T = 0.333. Bootstrap values for ML equal to or greater than 70% and BYPP values equal to or greater than 0.70 are labelled on the nodes. The isolate of the current study is in purple, while the type strains are in bold.
-
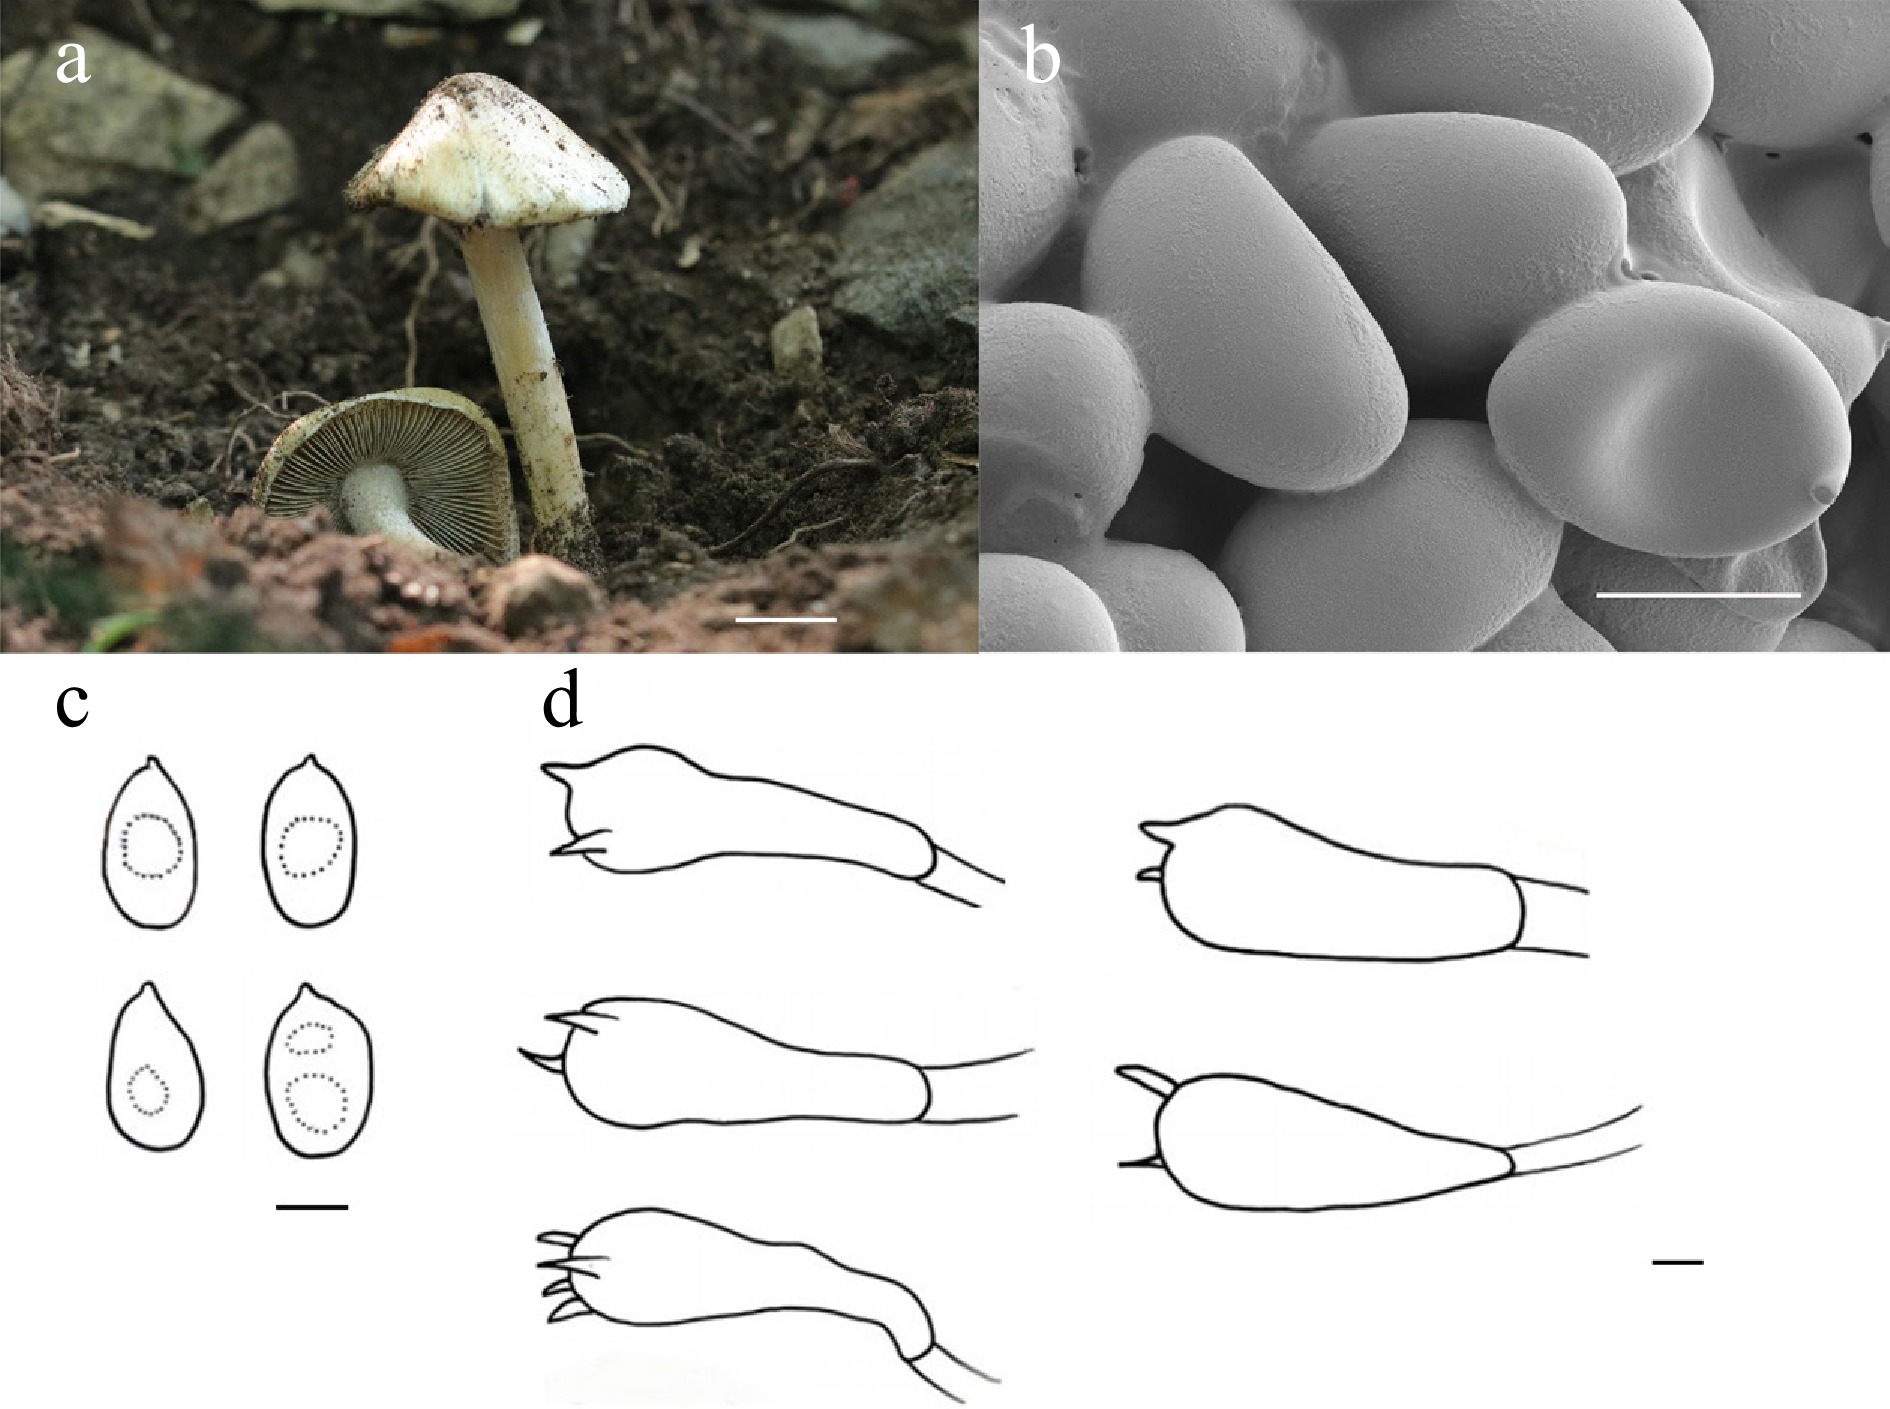
Figure 39.
Pseudosperma lacteoconicum (HMJU 13407, holotype). (a) Basidiocarps. (b) SEM images of basidiospores. (c) Basidiospores. (d) Basidia. Scale bars: (a) 1 cm; (b)–(d) 5 µm.
-
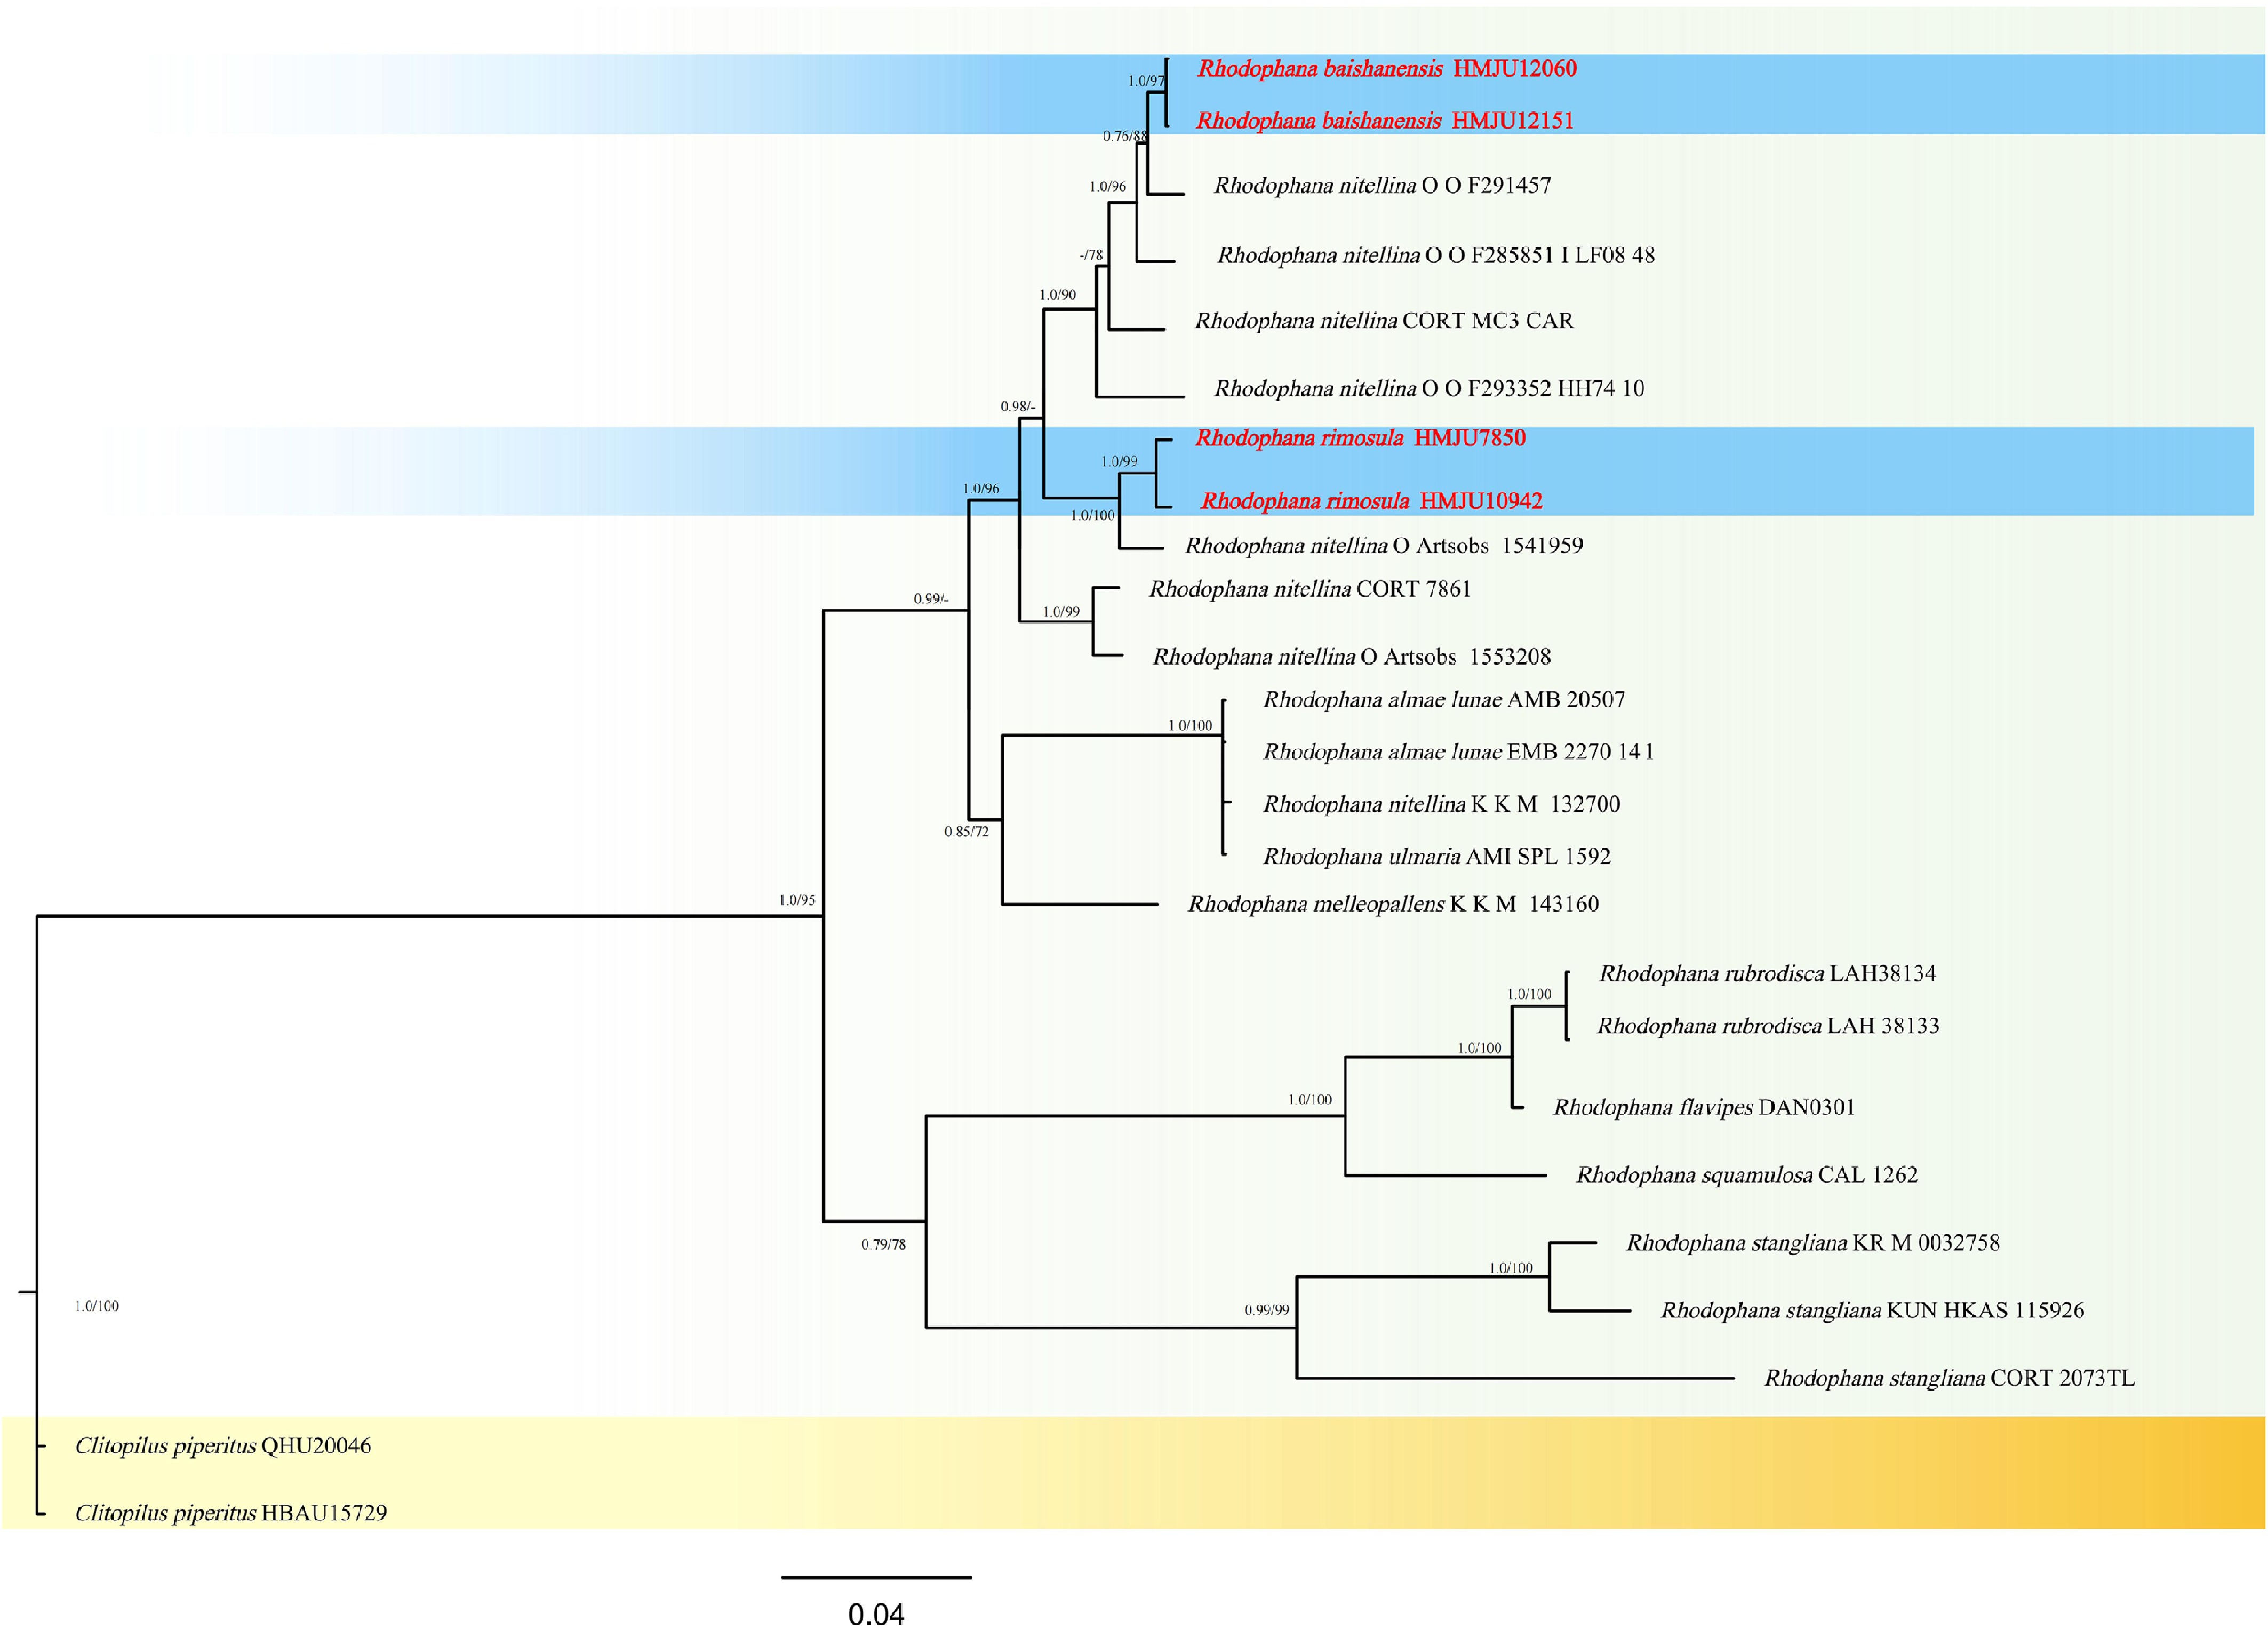
Figure 40.
Phylogram of Maximum Likelihood phylogenetic analysis based on combined ITS, nLSU, rpb2, and tef-1α sequences. The analysis includes 25 strains; total characters: 2,819 (ITS: 672, nLSU: 846, rpb2:519, tef-1α: 782). Clitopilus piperitus (QHU20046) and Clitopilus piperitus (HBAU15729) were used as the outgroup taxa. The best model was TIM2 + F + G4. Estimated base frequencies were as follows: A = 0.272, C = 0.205, G = 0.248, T = 0.276. Bootstrap values for ML equal to or greater than 70% and BYPP values equal to or greater than 0.70 are labelled on the nodes. The isolate of the current study is in purple, while the type strains are in bold.
-
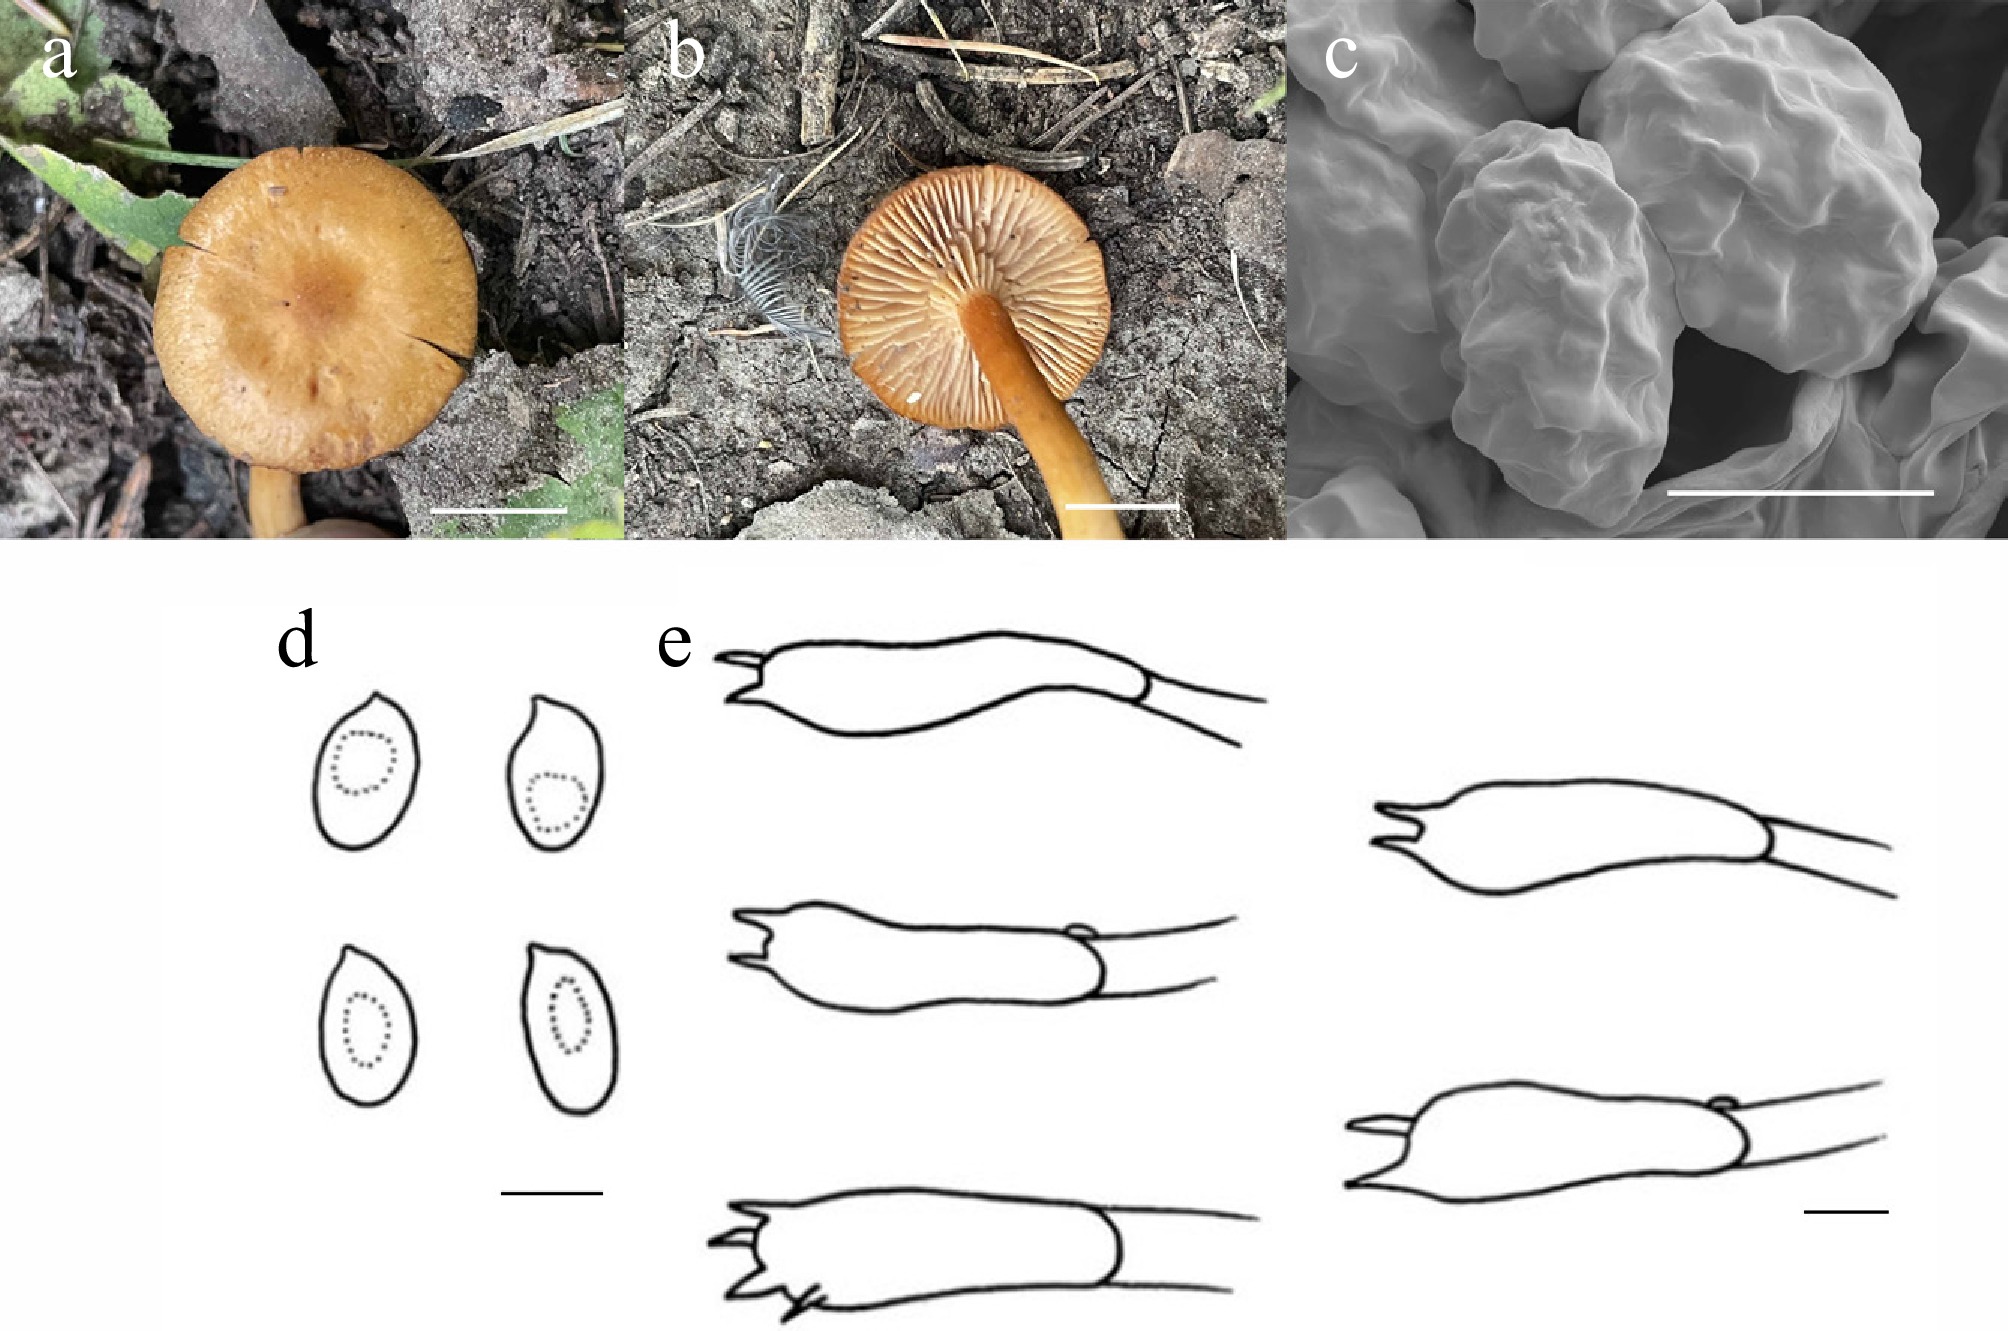
Figure 41.
Rhodophana rimosula (HMJU 7850, holotype). (a), (b) Basidiocarps. (c) SEM images of basidiospores. (d) Basidiospores. (e) Basidia. Scale bars: (a), (b) 1 cm; (c)–(e) 5 µm.
-
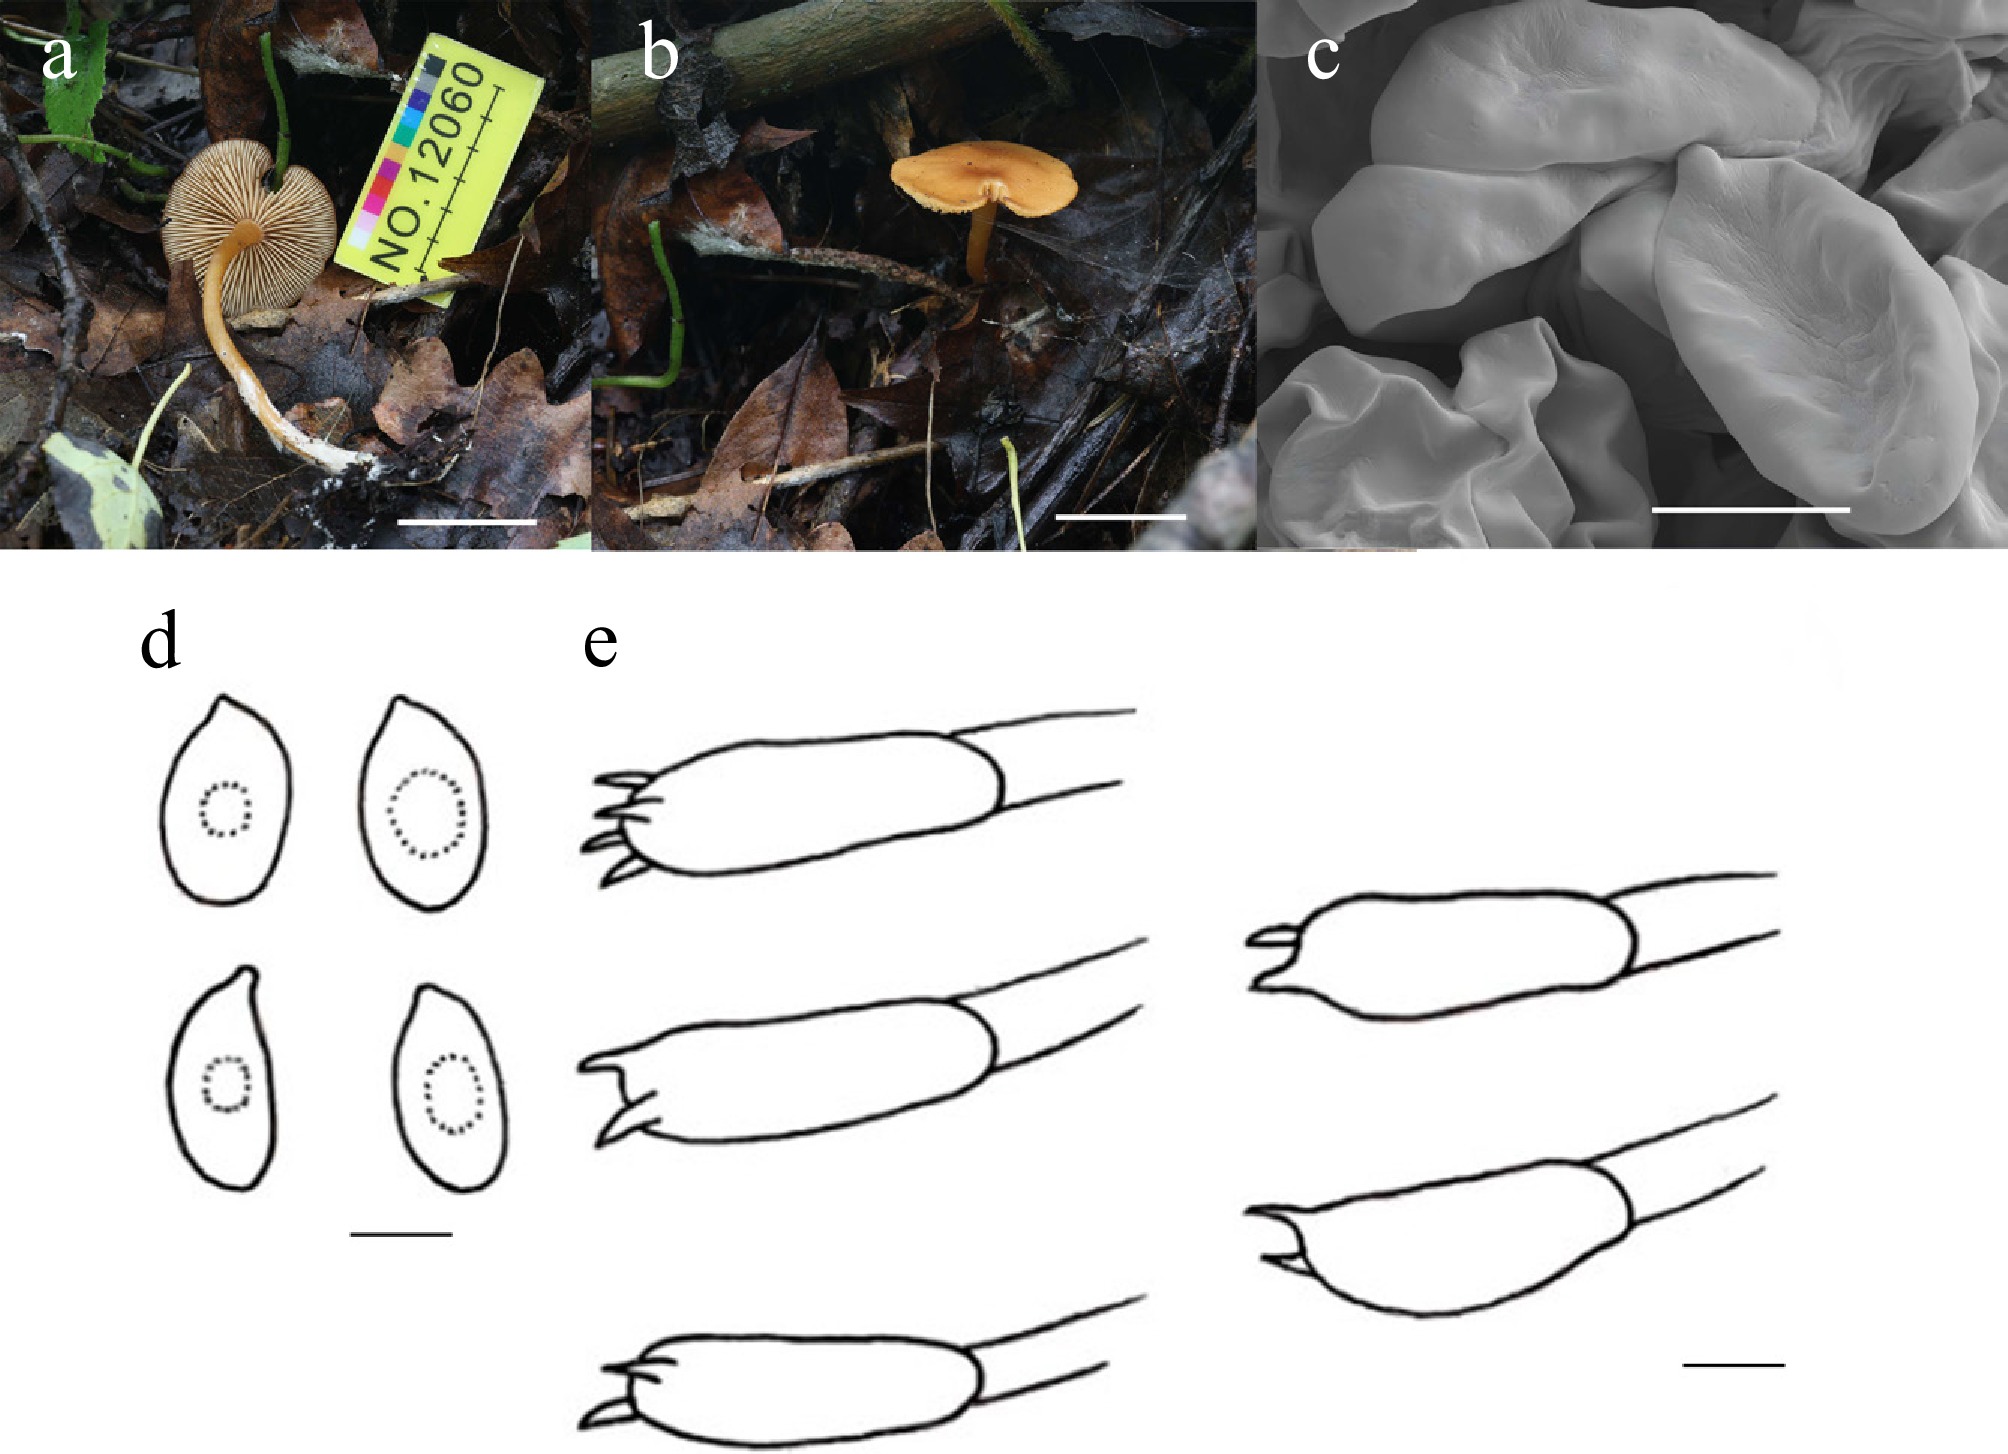
Figure 42.
Rhodophana baishanensis (HMJU 12060, holotype). (a), (b) Basidiocarps; (c) SEM images of basidiospores; (d) Basidiospores; (e) Basidia. Scale bar: (a), (b) 2 cm; (c)–(e) 5 µm.
-
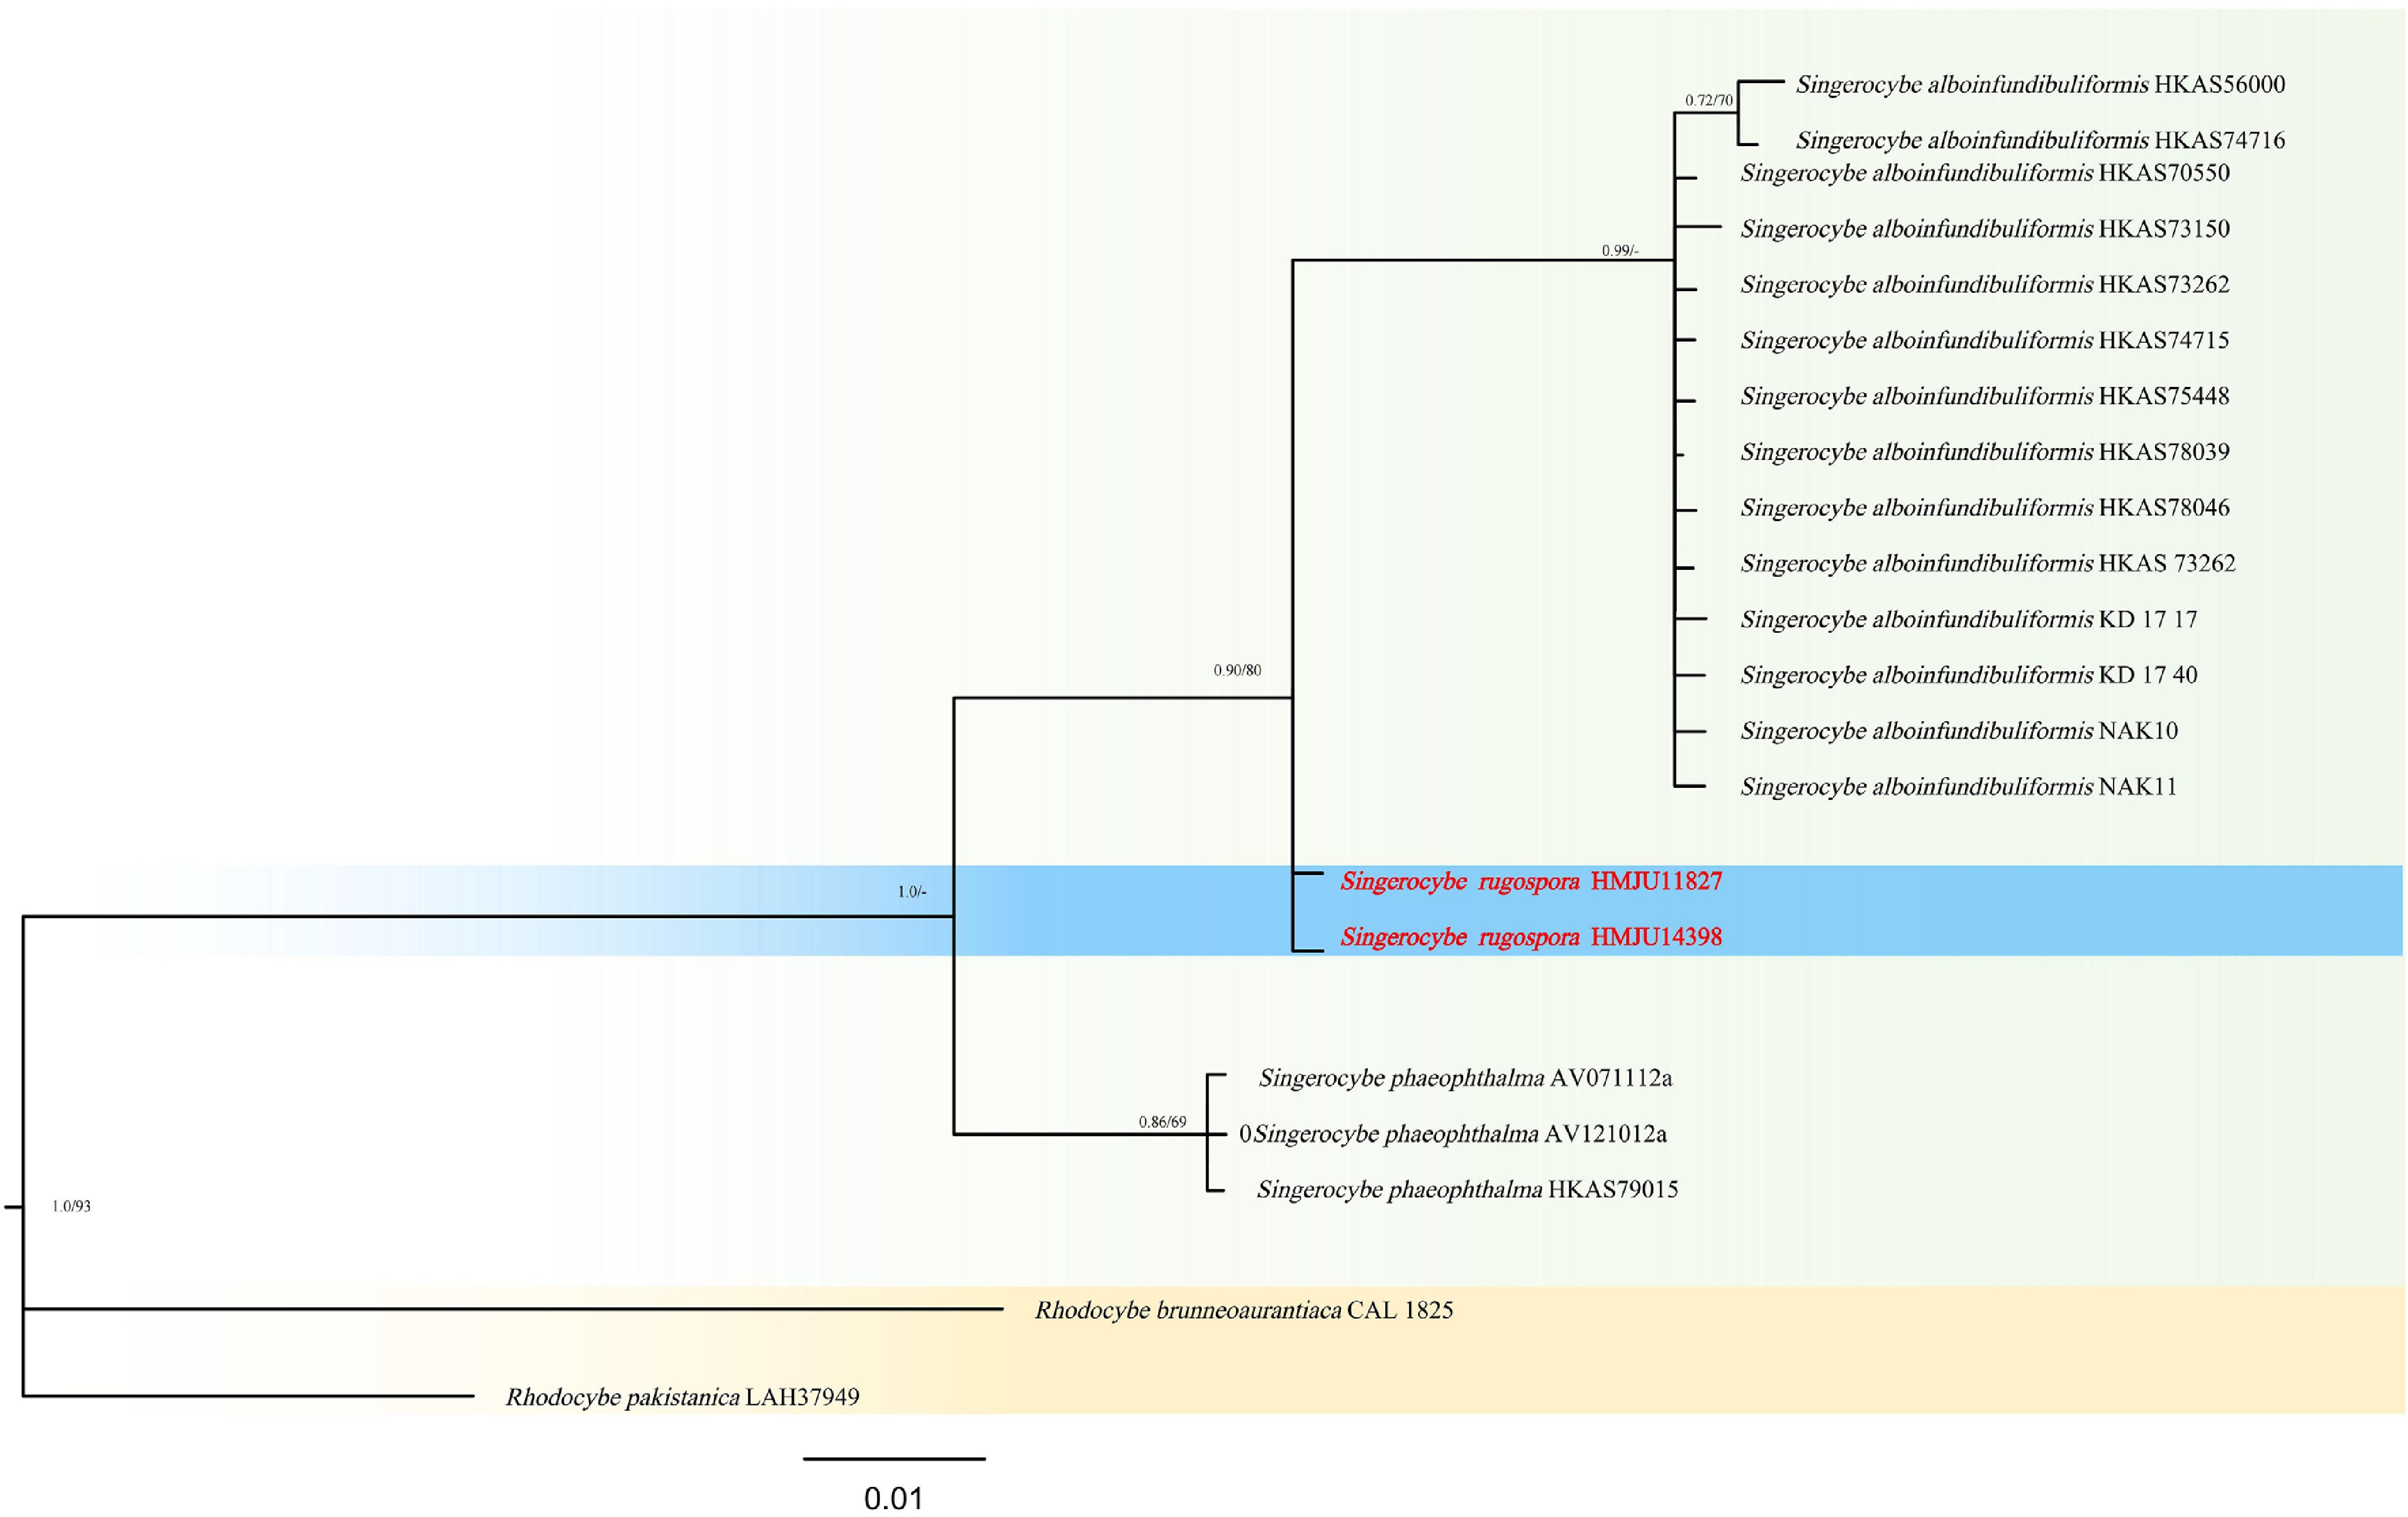
Figure 43.
Phylogram of Maximum Likelihood phylogenetic analysis based on combined ITS, nLSU, rpb2, and tef-1 sequences. The analysis includes 21 strains; total characters: 2,213 (ITS: 261, nLSU: 810, rpb2: 570, tef-1: 572). Rhodocybe brunneoaurantiaca (CAL 1825) and Rhodocybe pakistanica (Dai 6380) were used as the outgroup taxa. The best model was TIM + F + G4. Estimated base frequencies were as follows: A = 0.264, C = 0.208, G = 0.257, T = 0.271. Bootstrap values for ML equal to or greater than 70% and BYPP values equal to or greater than 0.70 are labelled on the nodes. The isolate of the current study is in purple, while the type strains are in bold.
-
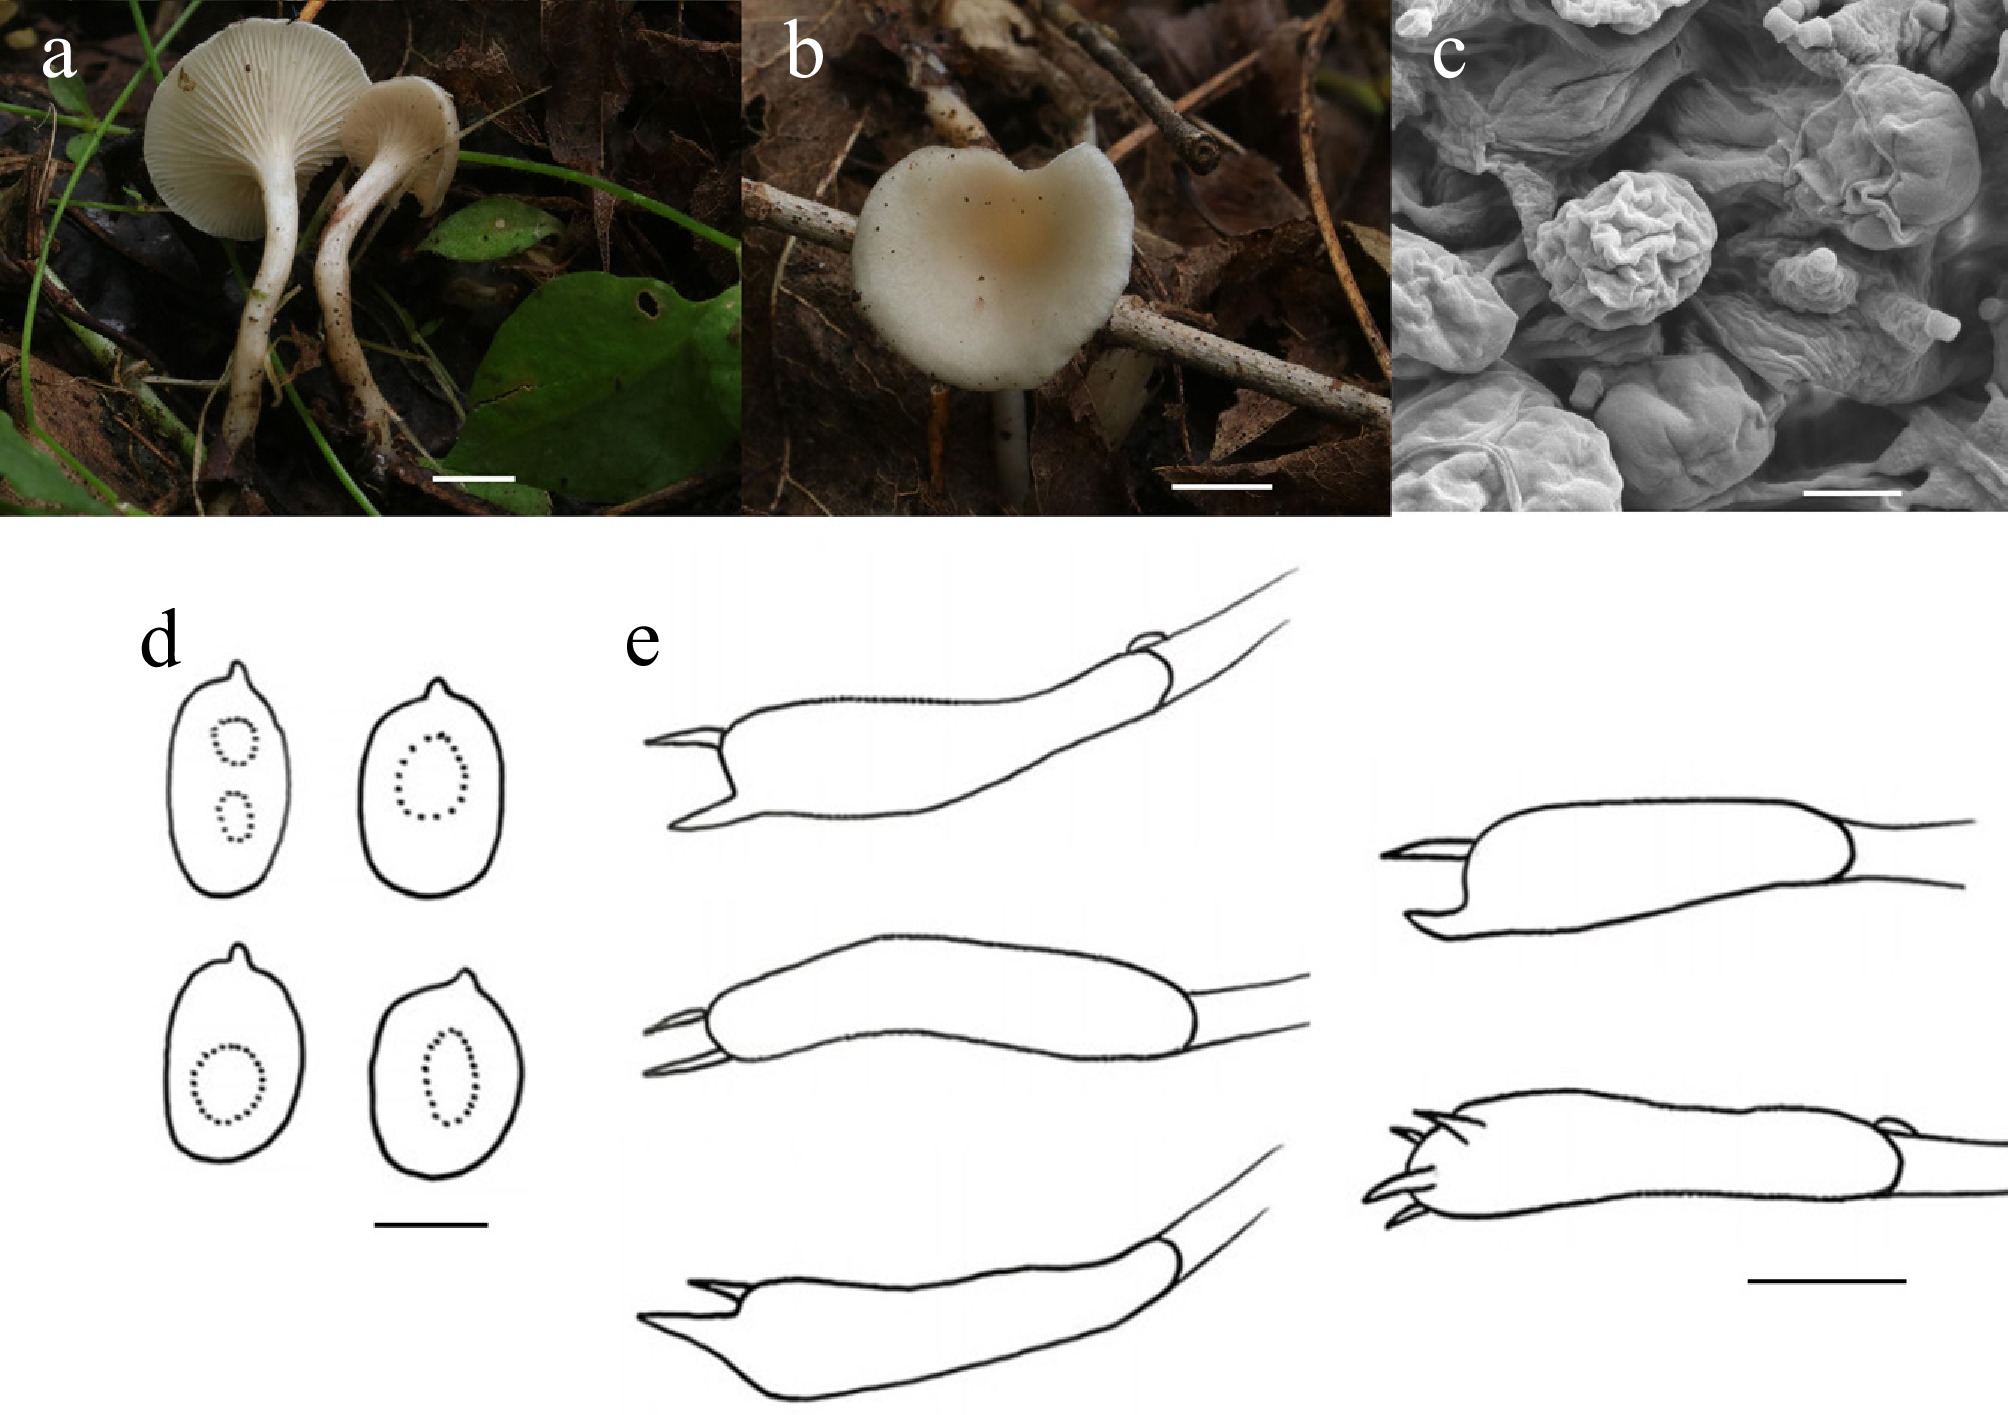
Figure 44.
Singerocybe rugospora (HMJU 11827, holotype). (a), (b) Basidiocarps. (c) SEM images of basidiospores. (d) Basidiospores. (e) Basidia. Scale bars: (a), (b) 0.5 cm; (c), (d) 3 µm; and (e) 5 µm.
-
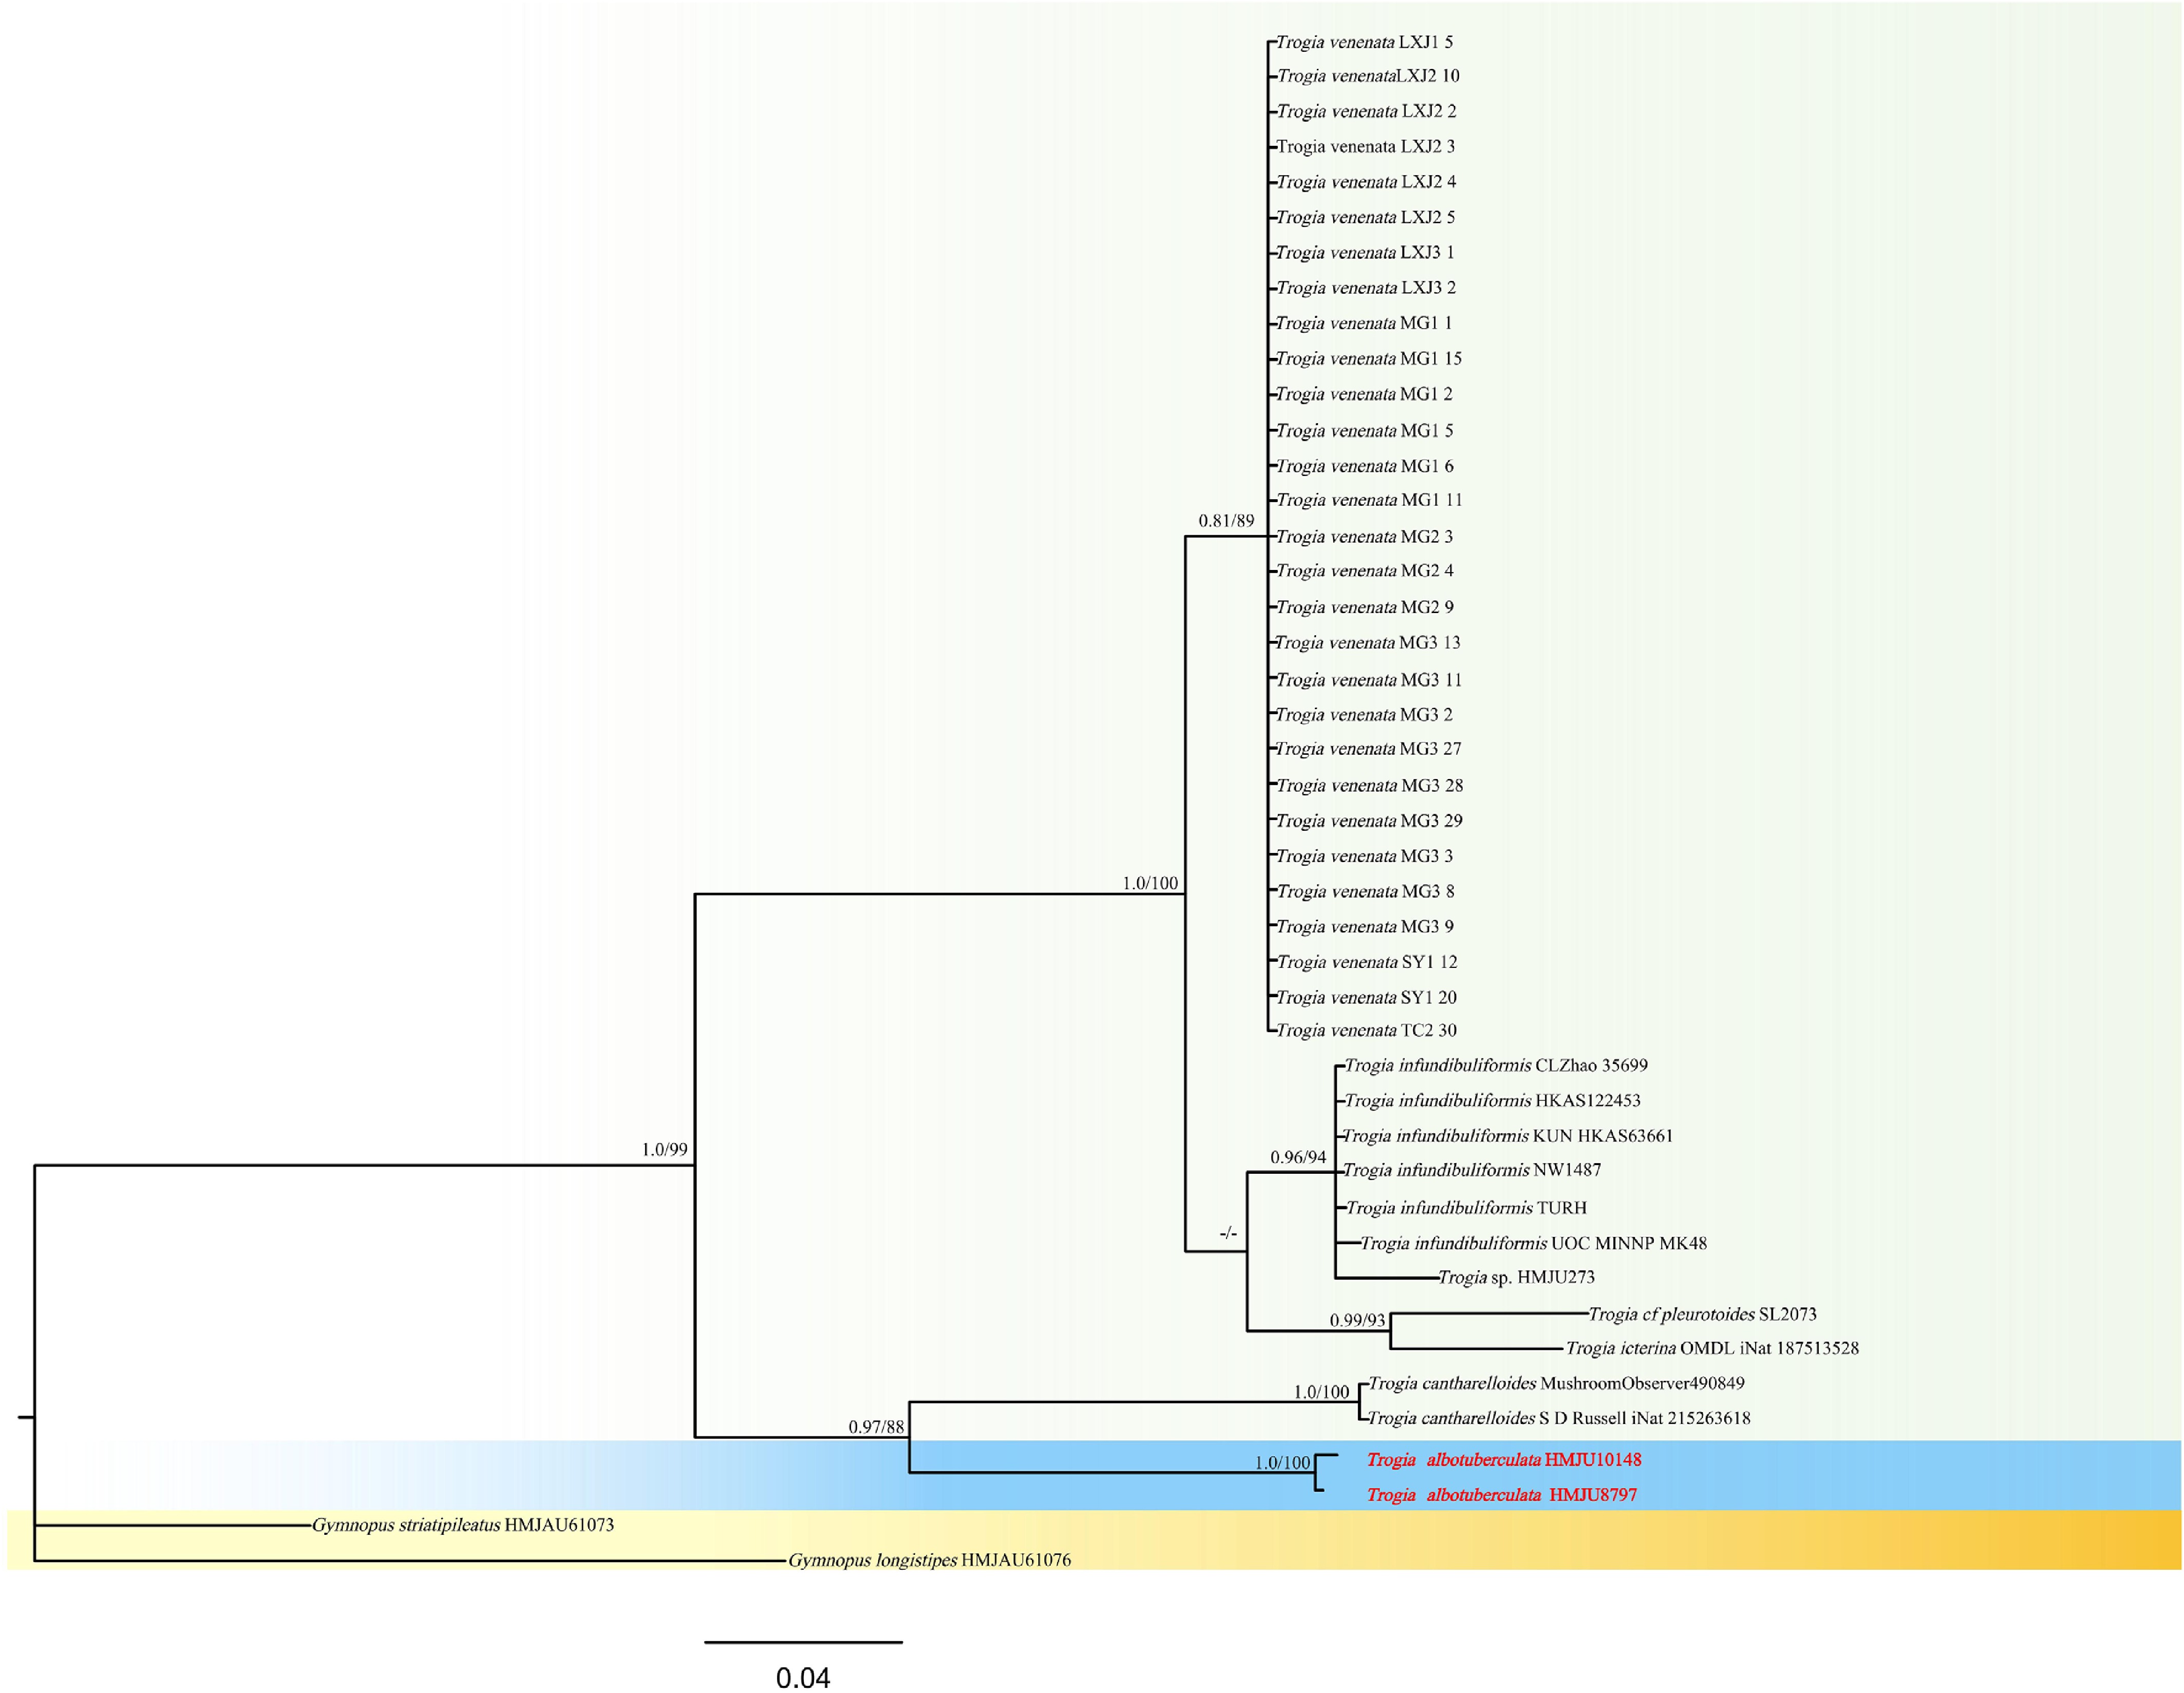
Figure 45.
Phylogram of Maximum Likelihood phylogenetic analysis based on combined ITS sequences. The analysis includes 44 strains; total characters: 617 (ITS: 617). Gymnopus striatipileatus (HMJAU61073) and Gymnopus longistipes (HMJAU61076) were used as the outgroup taxa. The best model was HKY + F + G4. Estimated base frequencies were as follows: A = 0.236, C = 0.209, G = 0.211, T = 0.344. Bootstrap values for ML equal to or greater than 70% and BYPP values equal to or greater than 0.70 are labelled on the nodes. The isolate of the current study is in purple, while the type strains are in bold.
-
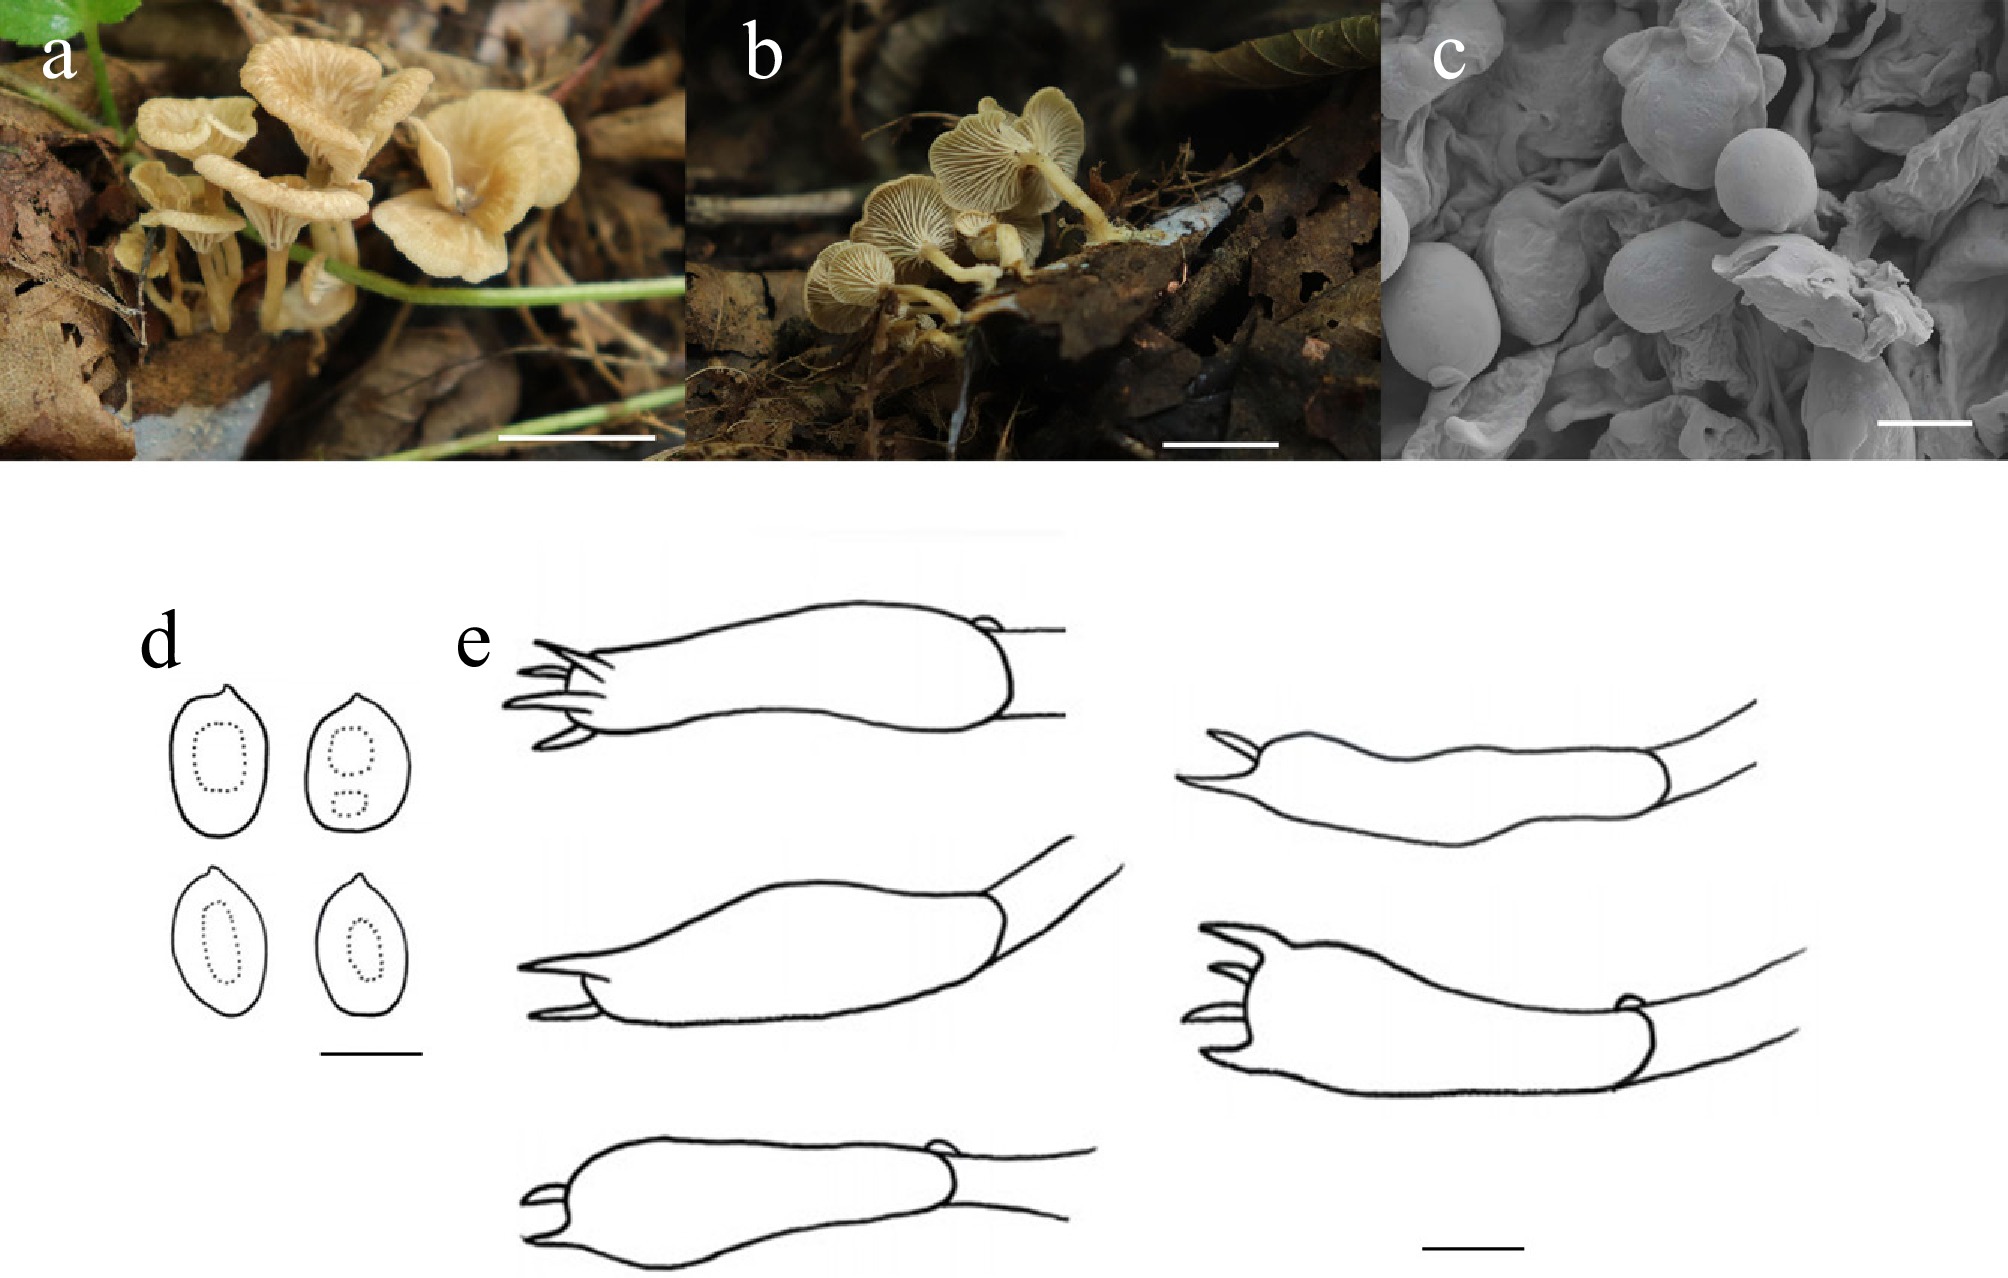
Figure 46.
Trogia albotuberculata (HMJU 10148, holotype). (a), (b) Basidiocarps; (c) SEM images of basidiospores; (d) Basidiospores; (e) Basidia. Scale bars: (a), (b) 1 cm; (c)–(e) 5 µm.
-
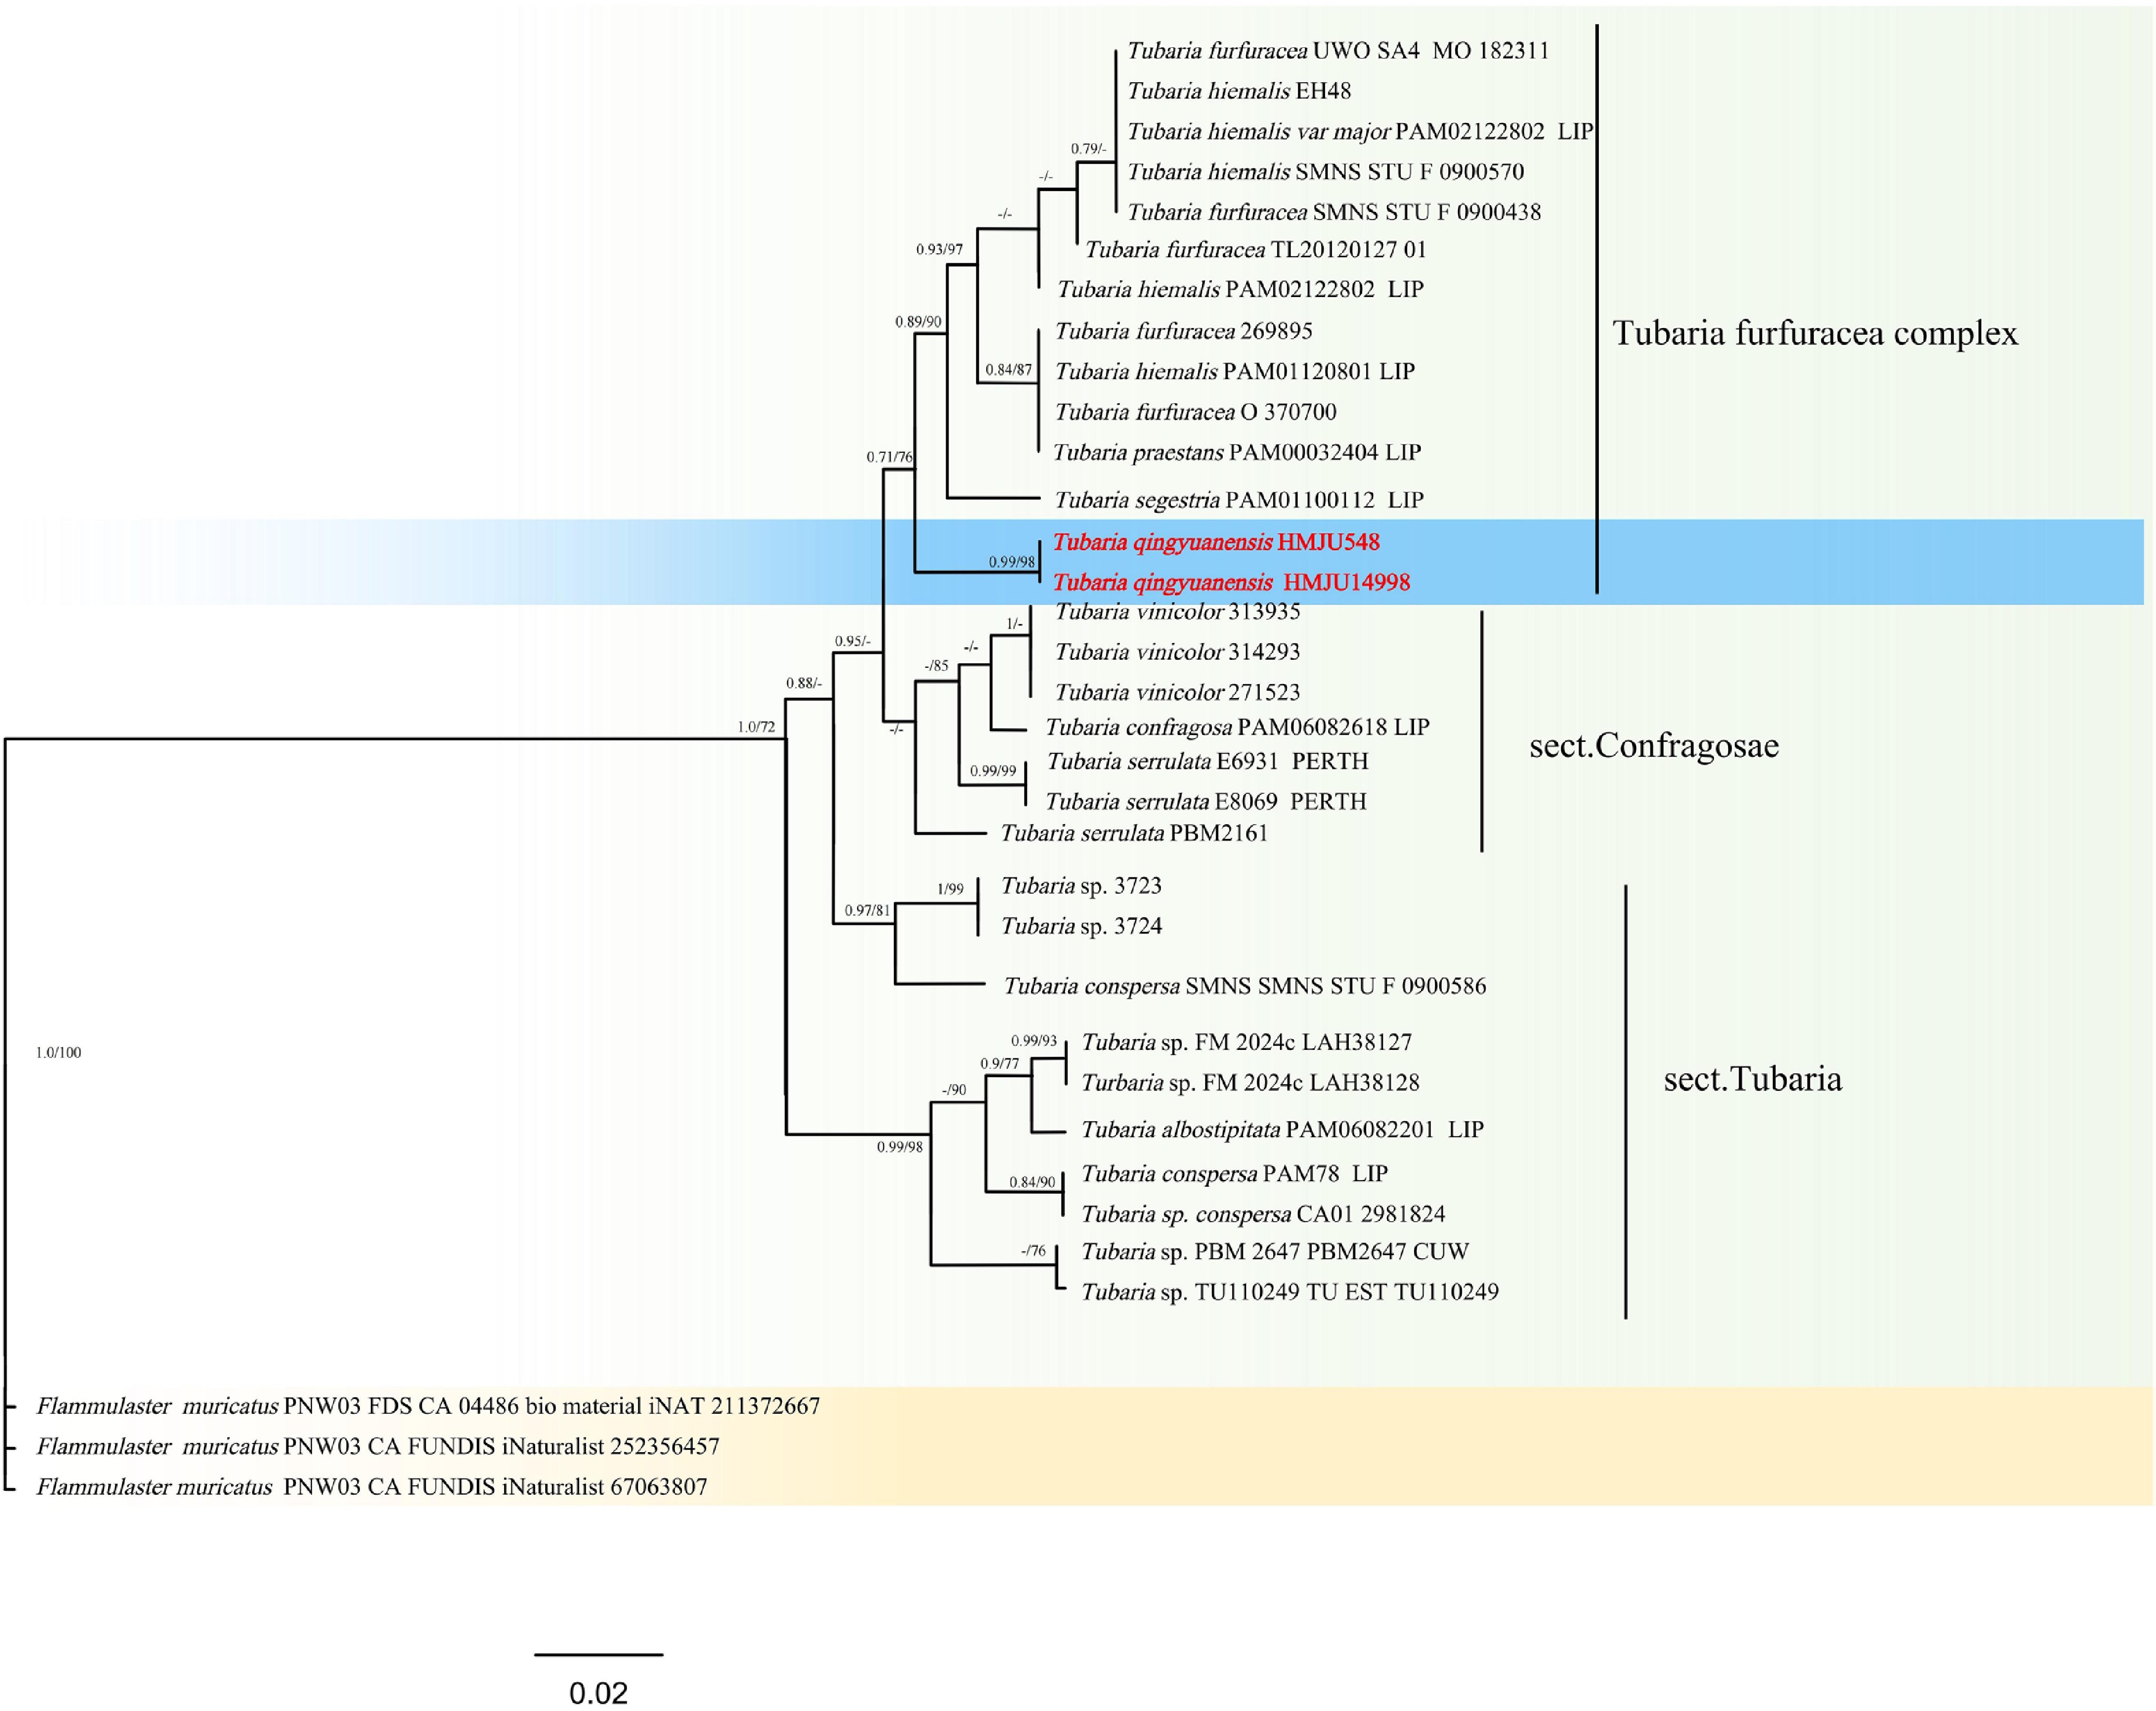
Figure 47.
Phylogram of Maximum Likelihood phylogenetic analysis based on combined ITS and nLSUsequences. The analysis includes 34 strains; total characters: 1,433 (ITS: 604, LSU: 829). Flammulaster muricatus (PNW03 FDS CA 04486 bio material iNAT 211372667), Flammulaster muricatus (PNW03 CA FUNDIS iNaturalist 252356457), and Flammulaster muricatus (PNW03 CA FUNDIS iNaturalist 67063807) were used as the outgroup taxa. The best model was TIM2 + F + G4. Estimated base frequencies were as follows: A = 0.245, C = 0.207, G = 0.246, T = 0.302. Bootstrap values for ML equal to or greater than 70% and BYPP values equal to or greater than 0.70 are labelled on the nodes. The isolate of the current study is in purple, while the type strains are in bold.
-
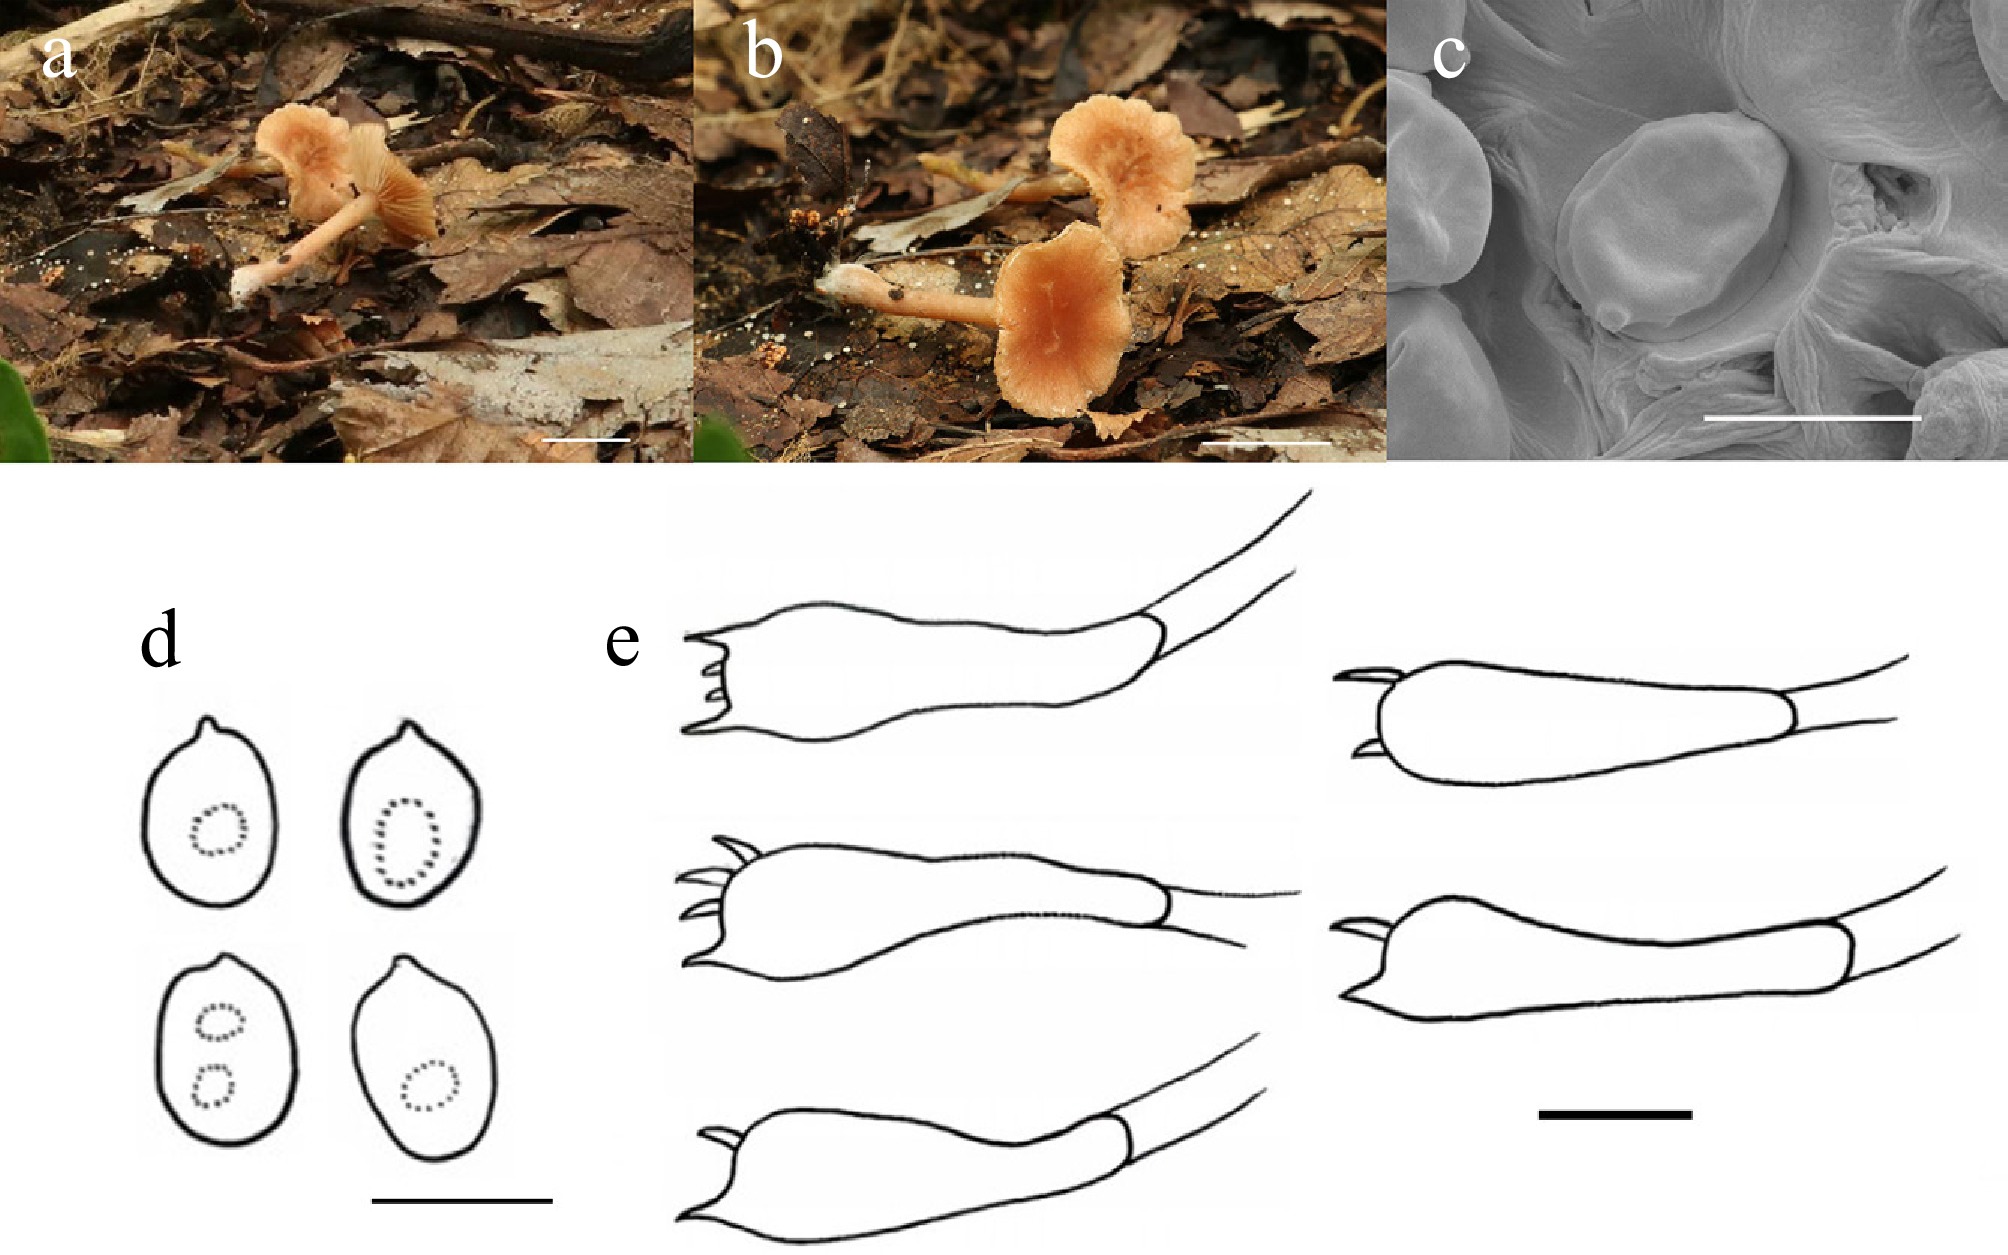
Figure 48.
Tubaria qingyuanensis (HMJU 548, holotype). (a), (b) Basidiocarps. (c) SEM images of basidiospores. (d) Basidiospores. (e) Basidia. Scale bars: (a), (b) 1 cm; (c)–(e) 5 µm.
Figures
(48)
Tables
(0)