-
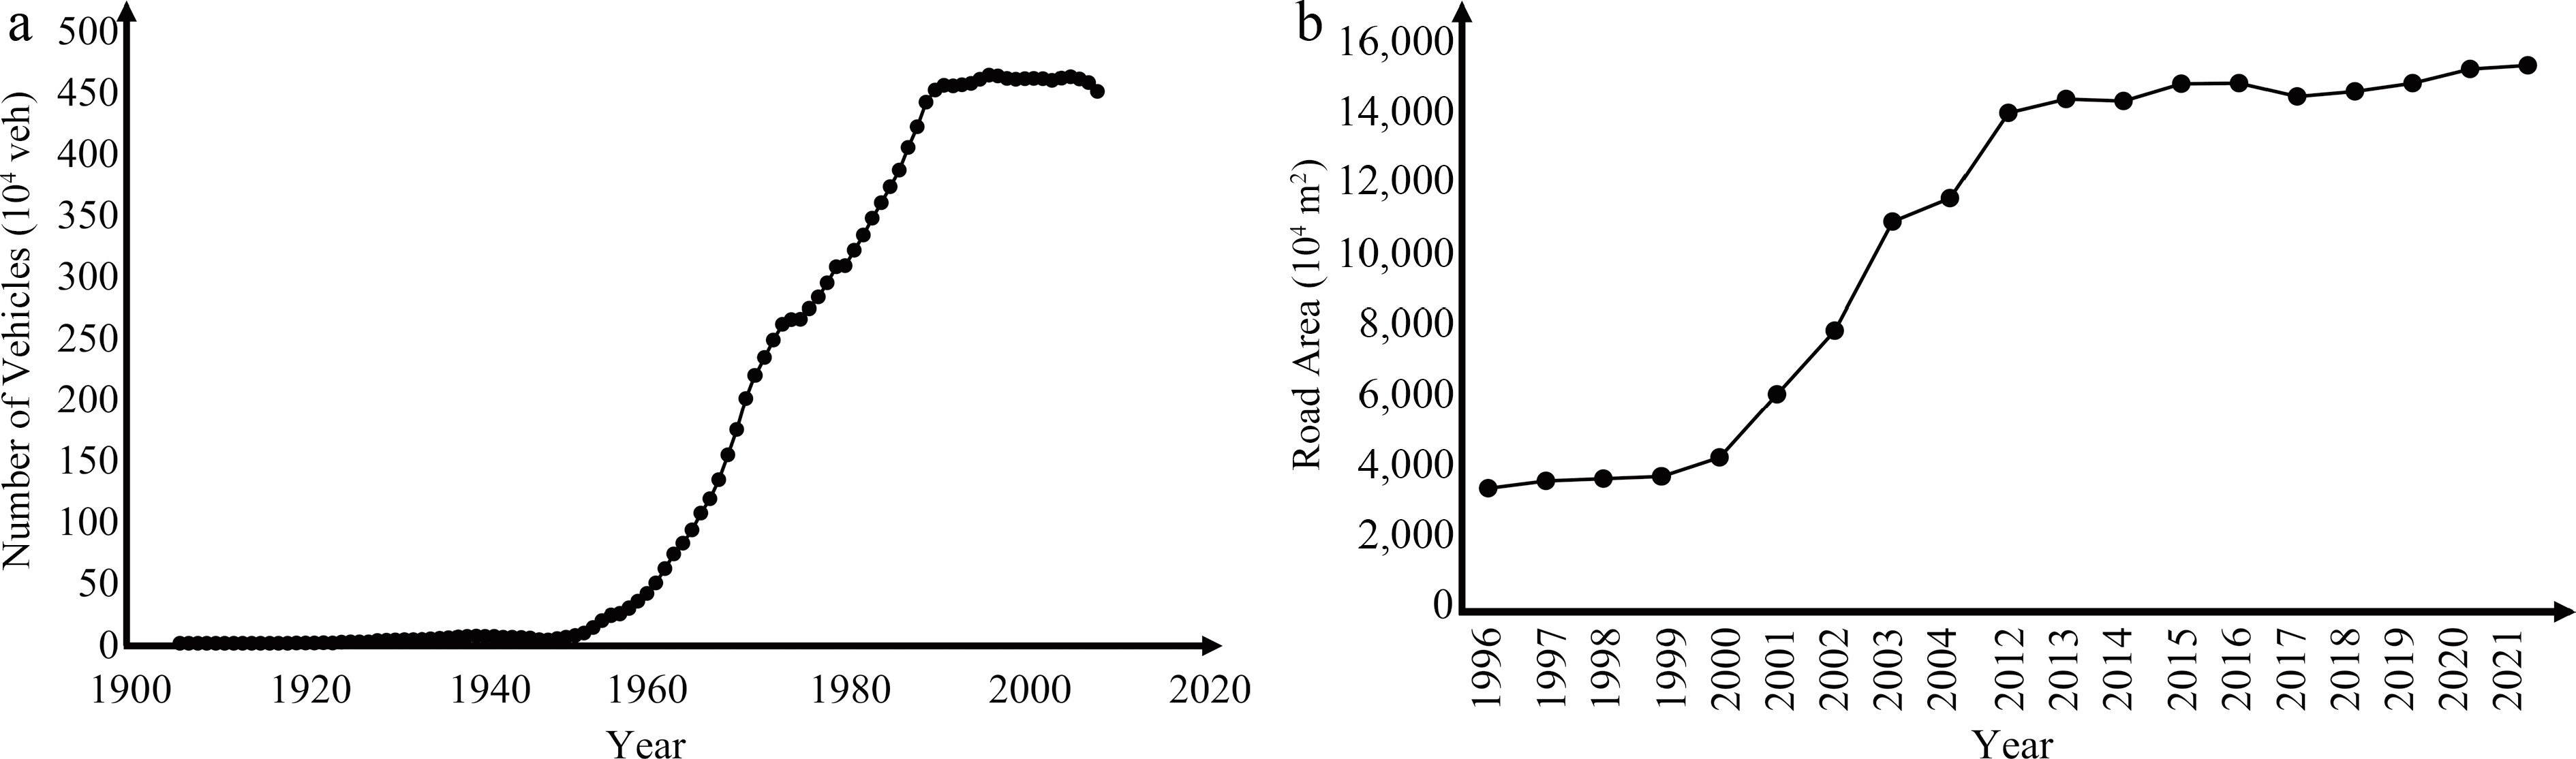
Figure 1.
Examples of annual change of vehicle population in Tokyo, Japan (1906−2008) and road network area in Beijing, China (1996−2021). (a) Vehicle population. (b) Road network area.
-
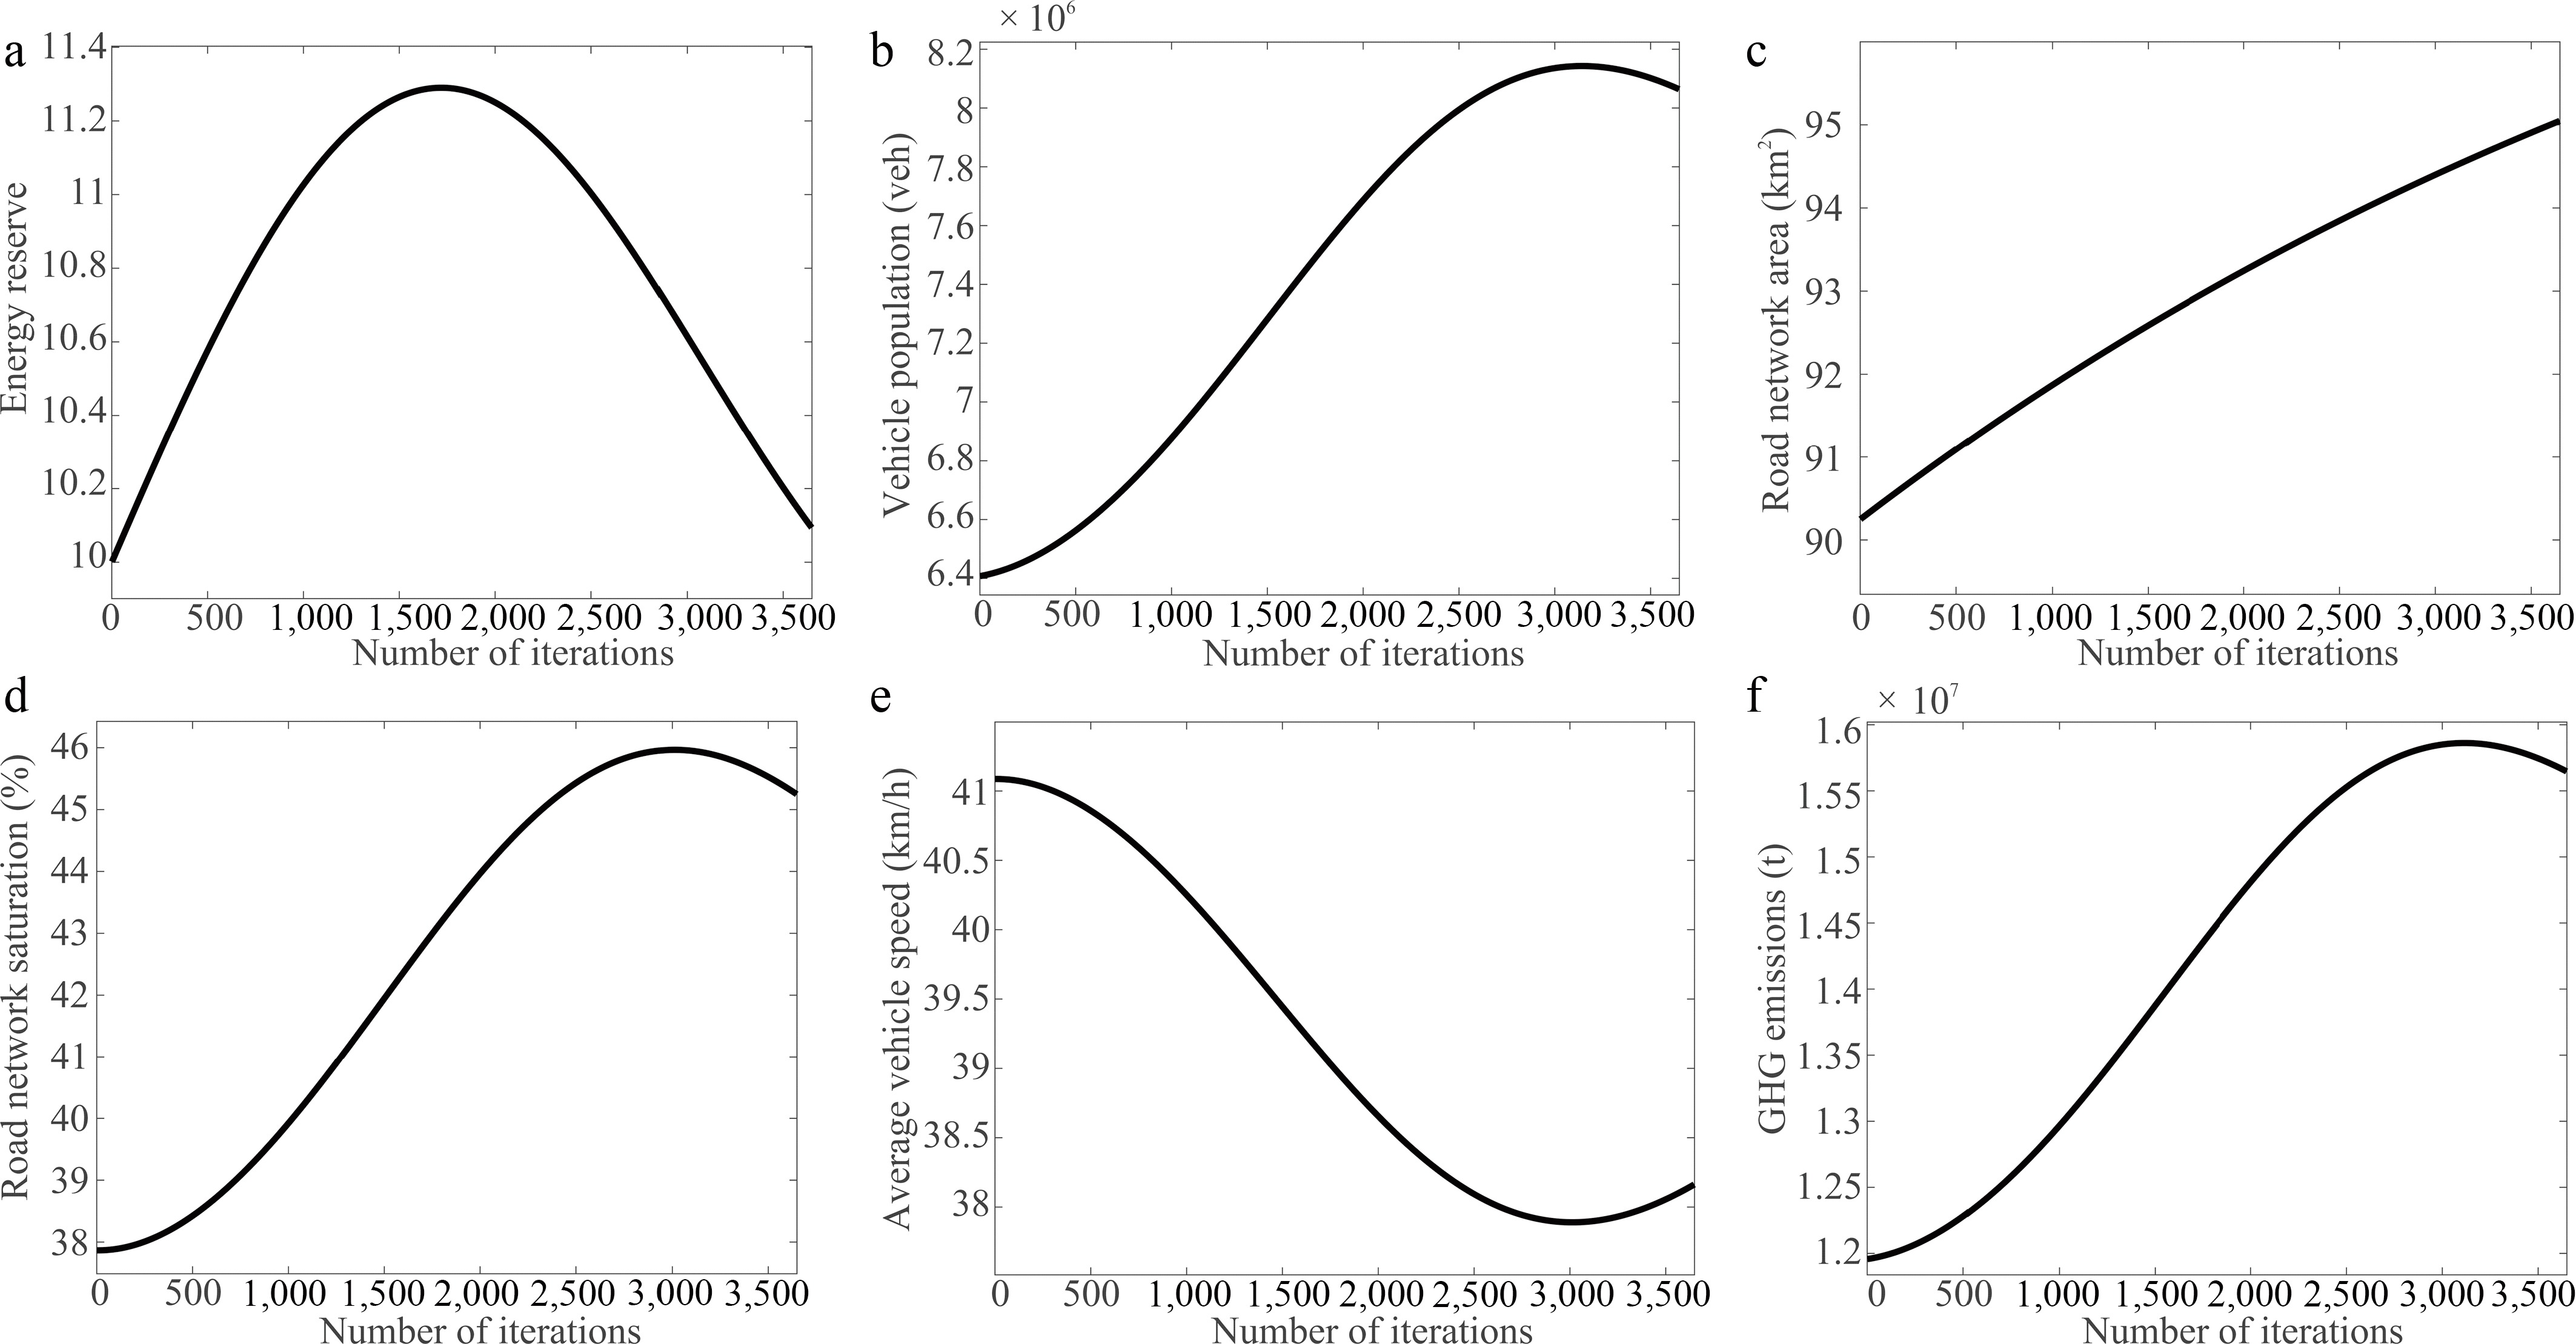
Figure 2.
Dynamic evolution process of urban traffic system during 2020−2029. (a) Energy reserve. (b) Vehicle population. (c) Road network area. (d) Road network saturation. (e) Average vehicle speed. (f) GHG emissions.
-
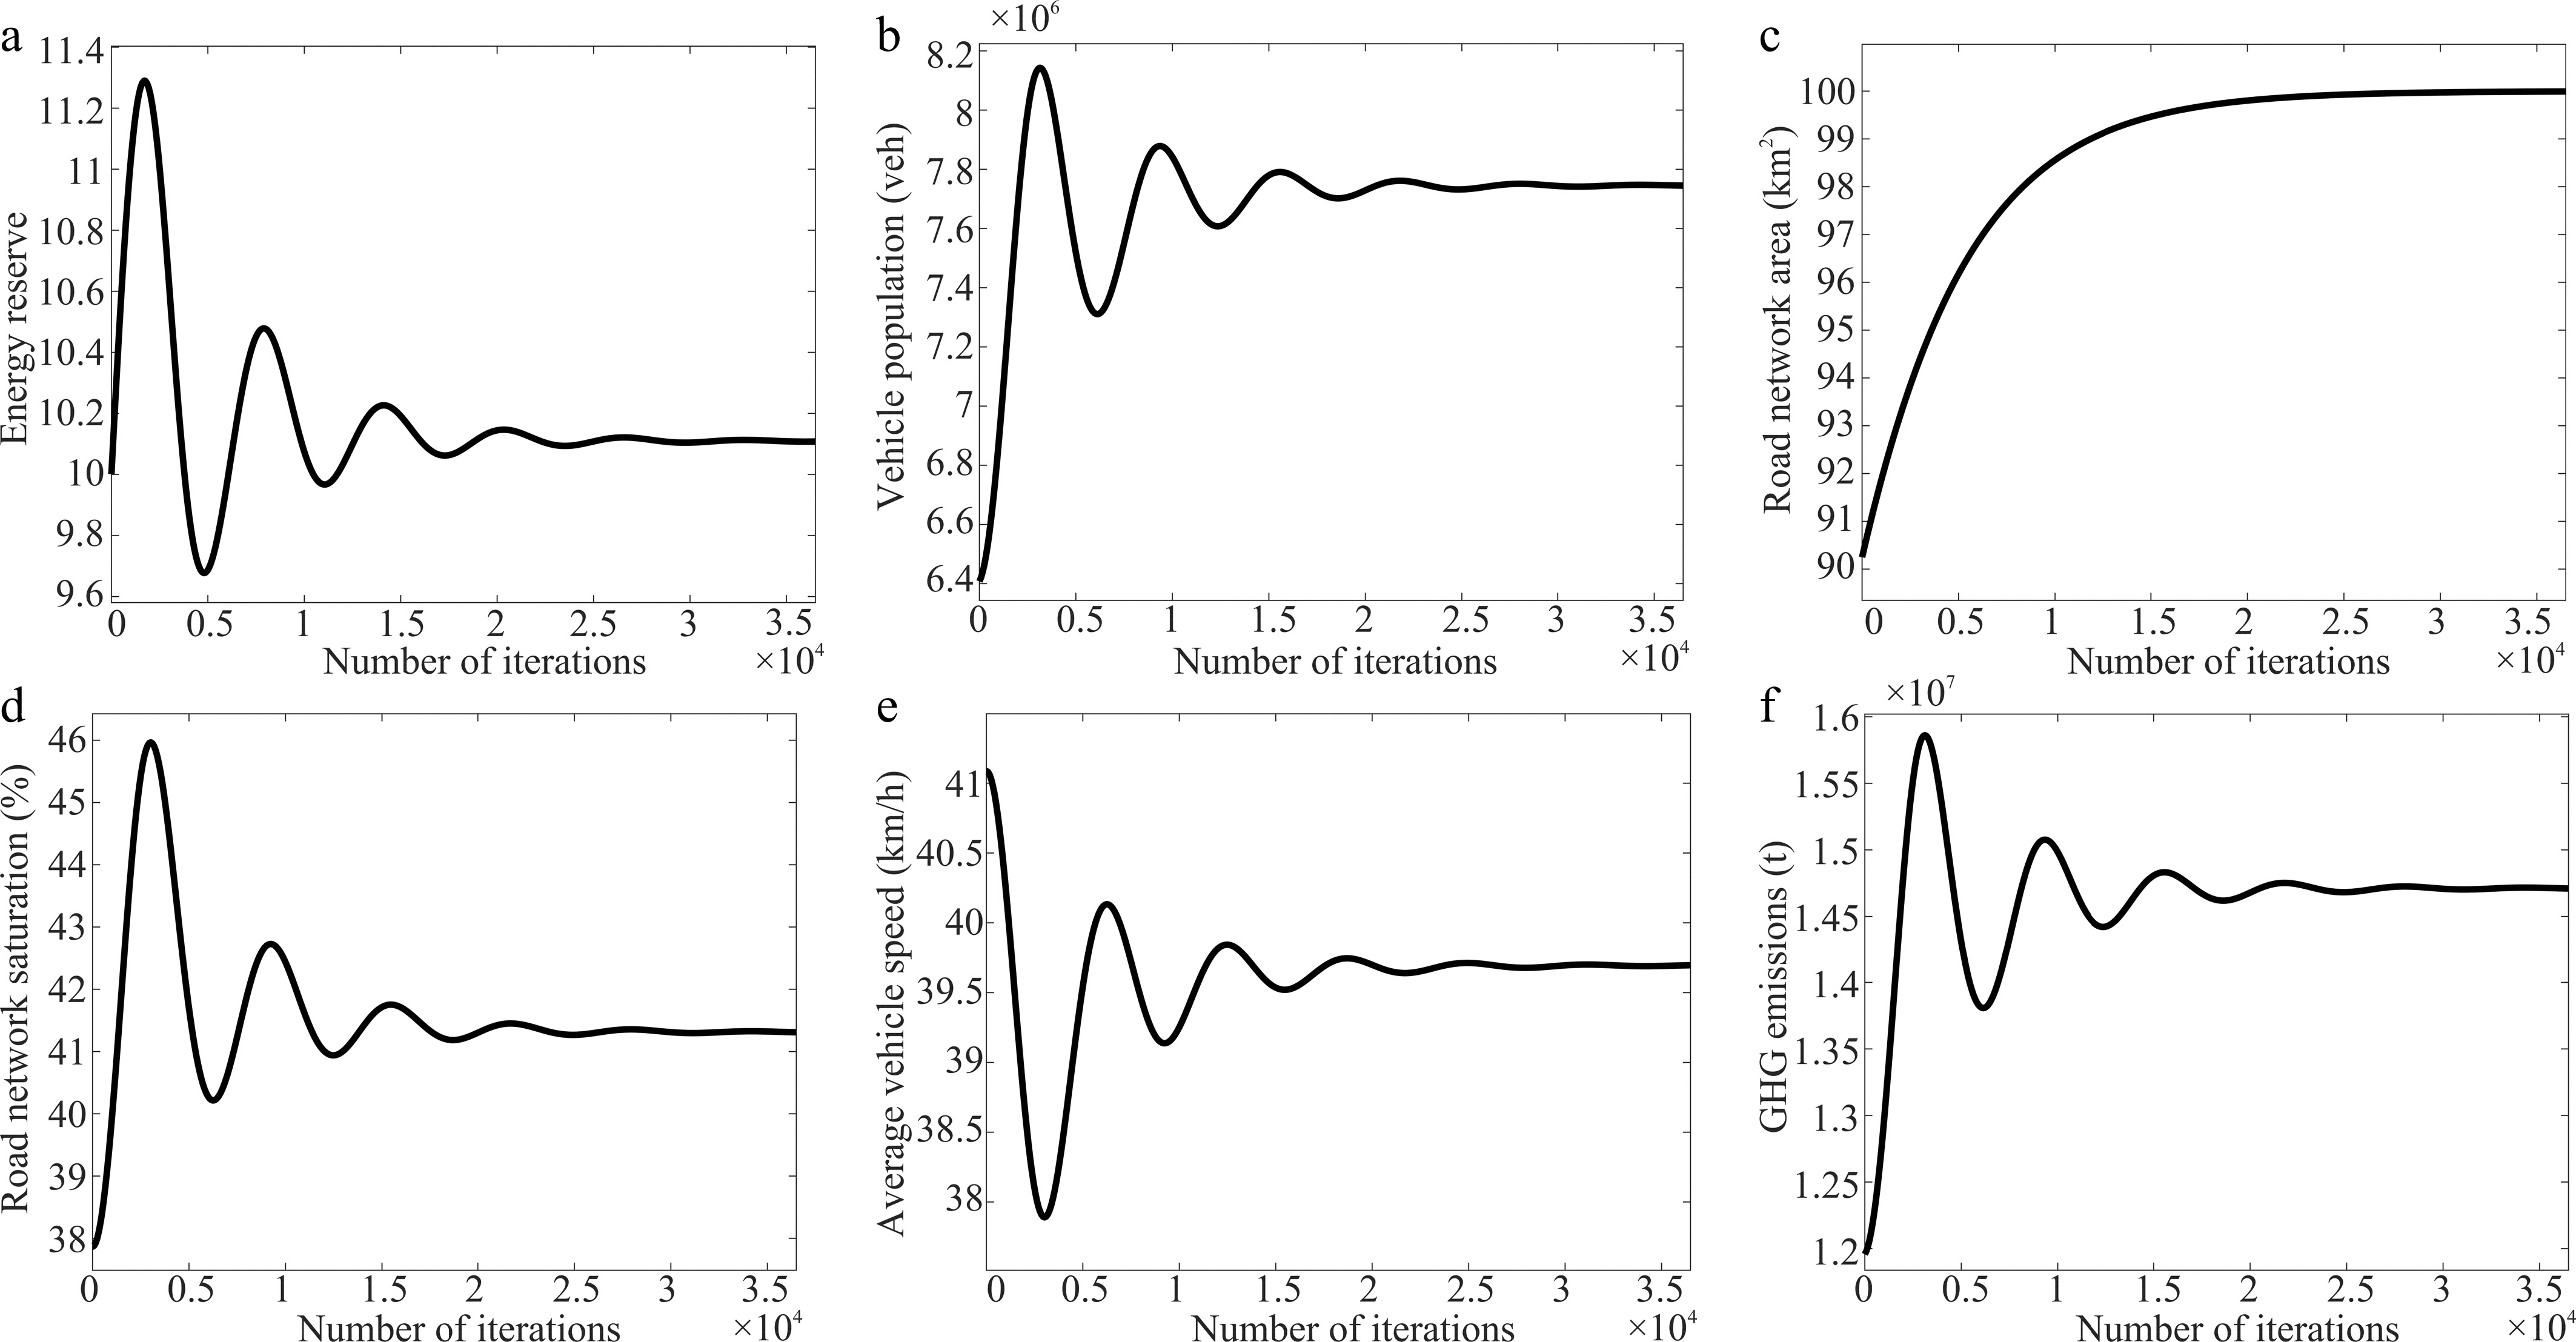
Figure 3.
Dynamic evolution process of urban traffic system until it is stable. (a) Energy reserve. (b) Vehicle population. (c) Road network area. (d) Road network saturation. (e) Average vehicle speed. (f) GHG emissions.
-
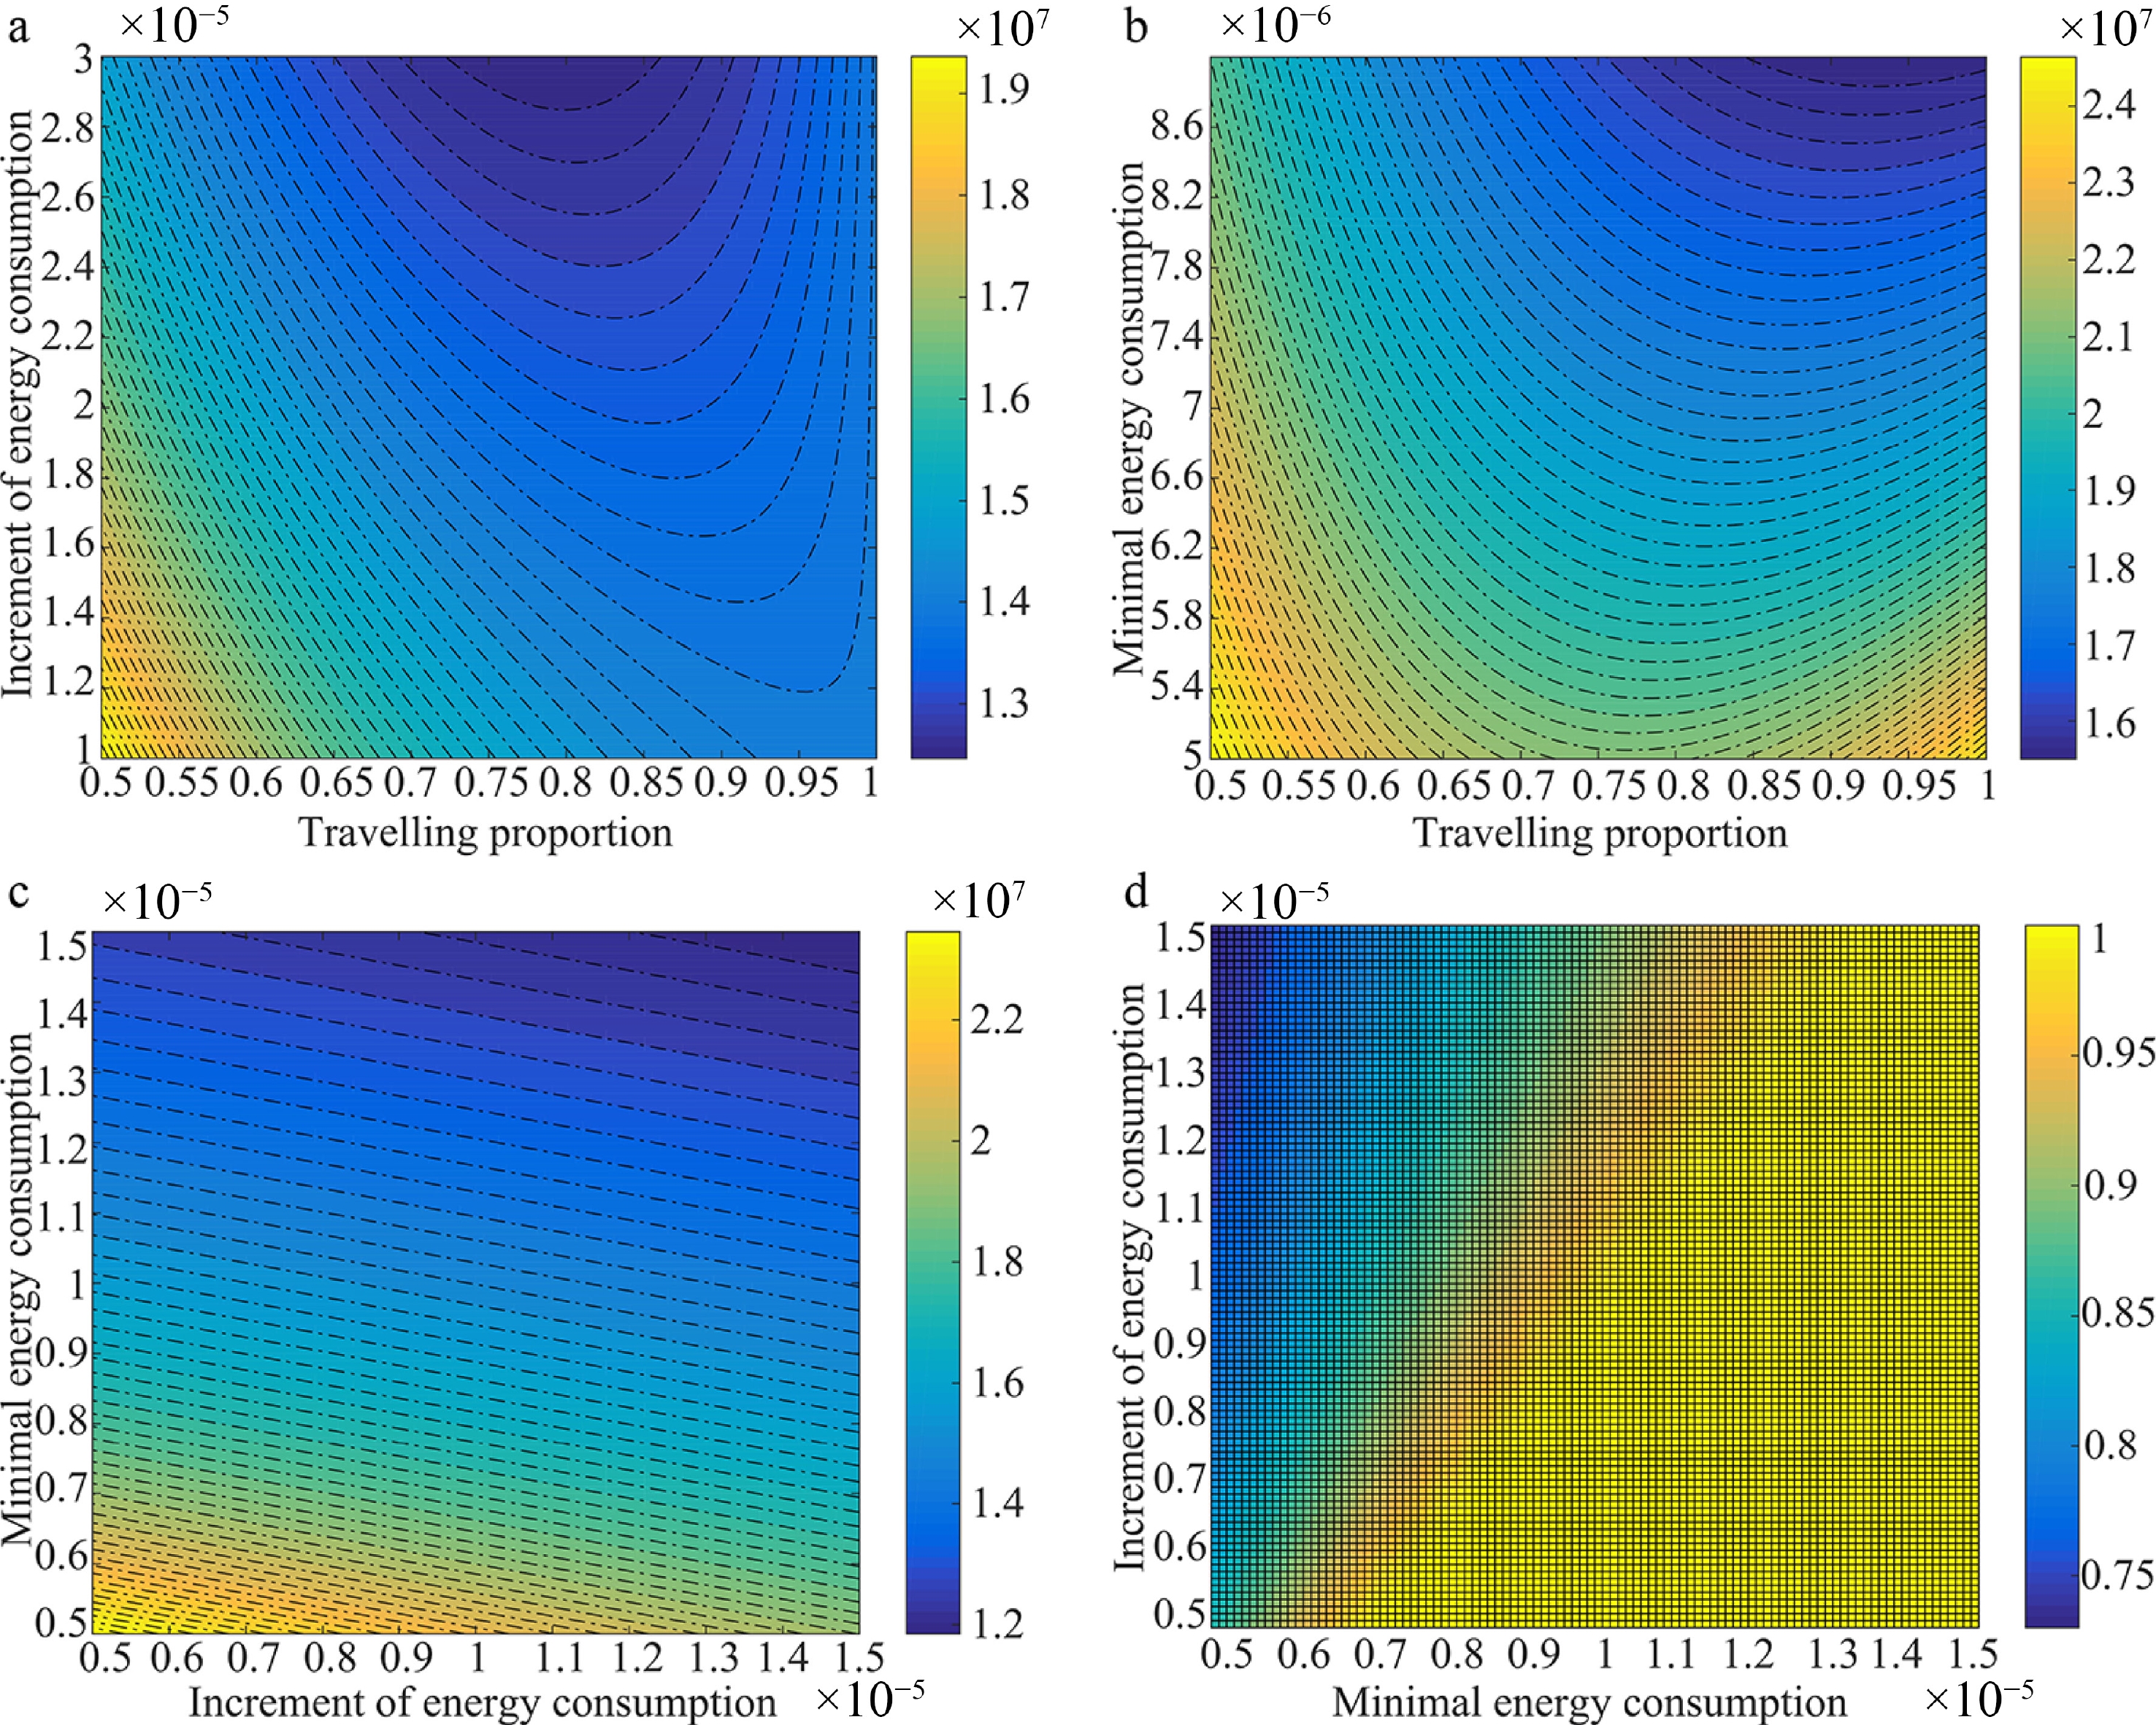
Figure 4.
The relationship among GHG emissions, authorized vehicle proportion θ, average increment energy consumption a1, and minimal energy consumption a2. (a) GHG emissions under different θ and a1. (b) GHG emissions under different θ and a2. (c) GHG emissions under different a1 and a2. (d) θ* under different a1 and a2
-
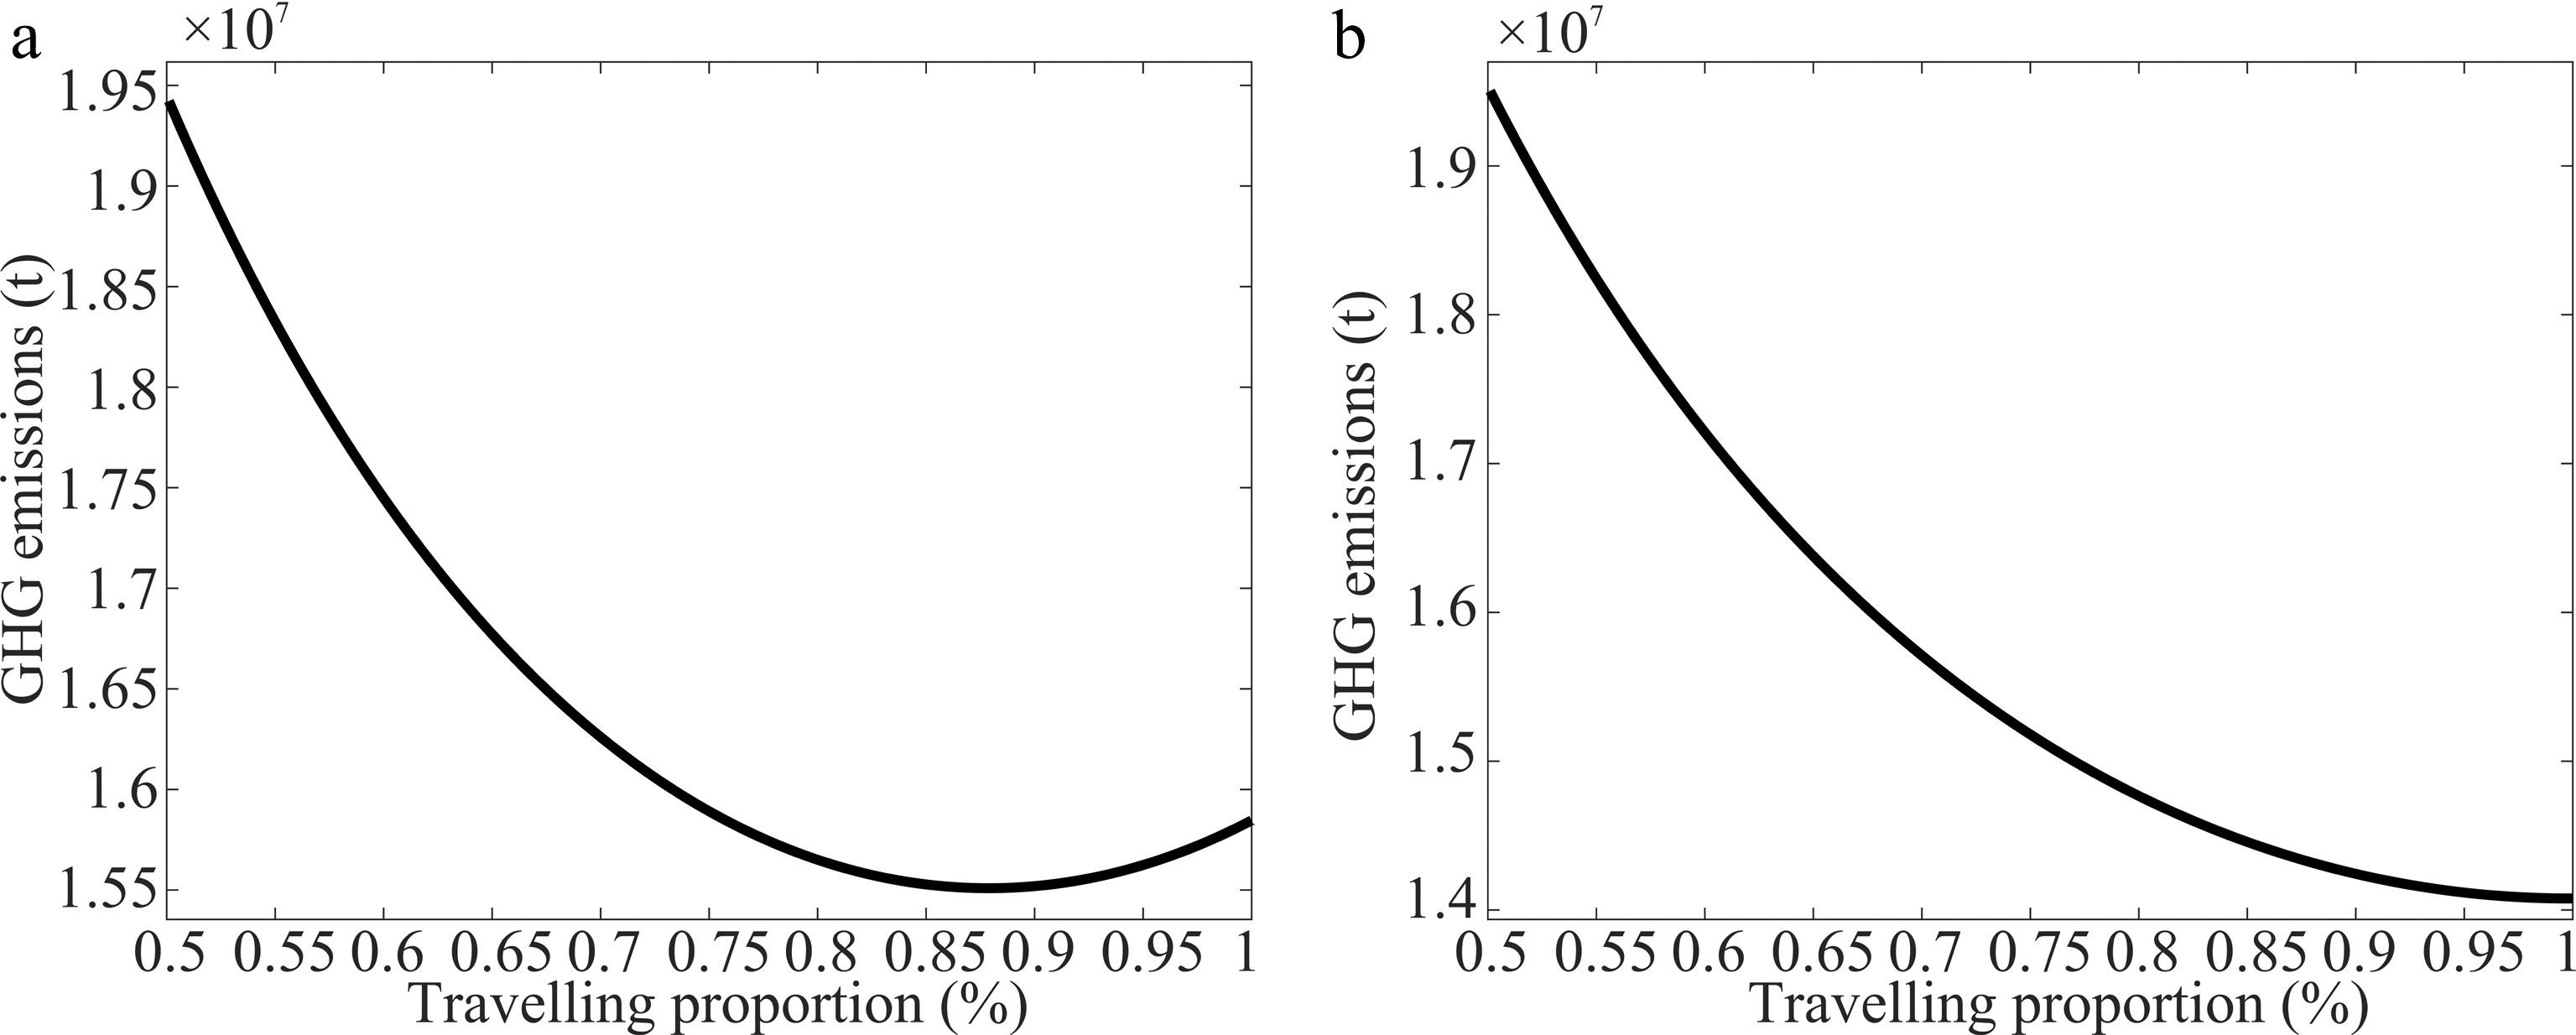
Figure 5.
GHG emissions in the future under different authorized vehicle proportions θ. (a) At 10 years later. (b) At 40 years later.
-
Parameters/
variablesMeanings Values Tmax Maximum cycle number 3,650−36,500 r1 Energy growth rate 0.005 r2 Vehicle scrapping rate 0.0007 r3 Growth rate of road network area 0.0002 a1 Average increment of energy consumption per vehicle 1 × 10⁻⁵, 2.5 × 10⁻⁴ a2 Minimal energy consumption per vehicle 1 × 10⁻⁷, 1.5 × 10⁻⁵ b Conversion coefficient 15 b0 Coefficient of function of GHG emission factor 7.613534994965560 b1 Coefficient of function of GHG emission factor −0.138565467462594 b2 Coefficient of function of GHG emission factor 0.003915102063854 b3 Coefficient of function of GHG emission factor −0.000049451361017 b4 Coefficient of function of GHG emission factor 0.000000238630156 c Increment coefficient 0.15 d Decrement coefficient area 0.00001 e Parking impact coefficient 0.0001 K Maximal land area for building road network 100 m Detour coefficient 1 n Loading coefficient 0.63 x0 Initial value of energy reserve 10 y0 Initial value of vehicle population 640.7474 × 10⁴ veh z0 Initial value of road network area 90.24696 km2 $ \theta $ Authorized vehicle proportion [0.5, 1] $ \Delta \theta $ Calculation interval of $ \theta $ 0.001 $ \Delta {a}_{1} $ Calculation interval of a1 1 × 10⁻⁷ $ \Delta {a}_{2} $ Calculation interval of a2 1 × 10⁻⁷ Table 1.
Numerical settings.
Figures
(5)
Tables
(1)