-
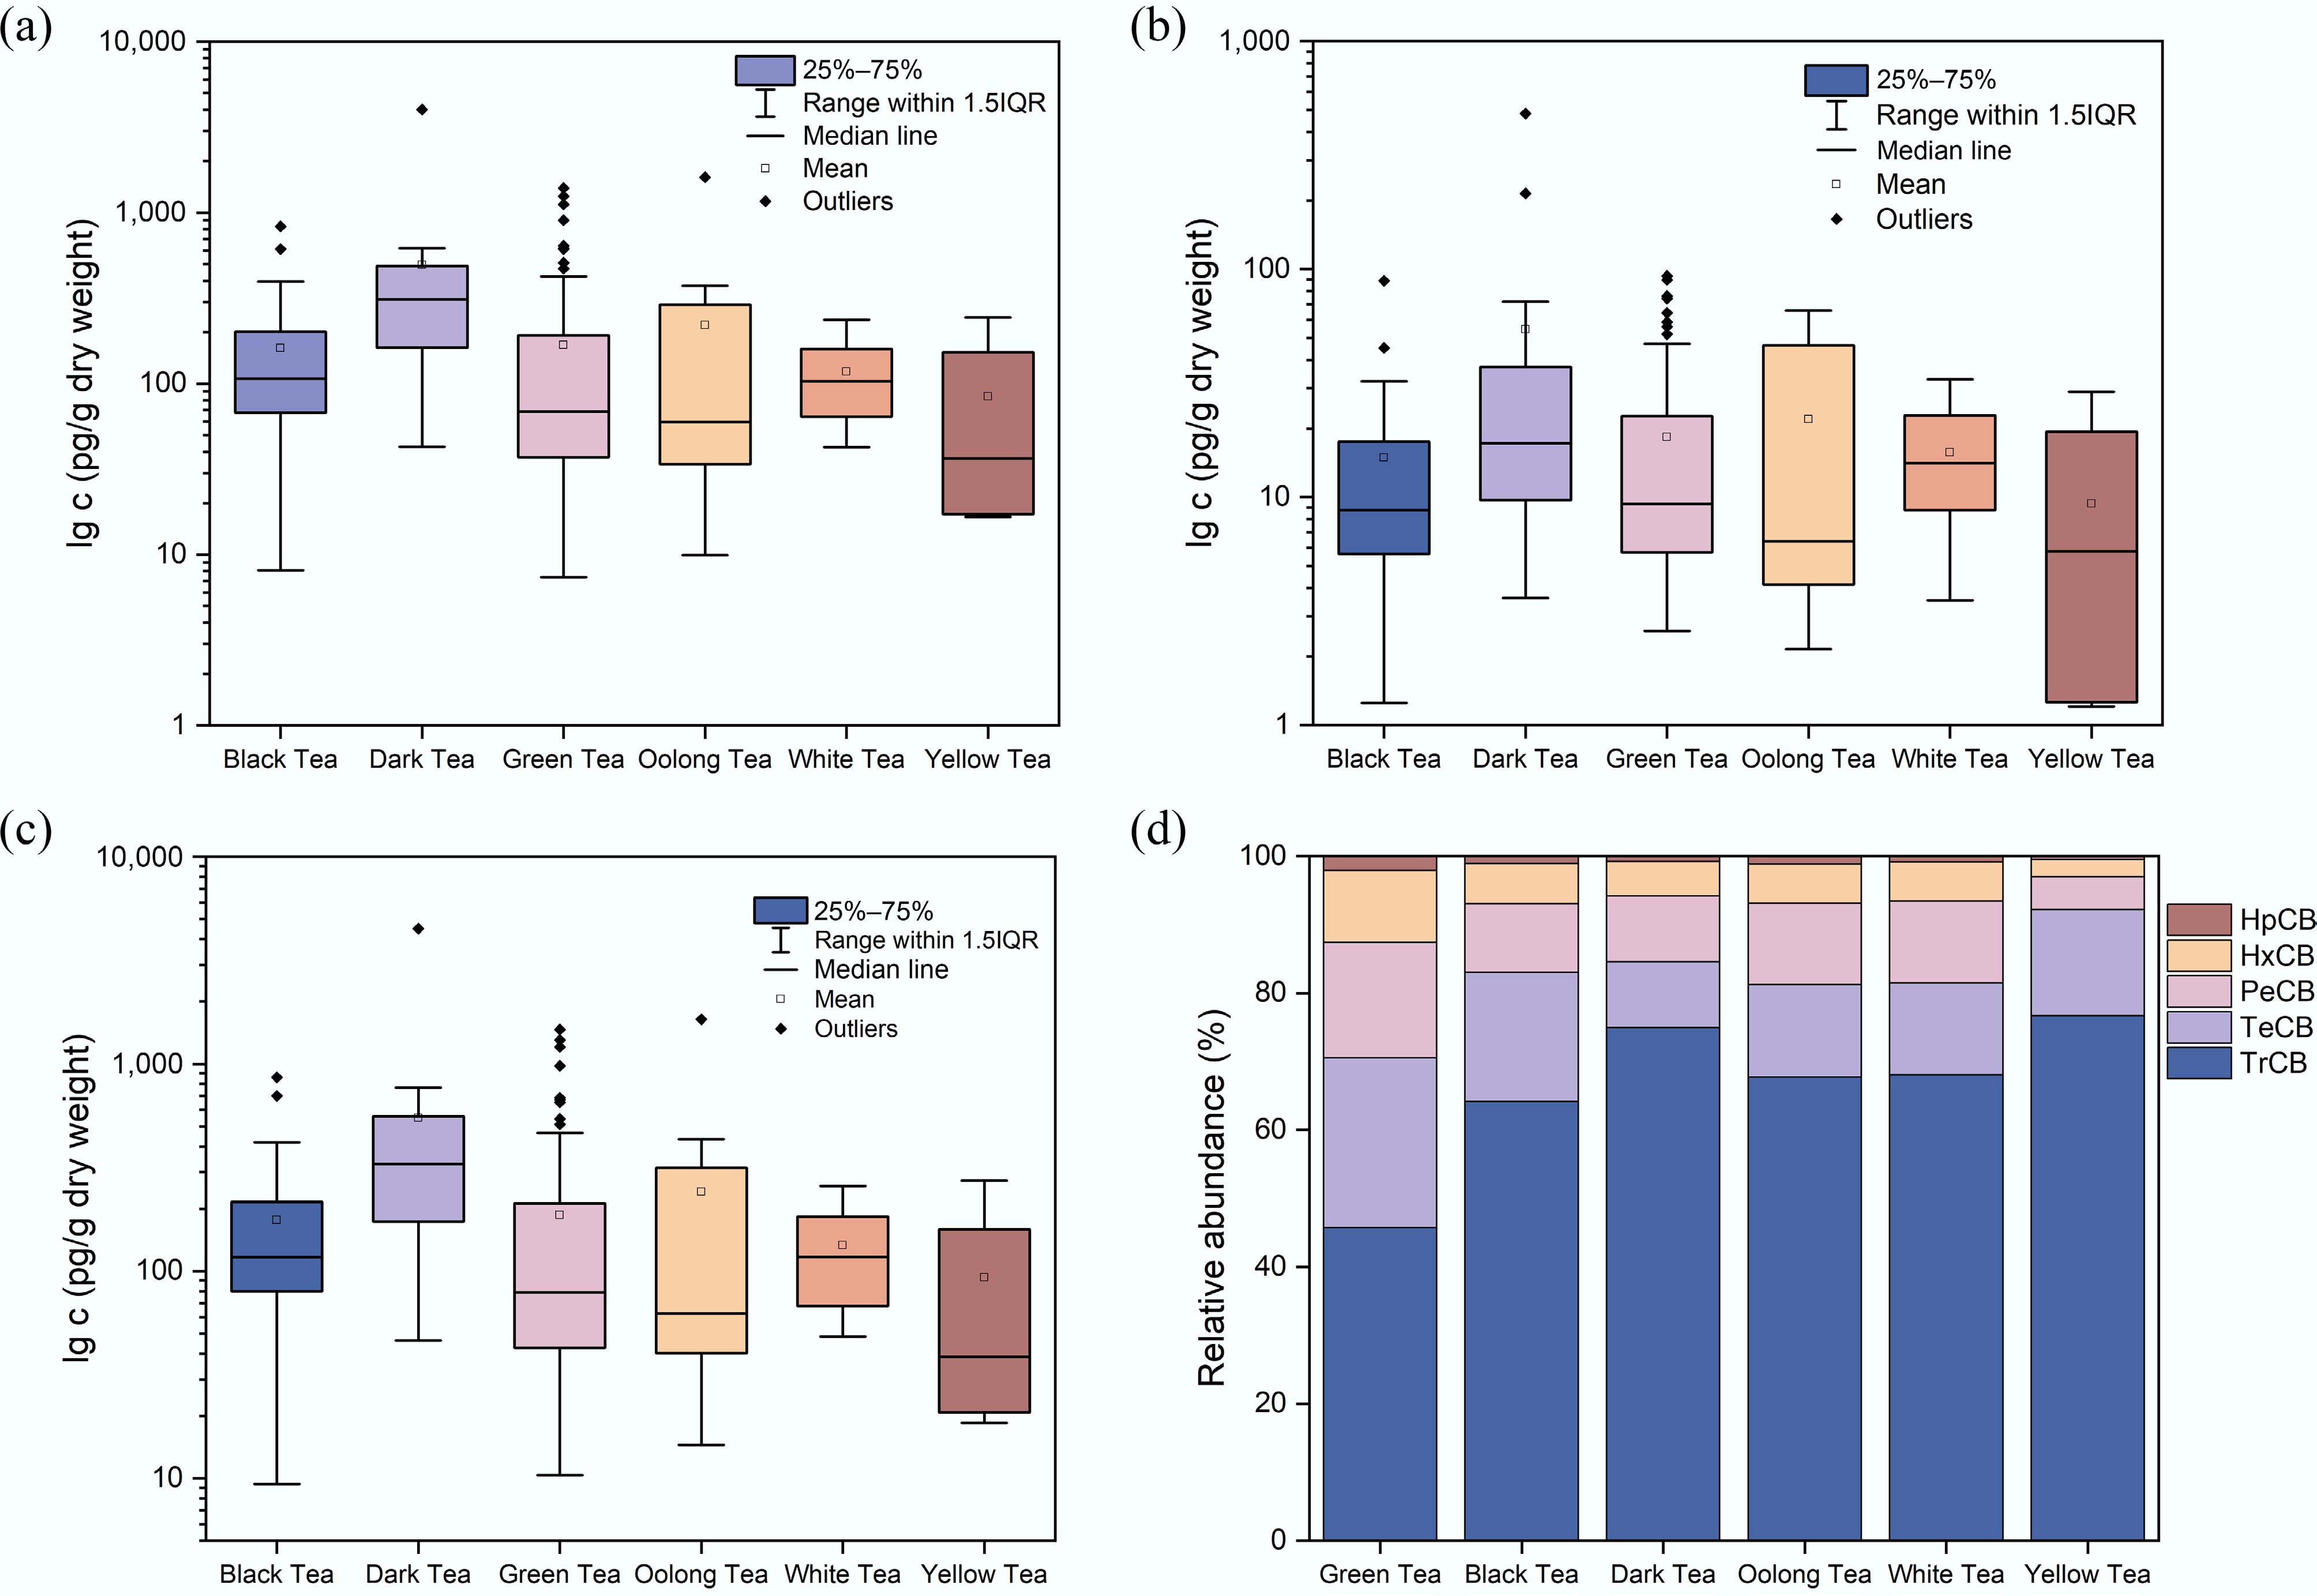
Figure 1.
Concentrations of (a) ∑6IN-PCBs, (b) ∑12DL-PCBs, (c) ∑18PCBs, and (d) relative abundance of PCBs in tea samples from six categories.
-
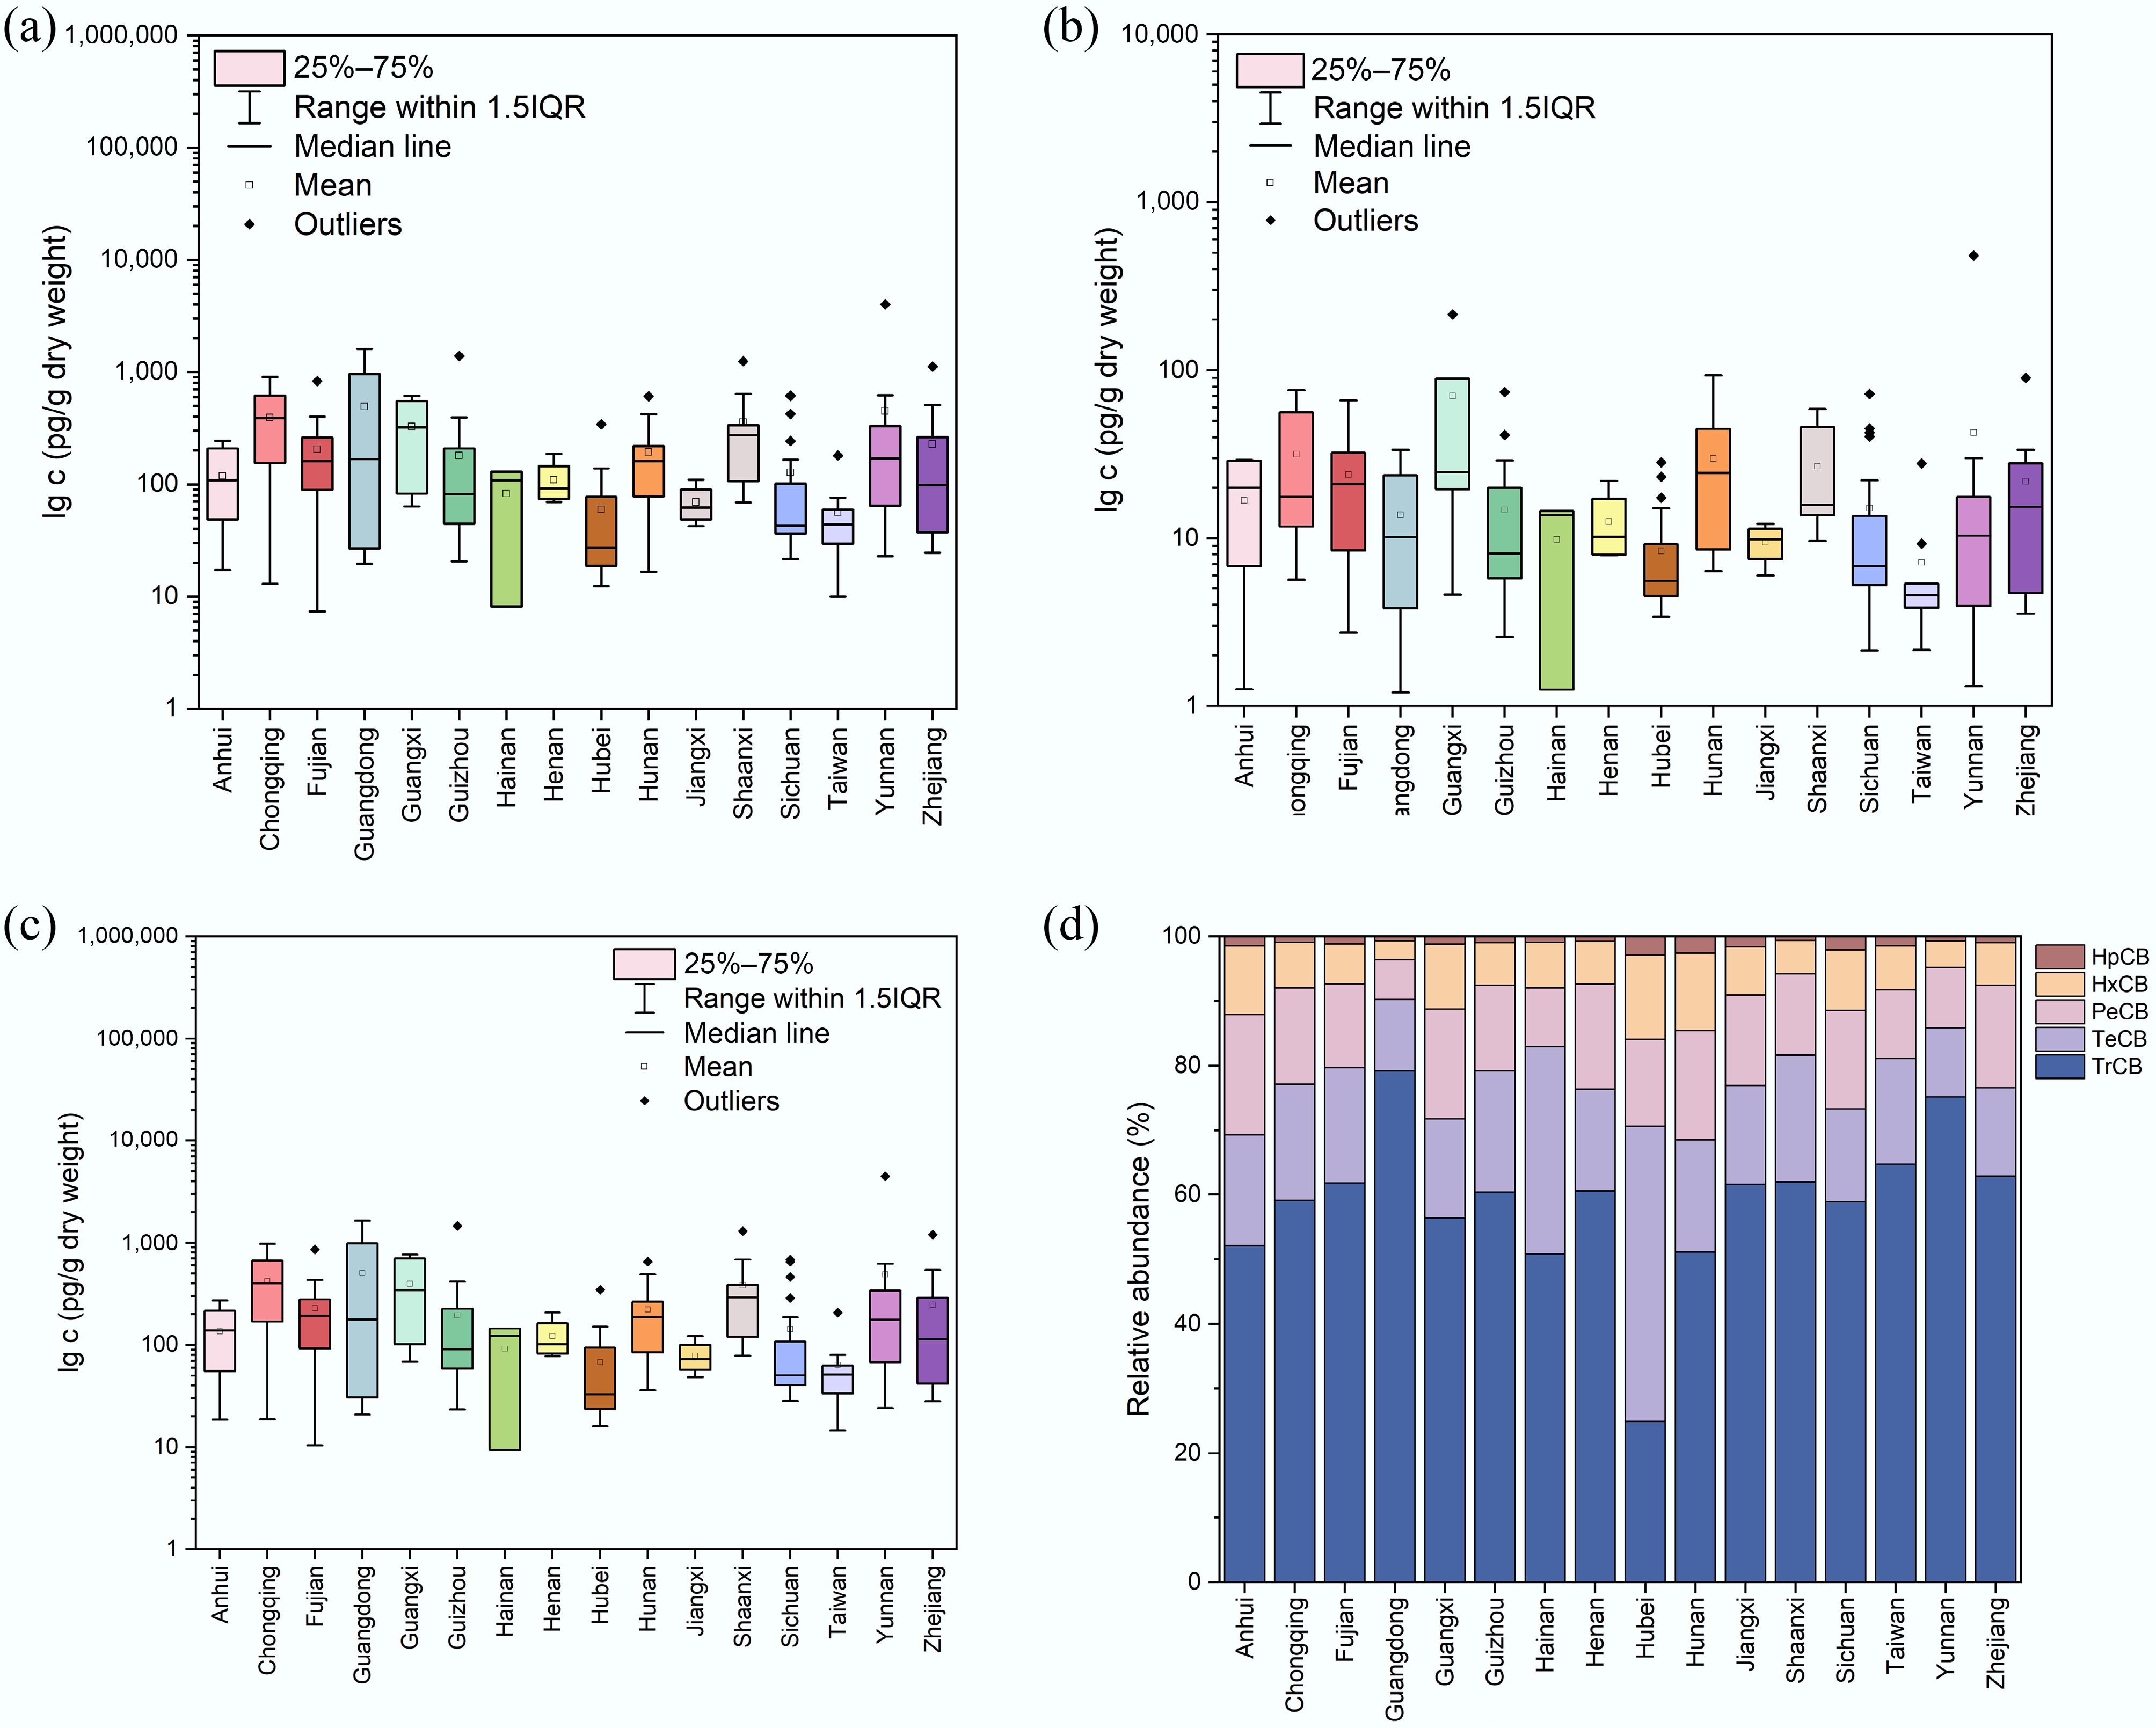
Figure 2.
Concentrations of (a) ∑6IN-PCBs, (b) ∑12DL-PCBs, (c) ∑18PCBs, and (d) relative abundance of PCBs in tea samples produced in 16 Chinese provinces.
-
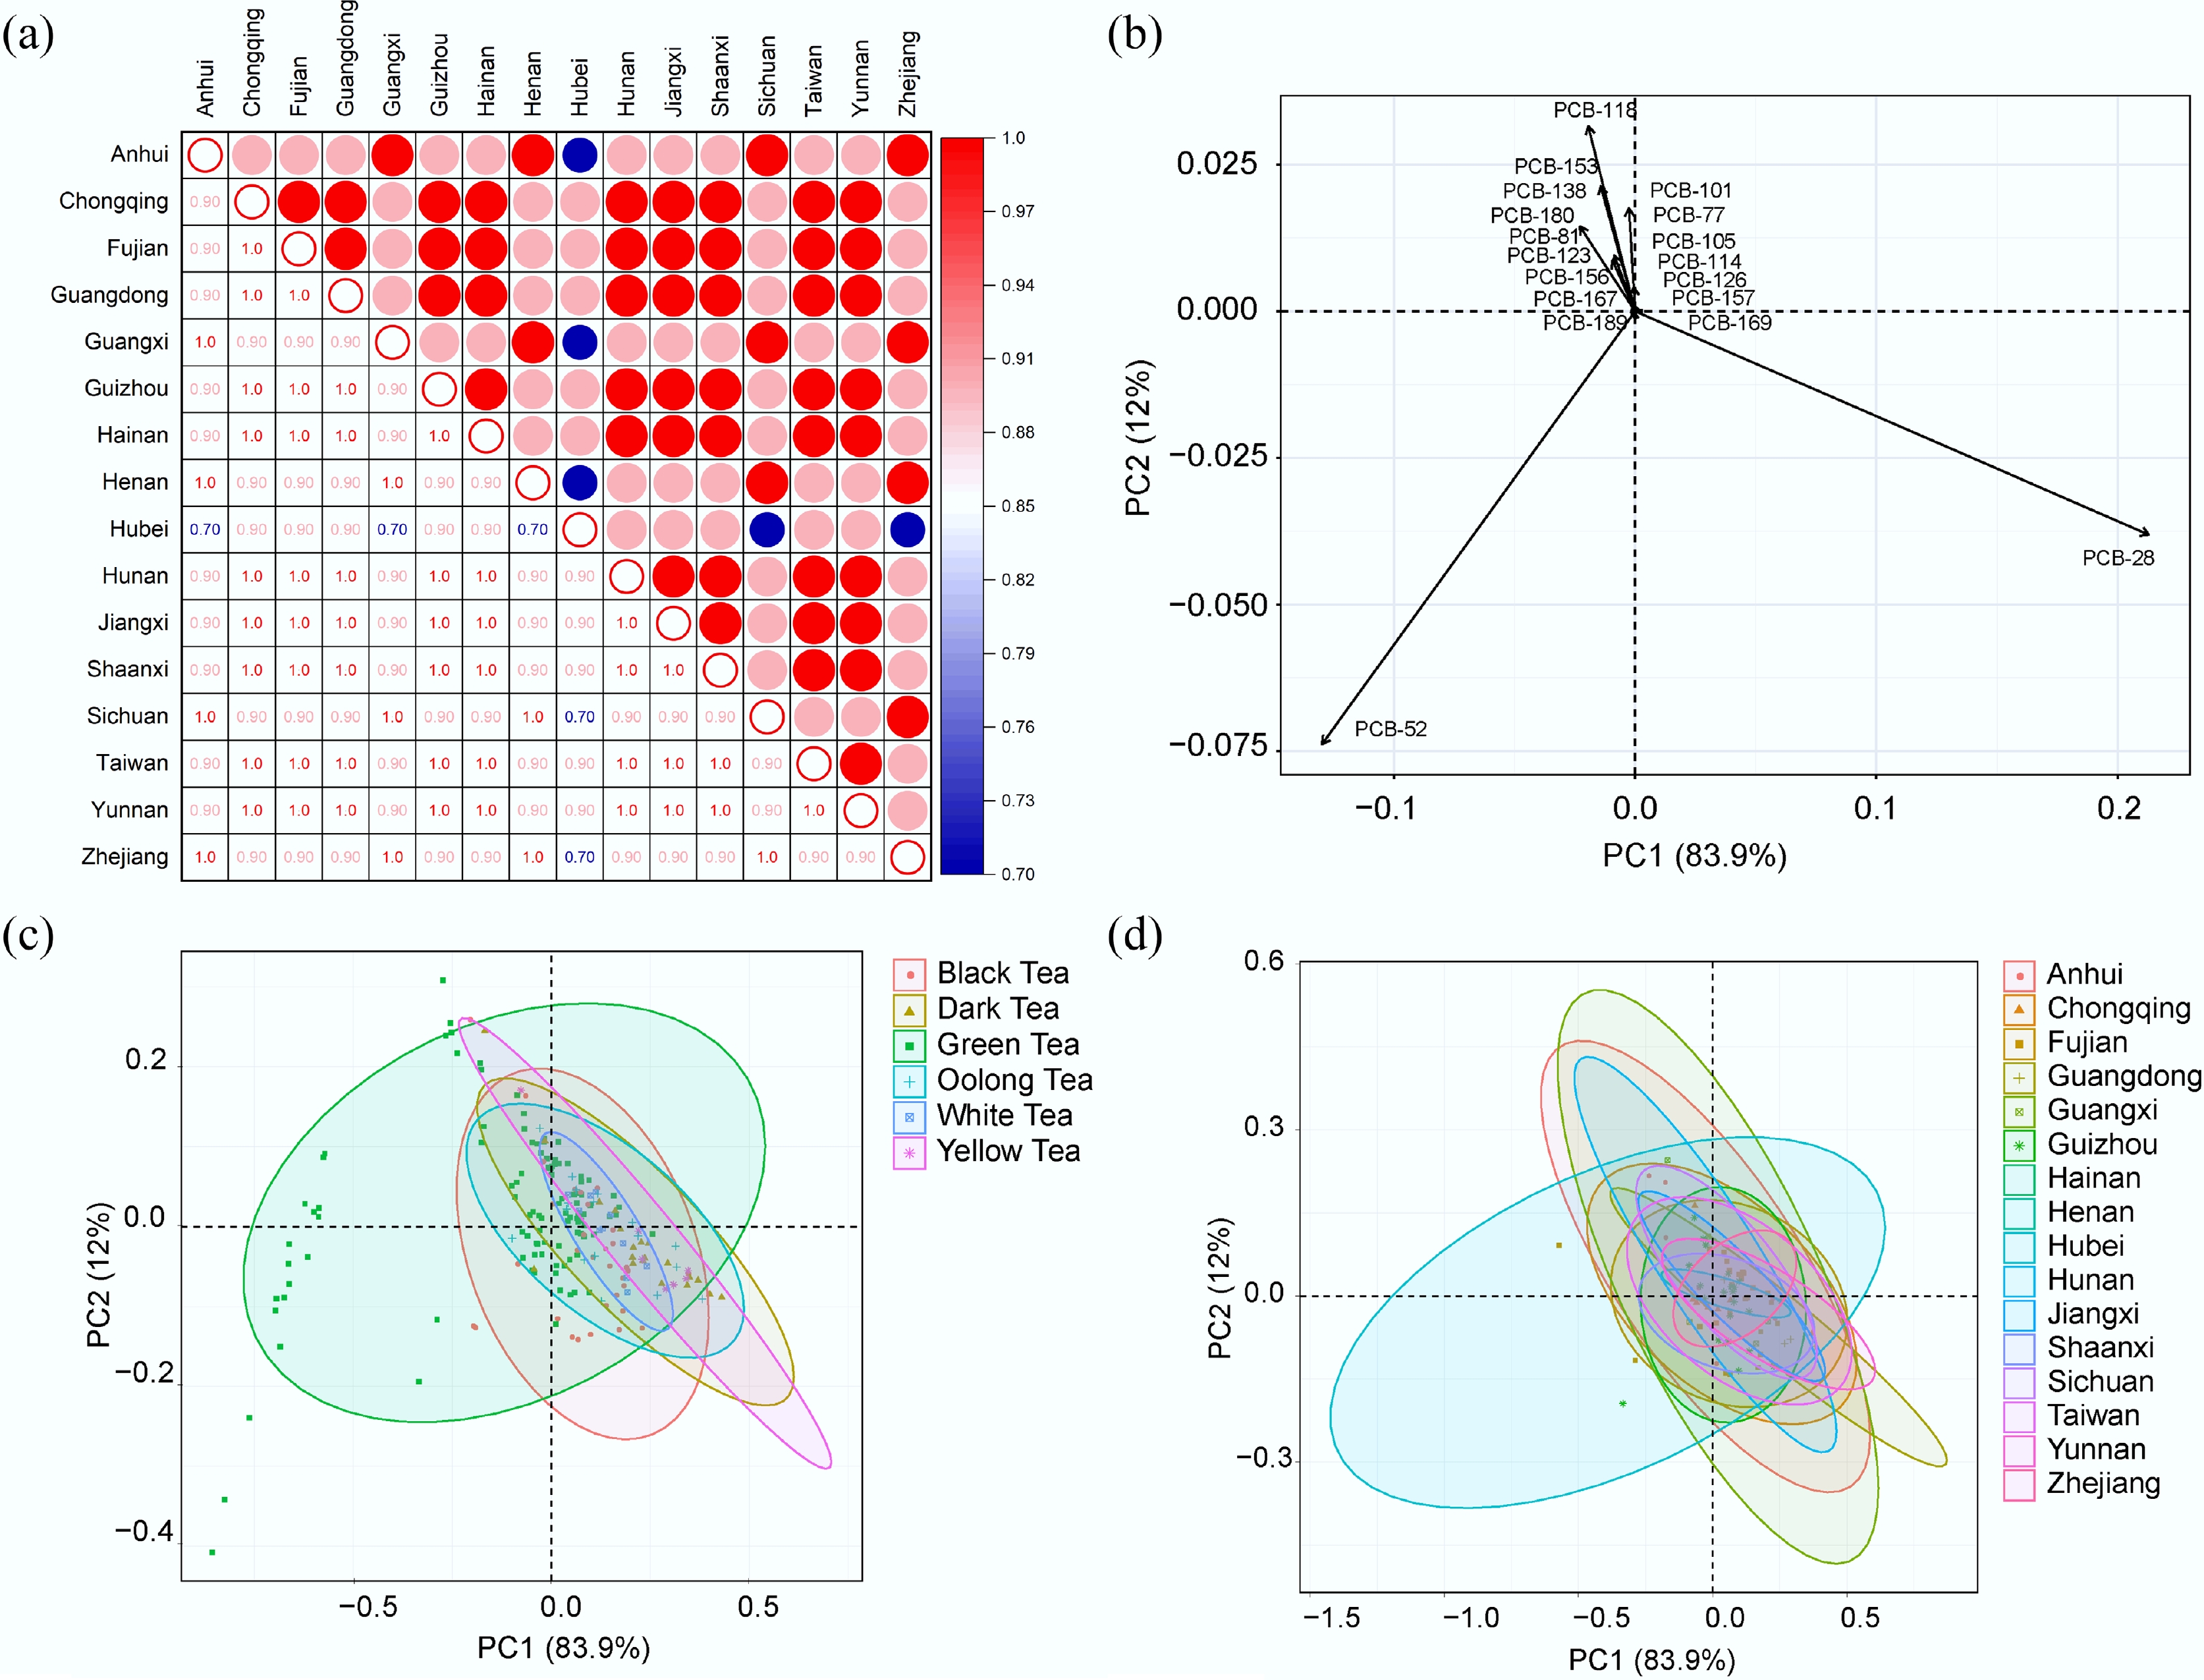
Figure 3.
(a) The correlations of the homologous distribution of ∑18PCBs among 16 provinces. (b) The loading plot of the principal component analysis; confidence ellipses for (c) six categories of tea samples and (d) tea samples produced from 16 Chinese provinces.
-
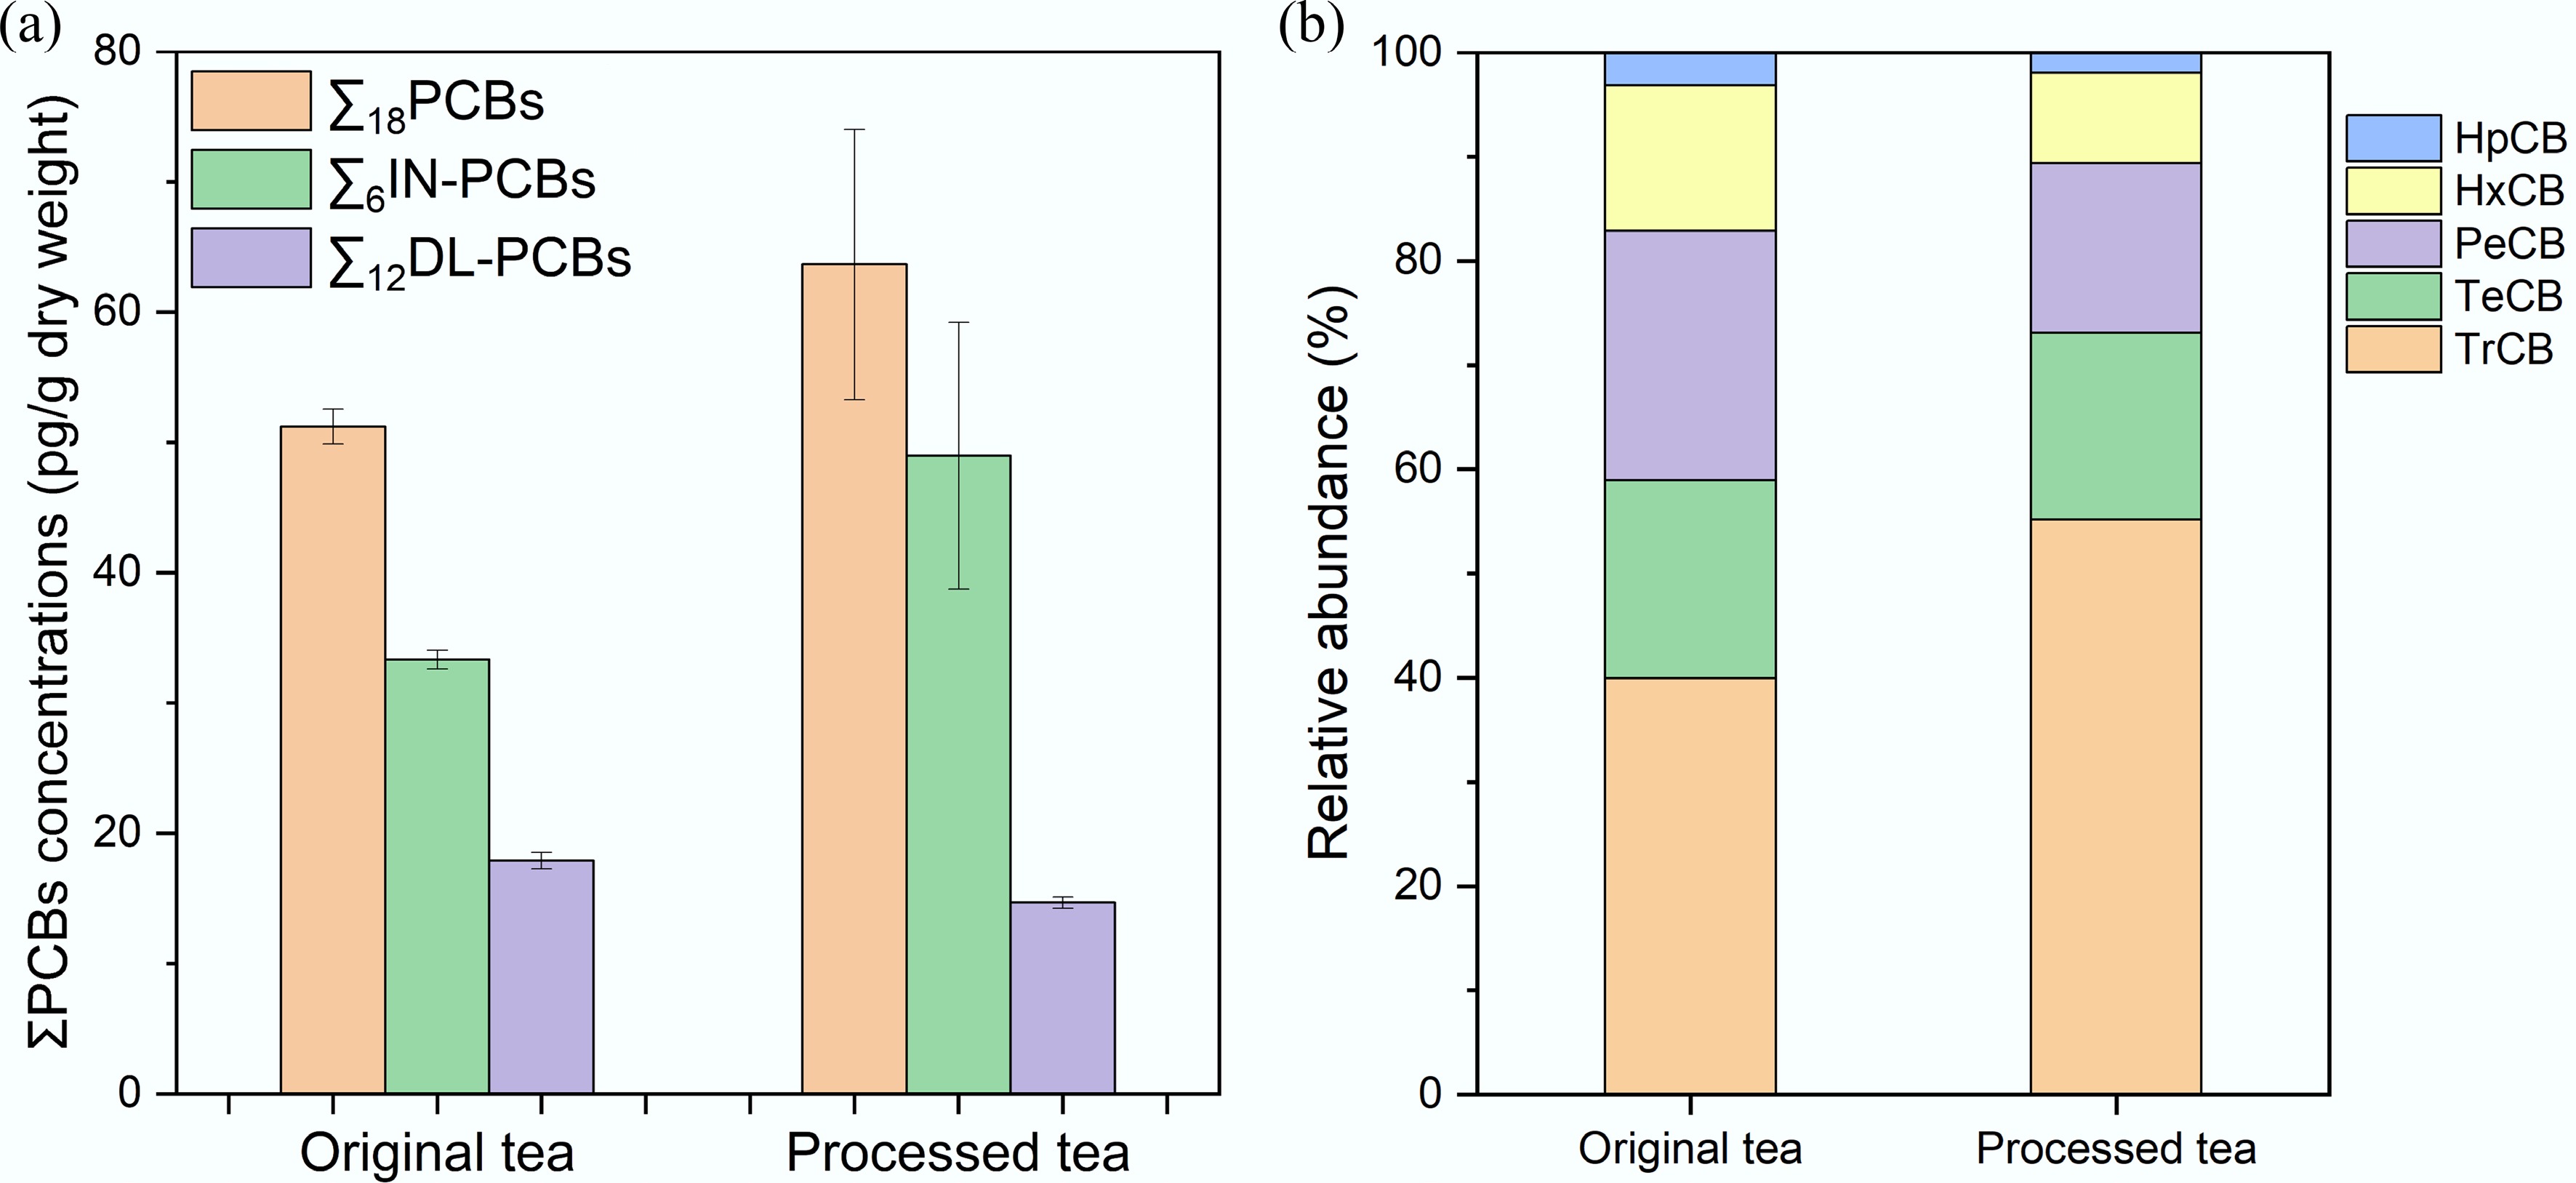
Figure 4.
(a) Concentrations and (b) relative abundance of PCBs in the original and processed tea samples.
-
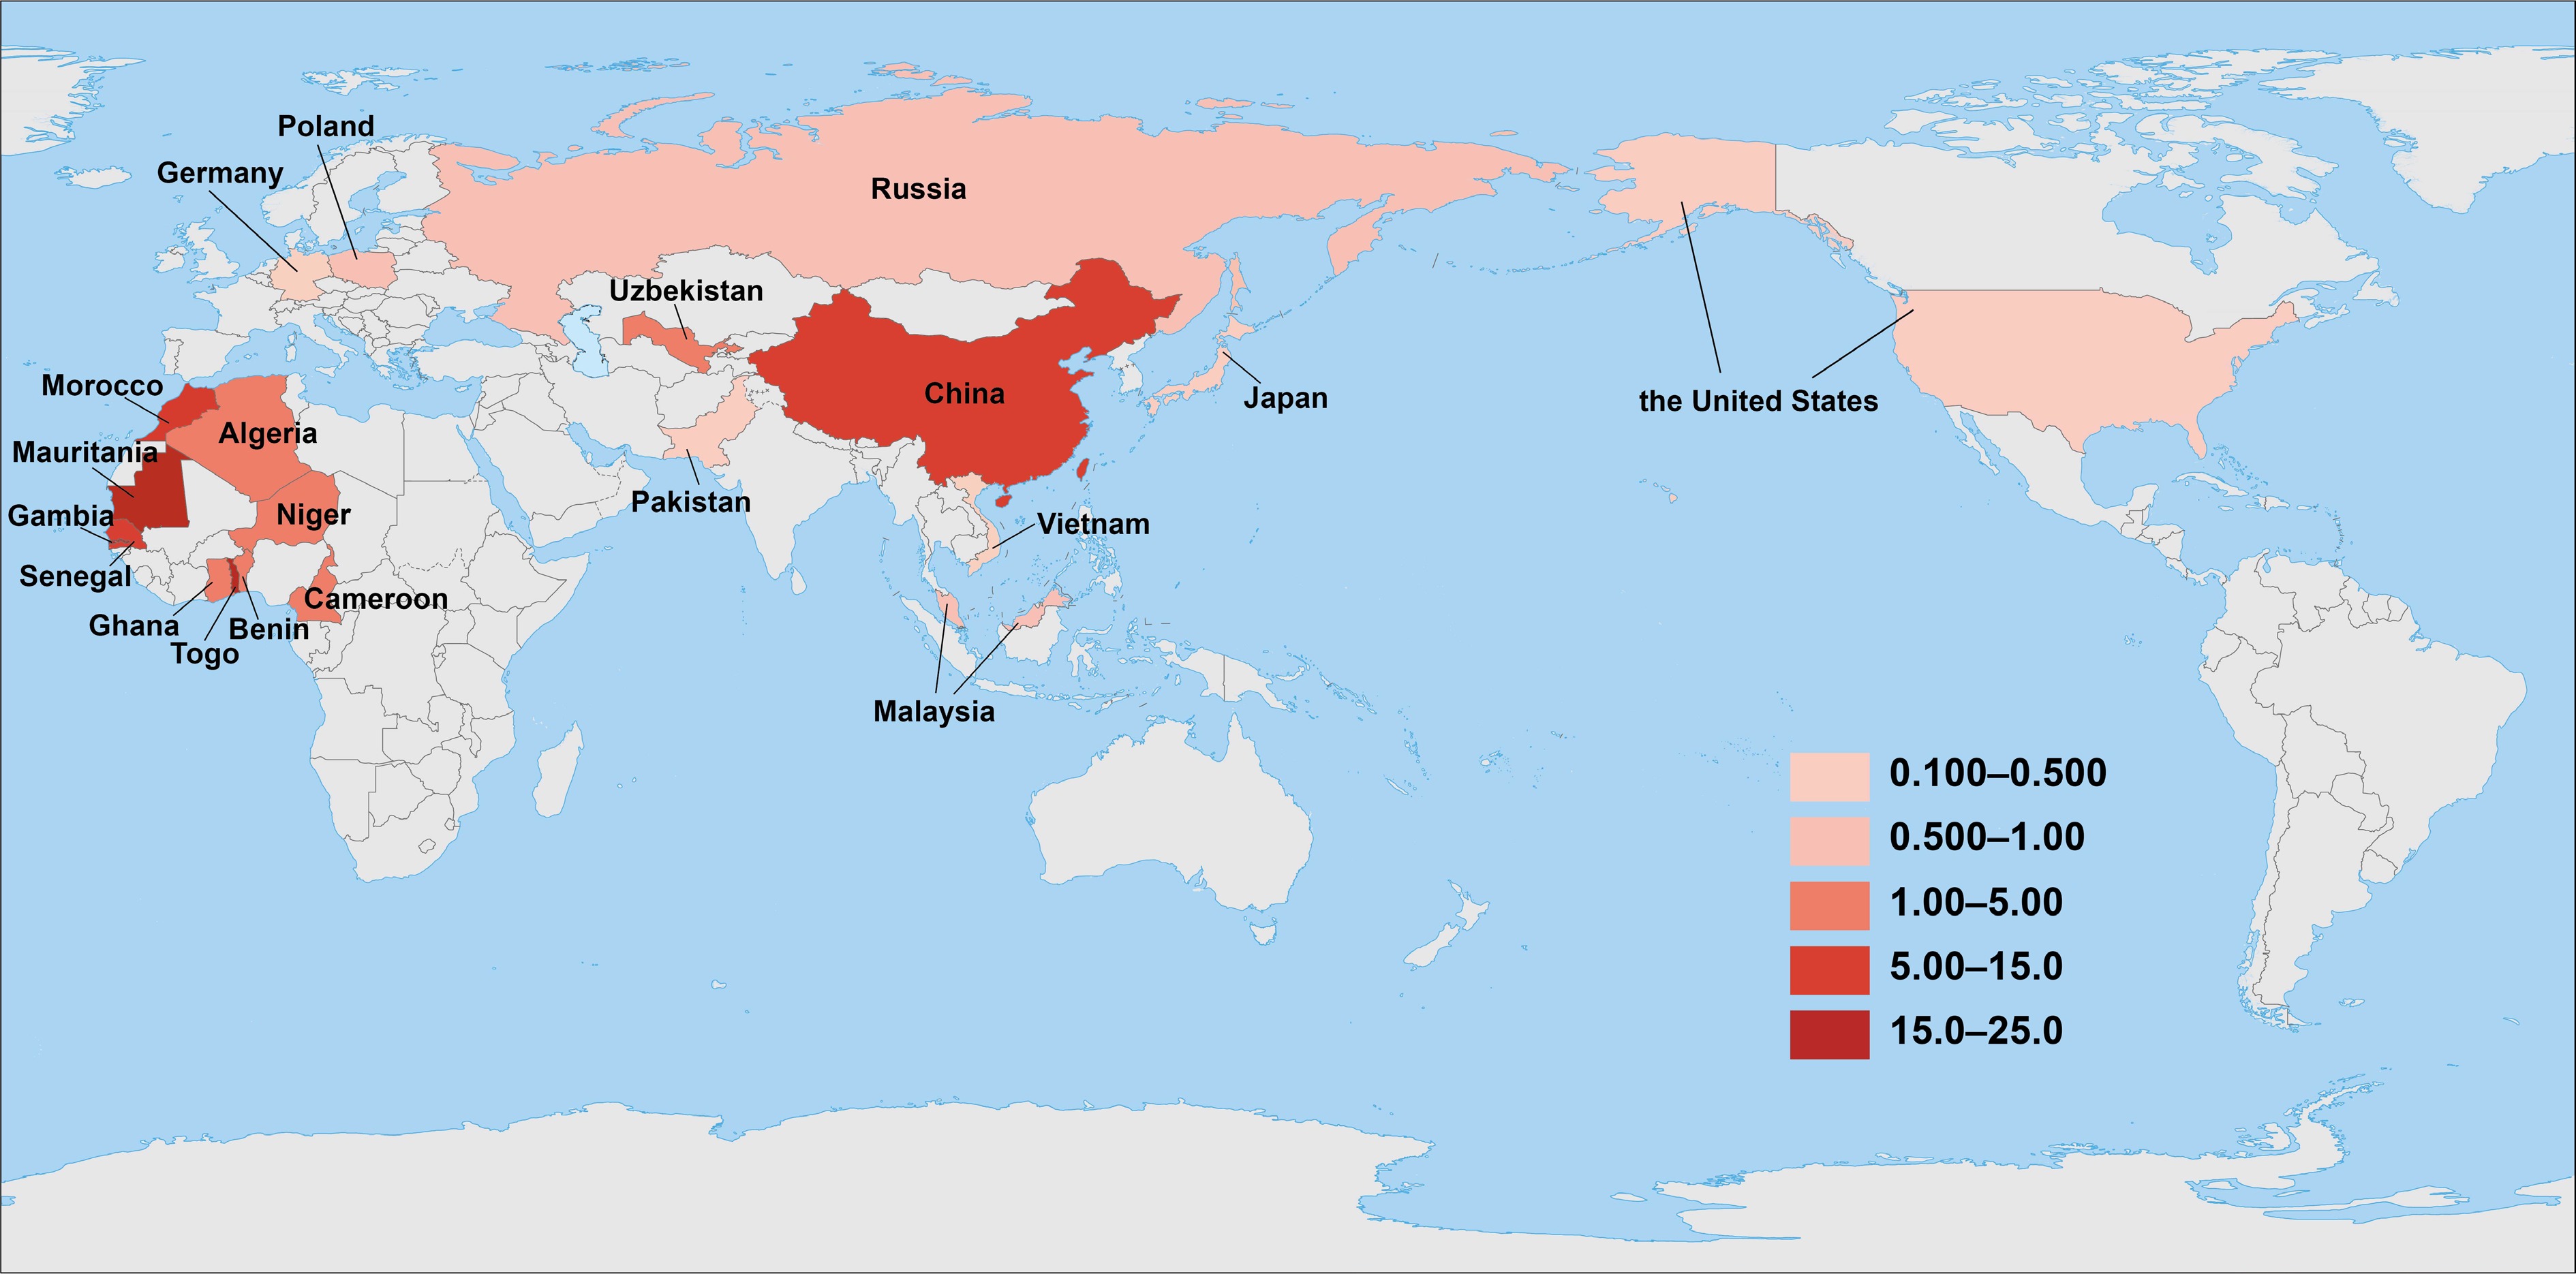
Figure 5.
EWIs (×10−3 pg WHO-TEQ /kg bw/week) of PCBs for adult populations in 20 countries worldwide (map source: Standard Map Service, Ministry of Natural Resources of China, GS(2016)1665).
-
EDI (× 10−7 pg WHO-TEQ/kg bw/day) EWI (× 10−6 pg WHO-TEQ/kg bw/week) Black tea Dark tea Green tea Oolong tea White tea Yellow tea Black tea Dark tea Green tea Oolong tea White tea Yellow tea Min 290 42.2 1,310 147 114 5.42 203 29.6 915 103 79.5 3.79 Mean 1,260 214 4,300 770 310 20.9 883 150 3,010 539 217 14.6 Median 1,160 131 3,250 578 181 13.8 815 91.4 2,270 404 127 9.64 95% 2,830 785 9,860 1,570 766 42.5 1,980 550 6,900 1,100 536 29.7 Max 3,959 1,190 32,300 1,650 957 45.7 2,770 836 22,600 1,150 670 32.0 Table 1.
The EDIs and EWIs for tea samples from six categories
Figures
(5)
Tables
(1)