











-
Polychlorinated biphenyls (PCBs) are persistent organic pollutants (POPs) that have attracted public attention over decades because of their high toxicity and bioaccumulative nature in organisms. There are 12 nonortho and mono-ortho substituted PCBs. These PCBs exhibit toxicological properties similar to those of dioxins. This activity is called dioxin-like activity. These 12 PCBs are therefore named dioxin-like PCBs (DL-PCBs). Among the 197 non-DL-PCBs, the Stockholm Convention on POPs recommends the measurement of six indicator PCBs (IN-PCBs) to characterize contamination by non-DL-PCBs[1]. Given the results of toxicological and epidemiological studies, many organizations have established health-based guidance values for human intakes of PCBs[2]. Although the production of PCBs has been globally discontinued since the last century, there are still unintentional emissions of PCBs during thermal industrial processes nowadays[3], as well as during cooking[4].
For the general population, dietary intake is regarded as the primary route of exposure to PCBs, and such exposure can lead to adverse effects on human health. More attention has been paid to PCBs in animal-derived products globally[5−7]. This is because PCBs are lipophilic compounds that easily accumulate in animals' adipose tissues. However, animal-derived products, such as fish, meat, and eggs, serve as the primary sources of human dietary exposure to PCBs[7]. Food animals can be exposed to PCBs both from animal feed and their breeding environments, leading to the bioaccumulation of PCBs in foodstuffs of animal origin[8]. Stadion et al. reported mean concentrations of ∑6IN-PCBs of 0.167 ng/g wet weight (ww) in meat and meat products in Germany and up to 2.12 ng/g ww in fish, seafood, and invertebrates[9]. Sun et al. studied animal-derived foods (e.g., pork, beef, and fish) in the Chinese market and found mean concentrations of tri- to deca-CBs ranging from 0.3 to 67.5 ng/g lipid weight (lw)[6]. Recently, increasing trends of dietary intake of DL-PCBs from foodstuffs of plant origin were found[10]. According to Stadion et al., the mean concentrations of ∑6IN-PCBs in German food commodities, including cereals, vegetables, starchy foods, legumes, and nuts, ranged from 0.012 to 0.057 ng/g ww[9]. Sun et al. reported PCB levels ranging from 5,316.4 to 100,790.7 pg/kg fresh weight (fw) in plant-derived foods (e.g., cereals, legumes, root vegetables, and other vegetables) collected from five major regions of China[11]. Furthermore, Arshad et al. documented ∑14PCB concentrations of 2.71–151.67 ng/g in legumes and 2.30–97.0 ng/g in vegetables from the Khanewal and Multan regions of Pakistan[12]. The occurrence of PCBs in foodstuffs of plant origin should not be ignored, especially the potential health risks of Tetrachlorobiphenyls (TeCBs) on human beings[11,12]. However, studies on PCBs in beverages are scarce.
Tea is the second most consumed nonalcoholic beverage globally. There are several functional nutritional components in tea, and the special flavor of tea makes it popular worldwide. Apart from the benefits of drinking tea, there are also some toxic environmental pollutants in tea products, which might have potential adverse effects on human health. Our previous study found short- and medium-chain chlorinated paraffins[13], polychlorinated naphthalenes (PCNs)[14], and organophosphate flame retardants[15] in commercial tea products from China, and packaging materials are crucial pollution sources of chlorinated paraffins and organophosphate flame retardants in tea[13,15]. On the other hand, PCNs in tea might be attributed to the unintentional production of PCNs from industrial thermal processes[14]. Barone et al. were the first to report PCBs in commercialized tea in Italy[16]. They found that the total concentration of 23 PCB congeners in tea samples varied by origin, and Tri- and TeCBs were the predominant homologues.
China is the world's largest tea-producing country, and its tea yield reached 3,550,000 tons in 2023[17]. There are several categories of tea products in China, including black tea, dark tea, green tea, and oolong tea. Meanwhile, there are many unintentional emission sources of PCBs in China, such as metal smelting[3]. The released PCBs might enter the tea production chain, leading to PCB contamination in commercial tea products. However, to the best of our knowledge, there is no comprehensive study on PCBs in tea produced in China, and relevant health risk information is also lacking. To fill this gap, the aims of the present study were to (1) investigate the occurrence of PCBs in six major categories of commercial tea produced in China, (2) identify the geographic variation of PCBs in tea samples collected from 16 Chinese provinces, (3) evaluate the effects of processing and brewing on PCBs in tea, and (4) assess human exposure risks to PCBs through tea consumption. This is the first comprehensive study on PCBs in commercial tea. The results are likely to be useful for controlling PCBs in tea and preventing consumers' exposure to PCBs through tea consumption.
-
In total, 192 commercial tea samples produced in China were collected in 2019 and 2020. When classified by category, the tea samples consisted of 104 green tea, 33 black tea, 11 white tea, 20 dark tea, 7 yellow tea, and 17 oolong samples. These samples were produced in 16 Chinese provinces, including Anhui (n = 7), Chongqing (n = 7), Fujian (n = 25), Guangdong (n = 4), Guangxi (n = 5), Guizhou (n = 23), Hainan (n = 3), Henan (n = 4), Hubei (n = 25), Hunan (n = 19), Jiangxi (n = 4), Shaanxi (n = 9), Sichuan (n = 22), Taiwan (n = 9), Yunnan (n = 15), and Zhejiang (n = 11). Fresh tea leaves used for the production of a green tea sample and the corresponding processed green tea sample were also collected. Fresh tea leaves were freeze-dried and ground. All of the tea samples were wrapped in aluminum foil and stored at −20 °C after being transported to the laboratory until analysis.
Sample extraction and clean-up
-
The detailed extraction procedures have been provided elsewhere[18]. Briefly, approximately 4 g of each tea sample was spiked with a 13C12-labeled PCB internal standard (68C-LCS, Wellington Laboratories Inc., Canada) and then extracted with n-hexane and dichloromethane (pesticide residue grade, 1:1, v/v) for 45 min. The extract was cleaned with acidic silica gel (44% mass fraction) on a C18 solid-phase extraction column (Sep-Pak Vac 6cc 1 g; Waters, Milford, USA) and a hand-packed multilayer silica column under normal atmospheric pressure, successively. The eluent was concentrated to approximately 20 μL by rotary evaporation at 450 mbar and 55 °C, and a 13C12-labeled PCB internal standard (68C-IS, Wellington Laboratories Inc., Canada) was added for calculating the recovery. The chromatogram of the 13C12-labeled PCB internal standards is shown in Supplementary Fig. S1.
Instrumental analysis
-
A total of 18 PCB congeners were analyzed in this study. Specifically, six IN-PCBs (CB 28, 52, 101, 138, 153, and 180) and 12 DL-PCBs (CB 77, 81, 105, 114, 118, 123, 126, 156, 157, 167, 169, and 189) were analyzed by high-resolution gas chromatography/high-resolution mass spectrometry (HRGC/HRMS) (DFS, Thermo Fisher Scientific, USA) using the isotope dilution HRGC/HRMS method, referring to the US Environmental Protection Agency (EPA) method 1668C. PCB congener separation was conducted with a fused silica capillary column (TR-DIOXIN-5MS, 60 m × 0.25 mm inner diameter × 0.25 μm, Thermo Fisher Scientific, USA). The temperature program for the PCBs was as follows: An initial temperature of 140 °C for 1 min, followed by an increase to 200 °C at a rate of 20 °C/min, which was held for 1 min. This was followed by an increase to 220 °C at a rate of 5 °C/min, which was held for 16 min. The temperature was then increased to 235 °C at a rate of 5 °C/min, and was held for 7 min. Finally, it was increased to 310 °C at a rate of 5 °C/min and was held for 10 min. The injection and ion source temperatures were set at 260 and 280 °C, respectively. The mass spectrometer was operated in selected ion monitoring mode, and the resolution was tuned to approximately 10,000 for sample analysis.
Quality control and quality assurance
-
All inner surfaces of the glassware were washed with n-hexane or dichloromethane three times prior to use. A laboratory blank with only the solvent was analyzed with each batch of tea samples. CB 28 and 52 were commonly detected in the blanks, but their concentrations were below 15% of those in the samples. Thus, no blank correction was applied for calculation of the results. The limits of detection (LODs, a signal-to-noise ratio of 3) of the PCB congeners in the tea samples were 0.007–2.89 pg/g dry weight (dw), and the recoveries of the 13C12-labeled PCB internal standards in the samples were 32%−128%. Since the isotope dilution method was used in this study, recovery rates ranging from 32% to 128% were deemed to be acceptable.
Health risk assessment
-
The toxic equivalent (TEQ) values of PCBs were calculated using the toxic equivalency factors (TEFs) provided by the World Health Organization (WHO) in 2005[19] and 2022[20], respectively, for comparison. The TEQ is calculated using the following equation:
$ \mathrm{TEQ}_{ \mathrm{\sum PCBs}} =\mathrm{\sum (} \mathit{C} _{ \mathrm{i}} \,\times\,\mathrm{ TEF}_{ \mathrm{i}} \mathrm{)} $ (1) where, Ci is the concentration of PCB congener in tea (pg TEQ/g dw), and TEF is the corresponding toxic equivalency factor.
The estimated daily intake (EDI) and weekly intake (EWI) values of Chinese adults exposed to PCBs through tea consumption were calculated using the following equation:
$ \text{EDI}=\frac{{\text{C}}_{\text{PCBs}}\,\times\, \text{M}}{\text{BW}} $ (2) $ \mathrm{EWI=EDI\,\times\, 7} $ (3) where, CPCBs is the concentration of PCBs in tea (pg TEQ/g dw), M is the mass of tea consumed (black tea: 0.682 g/d; dark tea: 0.061 g/d; green tea: 2.49 g/d; oolong tea: 0.426 g/d; white tea: 0.121 g/d; yellow tea: 0.024 g/d)[17], and bw is the average body weight of Chinese adults (63 kg).
-
PCBs were detected in all tea samples (n = 192), and the concentrations of congeners below the LOD were substituted with their LOD. The PCB concentrations in the six categories of tea are shown in Fig. 1a–c. The concentrations of Σ18PCBs in all the tea samples ranged from 9.36 to 4,490 pg/g dw (mean: 221, median: 106). The lowest value (9.36 pg/g dw) was identified in a black tea sample from Hainan, and the highest value (4,490 pg/g dw) was found in a dark tea sample from Yunnan. The mean concentrations of Σ18PCBs in different categories of tea samples decreased in the following order: Dark tea (549 pg/g dw) > oolong tea (241 pg/g dw) > green tea (186 pg/g dw) > black tea (176 pg/g dw) > white tea (133 pg/g dw) > yellow tea (93.3 pg/g dw) (Supplementary Table S1). The Σ18PCBs in dark tea were significantly higher than those in green tea, oolong tea, and yellow tea (p < 0.05). The concentrations of Σ6IN-PCBs (84.0–219 pg/g dw) were one order of magnitude higher than those of Σ12DL-PCBs (9.35–21.9 pg/g dw) in the tea samples. The concentrations of Σ6IN-PCBs showed a significant correlation with Σ12DL-PCBs (R2 = 0.725) in the same category of tea (Supplementary Fig. S2). This finding suggested that the IN-PCBs and DL-PCBs in the tea samples share a congruent origin. PCBs might be introduced into the tea samples during processing[21], and the variation in PCB concentrations among different tea categories may be primarily attributed to the different processing techniques. The relatively higher PCB contents in dark tea and oolong tea might be attributed to their more complex processing techniques than others. A similar result was also found in the study by Barone et al.[16], who investigated PCB concentrations in commercial tea samples from Italy and reportedthe average ∑16PCBs levels of 2,010 pg/g dw in black tea and 3,890 pg/g dw in green tea, which were 11.5–20.9 times higher than those of the ∑16PCBs in this study (black tea: 175 pg/g dw; green tea: 186 pg/g dw).
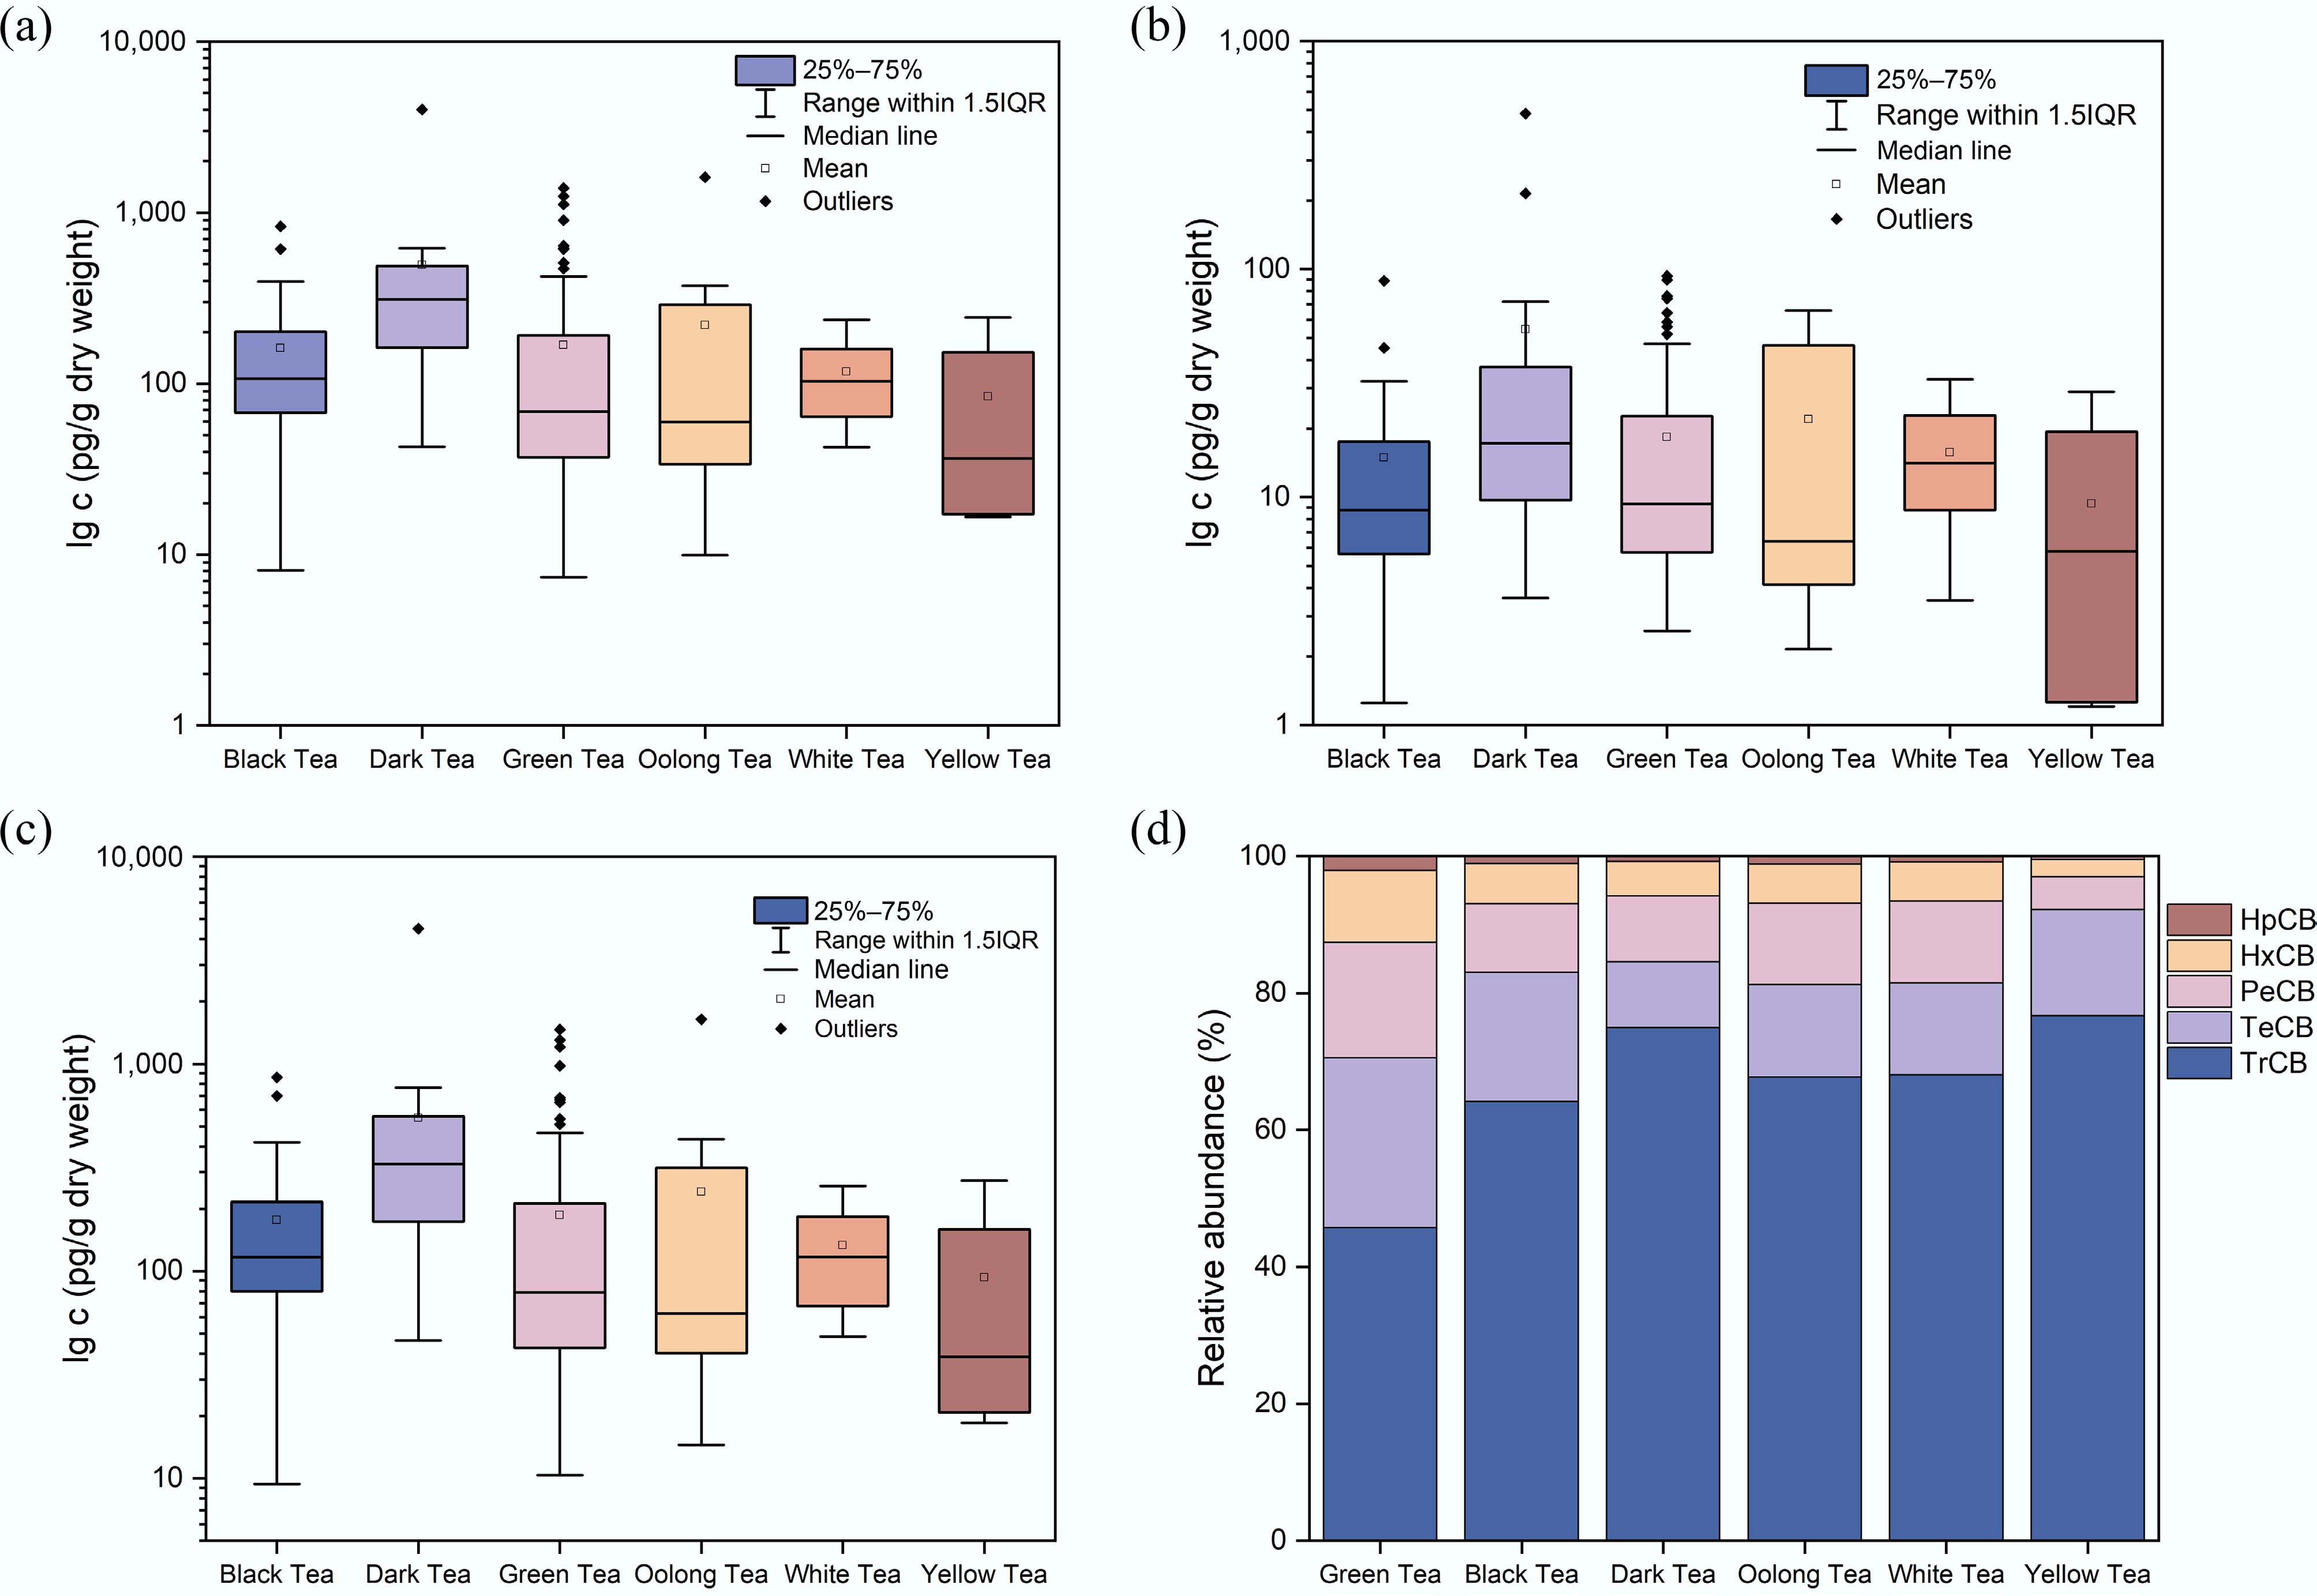
Figure 1.
Concentrations of (a) ∑6IN-PCBs, (b) ∑12DL-PCBs, (c) ∑18PCBs, and (d) relative abundance of PCBs in tea samples from six categories.
Drinking tea is more likely to lead to a higher PCB intake than that from other beverages and some foods. The data on PCB concentrations in food can be found in Supplementary Table S2. The mean concentration of ∑6IN-PCBs in tea samples from this study (200 pg/g dw) was considerably higher than the average ∑6IN-PCB level reported in coffee, cocoa, tea, and infusions from Germany by Stadion et al.[9] (17 pg/g ww). Shen et al.[22] reached a consistent conclusion regarding PCBs in rice (median: 20.6 pg/g ww) sampled from supermarkets in Zhejiang, China. Even the rice from municipal waste incinerators (median: 41.3 pg/g ww) and e-waste disassembling areas (median: 65.2 pg/g ww) in Zhejiang exhibited lower PCB concentrations than those in tea. The average ∑6IN-PCB levels in vegetables (38 pg/g ww) and cereals (47 pg/g ww) from the German total diet study were also lower than those found in tea[9]. However, the mean ∑PCB levels observed in vegetables (118 pg/g ww), fruits (127 pg/g ww), and cereals (158 pg/g ww) in South Korea were found to be at similar levels to those in tea, as reported by Shin et al.[23] The higher levels of PCB in tea compared with other plant-derived foods are attributed to two primary factors. One reason is that tea plants are perennial, unlike rice or vegetables, which are annual. This allows them to continuously accumulate PCBs from the soil and air over extended periods and transfer more contaminants into the leaves. Secondly, rice and vegetables are often frequently consumed either raw or with minimal processing. In contrast, tea undergoes numerous factory processes, such as drying, to reach its final form. These additional processes can lead to an increase in PCBs. Indeed, certain studies have also shown that the PCB levels in other plant-derived foods are considerably higher than those in tea. For instance, a study reported that the concentration of ∑17PCBs in walnuts from China was 670 pg/g[24]. This is probably because walnuts have a high lipid content, which facilitates the accumulation of PCBs from the environment. Additionally, the levels of PCB in vegetables near an e-waste recycling facility in North Rhine-Westphalia, Germany, were 4.50–540 ng/g dw, which exceeded those in tea, owing to localized environmental pollution[25]. Studies have indicated that animal-derived foods (such as pork, beef, poultry, fish) contain higher concentrations of PCBs compared with plant-derived foods[26,27]. Moreover, PCB pollution levels in China are significantly higher than those reported in many other countries[28,29], which makes it necessary to be more vigilant about dietary PCB exposure.
PCBs in tea samples from different origins
-
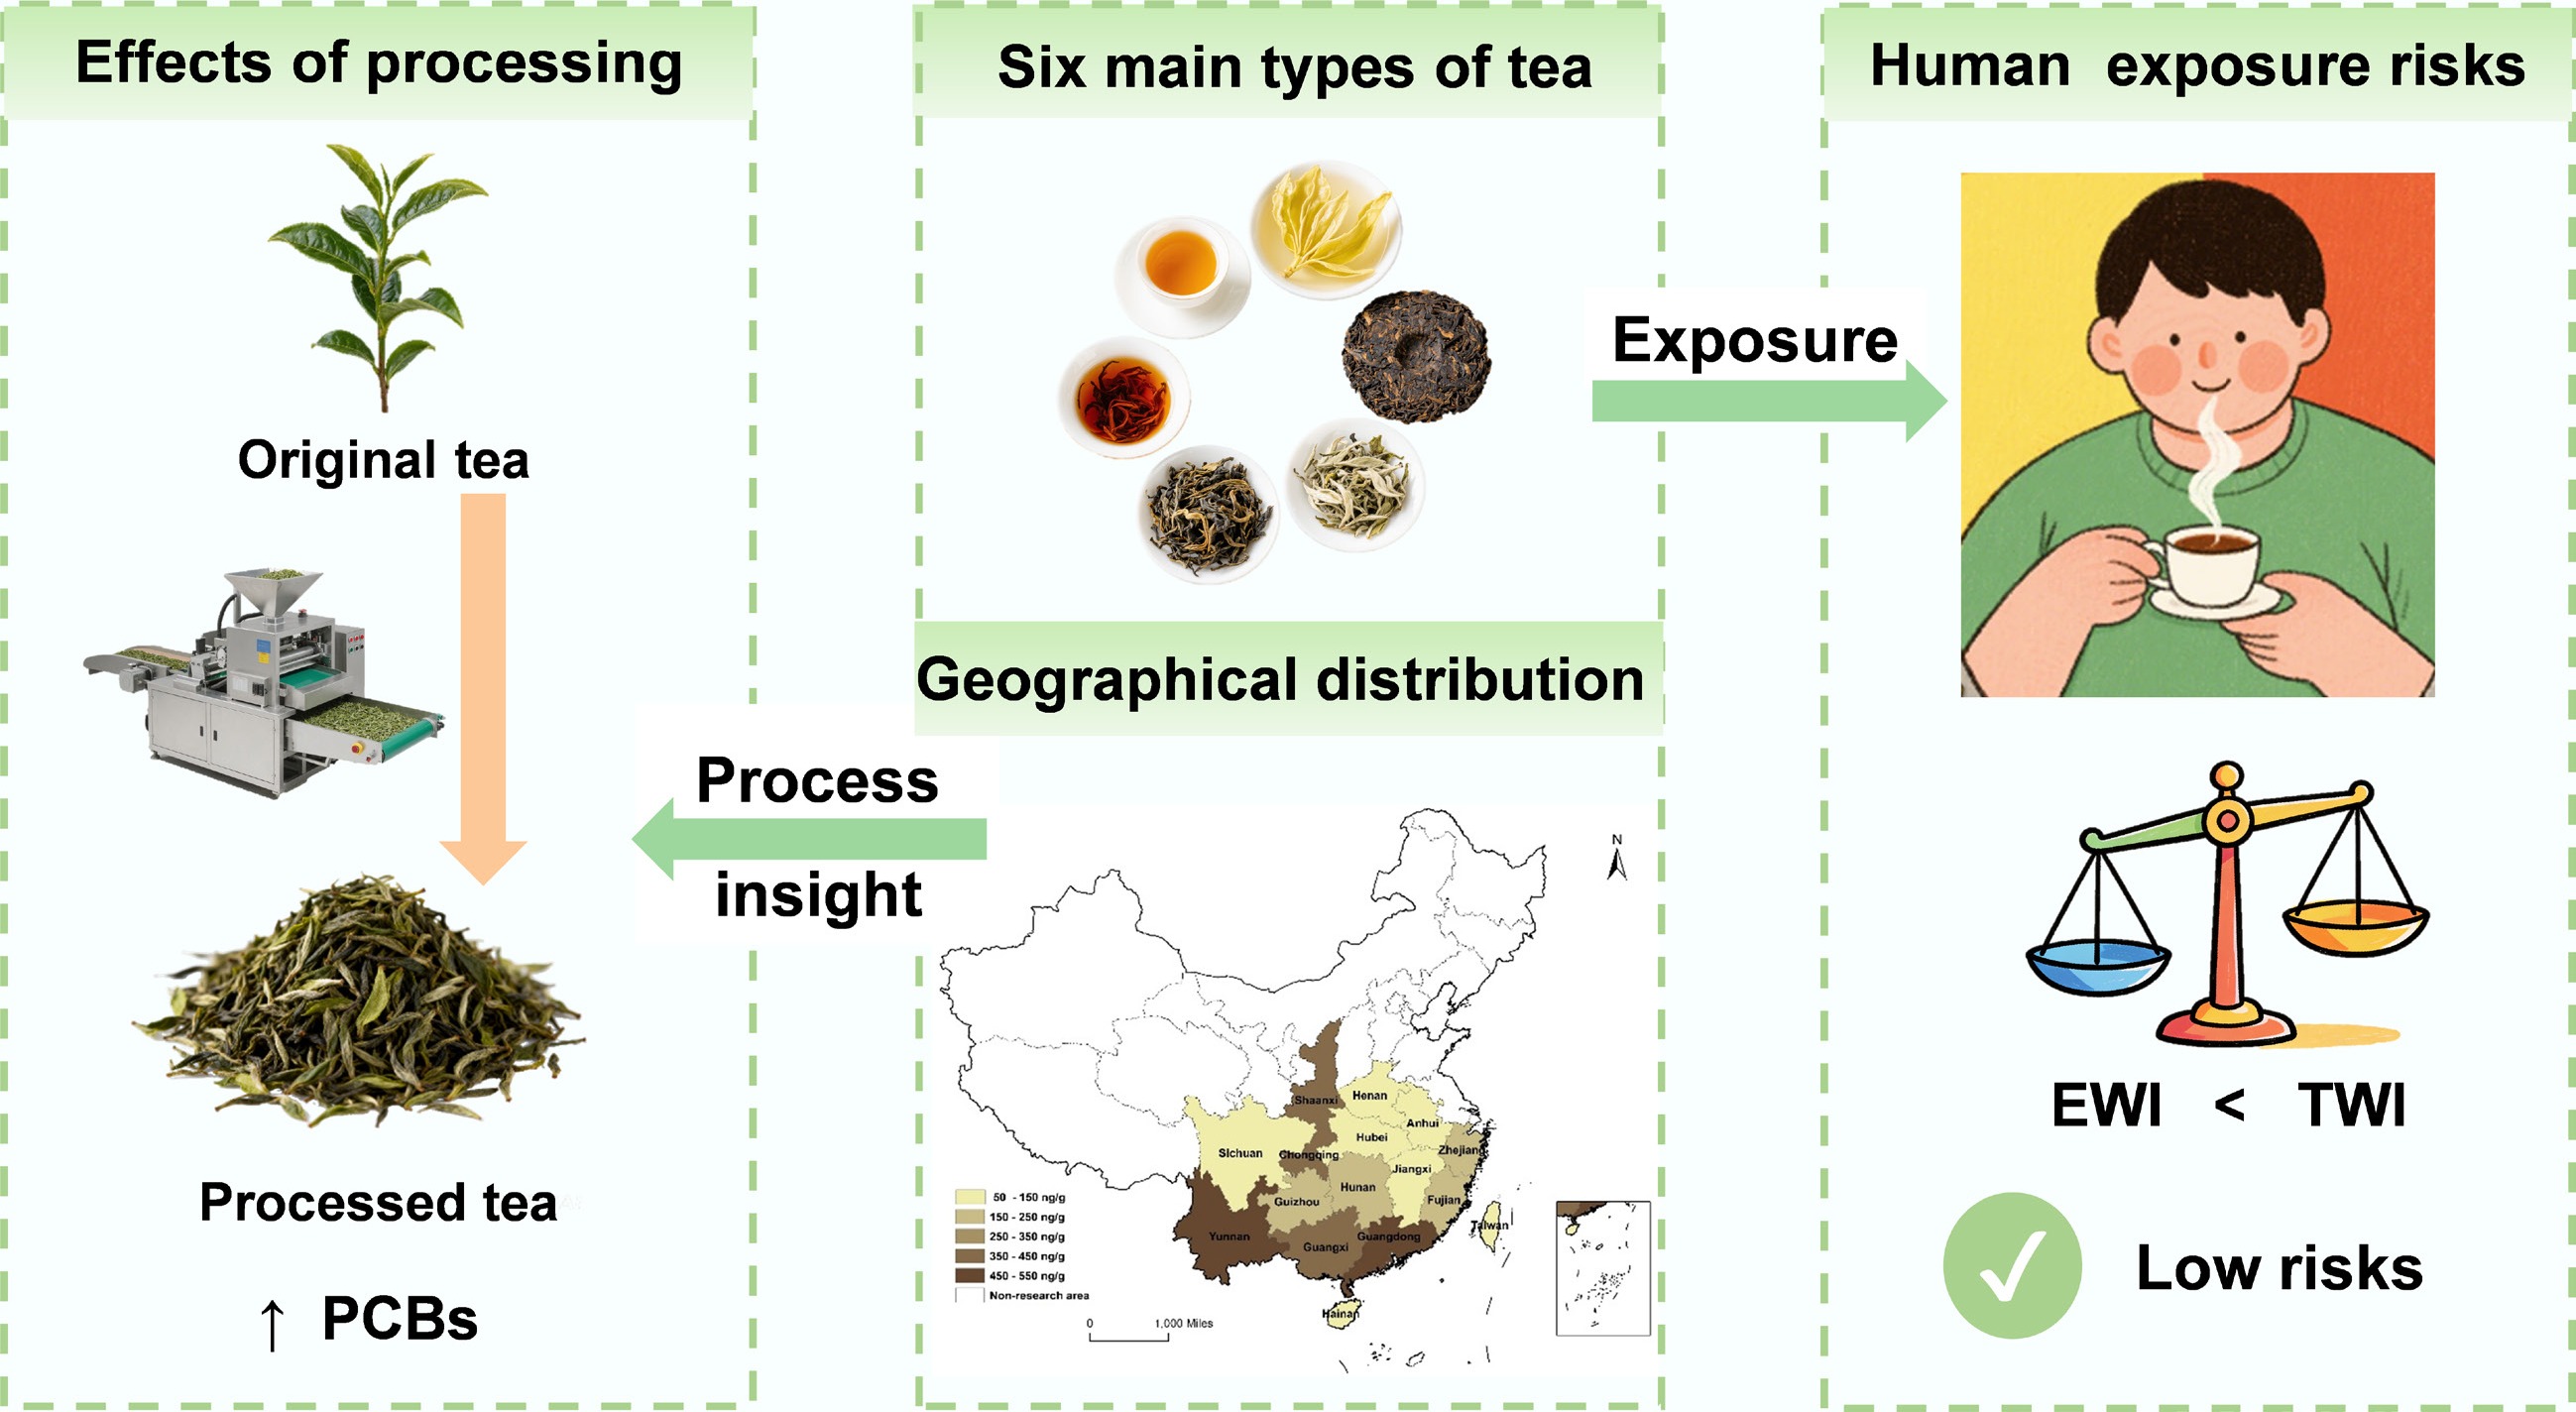
Figure 2a–c illustrates the concentrations of ∑18PCBs, ∑6IN-PCBs, and ∑12DL-PCBs detected in tea samples from 16 provinces. The mean Σ18PCB concentrations across the 16 Chinese provinces decreased in the following order: Guangdong (505 pg/g dw) > Yunnan (492 pg/g dw) > Chongqing (422 pg/g dw) > Guangxi (396 pg/g dw) > Shaanxi (385 pg/g dw) > Zhejiang (249 pg/g dw) > Fujian (229 pg/g dw) > Hunan (223 pg/g dw) > Guizhou (195 pg/g dw) > Sichuan (142 pg/g dw) > Anhui (136 pg/g dw) > Henan (122 pg/g dw) > Hainan (92.1 pg/g dw) > Jiangxi (78.5 pg/g dw) > Hubei (67.8 pg/g dw) > Taiwan (63.4 pg/g dw). Significant differences (p < 0.05) were observed between Hubei Province and the regions of Chongqing, Fujian, Hunan, and Shaanxi. The concentration of IN-PCBs (56.2–491 pg/g dw) was an order of magnitude higher than that of DL-PCBs (7.20–70.5 pg/g dw), which aligns with the pattern previously observed in tea. The relatively high concentrations of PCBs in tea samples from Guangdong are likely attributable to the tea planting environment. Guangdong has numerous industries, causing PCBs to be released into the environment and enter the tea production chain. Interestingly, high PCB levels were also found in tea samples from Yunnan, a province that is less industrialized. The elevated PCB levels found in dark tea are likely caused by its predominant production in Yunnan, as the samples from this region showed higher concentrations than others in the study. This indicates that PCB contamination in tea is influenced not only by environmental concentrations but also by potential contamination introduced during industrial processing.
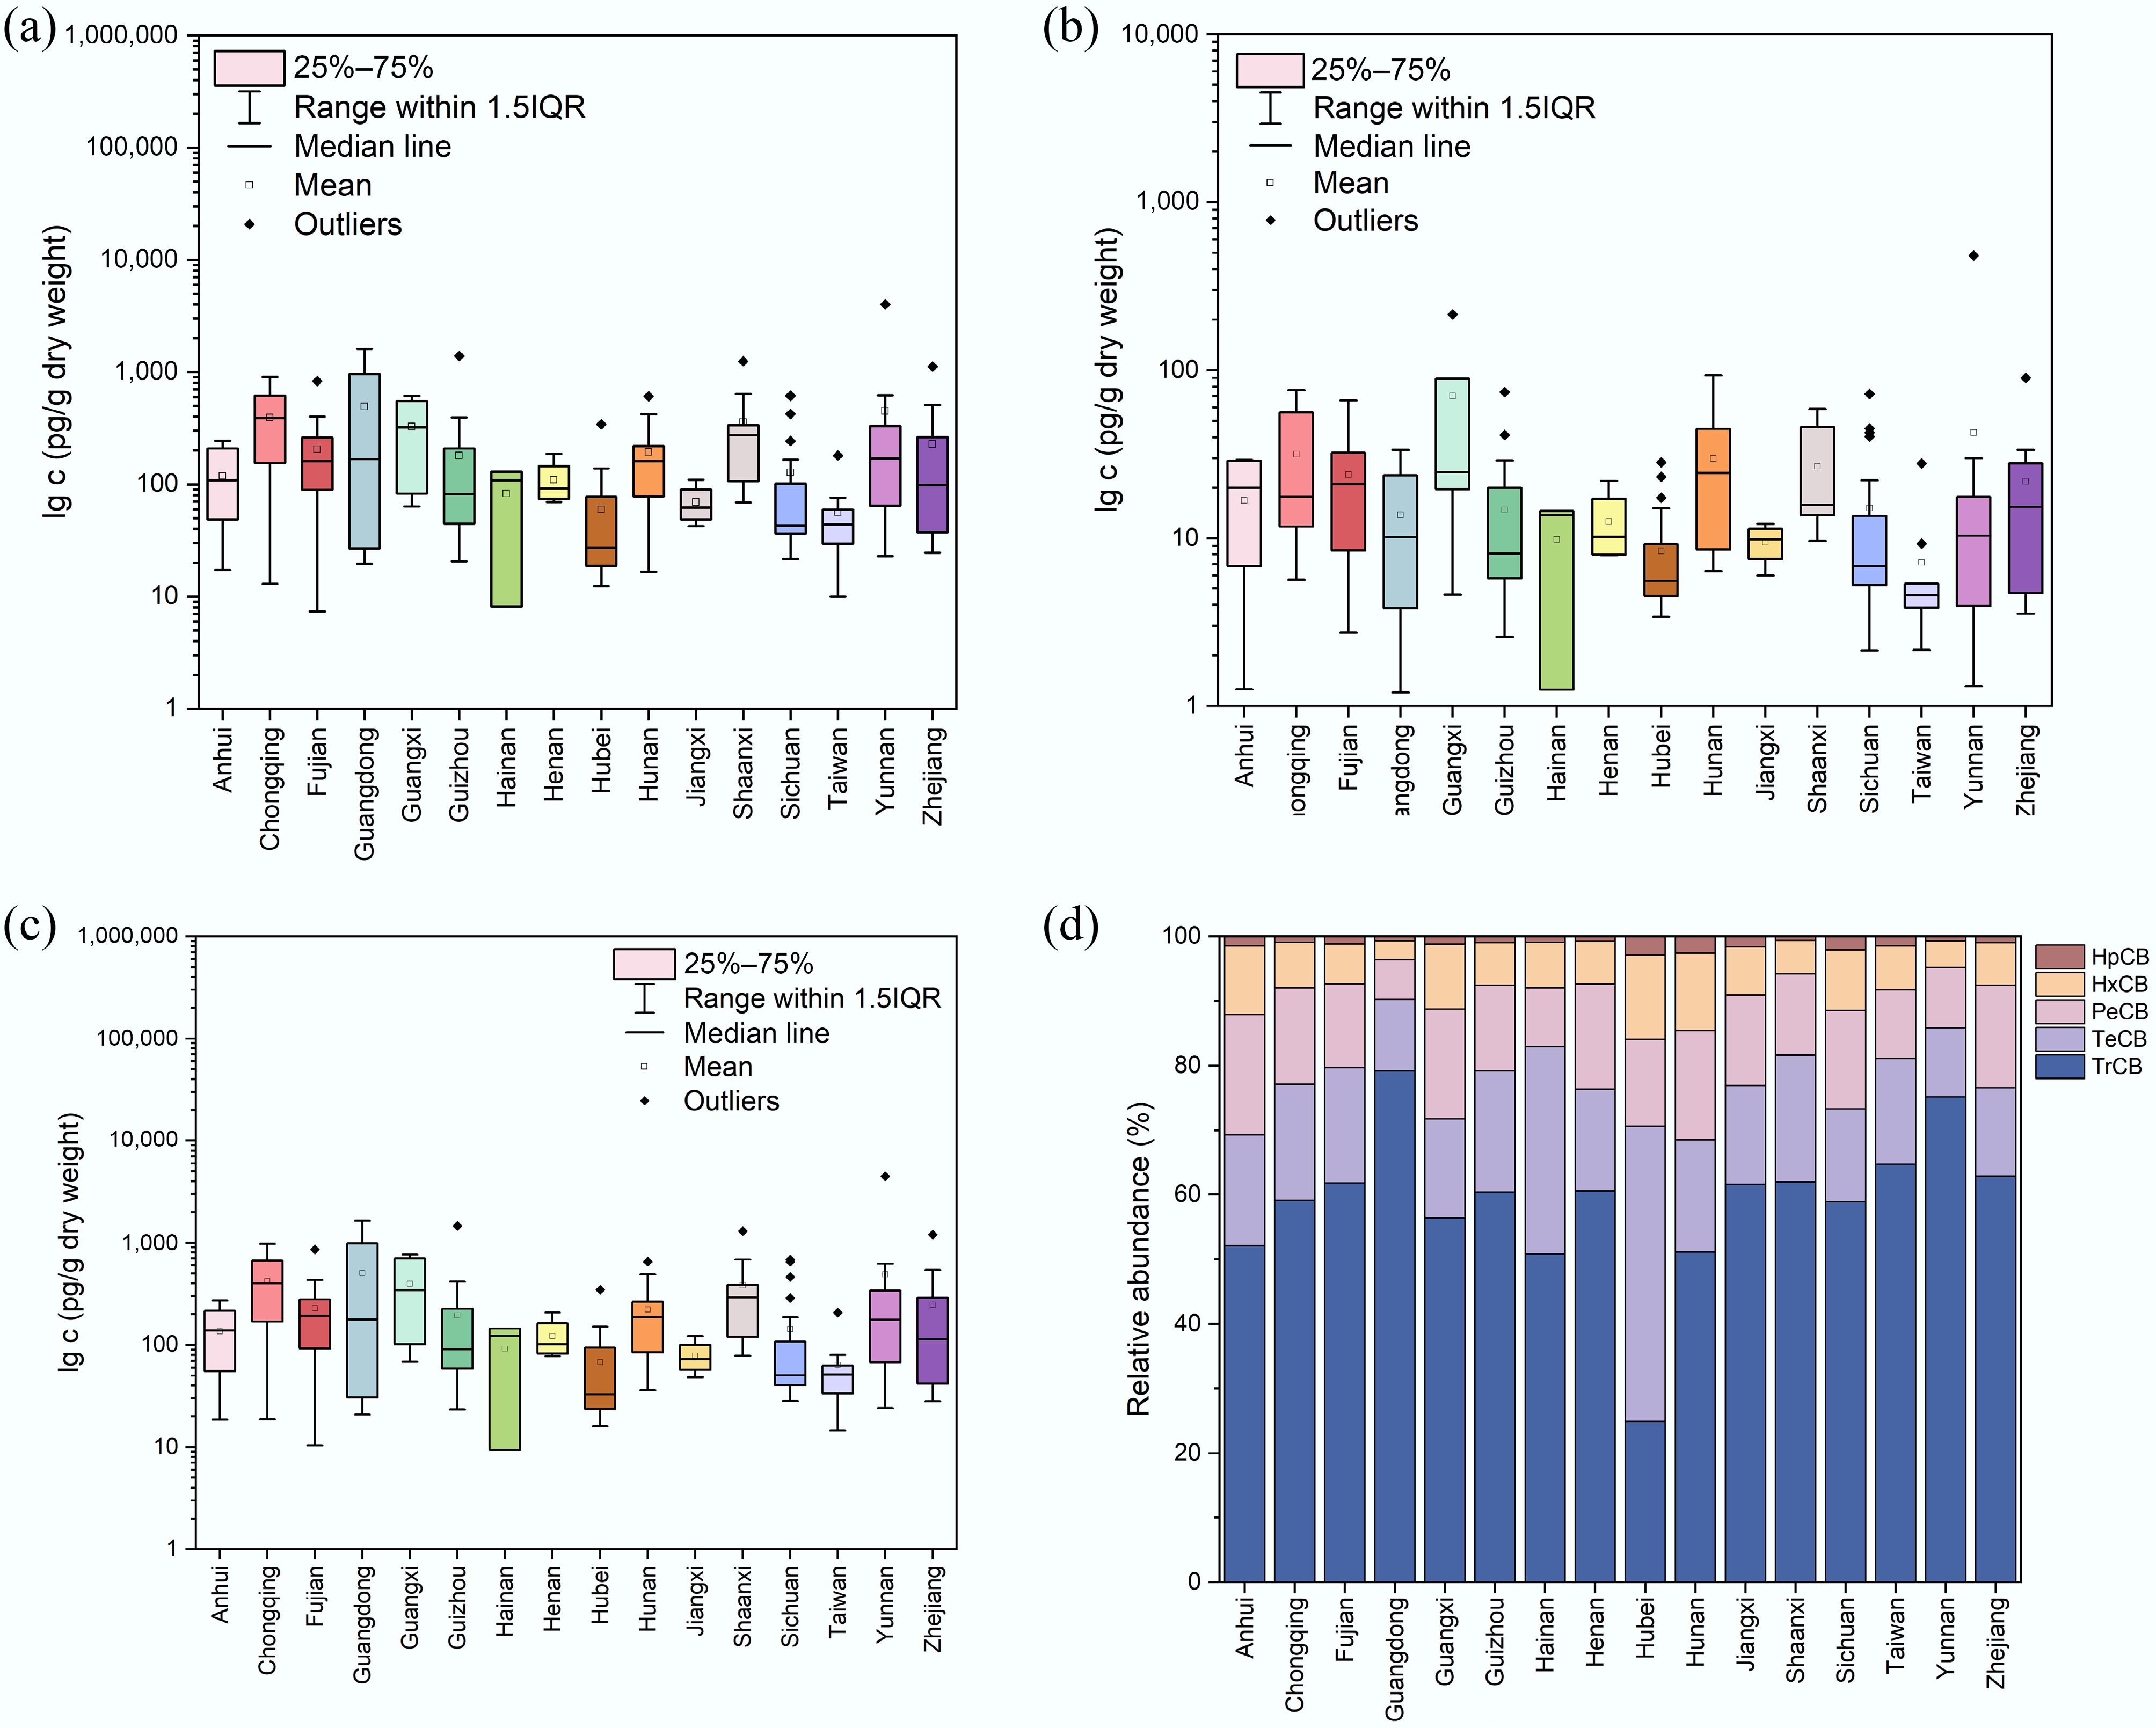
Figure 2.
Concentrations of (a) ∑6IN-PCBs, (b) ∑12DL-PCBs, (c) ∑18PCBs, and (d) relative abundance of PCBs in tea samples produced in 16 Chinese provinces.
Currently, no other studies have reported PCB levels in tea from different regions of China. Therefore, the results of this study were compared with those of other plant-derived foods in China. The PCB concentrations detected in tea in this study were substantially higher than those reported in other plant-derived foods in previous research. The IN-PCB concentration in tea samples from Zhejiang in this study (226 pg/g dw) was nearly 11 times higher than that found in rice from Zhejiang markets (20.6 pg/g ww) as reported by Shen et al.[22]. Sun et al.[11] reported PCB concentrations in plant-derived foods from China's Midland (Anhui, Chongqing, Guangxi, Guizhou, Hainan, Henan, Hubei, Hunan, Jiangxi, Sichuan, Taiwan) and South Coast (Fujian, Guangdong, Zhejiang) regions, including cereals (Midland: 30.7 pg/g lw; South Coast: 35.2 pg/g lw), legumes (Midland: 54.9 pg/g lw; South Coast: 73.9 pg/g lw), and tubers (Midland: 10.5 pg/g lw; South Coast: 5.32 pg/g lw). In contrast, the PCB concentrations in tea samples from these regions were substantially higher than those reported in vegetables (Midland: 327 pg/g lw; South Coast: 193 pg/g lw). Moreover, most PCB concentrations in vegetables in the Midland region were lower than those in the South Coast region in the study by Sun et al.[11]. This difference may be attributed to the fact that the South Coast region consists of coastal provinces, which are characterized by relatively rapid economic development and a high population density. These factors collectively contribute to higher PCB concentrations in tea grown in these areas. Conversely, the higher PCB concentrations in vegetables observed in the Midland region compared with the South Coast region in this study were primarily attributed to elevated levels detected in specific provinces, such as Chongqing (422 pg/g dw) and Guangxi (396 pg/g dw). The PCB concentrations in these two provinces were substantially higher than those in other parts of the South Coast (63.4–223 pg/g dw). Chongqing and Guangxi are historically significant centers for the production and use of PCBs and had numerous chemical and machinery manufacturing industries in the past. Consequently, historical PCB residues may continue to persist in the local environment. Furthermore, the topographical features of Chongqing, which is situated in a low-lying and relatively enclosed basin, may further promote the accumulation of PCBs.
Homolog and congener profiles of PCBs in tea
-
The 18 detected PCB congeners were categorized into five groups (TrCBs to Heptachlorobiphenyls (HpCBs)) according to the number of chlorine atoms. Analysis of the PCB congeners' distribution characteristics in six tea categories (Fig. 1d) revealed that TrCBs exhibited the highest contribution, accounting for 45.7%–76.7% of the total. Moreover, a clear decreasing trend was observed in the proportion of contamination of PCBs with an increasing number of chlorine atoms on the biphenyl ring in the tea samples. In this regard, the distribution patterns were consistent across all six tea categories. Among the 18 detected PCB congeners, only CB28 belongs to the TrCBs, indicating its significant contribution to the overall contamination profile. Meanwhile, the proportion of TeCBs was also considerable, ranging from 9.67% to 24.7%. It is worth noting that the proportion of TeCBs in green tea (24.7%) was somewhat higher than that in the other five tea varieties, which ranged from 9.67% to 18.9%. This finding aligns with the conclusion reported by Sun et al.[6], namely that TrCBs and TeCBs are the dominant PCB congeners commonly found in environments such as the atmosphere and surface water. Barone et al.[16] also reported the highest levels of TrCBs and TeCBs in green and black tea among commercial tea products in Italy, which is consistent with this study. However, the contribution of PeCBs found by Barone et al. (green tea: 30.1%; black tea: 26.8%) substantially exceeded the levels in this study (green tea: 16.8%; black tea: 10.0%). In the study by Stadion et al.[9], CB153 represented 16%–17% of the six PCB congeners detected in German tea samples. By contrast, CB153 constituted merely 4.70% in this study, demonstrating a notable difference. Dietary surveys in China have identified TrCBs and TeCBs as the major contributors to PCB contamination in plant-derived foods, with TeCBs exhibiting a higher contribution[11]. Similarly, Klees et al.[25] found a predominance of TeCBs in both curly kale and spruce needles sampled near an e-waste recycling site in Germany. Conversely, Li et al.[24] found that CB180 and CB189 were the predominant PCB congeners in walnuts in China, accounting for 81.6% of the total. The congener profile of PCBs in Chinese kelp is unique, with Dichlorobiphenyls (DiCBs) being the dominant homologs[30]. This is primarily caused by the significant presence of CB11. Cui et al.[31] reported findings consistent with those of Stadion et al.[9] in grass samples from a pasture in Scotland, UK, with CB153, CB138, and CB180 identified as the dominant congeners. Highly chlorinated biphenyls constitute a major proportion of the overall contamination in animal-derived foods. A representative example can be found in Chinese animal-derived products, where TeCBs (35.7%–69.3%) and Hexachlorobiphenyls (HxCBs) (12.2%–28.0%) were the predominant congeners, whereas TrCBs made a comparatively minor contribution (6.0%–23.6%)[6]. Similarly, CB153 (38.0%) and CB138 (25.0%) were identified as the dominant congeners in Thunnus thynnus from the southwestern Mediterranean[32]. This discrepancy may be attributed to differences in lipid content between animal- and plant-derived foods.
The distribution patterns of tea samples across different provinces were similar to those of tea categories (Fig. 2d). TrCBs and TeCBs collectively constituted the dominant contribution across all provinces, accounting for 68.5%–90.2% of the total. All provinces except Hubei exhibited a decreasing trend in the proportion of PCBs as the number of chlorine atoms increased. In these provinces, TrCBs constituted the largest proportion (50.9%–79.2%), followed by TeCBs (10.7%–32.1%), whereas HxCBs and Heptachlorobiphenyls (HpCBs) contributed minimally (3.60%–14.6%). In contrast, the contributions of TrCBs and TeCBs differed, with TeCBs accounting for 45.7% of the total, a higher proportion than that of TrCBs (24.9%) in Hubei. The discrepancy is primarily caused by the markedly elevated contribution of CB52 in Hubei relative to other provinces. Although TrCBs constituted the dominant PCBs manufactured and used domestically between 1965 and 1974 in China, the PCBs in Hubei originated not from domestic sources but from imported Aroclor mixtures. This observation is consistent with the findings reported in previous studies by Ge et al.[33] and Cui et al.[31]. Sun et al.[6] identified the Midland and South Coast regions of China as having the highest TeCB content in plant-derived foods (32.7%–93.7%), followed by TrCBs. The study also revealed significantly higher TeCB levels in plant-derived foods compared with animal-derived products (< 24.6%), a disparity that may be attributed to the differing trophic levels of various species within the food chain. Correlation analysis of the proportional contributions of differently chlorinated biphenyls in tea samples across 16 provinces (Fig. 3a) revealed broadly consistent congener distributions throughout most regions. Hubei Province, however, exhibited comparatively weaker correlations with Anhui, Guangxi, Henan, Sichuan, and Zhejiang. These results shows that the sources of PCB contamination are largely similar across the major tea-producing regions in China.
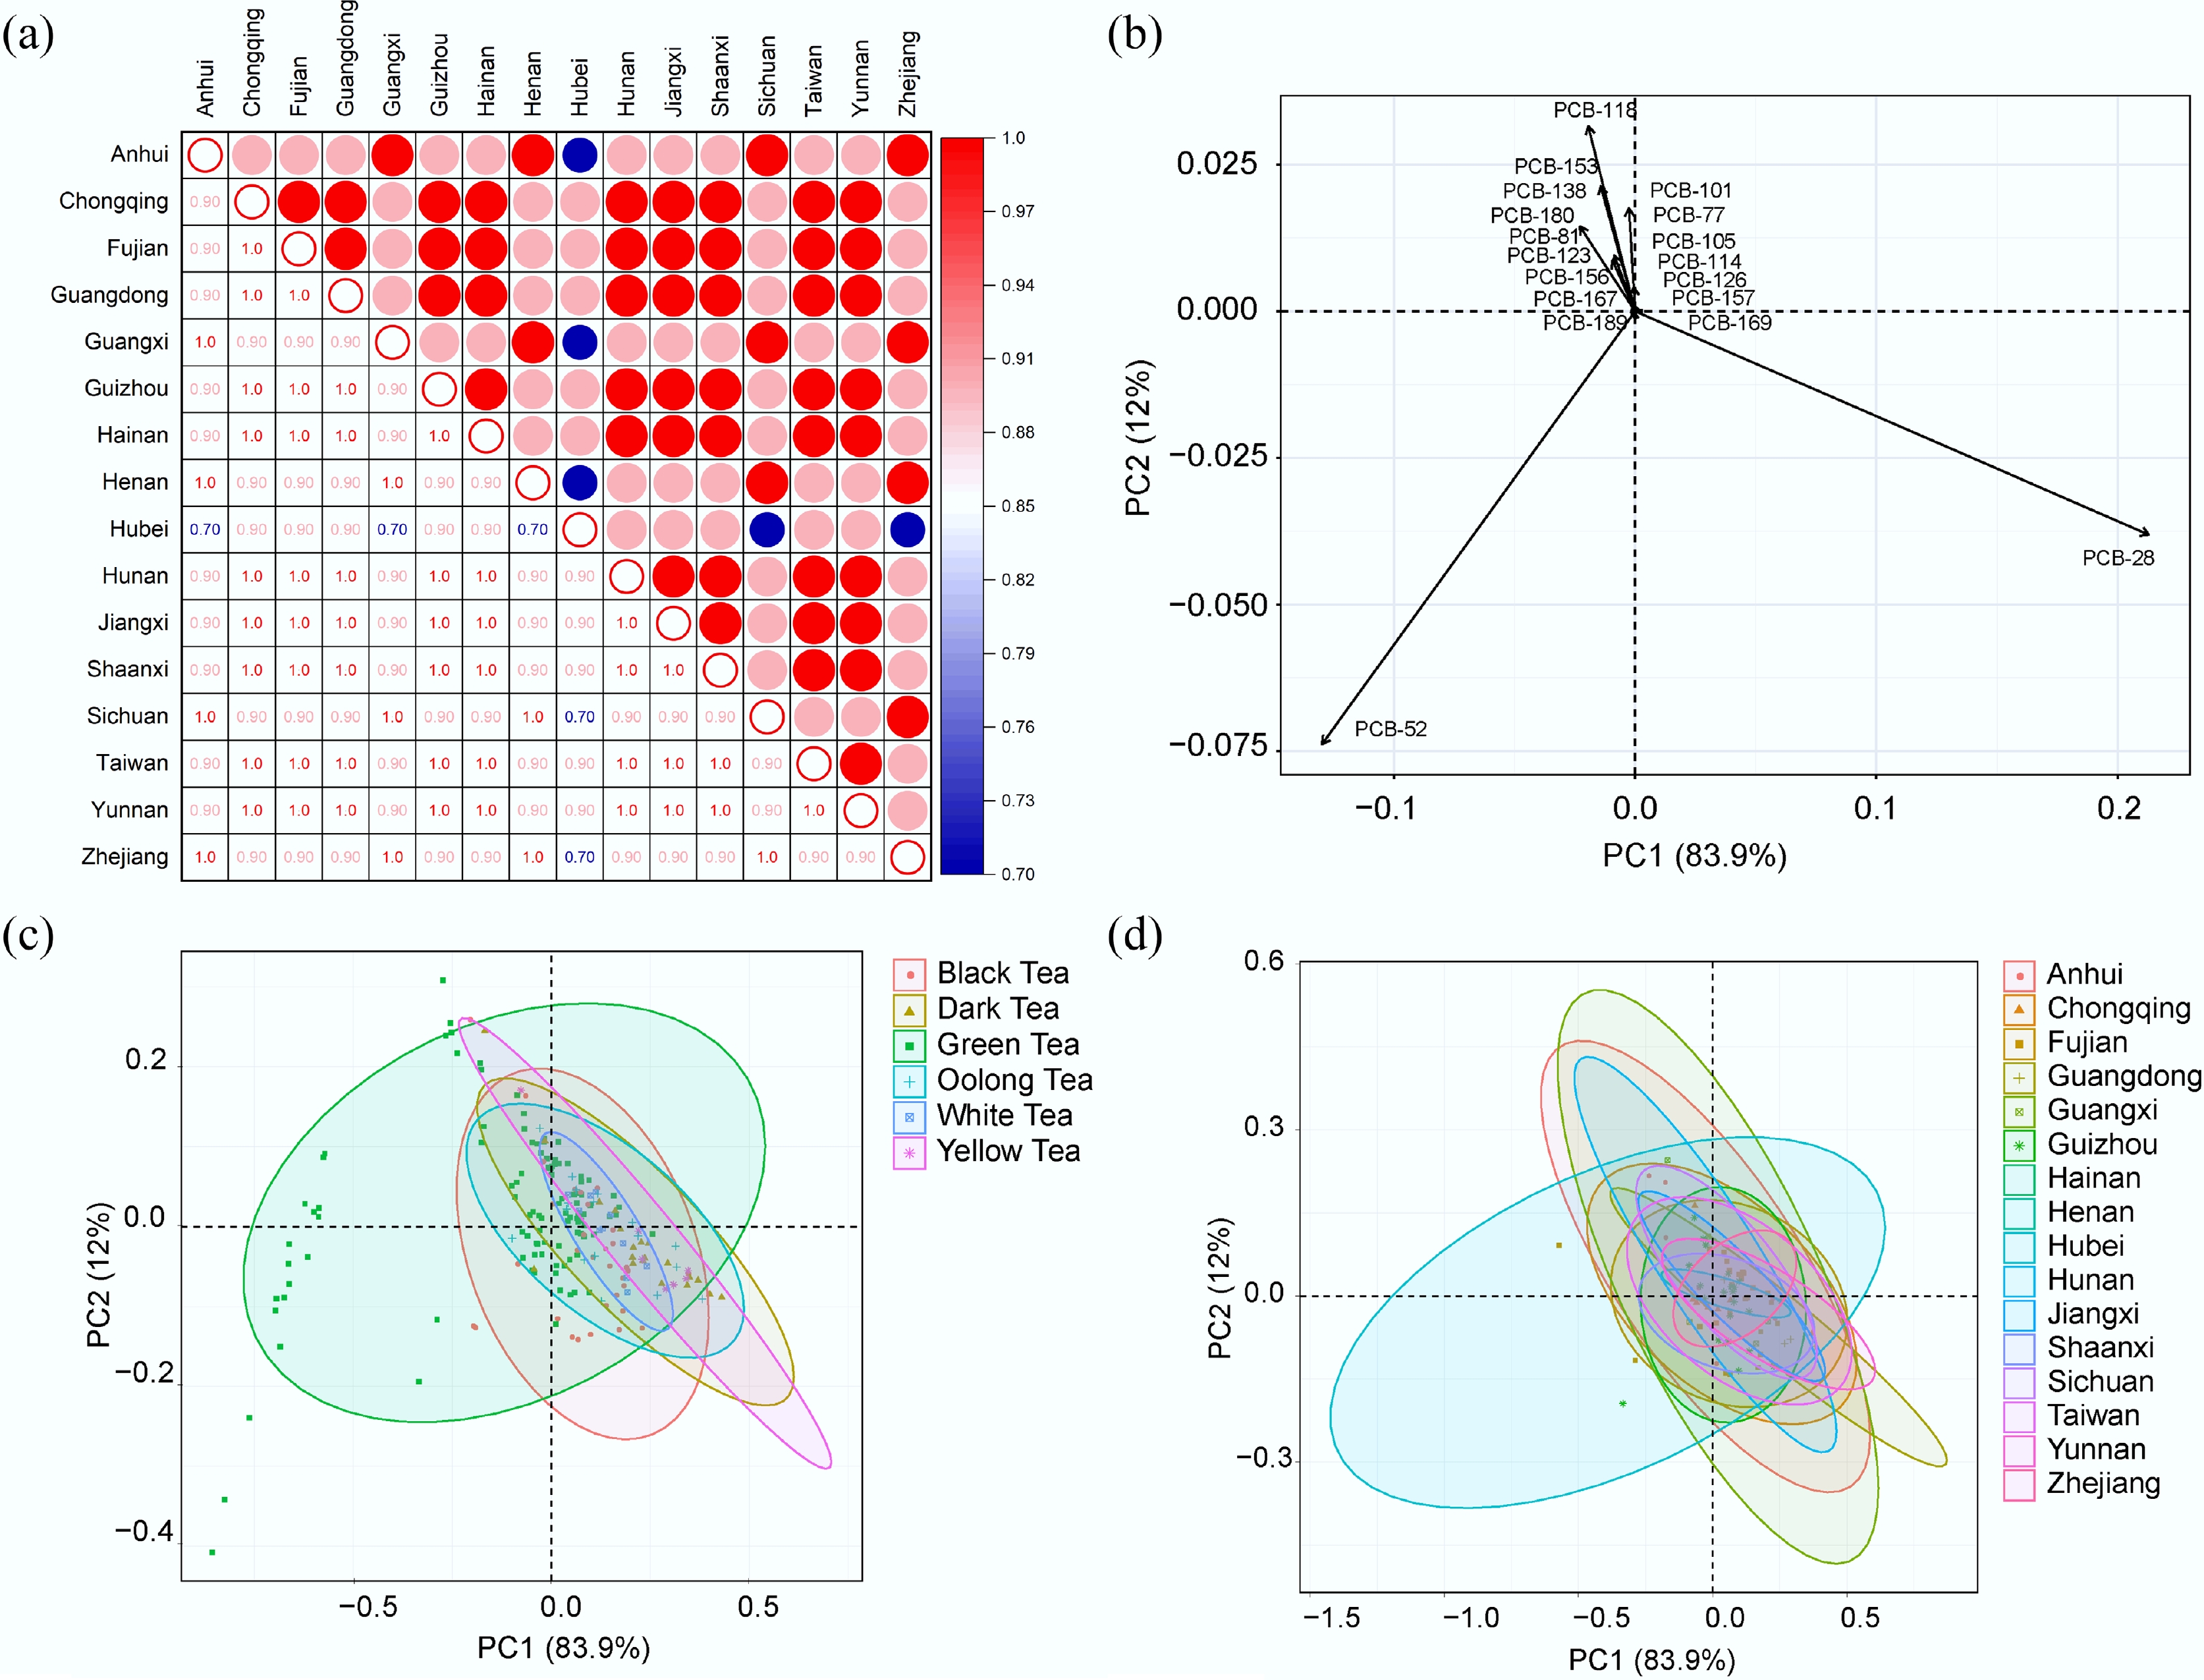
Figure 3.
(a) The correlations of the homologous distribution of ∑18PCBs among 16 provinces. (b) The loading plot of the principal component analysis; confidence ellipses for (c) six categories of tea samples and (d) tea samples produced from 16 Chinese provinces.
Principal component analysis was conducted to characterize the congener profiles of PCBs across various tea categories and provinces (Fig. 3b). The analysis incorporated all 18 detected PCB congeners as variables. Principal component 1 (PC1) and principal component 2 (PC2) explained 83.9% and 12% of the total variance, respectively. The congeners CB28 and CB52 exerted a considerable influence on the principal components, and both belong to the IN-PCBs group. Specifically, CB28 belongs to the TrCBs and CB52 belongs to the TeCBs. This result is consistent with the earlier finding that TrCBs and TeCBs are the two predominant congener groups. As shown in Fig. 3b, CB28 is positioned in the positive direction of PC1, whereas CB52 and the other PCB congeners cluster in the negative direction. On PC2, both CB28 and CB52 are situated in the negative direction, whereas the other congeners occupy the positive region. Therefore, if a sample plots on the positive side of the PC1 axis, this indicates that CB28 is its predominant congener; conversely, if it plots on the negative side, CB52 is identified as the dominant congener. Similarly, samples plotting on the negative side of the PC2 axis are primarily characterized by CB28 and CB52, whereas those on the positive side are dominated by other PCB congeners. Figure 3c, d shows the distinct separation of green tea from other tea categories and tea samples from Hubei, characterized by a pronounced clustering of sample points in the negative region of PC2. This distribution pattern indicates a greater contribution of CB52, corroborating earlier findings from the congener profile analysis. Moreover, the overlap of confidence ellipses among tea samples of different varieties and geographical origins indicates complex yet similar sources of PCB contamination. This finding further reveals the pervasive nature of PCB pollution in the environment.
Effects of processing on PCBs in tea
-
Green tea is the most produced and consumed variety among all tea types. Therefore, to investigate whether tea processing contributes to PCB contamination, the same batch of green tea was selected to examine changes in both PCB concentrations and congener profiles before and after processing. As shown in Fig. 4, the total concentration of the ∑18PCBs increased after processing (before: 51.2 pg/g dw; after: 63.7 pg/g dw), which was primarily attributed to the rise in IN-PCB levels (before: 33.3 pg/g dw; after: 49.0 pg/g dw). In contrast, the concentrations of DL-PCBs remained largely consistent (before: 17.9 pg/g dw; after: 14.7 pg/g dw), with even a slight decrease. However, the increase in PCBs resulting from processing was not significantly different (p = 0.117), indicating that the processing is not a major source of PCB contamination in tea. Previous studies have indicated that processing can indeed lead to an increase in contaminant levels. According to Gao et al.[21], tea leaves can adsorb and accumulate environmental organic pollutants during processing, which may subsequently be transferred into the tea infusion. Bravo et al.[34] suggested that the processing (e.g., drying) of tea in the Polish market is one of the factors influencing changes in polycyclic aromatic hydrocarbon levels. As another type of persistent organic pollutant with similar physical and chemical properties, this also implies that organic contaminants are likely to be introduced during tea processing. After processing, the concentrations of TrCBs increased, whereas the levels of other PCB homologs remained largely unchanged. This led to a rise in the contribution of TrCBs (CB28) after processing (before: 39.9%; after: 55.2%). These findings are consistent with the earlier conclusion that the overall increase in total PCB content is primarily attributable to a rise in IN-PCB concentrations. These results suggest that the tea processing procedure primarily introduces contamination from TrCBs (CB28). This phenomenon may be attributed to the fact that PCB-related industrial products manufactured in China are predominantly composed of TrCBs, leading to their higher environmental accumulation compared with other homologs[3]. Moreover, lower-chlorinated biphenyls possess higher vapor pressure, which enhances their potential for long-range atmospheric transport. These compounds tend to accumulate in environmental media such as atmospheric particulates and soil systems, and may subsequently be absorbed by tea plants through deposition and root uptake processes.
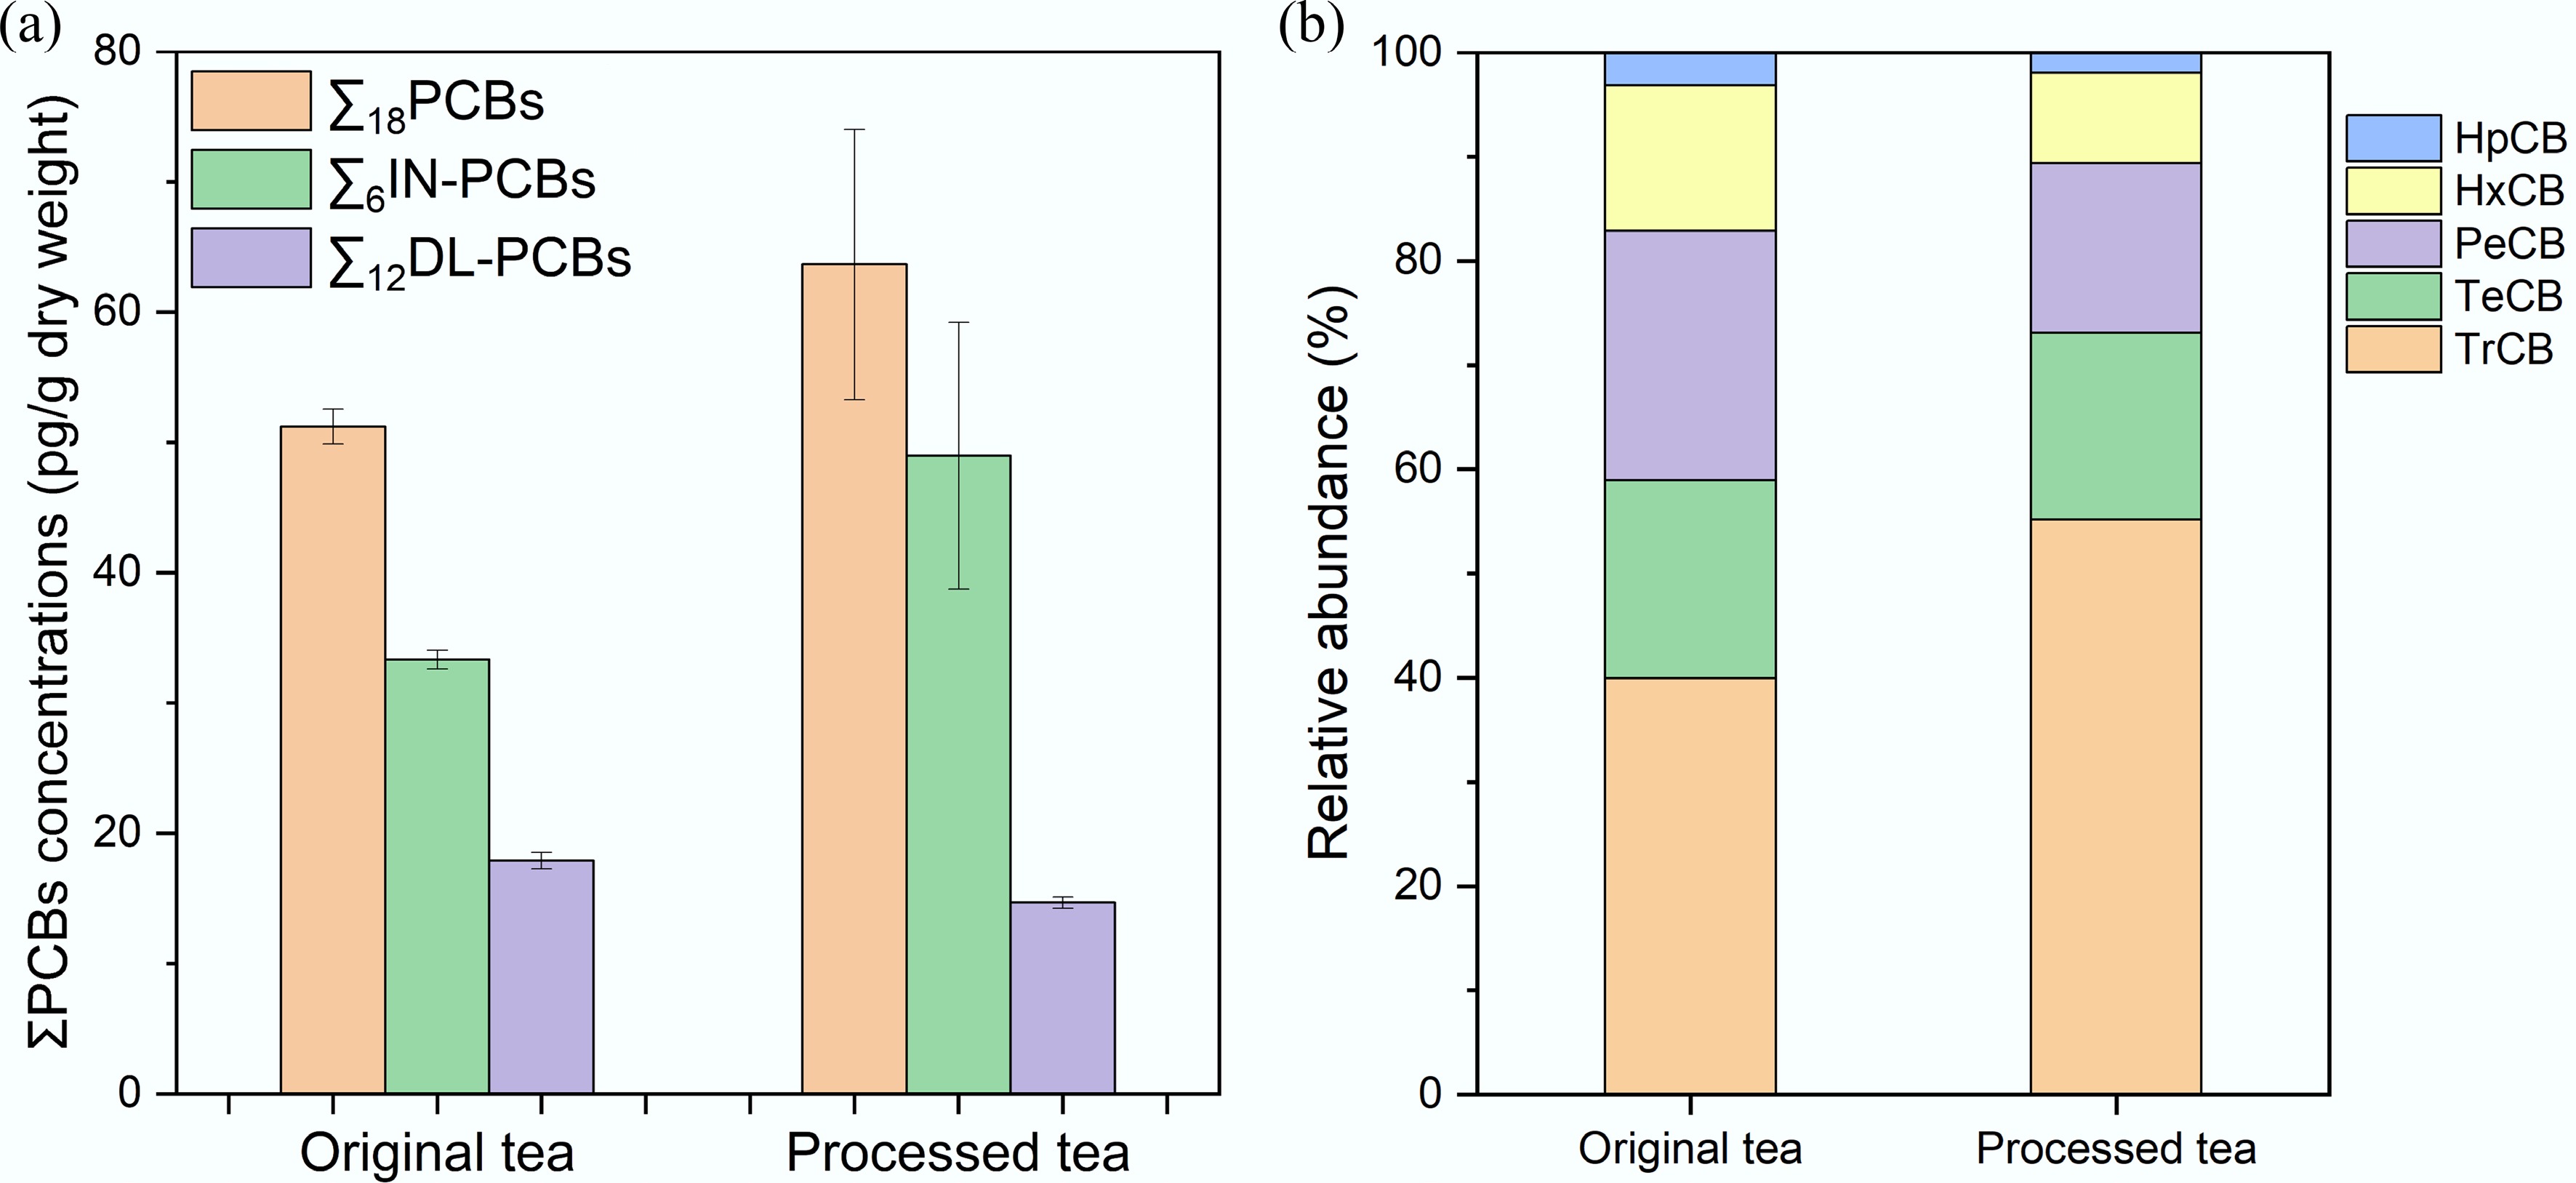
Figure 4.
(a) Concentrations and (b) relative abundance of PCBs in the original and processed tea samples.
Human exposure risks to PCBs through tea intake
-
Oral ingestion is one of the primary routes of human exposure to PCBs through the diet. Currently, 12 DL-PCBs are considered to be potentially adverse to human health. WHO uses TEFs to evaluate and compare the relative toxicity of different DL-PCB congeners. WHO established TEFs for DL-PCBs in 2005 and updated these values in 2022 (Supplementary Table S3). On the basis of Eq. (1), this study compared the TEQs calculated using both the original and updated TEFs (Supplementary Fig. S3). According to the TEF values established by the WHO in 2005, white tea exhibited the highest average TEQ (0.0291 pg TEQ/g dw), followed closely by dark tea (0.0290 pg TEQ/g dw), green tea (0.020 pg TEQ/g dw), oolong tea (0.018 pg TEQ/g dw), black tea (0.017 pg TEQ/g dw), and finally yellow tea (0.007 pg TEQ/g dw). Recalculation using the 2022 TEF values yielded lower TEQs and changed the ranking: Dark tea (0.022 pg TEQ/g dw) exhibited the highest level, surpassing white tea (0.016 pg TEQ/g dw), followed by black tea (0.012 pg TEQ/g dw), oolong tea (0.011 pg TEQ/g dw), green tea (0.011 pg TEQ/g dw), and yellow tea (0.006 pg TEQ/g dw). This change resulted from the increased TEF values assigned to CB77 and CB81, and the decreased TEF values for CB126 and CB169. Stadion et al.[7] reported the average TEQ of Polychlorinated dibenzo-p-dioxins and polychlorinated dibenzofurans (PCDD/Fs) and DL-PCBs in coffee, cocoa, tea, and infusions was 0.007 pg WHO2005-TEQ/g ww, which is similar to the TEQ of yellow tea, the lowest value in this study. TEQ levels in studies of plant-derived foods in China are generally higher than those observed in this study. A study by Zheng et al.[10] on cereals in China determined that the median TEQ for DL-PCBs was 0.040 pg TEQ/g ww. Sun et al.[11] found that cereals (9.0–12.1 pg TEQ/kg fw), legumes (10.4–14.5 pg TEQ/kg fw), and potatoes (2.0–8.4 pg TEQ/kg fw) exhibited relatively high TEQ levels, whereas vegetables (0.9–7.7 pg TEQ/kg fw) showed comparatively lower values. Similarly, Stadion et al.[7] reported higher average TEQ levels in plant-derived foods in Germany, with grains and grain-based products (0.026 pg WHO2005-TEQ/g ww) and legumes and nuts (0.037 pg WHO2005-TEQ/g ww) having the highest levels, whereas vegetables (0.015 pg WHO2005-TEQ/g ww) and fruits (0.013 pg WHO2005-TEQ/g ww) showed lower TEQs. These TEQs were slightly higher than those in tea in this study. Root crops (0.000–0.004 pg TEQ/g) and tuber crops (0.011 pg TEQ/g) in Thailand showed lower TEQs than those reported in this study[5]. A study by Klees et al.[25] documented substantially elevated TEQs of DL-PCBs in curly kale, ranging from 0.050 to 0.40 ng TEQ/kg in areas adjacent to electronic waste processing facilities in Germany.
The EDIs and EWIs of the six varieties of tea can be used to assess potential human health risks associated with daily tea consumption. Based on Eqs (2) and (3), the EDIs and EWIs for the six varieties of tea, calculated using the TEQs of 2022, are presented in Table 1. Green tea exhibited the highest average EWI (3.01 × 10⁻³ pg WHO-TEQ/kg bw/week), followed by black tea (8.83 × 10⁻⁴ pg WHO-TEQ/kg bw/week), oolong tea (5.39 × 10⁻⁴ pg WHO-TEQ/kg bw/week), white tea (2.17 × 10⁻⁴ pg WHO-TEQ/kg bw/week), and dark tea (1.50 × 10⁻⁴ pg WHO-TEQ/kg bw/week). Yellow tea showed the lowest EWI, of only 1.46 × 10⁻⁵ pg WHO-TEQ/kg bw/week. Although green tea is not the most toxic variety, its daily consumption exceeds that of other tea categories, resulting in a higher EWI than the other five tea categories. Nevertheless, for all tea varieties, the EDIs were significantly lower than both the tolerable weekly intake (TWI) of 2 pg WHO-TEQ/kg bw/week set by the EFSA Panel on Contaminants in the Food Chain[35] and the provisional tolerable monthly intake (PTMI) of 70 pg WHO-TEQ/kg bw/month established by the Joint Food and Agriculture of Organization (FAO)/WHO Expert Committee on Food Additives[36].
Table 1. The EDIs and EWIs for tea samples from six categories
EDI (× 10−7 pg WHO-TEQ/kg bw/day) EWI (× 10−6 pg WHO-TEQ/kg bw/week) Black tea Dark tea Green tea Oolong tea White tea Yellow tea Black tea Dark tea Green tea Oolong tea White tea Yellow tea Min 290 42.2 1,310 147 114 5.42 203 29.6 915 103 79.5 3.79 Mean 1,260 214 4,300 770 310 20.9 883 150 3,010 539 217 14.6 Median 1,160 131 3,250 578 181 13.8 815 91.4 2,270 404 127 9.64 95% 2,830 785 9,860 1,570 766 42.5 1,980 550 6,900 1,100 536 29.7 Max 3,959 1,190 32,300 1,650 957 45.7 2,770 836 22,600 1,150 670 32.0 The majority of China's tea exports are distributed across 19 countries (Supplementary Table S4). The EWIs of PCBs from Chinese tea were the lowest in the United States, at 1.46 × 10⁻⁴ pg WHO-TEQ/kg bw/week and highest in Mauritania, at 0.0242 pg WHO-TEQ/kg bw/week (Fig. 5). Five countries exhibited higher EWI values than China, including Senegal (7.88 × 10⁻³ pg WHO-TEQ/kg bw/week), Morocco (10.6 × 10⁻³ pg WHO-TEQ/kg bw/week), Togo (0.0155 pg WHO-TEQ/kg bw/week), Gambia (0.0172 pg WHO-TEQ/kg bw/week), and Mauritania (0.0242 pg WHO-TEQ/kg bw/week). The EWIs for all countries were below 2 pg WHO-TEQ/kg bw/week, indicating that human exposure to PCBs from Chinese tea in these countries poses no significant human health risk.
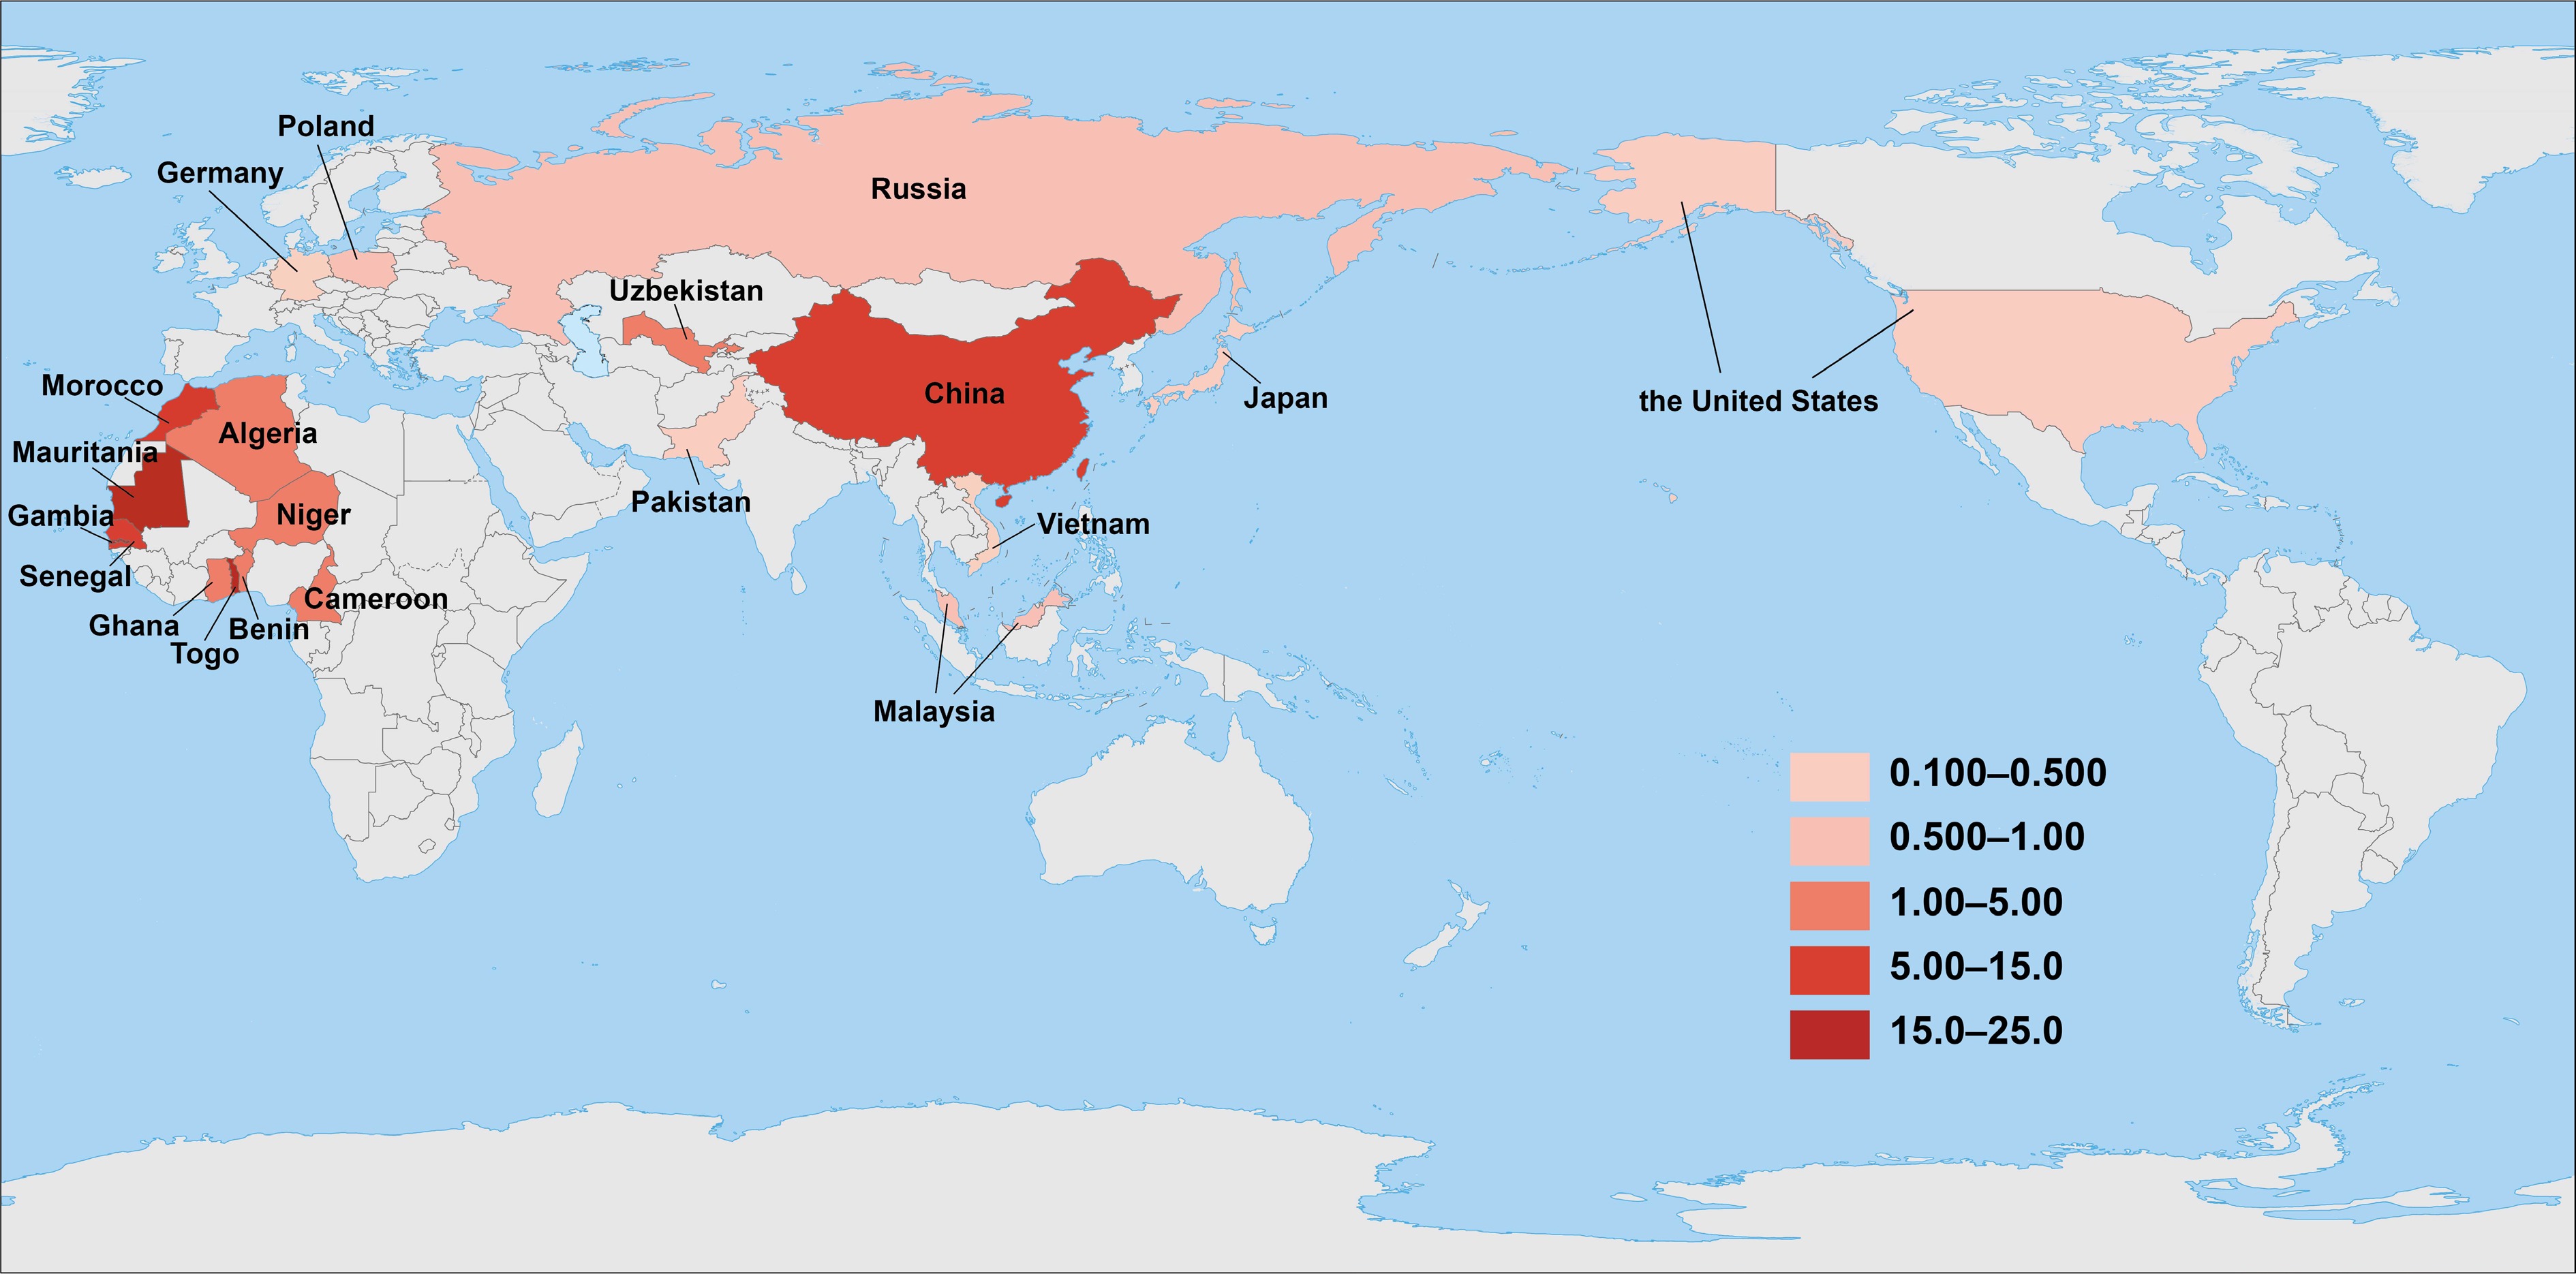
Figure 5.
EWIs (×10−3 pg WHO-TEQ /kg bw/week) of PCBs for adult populations in 20 countries worldwide (map source: Standard Map Service, Ministry of Natural Resources of China, GS(2016)1665).
However, the risk assessment in this study is only for tea intake, not total dietary exposure. Since tea is just one of the foods consumed in daily human life, people also consume a variety of other foods and are exposed to numerous other potential sources of PCB exposure. Moreover, because of the persistence and bioaccumulation properties of PCBs, humans tend to accumulate higher levels of PCBs than those present in plant- or animal-derived foods. Therefore, continuous monitoring of dietary PCB intake remains necessary.
-
This study investigated the contamination characteristics of PCBs in six major commercial tea varieties sourced from 16 provinces across China. The PCB levels varied among different tea varieties and provinces. Notably, the concentrations of IN-PCBs were significantly higher than those of DL-PCBs, and a correlation was identified between them (R2 = 0.725). TrCBs were the predominant contributors to PCB contamination. However, Hubei province exhibited a distinct contamination profile, characterized by a higher proportion of TeCBs. The sources of PCB contamination in tea are multifaceted. Apart from environmental transfer, manufacturing processes could also result in an increase in PCB concentrations in tea, but it is not a significant contamination source (p = 0.117). The TEQs of PCBs in tea are relatively low. According to the EDI assessment, the current PCB levels in tea do not pose a health risk. However, continued attention to PCB risks in food is warranted because of their properties as POPs. This study offers scientific evidence for protecting consumers' health, ensuring the quality and safety of tea products, and promoting the sustainable development of the tea industry.
-
It accompanies this paper at: https://doi.org/10.48130/newcontam-0026-0019.
-
Not applicable.
-
The authors confirm their contributions to the paper as follows: Xingyi Wu: methodology, writing – original draft preparation; Jianing Xin: formal analysis; Yaqun Fan: formal analysis; Su Zhang: formal analysis; Xiaoxu Han: investigation; Jun Cao: formal analysis; Wenfeng Zhou: supervision; Haixiang Gao: supervision; Shujun Dong: conceptualization, writing – review and editing. All authors reviewed the results and approved the final version of the manuscript.
-
All data generated or analyzed during this study are included in this published article and its supplementary information files.
-
This study was supported by the National Technology Innovation Center for Dairy and Agricultural Science (Grant No. 2024-QNJJ-002) and Technology Innovation Program (Grant No. ASTIP: 1610072025003). The authors declare no conflict of interest.
-
The author declares that there are no known competing financial interests or personal relationships that could have appeared to influence the work reported in this paper.
-
Full list of author information is available at the end of the article.
- The supplementary files can be downloaded from here.
- Copyright: © 2026 by the author(s). Published by Maximum Academic Press, Fayetteville, GA. This article is an open access article distributed under Creative Commons Attribution License (CC BY 4.0), visit https://creativecommons.org/licenses/by/4.0/.
-
About this article
Cite this article
Wu X, Xin J, Fan Y, Zhang S, Han X, et al. 2026. Profiling of polychlorinated biphenyls in Chinese tea: national distribution, variety-specific variations, and the impact of processing. New Contaminants 2: e021 doi: 10.48130/newcontam-0026-0019 

Profiling of polychlorinated biphenyls in Chinese tea: national distribution, variety-specific variations, and the impact of processing
- Received: 22 April 2026
- Revised: 27 May 2026
- Accepted: 15 June 2026
- Published online: 10 July 2026
Abstract: Polychlorinated biphenyls (PCBs) are legacy persistent organic pollutants that continue to pose risks to the environment and human health through dietary exposure. However, data on PCBs in commercial tea—one of the most consumed beverages worldwide—remain limited. This study provides a comprehensive characterization of six indicator PCBs and 12 dioxin-like PCBs in tea across China, elucidating their occurrence, congener profiles, and geographic variation, while evaluating the impacts of processing and associated human health risks. In total, 192 commercial tea samples, encompassing all six primary tea categories (green, black, dark, oolong, white, and yellow tea), were collected from 16 Chinese provinces for analysis. The total PCB concentrations (Σ18PCBs) in all samples ranged from 9.36 to 4490 pg/g dry weight (dw), with a mean of 211 pg/g dw. Dark tea exhibited the highest mean concentration (549 pg/g dw), followed by oolong tea (241 pg/g dw). Spatial analysis revealed that PCB levels were significantly higher in industrialized areas, particularly in Guangdong (mean: 505 pg/g dw). Regarding congener patterns, CB-28 and CB-52 predominated across all samples. Although tea processing elevated the concentrations of the indicator PCBs, it had limited effects on dioxin-like PCBs, implying a potential processing-derived contamination. Health risk assessments based on toxic equivalency and daily intake indicated that the current PCB levels in Chinese tea generally pose negligible risks to consumers. However, the relatively high PCB concentrations detected in certain samples warrant ongoing surveillance for high-consumption populations. This study provides China's first tea PCB baseline and highlights tea processing as a potential contamination pathway.
-
Key words:
- Polychlorinated biphenyls /
- Commercial tea /
- Processing /
- Profiles /
- Health risk