-
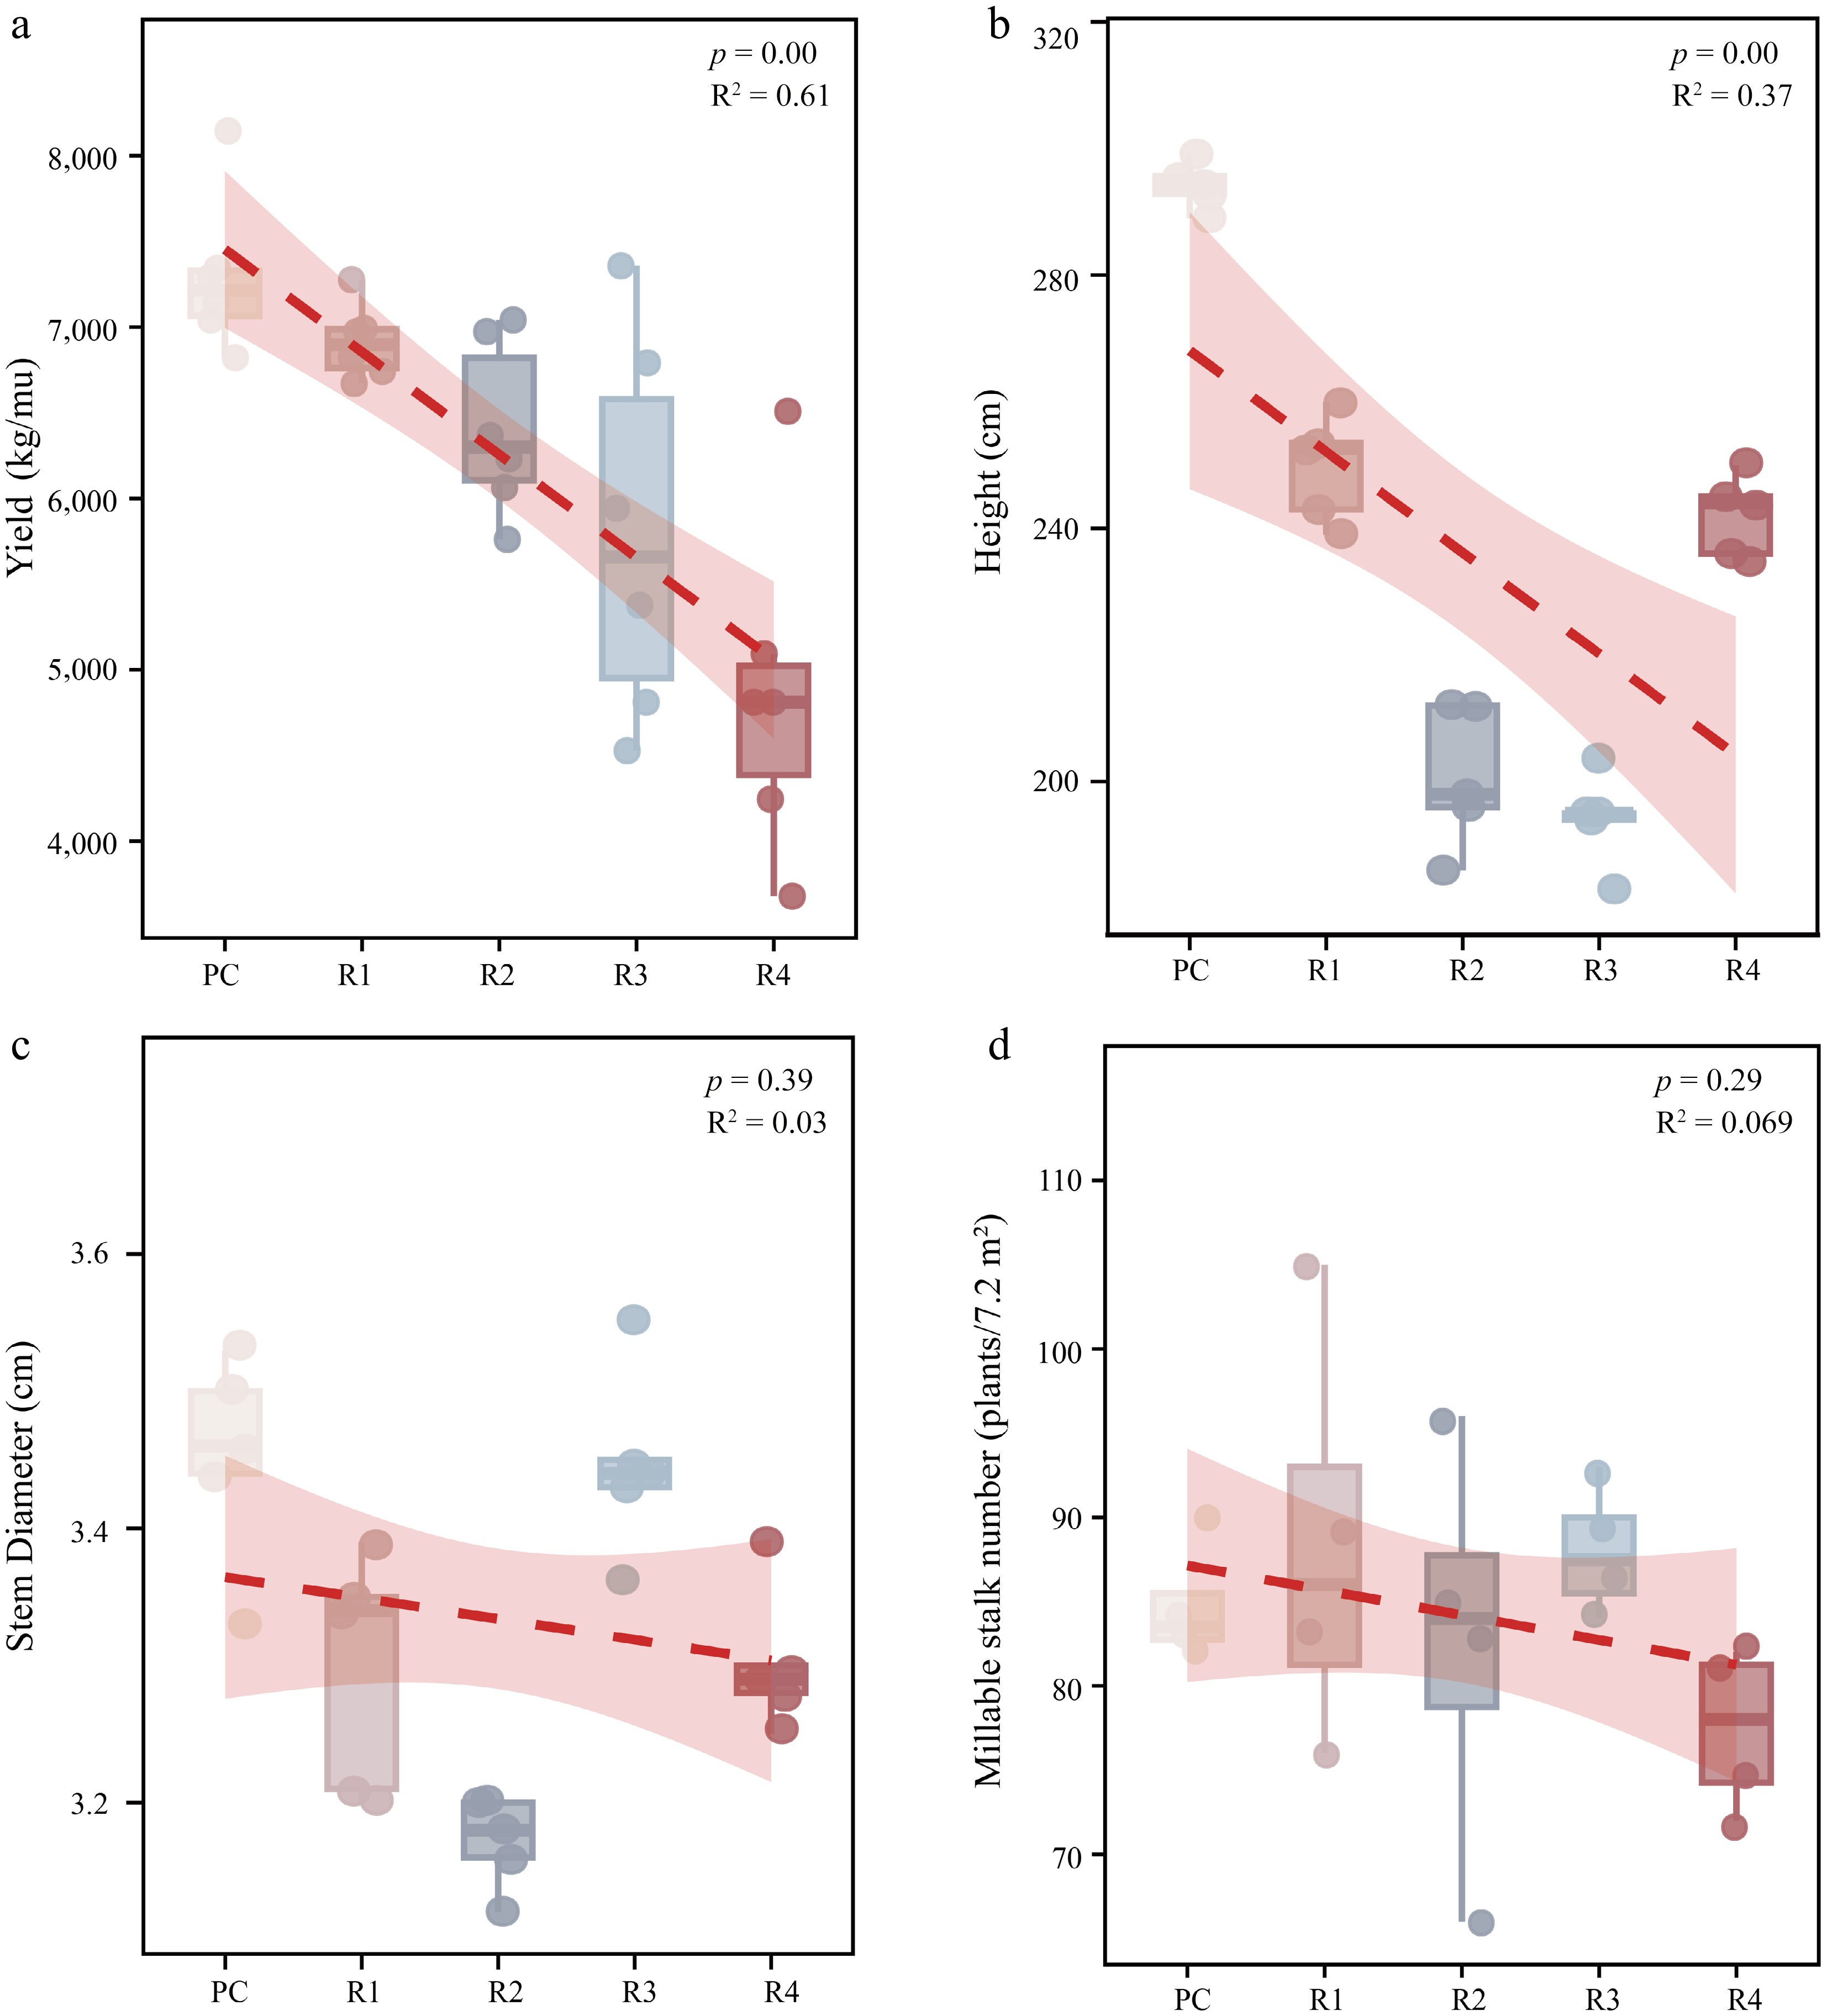
Figure 1.
Trends of major agronomic traits and yield in sugarcane under different planting years. (a) Yield. (b) Height. (c) Stem diameter. (d) Millable stalk number. In each panel, the box plots show the data distribution, the scattered points represent biological replicates, the red dashed line indicates the linear trend, and the shaded area denotes the 95% confidence interval. The p-value and R2 of the linear regression are displayed. PC, plant cane; R1–R4, the first to fourth ratoon crops.
-
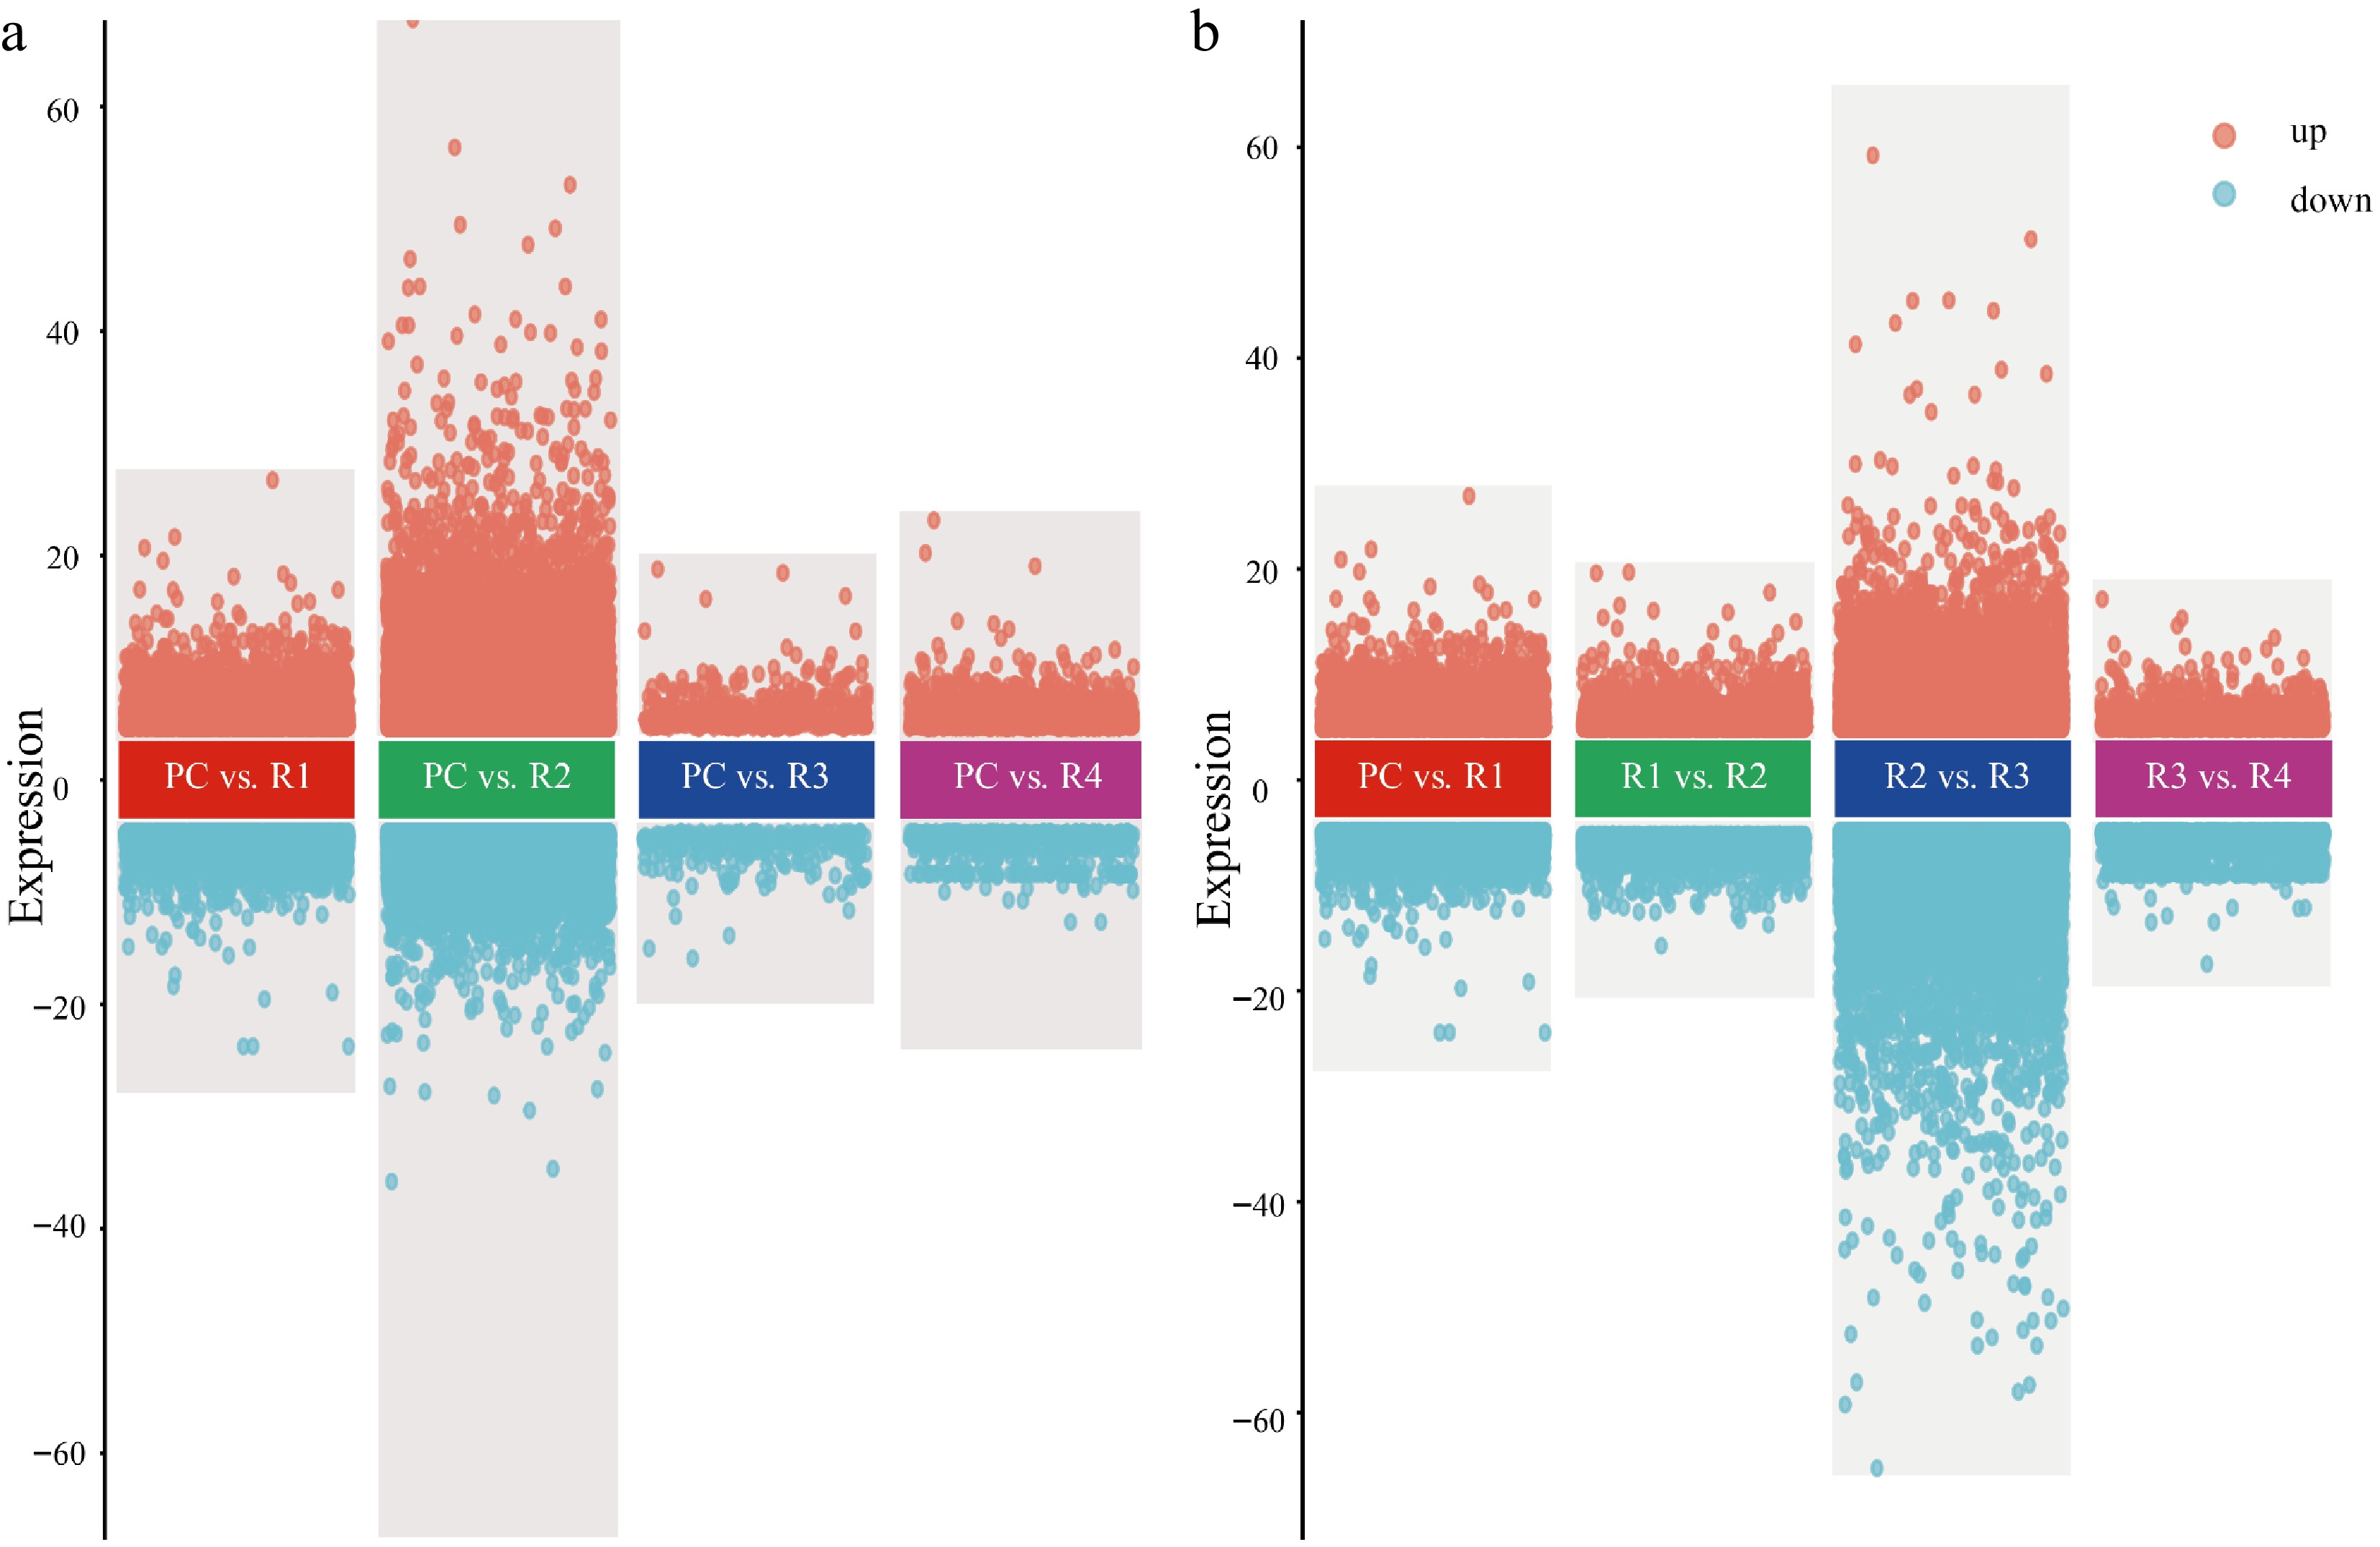
Figure 2.
Gene expression dynamics across sugarcane planting years. (a) Differential gene expression comparing plant cane (PC) with each ratoon year (R1–R4). (b) Differential expression between consecutive ratoon years (R1 vs. R2, R2 vs. R3, R3 vs. R4). Genes with a false discovery rate (FDR) < 0.05 and |log2fold change| ≥ 1 are considered significant. Orange and blue dots represent upregulated and downregulated genes, respectively. The y-axis indicates the log2fold change. Shaded areas highlight each comparison.
-
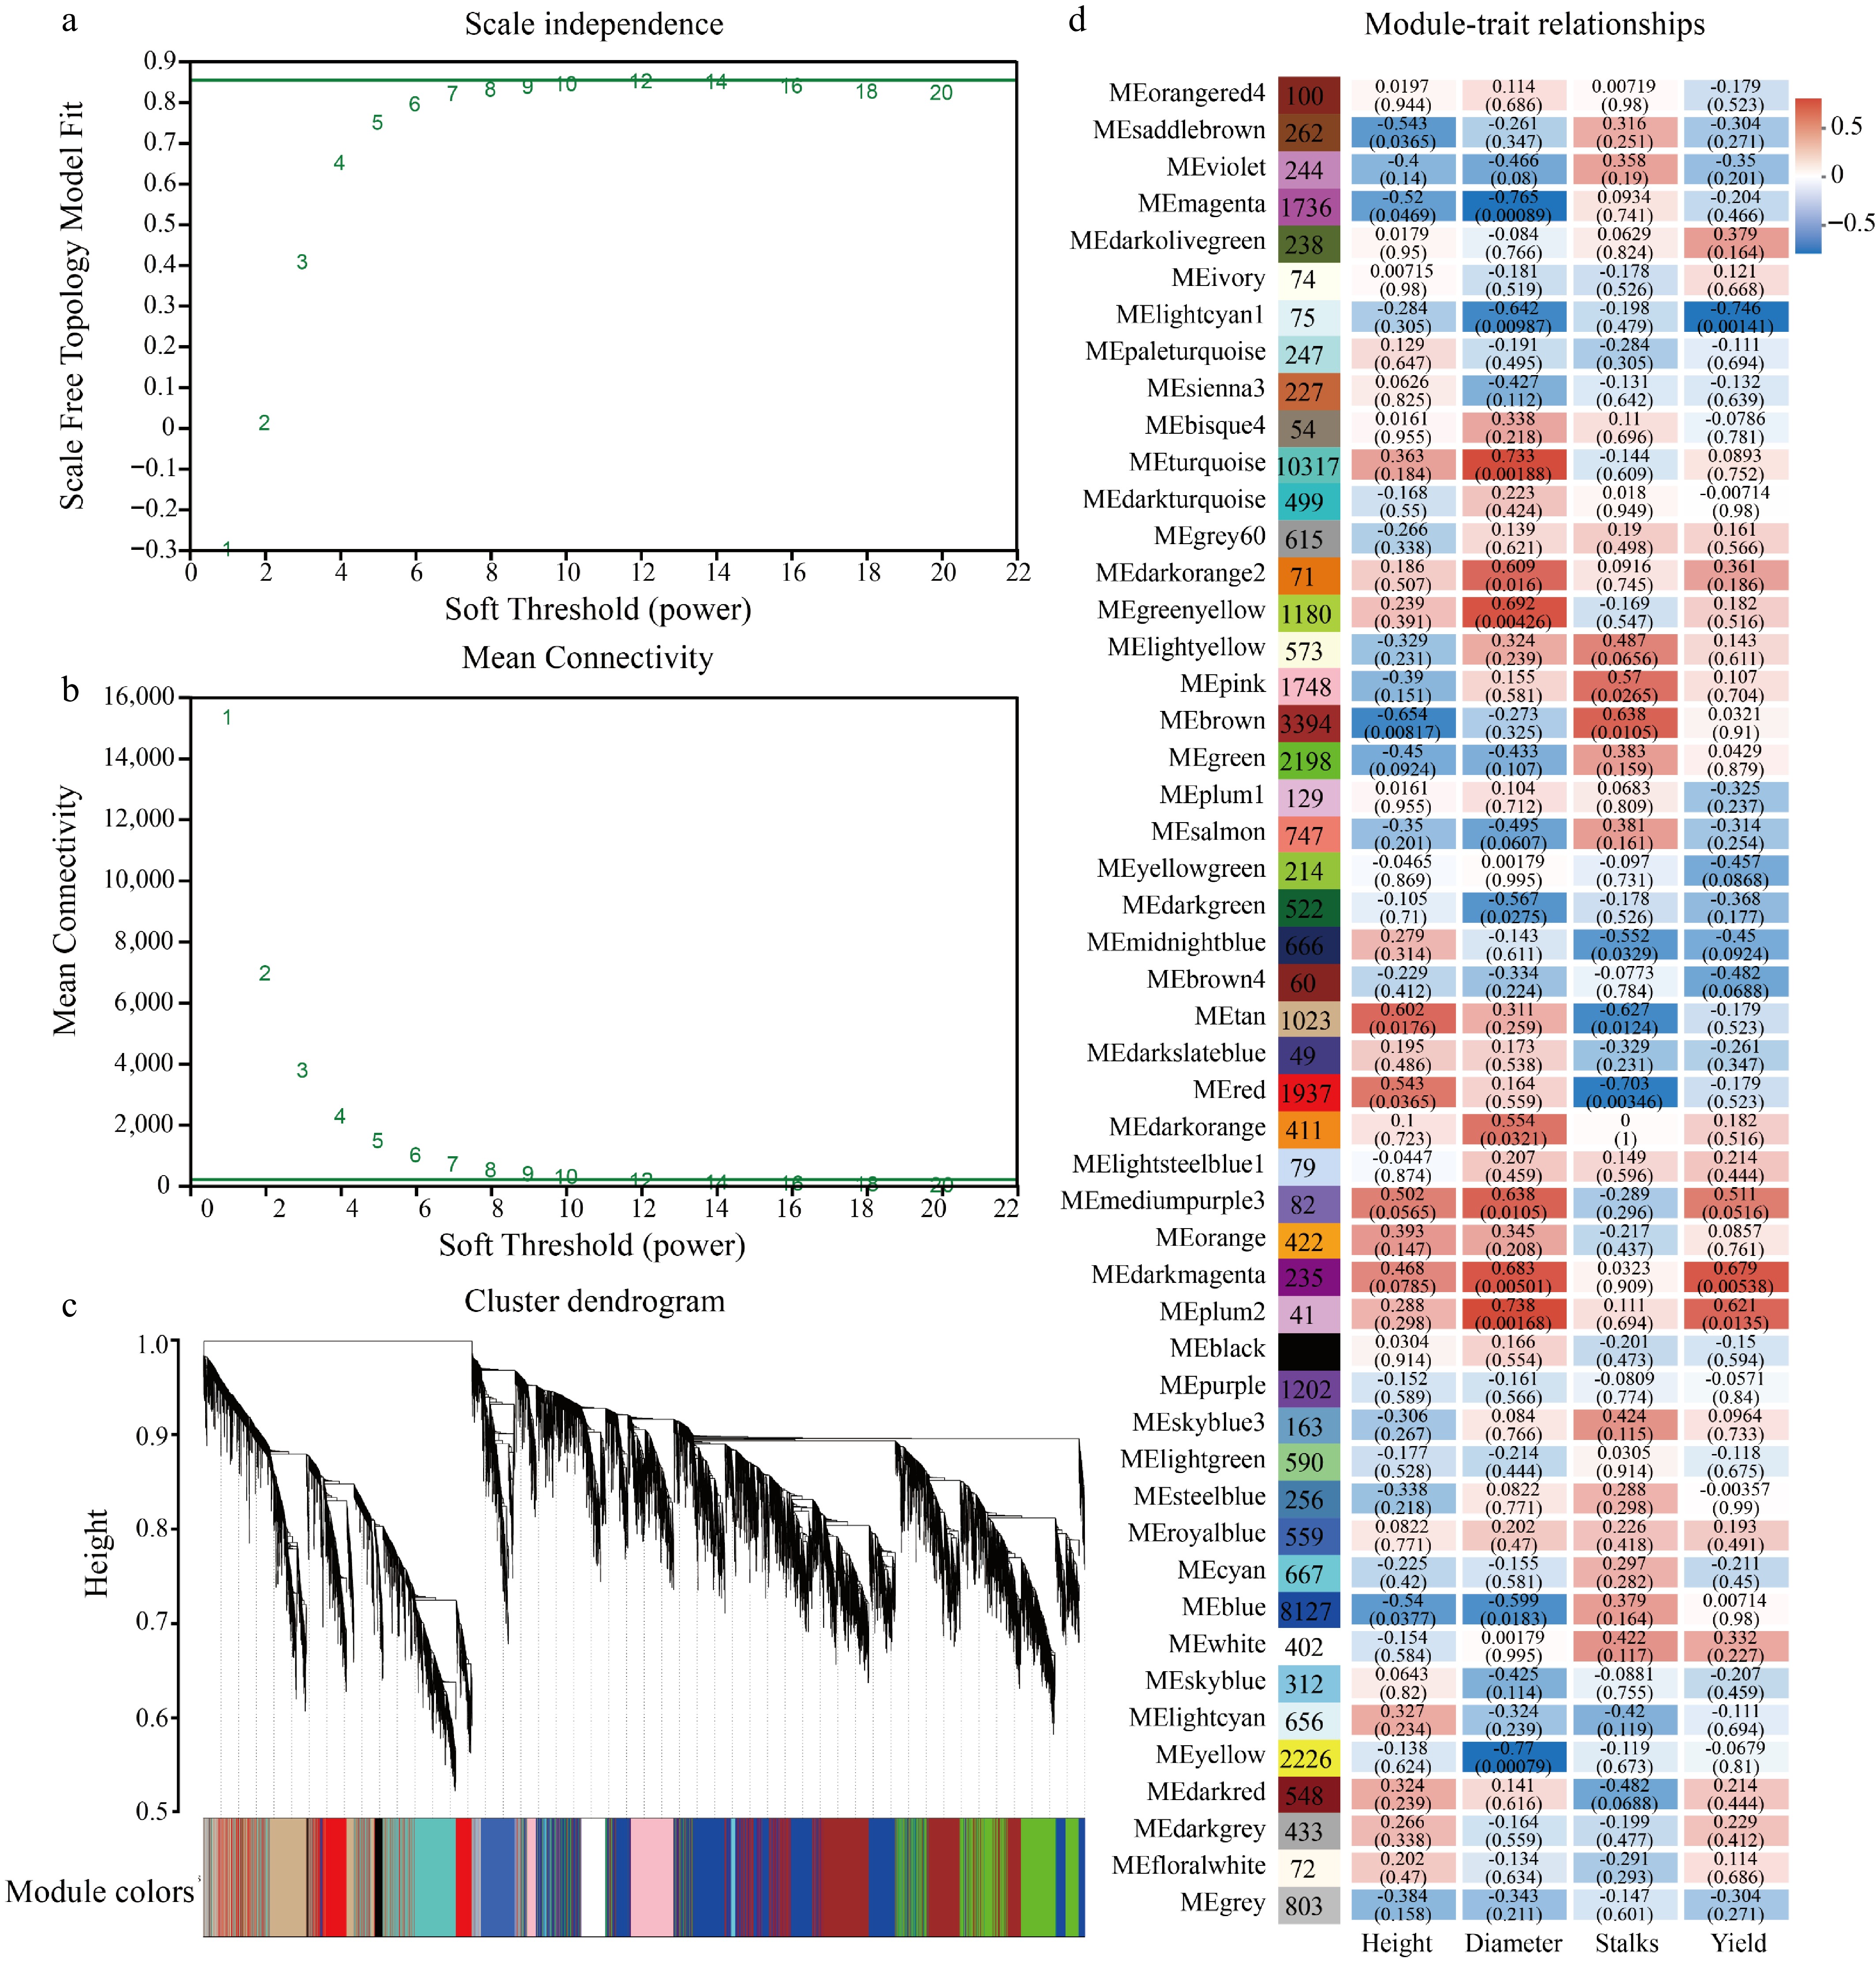
Figure 3.
Co-expression network analysis (WGCNA) of sugarcane yield-related genes. (a) Soft-thresholding power selection. The scale-free topology model fit is plotted against β. A fit index > 0.85 (red dashed line) was used as the criterion, leading to the selection of β = 12. (b) Mean connectivity under different β values. Connectivity decreased with increasing β, with β = 12 maintaining a biologically appropriate level. (c) Hierarchical clustering dendrogram of co-expression modules. A total of 50 modules were identified and are color-coded in the band below. (d) Module-trait correlation heatmap. Red/blue indicates positive/negative correlations; numbers inside and outside parentheses denote the p-value and correlation coefficient (r), respectively.
-
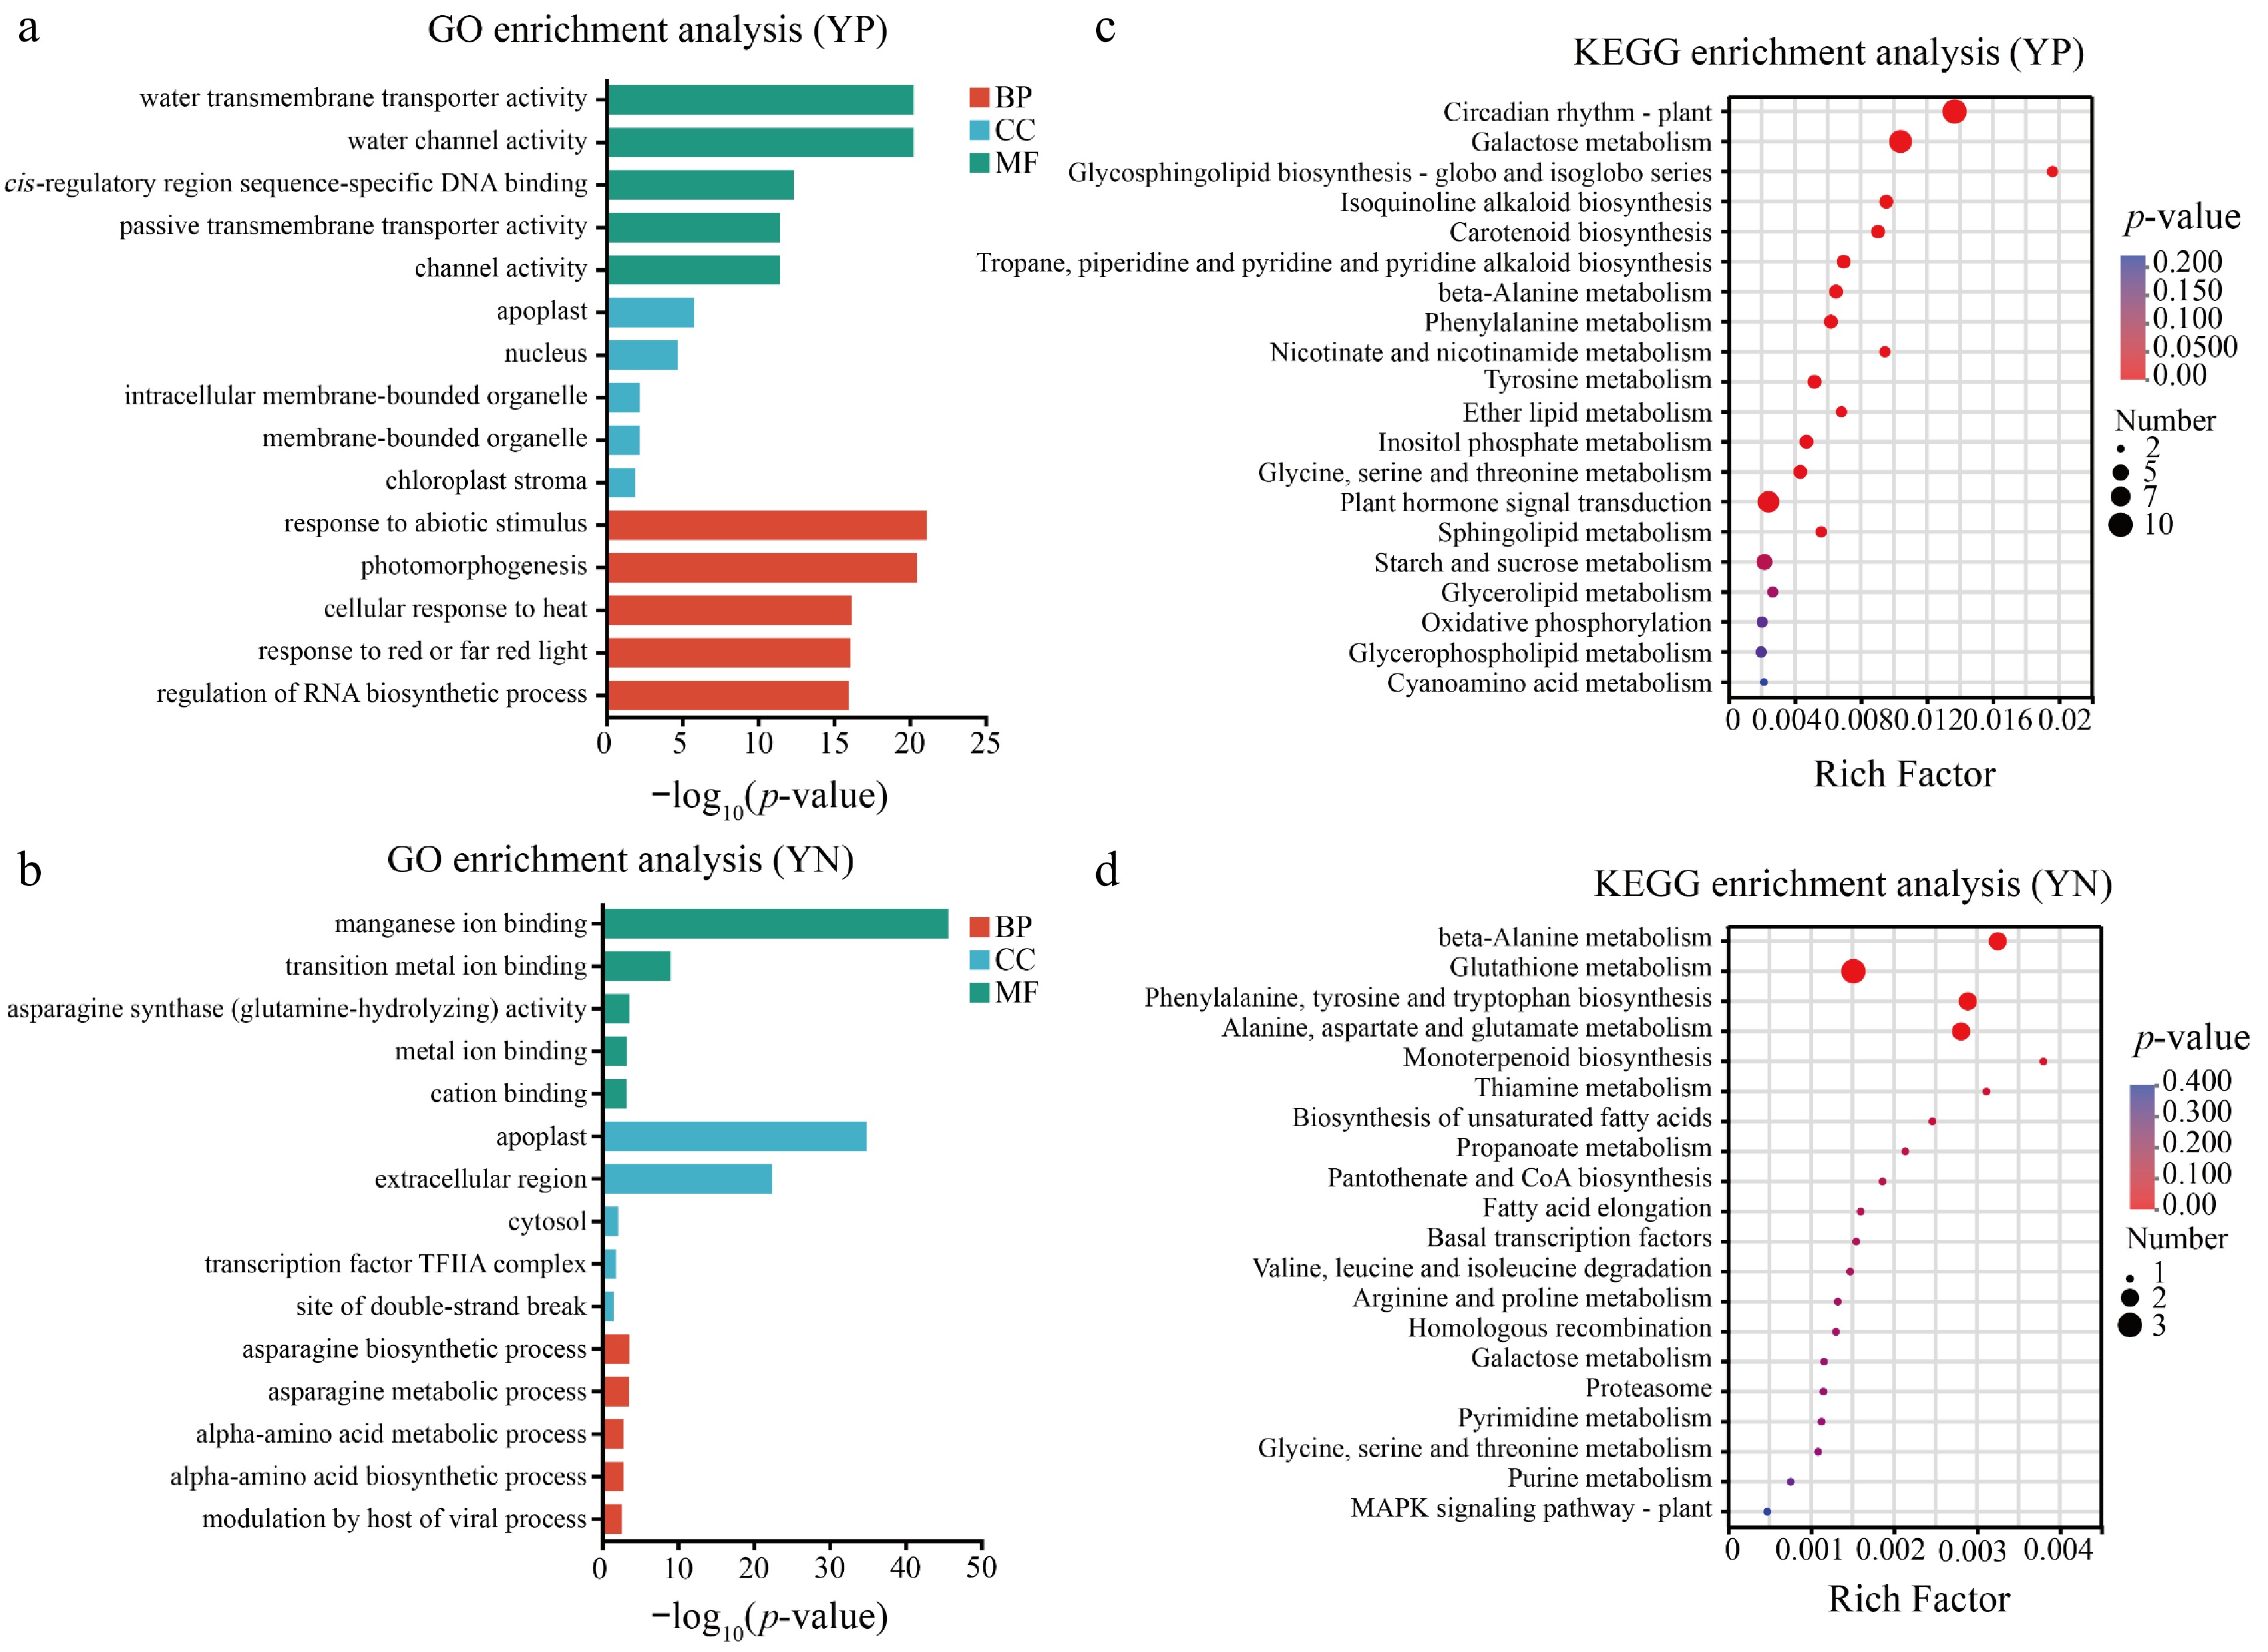
Figure 4.
GO and KEGG enrichment analyses of two distinct gene sets, YP and YN. GO enrichment results for (a) the YP and (b) YN gene sets, showing the top significantly enriched biological processes (BP), cellular components (CC), and molecular functions (MF). The x-axis represents the −log10(p-value) of enrichment significance. KEGG pathway enrichment analysis for the (c) YP and (d) YN gene sets. Dot size indicates the number of genes enriched in each pathway, while dot color reflects enrichment significance (p-value). The x-axis shows the enrichment factor, indicating the ratio of genes enriched to total genes in each pathway.
-
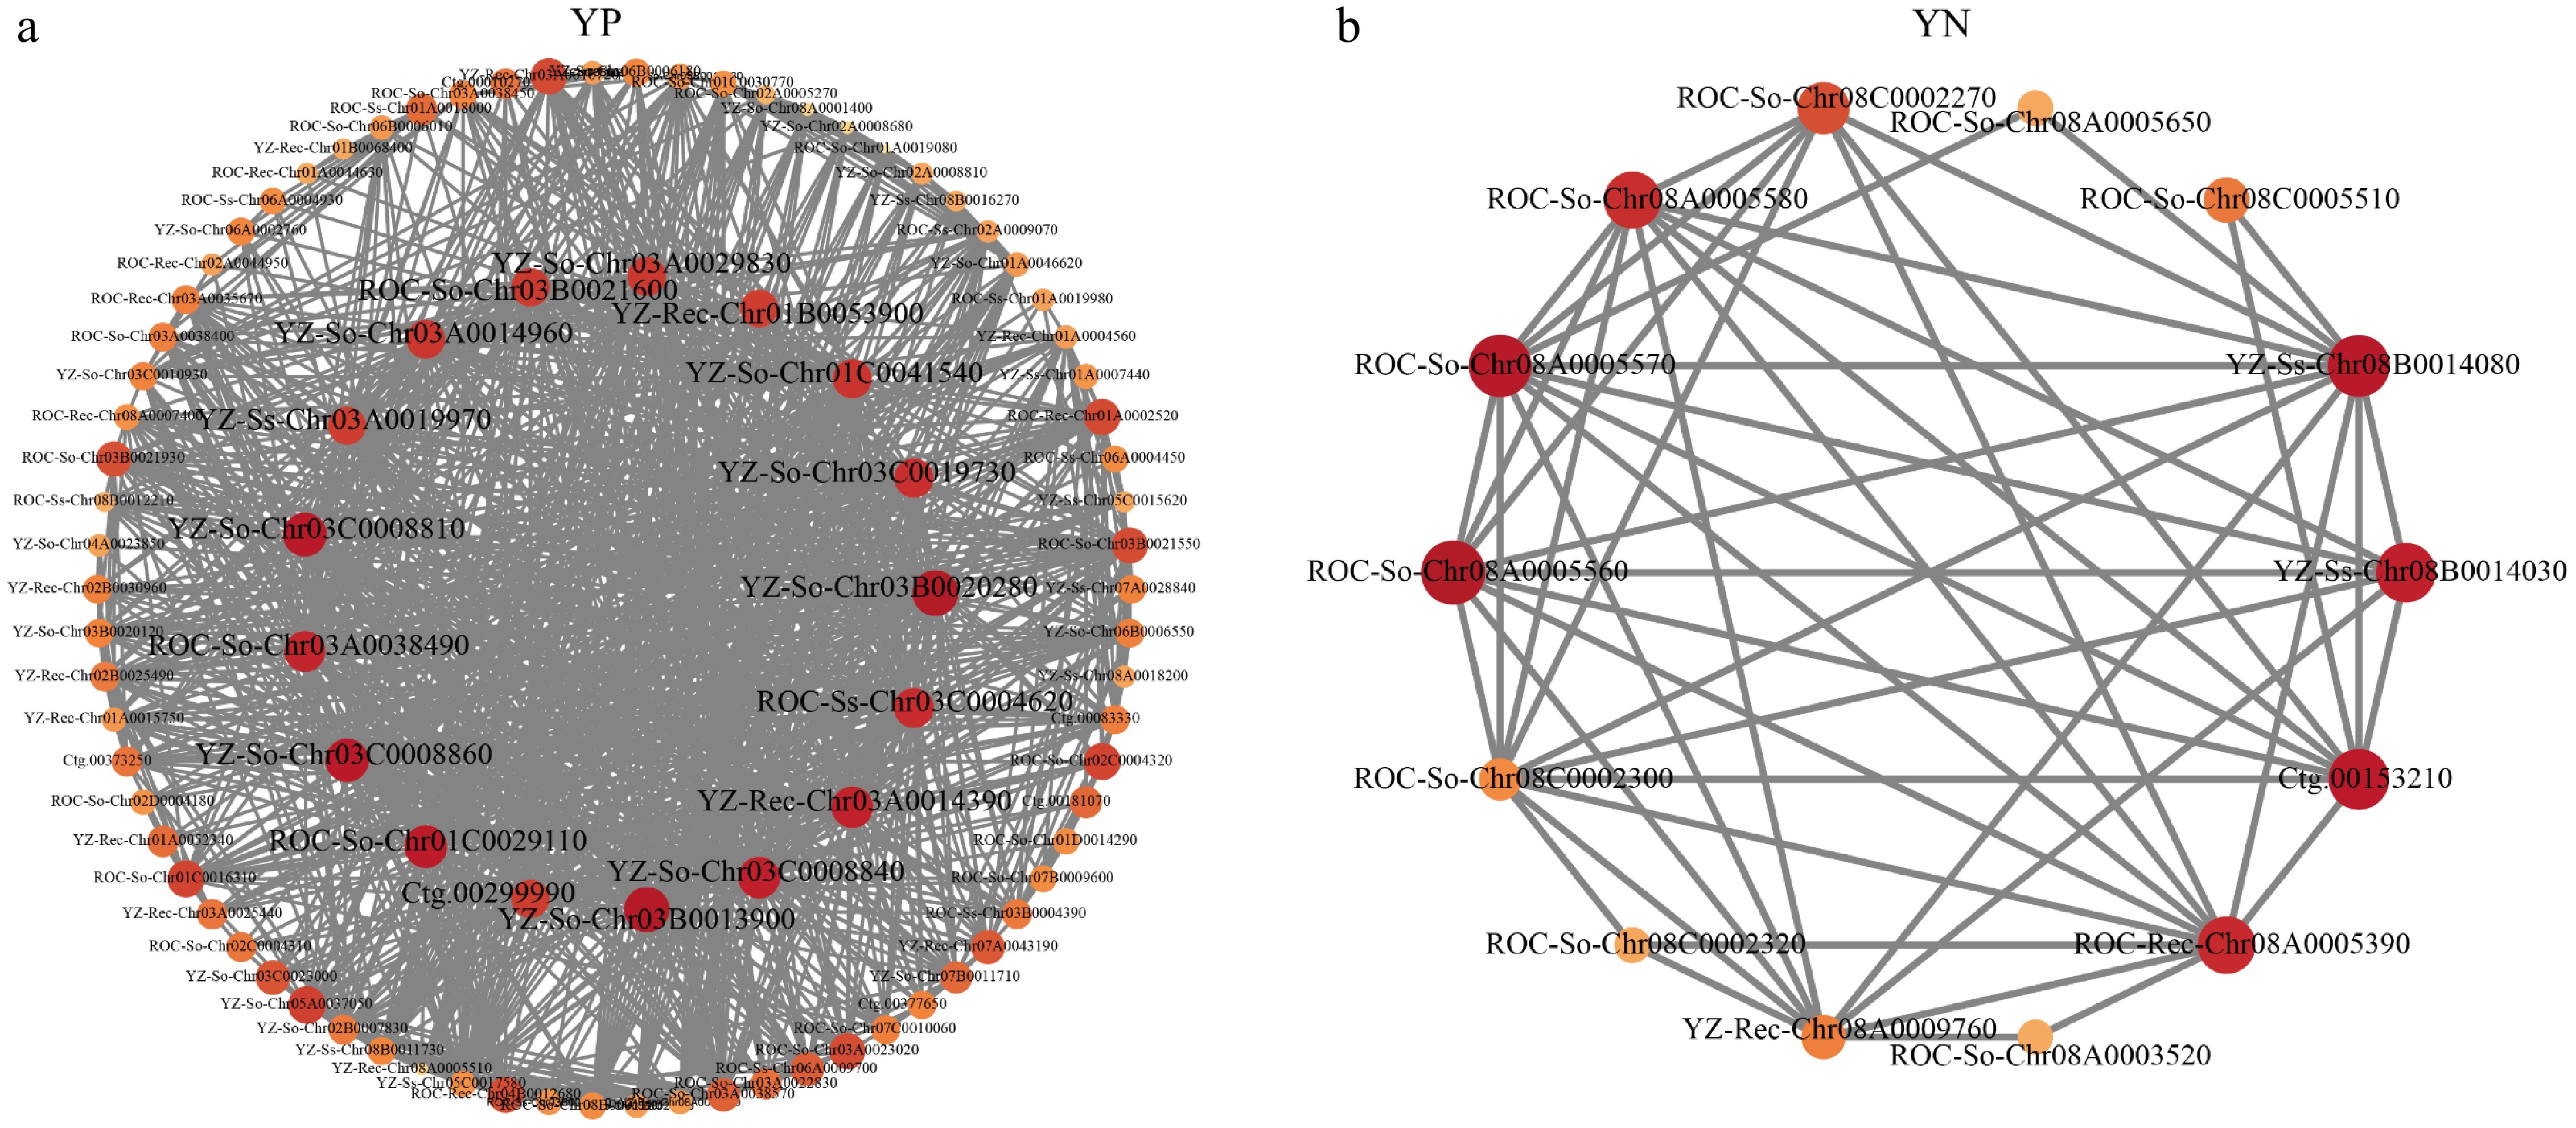
Figure 5.
Co-expression networks of core genes in YP and YN modules. (a) YP module network containing 17 hub genes (dark red nodes) and their co-expressed genes. (b) YN module network containing six hub genes (dark red nodes) and their co-expressed genes. Node size reflects gene connectivity; edges represent co-expression relationships. Selection criteria: kME > 0.9, weight > 0.1.
-
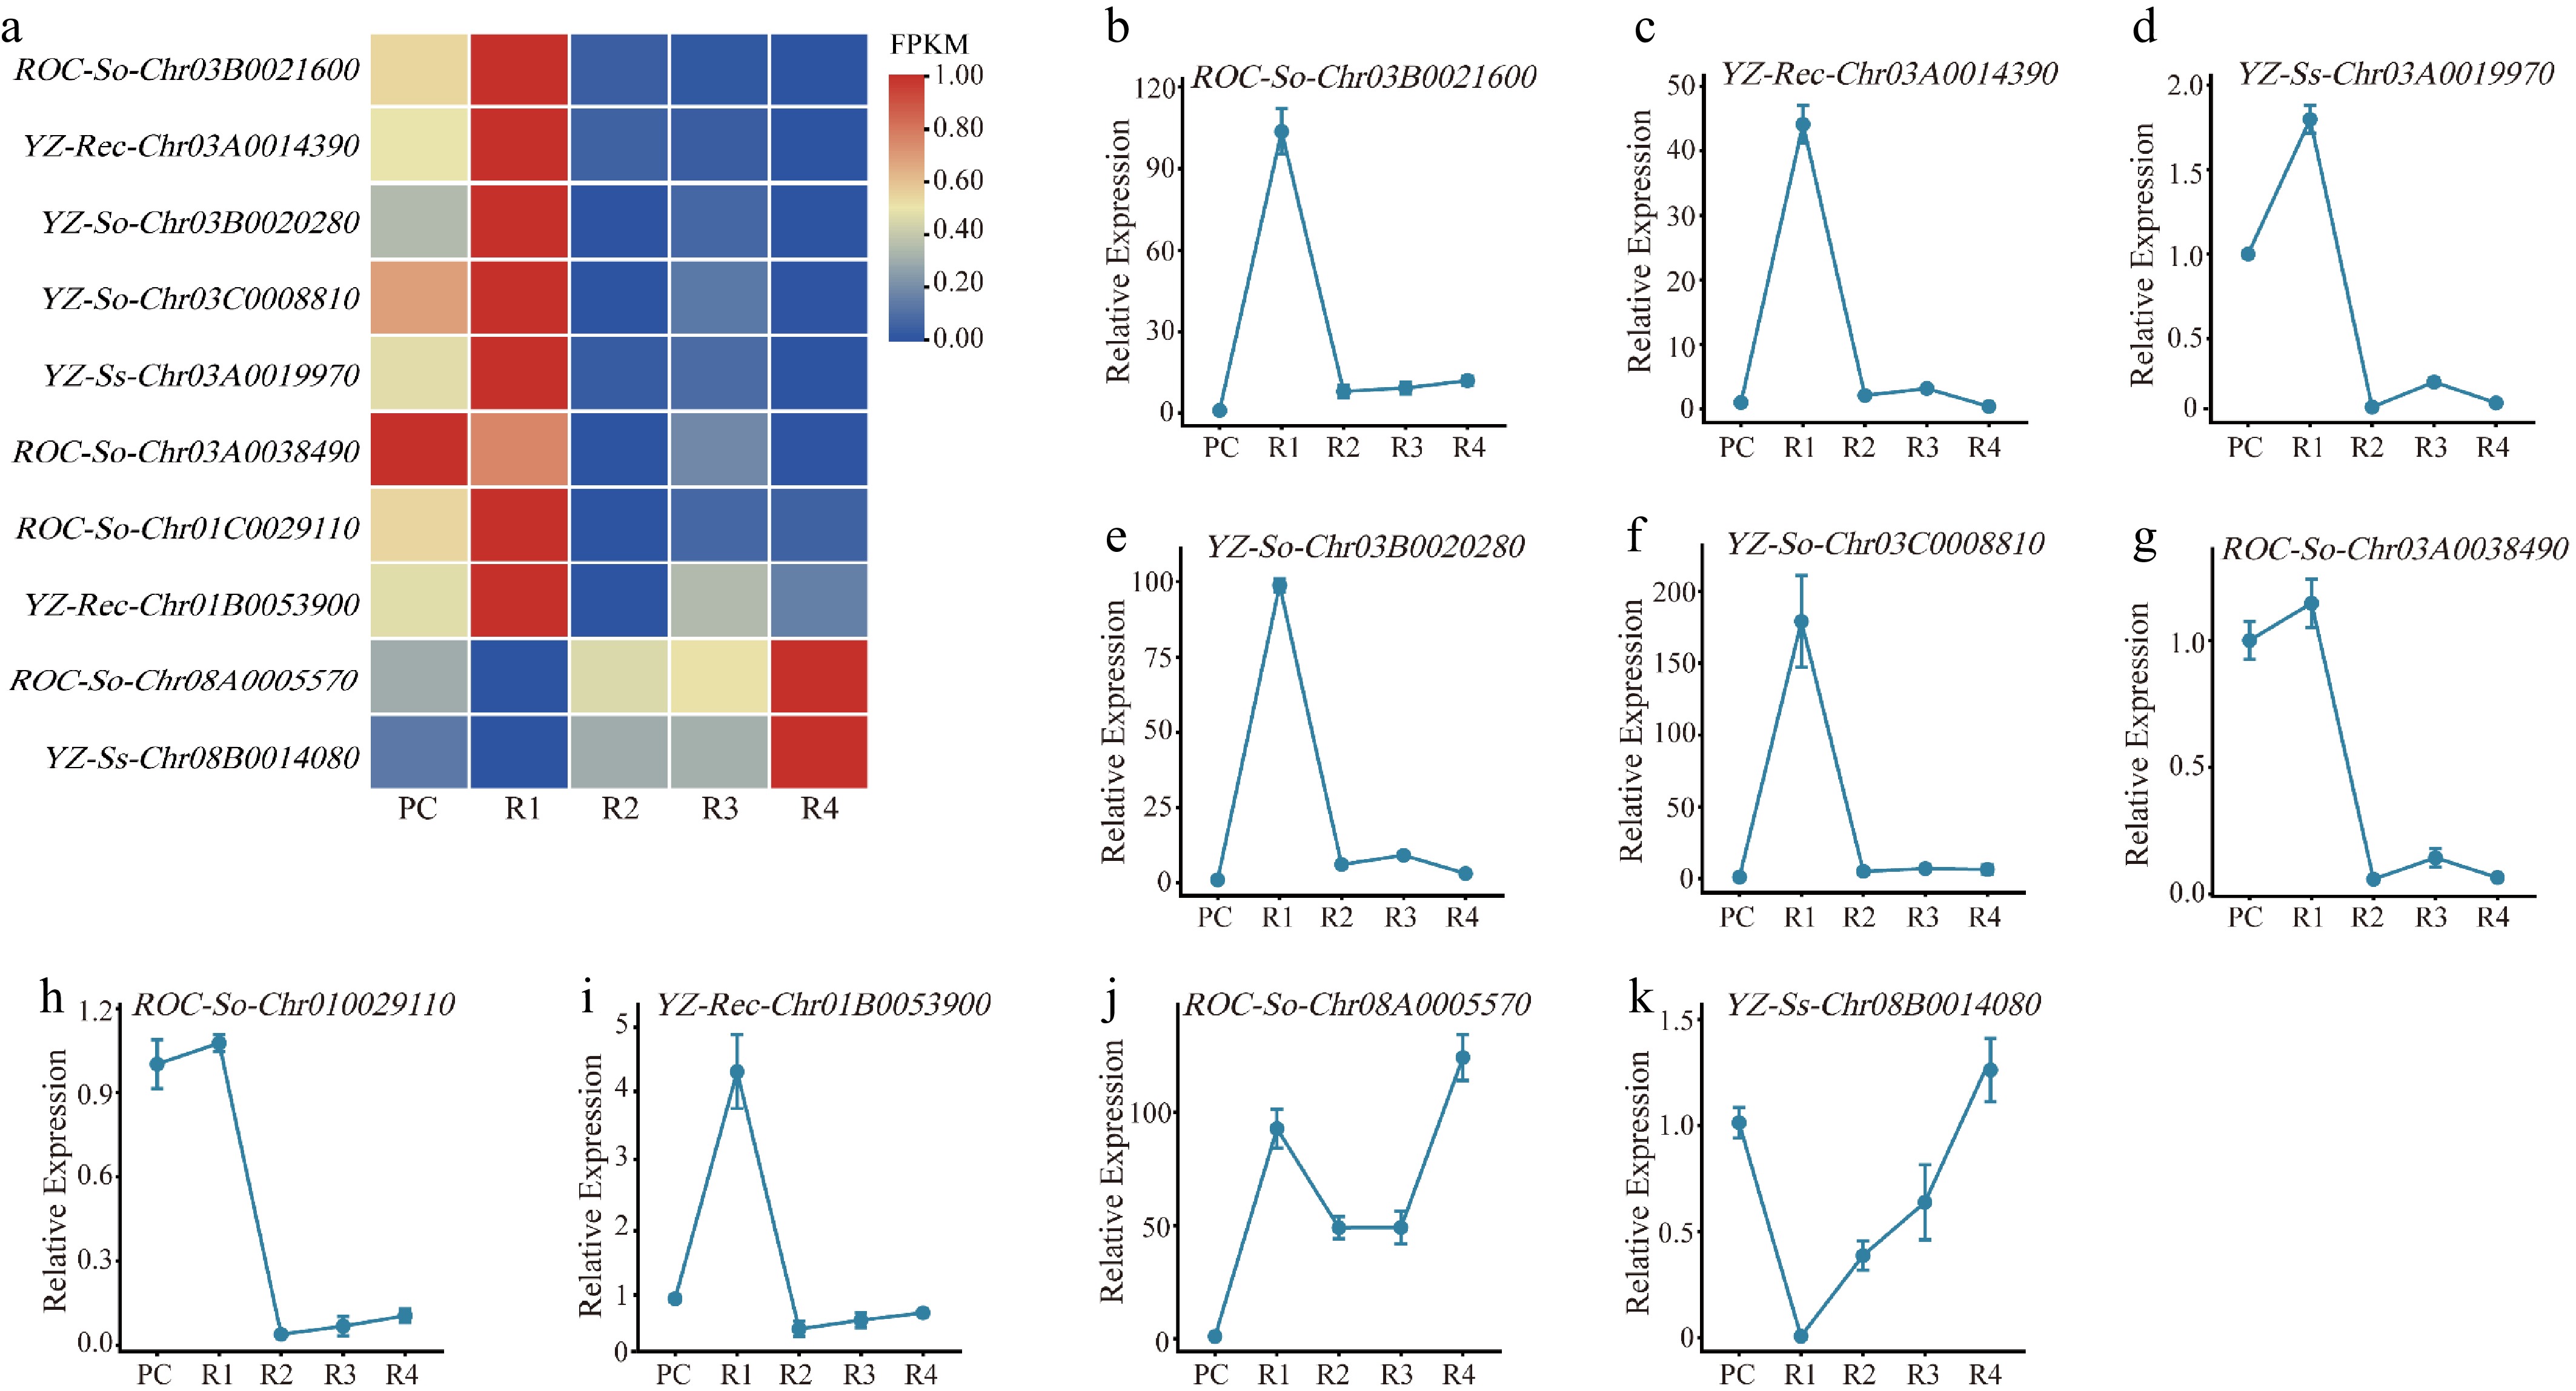
Figure 6.
Expression patterns of ten candidate genes across different planting years validated by transcriptome and qRT-PCR analysis. (a) Heatmap of expression patterns for ten candidate genes across different planting years. Expression levels of ten candidate genes in sugarcane roots at different planting years. Color scale represents normalized relative expression levels, with red indicating high expression and blue indicating low expression. (b)–(k) qRT-PCR validation of the relative expression levels of the ten candidate genes in sugarcane roots. Expression was calculated using the 2−ΔΔCᴛ method with UBQ as the internal reference gene and plant cane (PC) samples as the calibrator (set to 1). Data are presented as mean ± standard error of the mean (SEM) from three biological replicates, each with three technical replicates. The error bars represent the SEM. The qRT-PCR results were highly consistent with the RNA-seq data (shown as colored lines in each panel), confirming the reliability of the transcriptome analysis.
Figures
(6)
Tables
(0)