











-
Sugarcane, as a typical C4 perennial crop, has its economic sustainability determined by its ratoon regenerative capacity[1,2]. The ideal ratoon cropping system enables plants to maintain vigorous growth after multiple harvests, achieving the goal of single planting with multi-year productivity[3,4]. However, progressive yield decline with increasing ratoon years represents a pervasive challenge in commercial production, severely undermining this inherent advantage[5,6]. This deterioration in productivity persistence not only shortens the economically viable production period of ratoon crops but also necessitates more frequent replanting, constituting a fundamental biological constraint on the efficiency and sustainability of the sugar industry[7,8]. Yield formation fundamentally depends on the sustained capacity of root systems to acquire water and nutrients[9−11]. In contrast to plant cane, which develops a complete root system from setts, ratoon cane requires regeneration of new roots from underground stubble after each harvest, and the root system must maintain its function in progressively changing soil environments[12,13]. Consequently, interannual variation in root functional status likely represents a critical intrinsic factor associated with ratoon yield decline.
Maintenance of root function is crucial for yield stability in perennial crops[14,15]. In perennial fruit trees such as apple and grapevine, studies have confirmed significant associations between declining root vigor and yield reduction, and have identified key genes involved in root senescence and nutrient uptake[16−18]. As an important perennial economic crop, sugarcane faces a more pronounced issue of ratoon yield decline, yet research into the related molecular mechanisms remains relatively limited. Current sugarcane root transcriptome studies have primarily focused on comparative analyses between plant cane and first-ratoon crops, revealing differentially expressed genes associated with stress responses, hormone signaling, and secondary metabolism[2,10,19,20]. However, these studies lack systematic monitoring of dynamic gene expression changes in roots across consecutive ratoon years, making it difficult to distinguish which gene expression changes are synchronized with the progression of yield decline. Moreover, the absence of quantitative correlation analysis between transcriptome data and actual yield indicators has hindered the precise identification of key regulatory factors directly associated with yield variation among the numerous differentially expressed genes identified. Therefore, constructing a root transcriptome time series spanning multiple ratoon years and integrating yield data for systematic analysis represents an essential approach to uncover the molecular drivers of ratoon sugarcane yield decline.
Weighted gene co-expression network analysis (WGCNA) provides an effective tool to address these challenges. This method clusters genes with similar expression patterns into modules by constructing gene co-expression networks, and calculates correlation coefficients between modules and phenotypic data such as yield, thereby directly screening gene sets highly correlated with target traits[21−23]. Furthermore, based on network topology analysis, WGCNA can identify hub genes within each module that typically occupy critical positions in regulatory networks, providing important insights into the regulatory architecture underlying trait formation[24,25]. WGCNA has been successfully applied to abiotic stress response studies in rice, wheat, maize, and sugarcane to identify candidate genes associated with target traits, providing an efficient and precise approach for pinpointing molecular drivers of complex traits[26−30].
In this study, the widely cultivated variety YZ08-1609 from the Yunnan sugarcane region was used to construct a five-year continuous root transcriptome time series from plant cane to the fourth ratoon crop, with simultaneous collection of agronomic trait data including yield, plant height, stalk diameter, and millable stalk number. WGCNA was employed to construct gene co-expression networks and identify core gene modules highly coupled with yield decline trajectories. Functional enrichment analysis was performed to elucidate the molecular mechanisms of root transcriptome reprogramming during the ratooning process, and network topology analysis was conducted to identify hub genes strongly correlated with yield decline, with expression validation by qRT-PCR. By directly linking dynamic transcriptome data with quantitative traits, this study aims to provide a precise molecular profile of sugarcane ratooning decline and identify candidate gene targets for genetic improvement of ratooning performance.
-
The field experiment was conducted at the experimental station of the Sugarcane Research Institute, Yunnan Academy of Agricultural Sciences (23.70° N, 103.25° E, 1,051 m). The soil was clayey with the following properties in the plough layer (0–20 cm): pH 6.5, organic matter 17.1 g·kg−1, alkaline hydrolysable N 66.5 mg·kg−1, available P 65.4 mg·kg−1, and available K 55.5 mg·kg−1. A one-factor randomized complete block design was used with ratoon year as the treatment factor. Five treatments were established: plant cane (PC, planted in January 2020) and the first to fourth ratoon years (R1 to R4, harvested in January 2021–2025). Each treatment had three replicate plots (0.01 ha per plot). Field management followed local standard practices for sugarcane production.
Root samples were collected annually in September when sugarcane entered the grand growth period, characterized by plants developing seven to eight stem nodes and 12–13 fully expanded leaves. In each plot, five plants of uniform and vigorous growth were selected. After carefully removing surrounding soil, the root systems were excavated, and healthy root tips (0–5 cm from the apex) were collected from each plant. Root tips from the five plants within the same plot were pooled to form one biological replicate. Three biological replicates were collected per treatment per year. root tissues were wrapped in aluminum foil and flash-frozen in liquid nitrogen, then transported on dry ice to Shanghai Majorbio Bio-pharm Technology Co., Ltd. for RNA extraction and transcriptome sequencing.
Transcriptome data processing
-
Reference-guided transcriptome sequencing analysis was performed on sugarcane root samples. Total RNA was extracted from all samples, and those passing quality assessment were used for cDNA library construction. Library preparation and sequencing were conducted by Shanghai Majorbio Bio-pharm Technology Co., Ltd. using the Illumina NovaSeq X Plus platform with paired-end sequencing (150 bp read length). Raw sequencing data were processed using fastp software for quality control, removing reads containing adapter sequences, reads with unknown base (N) content exceeding 10%, or reads with more than 50% low-quality bases (Q ≤ 20) to obtain high-quality clean reads. Subsequently, clean reads were aligned to the sugarcane cultivar reference genome ZZ1 using HISAT2.
Based on the alignment results, gene expression was quantified at the transcript level using StringTie (v2.2.1). Transcript abundances were normalized as FPKM (Fragments Per Kilobase per Million mapped fragments) for within-sample expression comparisons. For differential expression analysis, gene-level raw read counts were extracted from the StringTie output using the Python script prepDE.py provided by the StringTie package. The resulting raw count matrix (non-negative integers) was used as input for DESeq2 (v1.42.0), which internally performs library-size normalization using the median-of-ratios method. To ensure data quality, samples with overall mapping rates below 65% were excluded from downstream analyses. This threshold is consistent with common RNA-seq quality control practices, where mapping rates below 60%–70% are considered indicative of potential sample contamination, RNA degradation, or reference genome mismatches[31]. Following quality filtering, one sample (YZ08-1609R3_R3, 50.35% mapping rate) was excluded, leaving 14 samples for subsequent analyses.
Screening of differentially expressed genes
-
Differentially expressed genes (DEGs) were identified using the DESeq2 package with raw read counts as input. Selection criteria were set as follows: false discovery rate (FDR) < 0.05 and |log2(Fold Change)| ≥ 1. Comparison strategies included pairwise comparisons between adjacent years (e.g., PC vs. R1) and comparisons between each ratoon year and plant cane. Gene Ontology (GO) enrichment analysis of identified DEGs was performed using Goatools, with Benjamini-Hochberg (BH) corrected p-value < 0.05 as the significance threshold. KEGG pathway enrichment analysis was conducted using R scripts with the same calculation principle as GO enrichment analysis, and pathways with corrected p-value < 0.05 were considered significantly enriched.
Weighted gene co-expression network analysis (WGCNA) of traits and genes
-
A gene co-expression network was constructed using the WGCNA package (version 1.63), incorporating all expressed genes from YZ08-1609 together with four agronomic traits: yield, plant height, stalk diameter, and millable stalk number. Based on the scale-free network topology criterion, the optimal soft threshold β was determined as 12. The minimum module size was set to 30 genes, and the module merging threshold was set to 0.25. Within each significant module, genes were ranked by module membership values (kME), and those with kME greater than 0.9 were identified as hub genes. The core network was visualized using Cytoscape (version 3.10.3), displaying interaction relationships among the top 100 genes ranked by kME with edge weights greater than 0.1.
qRT-PCR expression validation
-
To validate the reliability of RNA-seq data, quantitative real-time PCR (qRT-PCR) was performed on ten selected candidate hub genes. Total RNA was reverse-transcribed into cDNA using the HiScript® III All-in-one RT SuperMix Perfect for qPCR kit (Vazyme, R333-01). qRT-PCR reactions were performed on a StepOnePlus Real-Time PCR System (Applied Biosystems) with three technical replicates per sample. Primer sequences used for amplification are listed in Supplementary Table S1 and were designed and synthesized by Sangon Biotech (Shanghai) Co., Ltd. The PCR program was set as follows: initial denaturation at 94 °C for 4 min; followed by 35 cycles of 94 °C for 30 s, 60 °C for 30 s, and 72 °C for 30 s; with a final extension at 72 °C for 7 min. Relative gene expression levels were calculated using the 2−ΔΔCᴛ method[32].
-
The yield and key agronomic traits of sugarcane exhibited a declining trend with increasing ratoon years (Fig. 1, Supplementary Table S2). Yield decreased progressively with planting years, showing a significant drop at R3 with a reduction of 20.50% compared to PC (plant cane). Among agronomic traits, plant height was most notably affected by planting years: plant cane showed the highest plant height (294.08 cm), R1 and R4 showed no significant difference, while R2 and R3 were significantly reduced to below 200 cm. Stalk diameter also showed significant differences among different years, with PC and R3 exhibiting significantly higher values (3.45 cm) than other years, although no clear linear pattern was observed overall. No significant differences were detected in millable stalk number among treatments. Comprehensive analysis indicated that with extended ratoon years, sugarcane yield declined significantly, primarily driven by reduced plant height, while stalk diameter showed no clear linear trend, and millable stalk number remained stable. These results suggest that different agronomic traits respond to ratoon years with distinct dynamics, and the overall yield decline is not simply a uniform deterioration of all growth parameters.
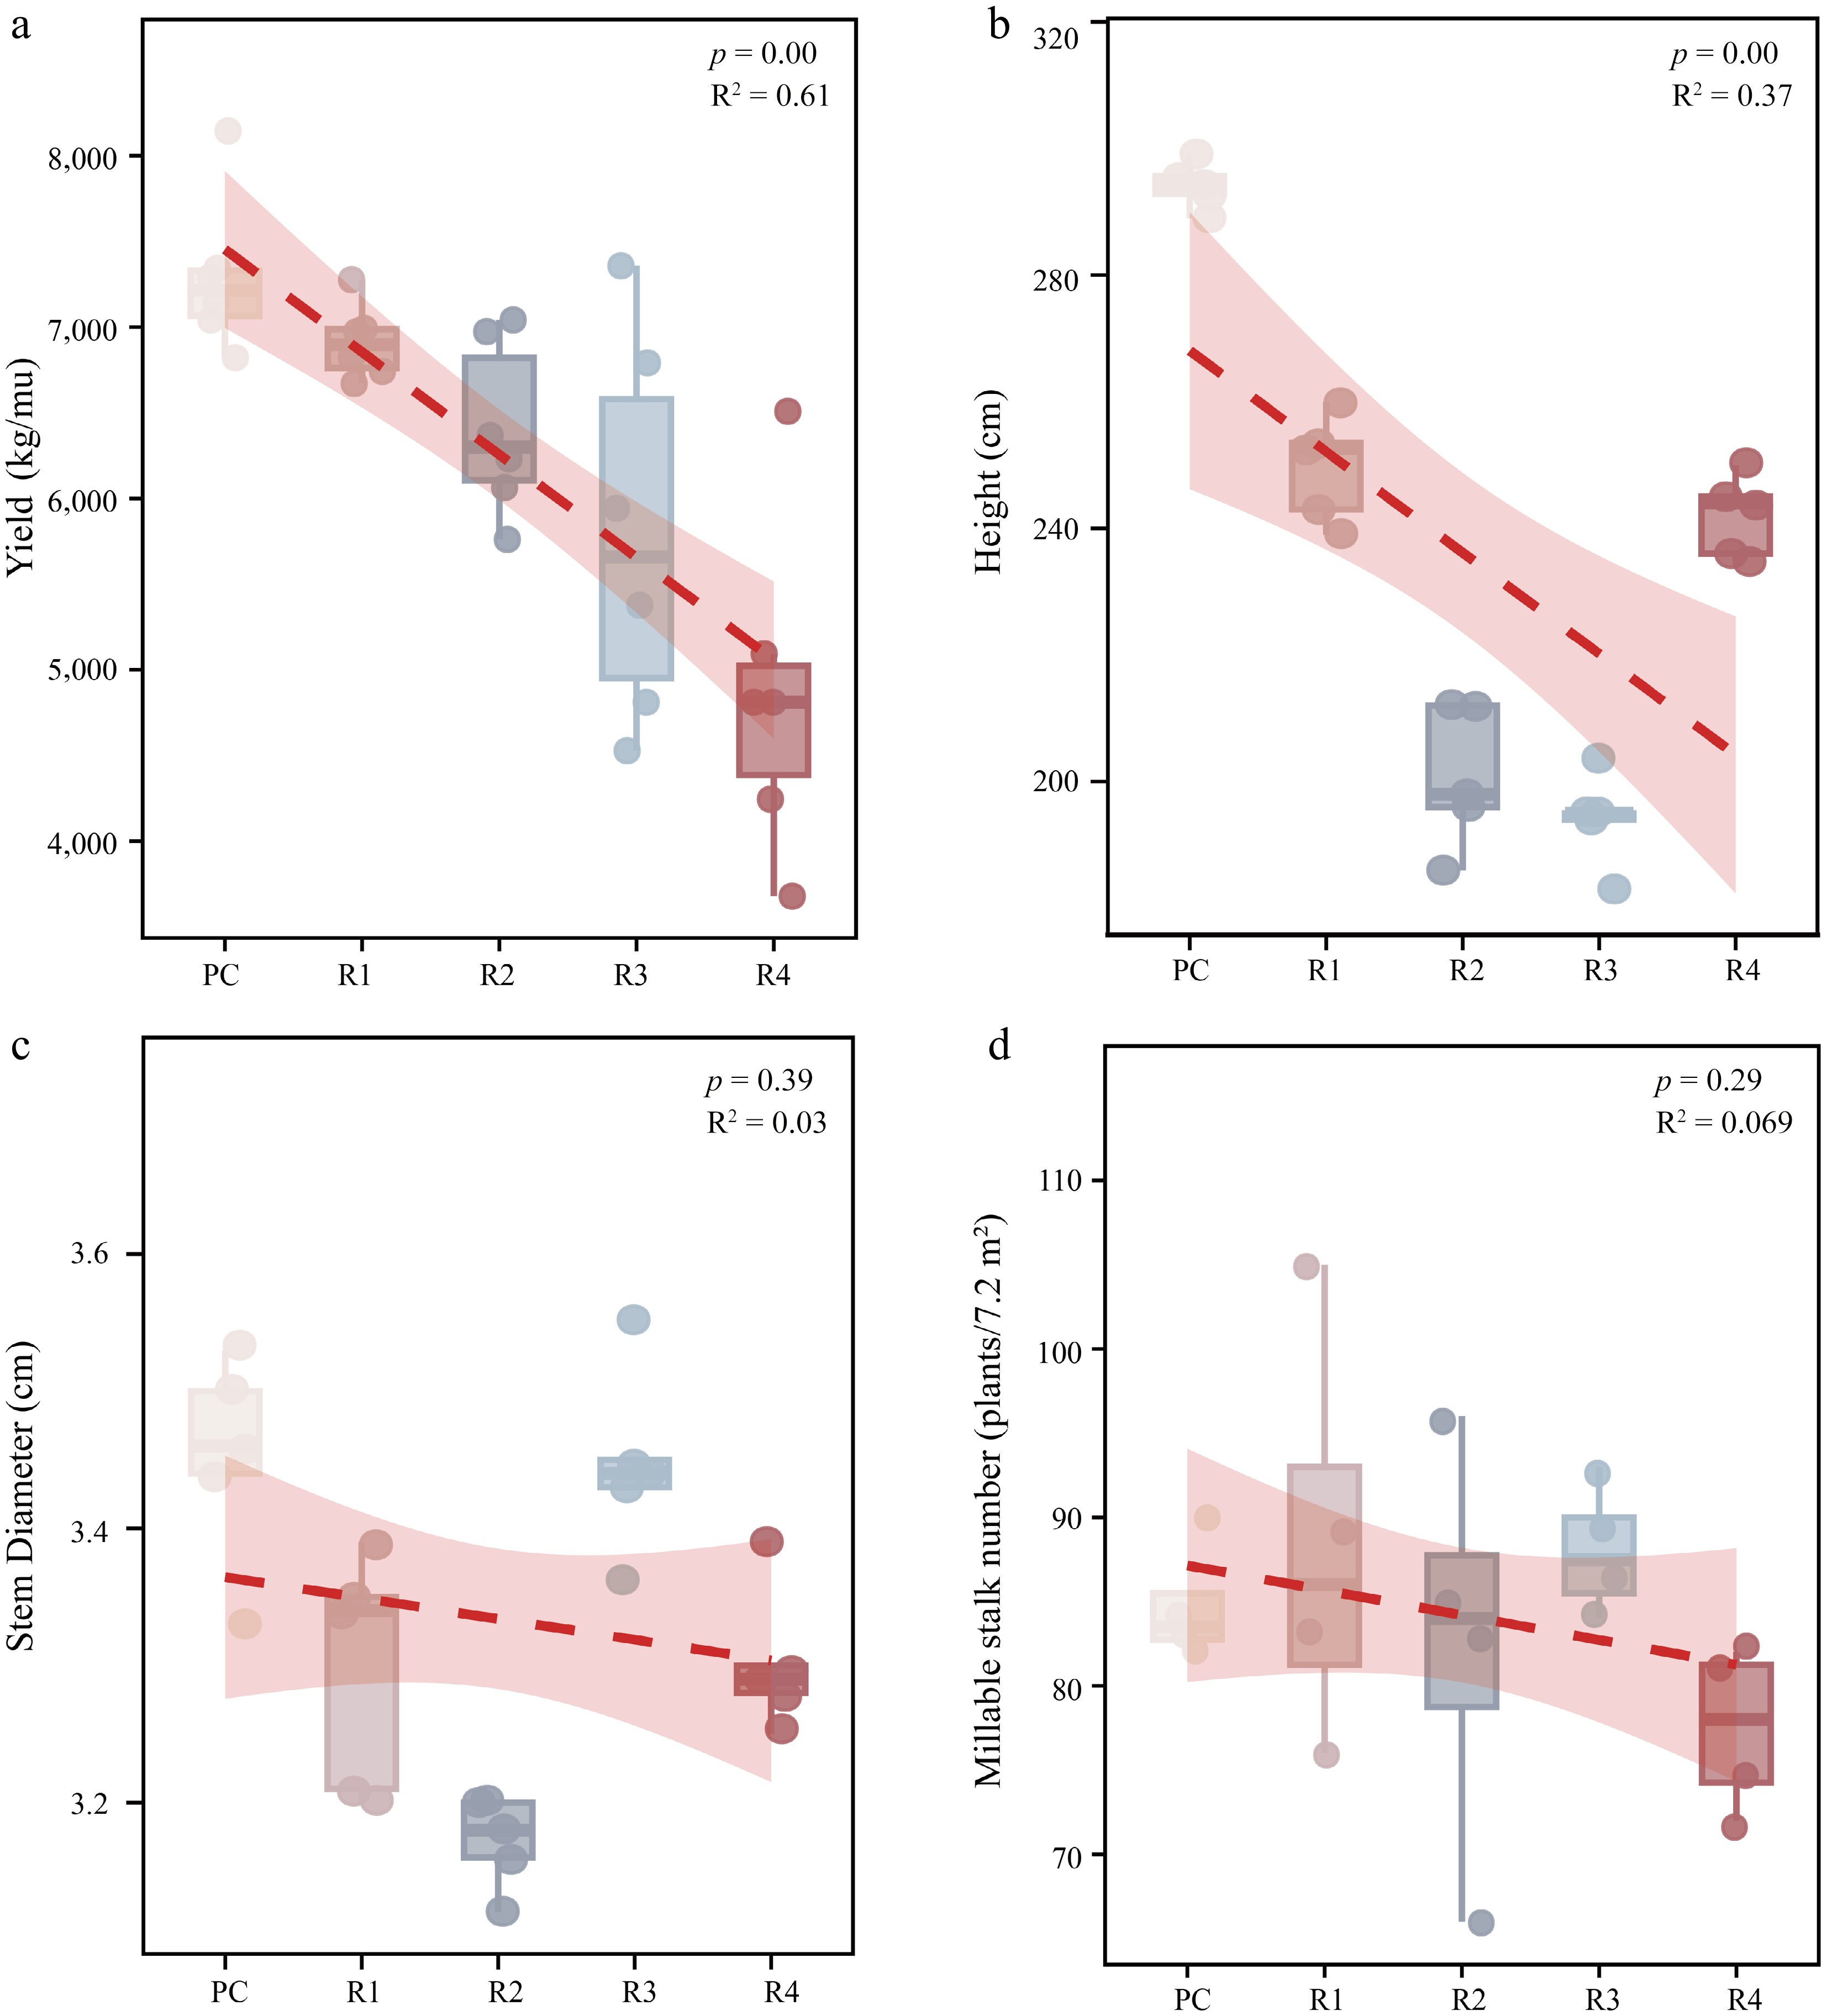
Figure 1.
Trends of major agronomic traits and yield in sugarcane under different planting years. (a) Yield. (b) Height. (c) Stem diameter. (d) Millable stalk number. In each panel, the box plots show the data distribution, the scattered points represent biological replicates, the red dashed line indicates the linear trend, and the shaded area denotes the 95% confidence interval. The p-value and R2 of the linear regression are displayed. PC, plant cane; R1–R4, the first to fourth ratoon crops.
Quality assessment and alignment analysis of transcriptome sequencing data
-
In this study, transcriptome sequencing was performed on 15 sugarcane root samples, generating approximately 150.64 Gb of raw data. After stringent quality control, the amount of clean data per sample ranged from 7.73 to 11.06 Gb (average 10.04 Gb per sample), with detailed information presented in Supplementary Table S3. Quality control analysis revealed that the average Q20 and Q30 base ratios were 99.20% and 97.45%, respectively, with an average GC content of 54.07% ± 1.33%, indicating high sequencing quality suitable for downstream analysis. Clean reads were aligned to the sugarcane hybrid reference genome (Saccharum_hybrid ZZ1.v20231221), with an average mapping efficiency of 81.28% (± 11.23%), and 66.7% of samples showed mapping rates above 80%. Mapping efficiency varied among treatment groups: R1 samples showed the highest rates (93.47%–93.83%), PC ranged from 76.27% to 81.70%, and R2–R4 ranged from 68.67% to 89.77%. Sample YZ08-1609R3_R3 was excluded from subsequent analyses due to an abnormally low mapping rate (50.35%).
Dynamic changes in gene expression profiles
-
To elucidate the effects of ratoon cropping years on sugarcane gene expression, transcriptome analysis was performed on PC and four consecutive ratoon years (R1–R4). Venn diagram analysis (Supplementary Fig. S1a) revealed 69,330 genes commonly detected across all five treatments, accounting for 47.83% of total genes. The number of year-specific genes ranged from 2,102 to 7,566, with PC showing the lowest proportion of unique genes (1.45%). Notably, the proportion of unique genes increased significantly with ratoon age, reaching 5.04% and 5.22% in R2 and R4, respectively, indicating that prolonged ratoon cropping induces substantial transcriptome reprogramming.
Principal component analysis (PCA) results (Supplementary Fig. S1b) further revealed dynamic changes in gene expression patterns. PC1 and PC2 explained 30.42% and 15.18% of total variance, respectively, cumulatively accounting for 45.60% of inter-sample variation. PC, R3, and R4 samples were distributed in the negative region of PC1, while ratoon samples exhibited stage-specific distribution characteristics. R1 samples showed dispersion, indicating high heterogeneity in gene expression among plants during early ratoon stages. R2 samples clustered in the positive region of PC1, showing the greatest distance from PC and representing the period with the most pronounced gene expression differences. R3 samples were highly clustered and positioned close to PC, suggesting gene expression had stabilized into a new state. R4 samples again displayed significant dispersion. The three replicates within each year clustered tightly, demonstrating good reproducibility among samples.
Stage-specific changes in differentially expressed genes
-
To analyze the effects of ratoon cultivation on sugarcane gene expression, differential expression analysis was performed between PC and each ratoon year (R1–R4). Results showed that compared to PC, the numbers of DEGs in R1, R2, R3, and R4 were 6,547, 19,554, 529, and 880, respectively (Fig. 2a, Supplementary Table S4). R2 exhibited the highest number of DEGs (19,554), with upregulated genes accounting for 62.47%, indicating widespread gene expression activation during early ratoon stages. Notably, the number of DEGs between R3 and PC dropped sharply to 529, while DEGs between R3 and R2 reached 30,692, predominantly downregulated, suggesting large-scale transcriptional reprogramming occurred from R2 to R3, accompanied by extensive gene expression suppression (Fig. 2b, Supplementary Table S4). As ratoon years continued to extend, the number of DEGs between R4 and R3 recovered to 2,815, with downregulated genes still predominant, indicating that prolonged ratooning promoted entry into a new expression steady state.
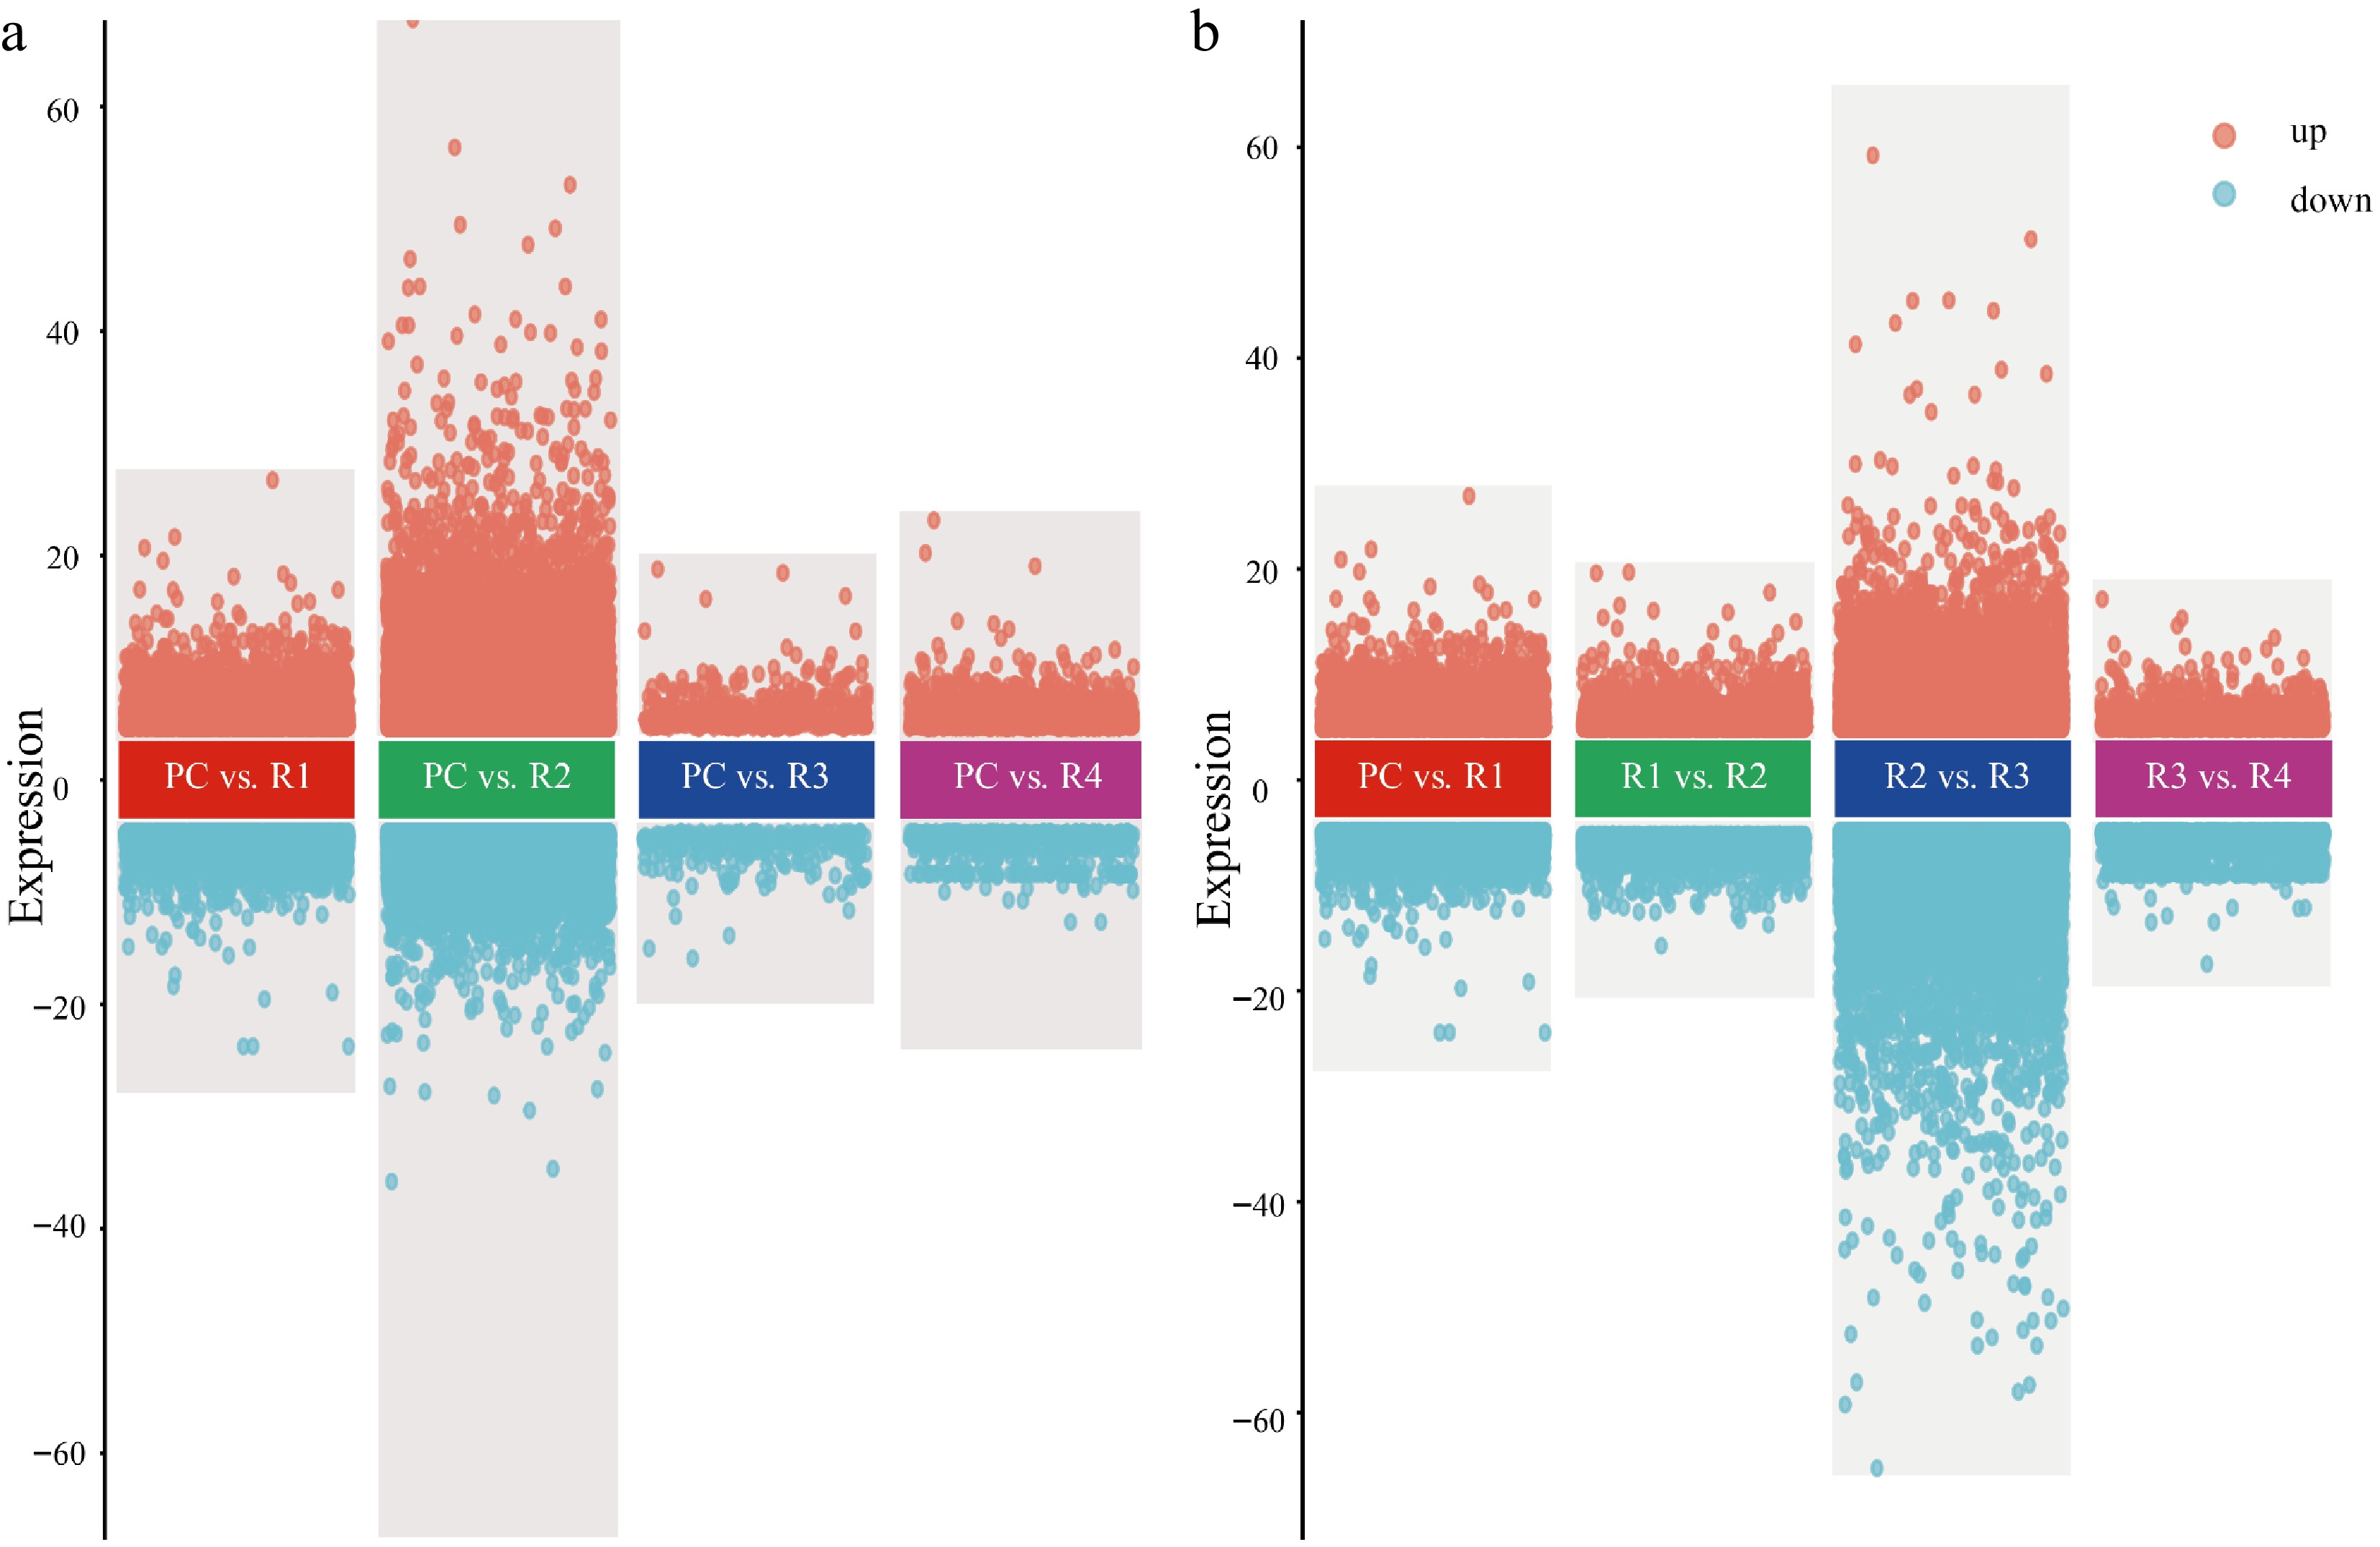
Figure 2.
Gene expression dynamics across sugarcane planting years. (a) Differential gene expression comparing plant cane (PC) with each ratoon year (R1–R4). (b) Differential expression between consecutive ratoon years (R1 vs. R2, R2 vs. R3, R3 vs. R4). Genes with a false discovery rate (FDR) < 0.05 and |log2fold change| ≥ 1 are considered significant. Orange and blue dots represent upregulated and downregulated genes, respectively. The y-axis indicates the log2fold change. Shaded areas highlight each comparison.
Venn intersection analysis of differentially expressed genes
-
Venn diagram analysis demonstrated that gene expression responses induced by ratoon cropping exhibited significant stage specificity (Supplementary Fig. S2). Compared to the control (PC), core DEGs shared across all ratoon years were extremely few (34 upregulated, 13 downregulated), indicating that transcriptional programs activated at different ratoon stages differed substantially. Among comparison-specific DEGs, PC vs. R2 showed the highest number and proportion of both upregulated (12,740, 68.4%) and downregulated (8,406, 77.3%) genes, further confirming that R2 represented the most active period of gene regulation. Additionally, 3,941 upregulated genes (21.1%) and 2,090 downregulated genes (19.2%) were shared between PC vs. R1 and PC vs. R2, suggesting a degree of expression continuity from early to middle ratoon stages. Notably, no persistently shared DEGs were found among adjacent ratoon stage comparisons (PC vs. R1, R1 vs. R2, R2 vs. R3, R3 vs. R4), indicating regulatory independence at each stage. The R2 vs. R3 comparison showed the highest number of stage-specific genes (12,886 upregulated, 77.6%; 17,694 downregulated, 82.9%), suggesting dramatic transcriptional reprogramming occurred during this period, potentially representing a critical expression steady-state transition node in the ratoon decline process, closely associated with ratooning performance decline.
WGCNA identification of core gene modules associated with yield
-
WGCNA was performed using all expressed genes from this variety together with four agronomic trait indicators (yield, plant height, stalk diameter, and millable stalk number) across five consecutive years. Based on the scale-free topology criterion with a soft-thresholding power of 12 (Fig. 3a, b), a β value of 12 was selected for network construction. Using dynamic tree cutting to merge modules with similar expression patterns, 50 co-expression modules were obtained, represented by different colors (Fig. 3c, d). The grey module represented invalid genes, the turquoise module contained the most genes (10,317), and the plum2 module contained the fewest (41 genes). Module-trait correlation analysis revealed that two modules showed significant positive correlation with yield (darkmagenta module: r = 0.679, p = 0.00538; plum2 module: r = 0.621, p = 0.0135), and both modules also showed significant positive correlation with stalk diameter (darkmagenta module: r = 0.683, p = 0.00501; plum2 module: r = 0.738, p = 0.00168). Additionally, one module (lightcyan1) showed significant negative correlation with yield (r = −0.746, p = 0.00141) and stalk diameter (r = −0.642, p = 0.00987). To determine whether darkmagenta and plum2 should be merged, we calculated the correlation between their module eigengenes. The two eigengenes were highly correlated (Pearson's r = 0.80, Supplementary Fig. S3), indicating similar expression patterns across samples. Based on this eigengene correlation together with their shared positive association with yield and stalk diameter, we merged darkmagenta and plum2 into a single yield- and stalk diameter-positively associated gene set designated YP (276 genes), while the lightcyan1 module was defined as the yield and stalk diameter negatively correlated gene set (YN, 75 genes) for subsequent in-depth analysis.
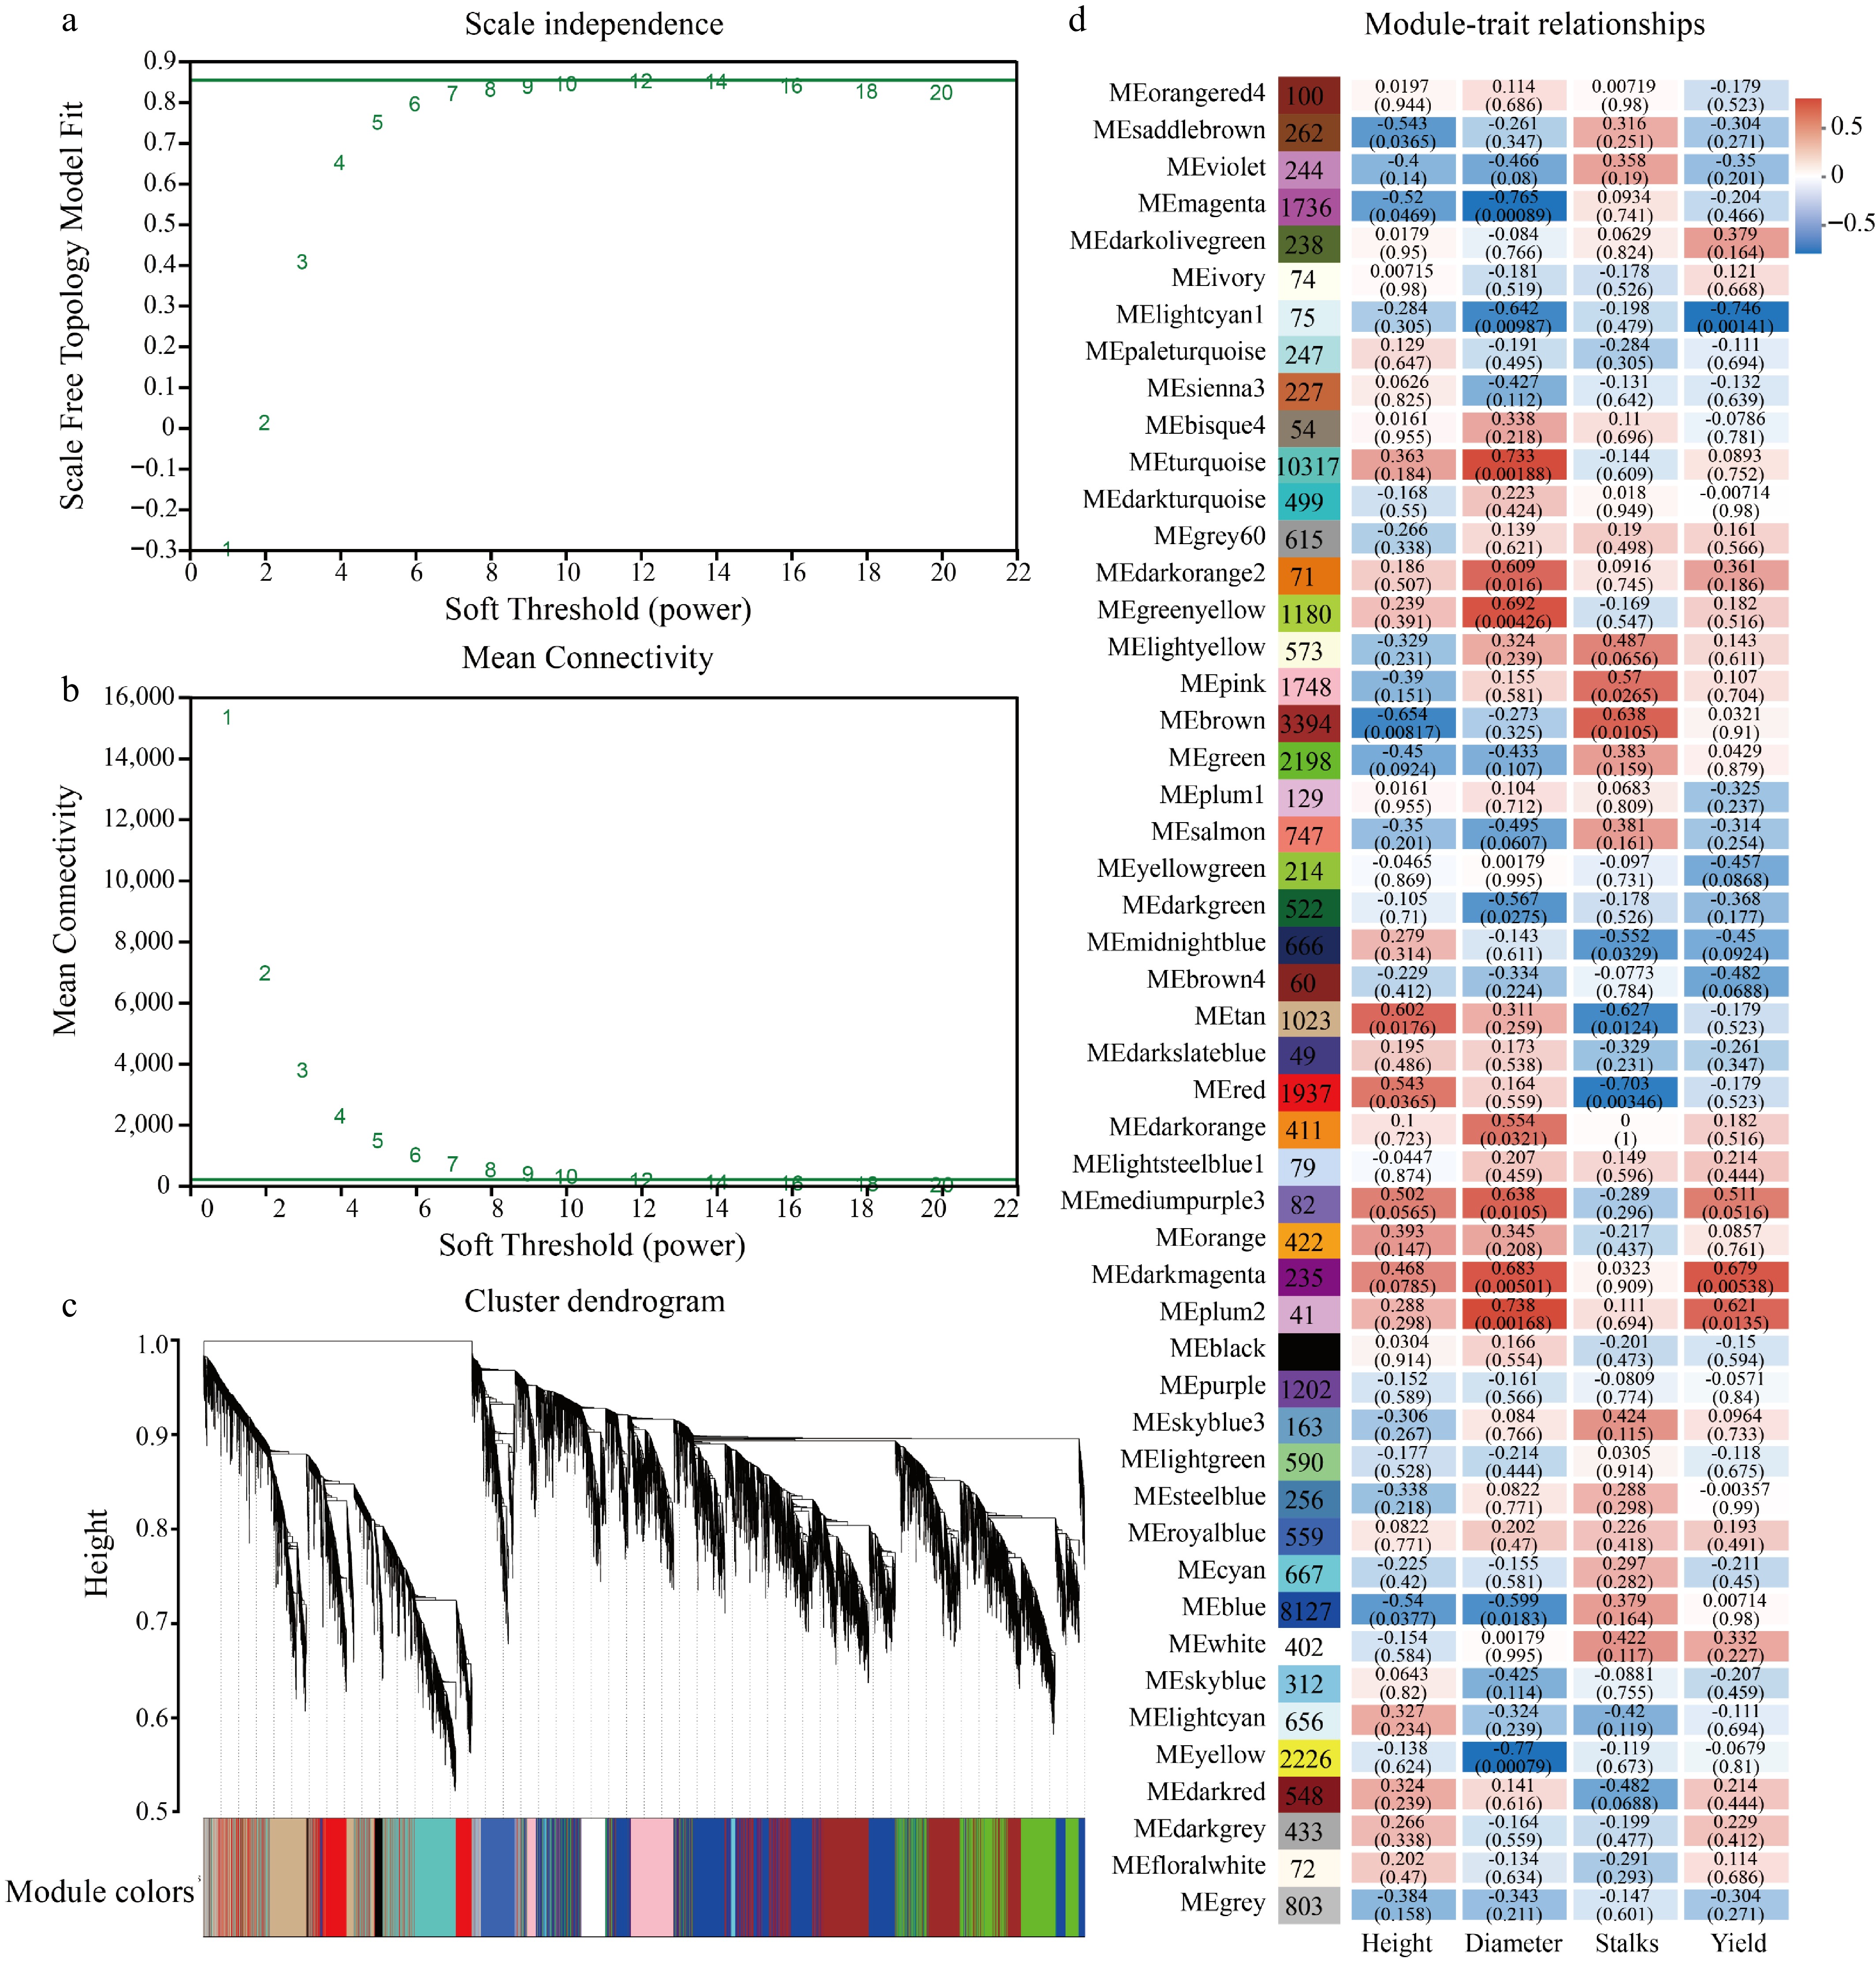
Figure 3.
Co-expression network analysis (WGCNA) of sugarcane yield-related genes. (a) Soft-thresholding power selection. The scale-free topology model fit is plotted against β. A fit index > 0.85 (red dashed line) was used as the criterion, leading to the selection of β = 12. (b) Mean connectivity under different β values. Connectivity decreased with increasing β, with β = 12 maintaining a biologically appropriate level. (c) Hierarchical clustering dendrogram of co-expression modules. A total of 50 modules were identified and are color-coded in the band below. (d) Module-trait correlation heatmap. Red/blue indicates positive/negative correlations; numbers inside and outside parentheses denote the p-value and correlation coefficient (r), respectively.
GO and KEGG enrichment analysis of yield-positively correlated gene set YP
-
To comprehensively analyze the biological functions of the yield-positively correlated gene set (YP, 276 genes), GO functional enrichment and KEGG pathway enrichment analyses were performed (Fig. 4a). GO analysis results showed that the YP gene set was significantly enriched in water transport-related functions in the molecular function category, including water transmembrane transporter activity, water channel activity, channel activity, and passive transmembrane transporter activity, as well as cis-regulatory region sequence-specific DNA binding, suggesting involvement in transcriptional regulation. Cellular component analysis indicated that this gene set was primarily localized to the nucleus and membrane-bounded organelles, with chloroplast stroma also appearing as an enriched term. It should be noted that because roots do not contain chloroplasts, the enrichment of chloroplast stroma-related terms likely reflects annotation bias (e.g., gene models derived from above-ground tissues) or evolutionary conservation of certain genes rather than active chloroplast function in roots. In terms of biological processes, the YP gene set was significantly enriched in response to abiotic stress, photomorphogenesis, cellular response to heat, response to red or far-red light, and regulation of RNA biosynthetic processes. While photomorphogenesis and light responses are classically considered shoot-specific, several light-signaling genes are also expressed in roots and have been implicated in stress adaptation; therefore, these enrichments may represent indirect or pleiotropic functions rather than root-specific light-regulated pathways. Nevertheless, these results highlight the potential involvement of the YP gene set in stress responses and transcriptional regulation.
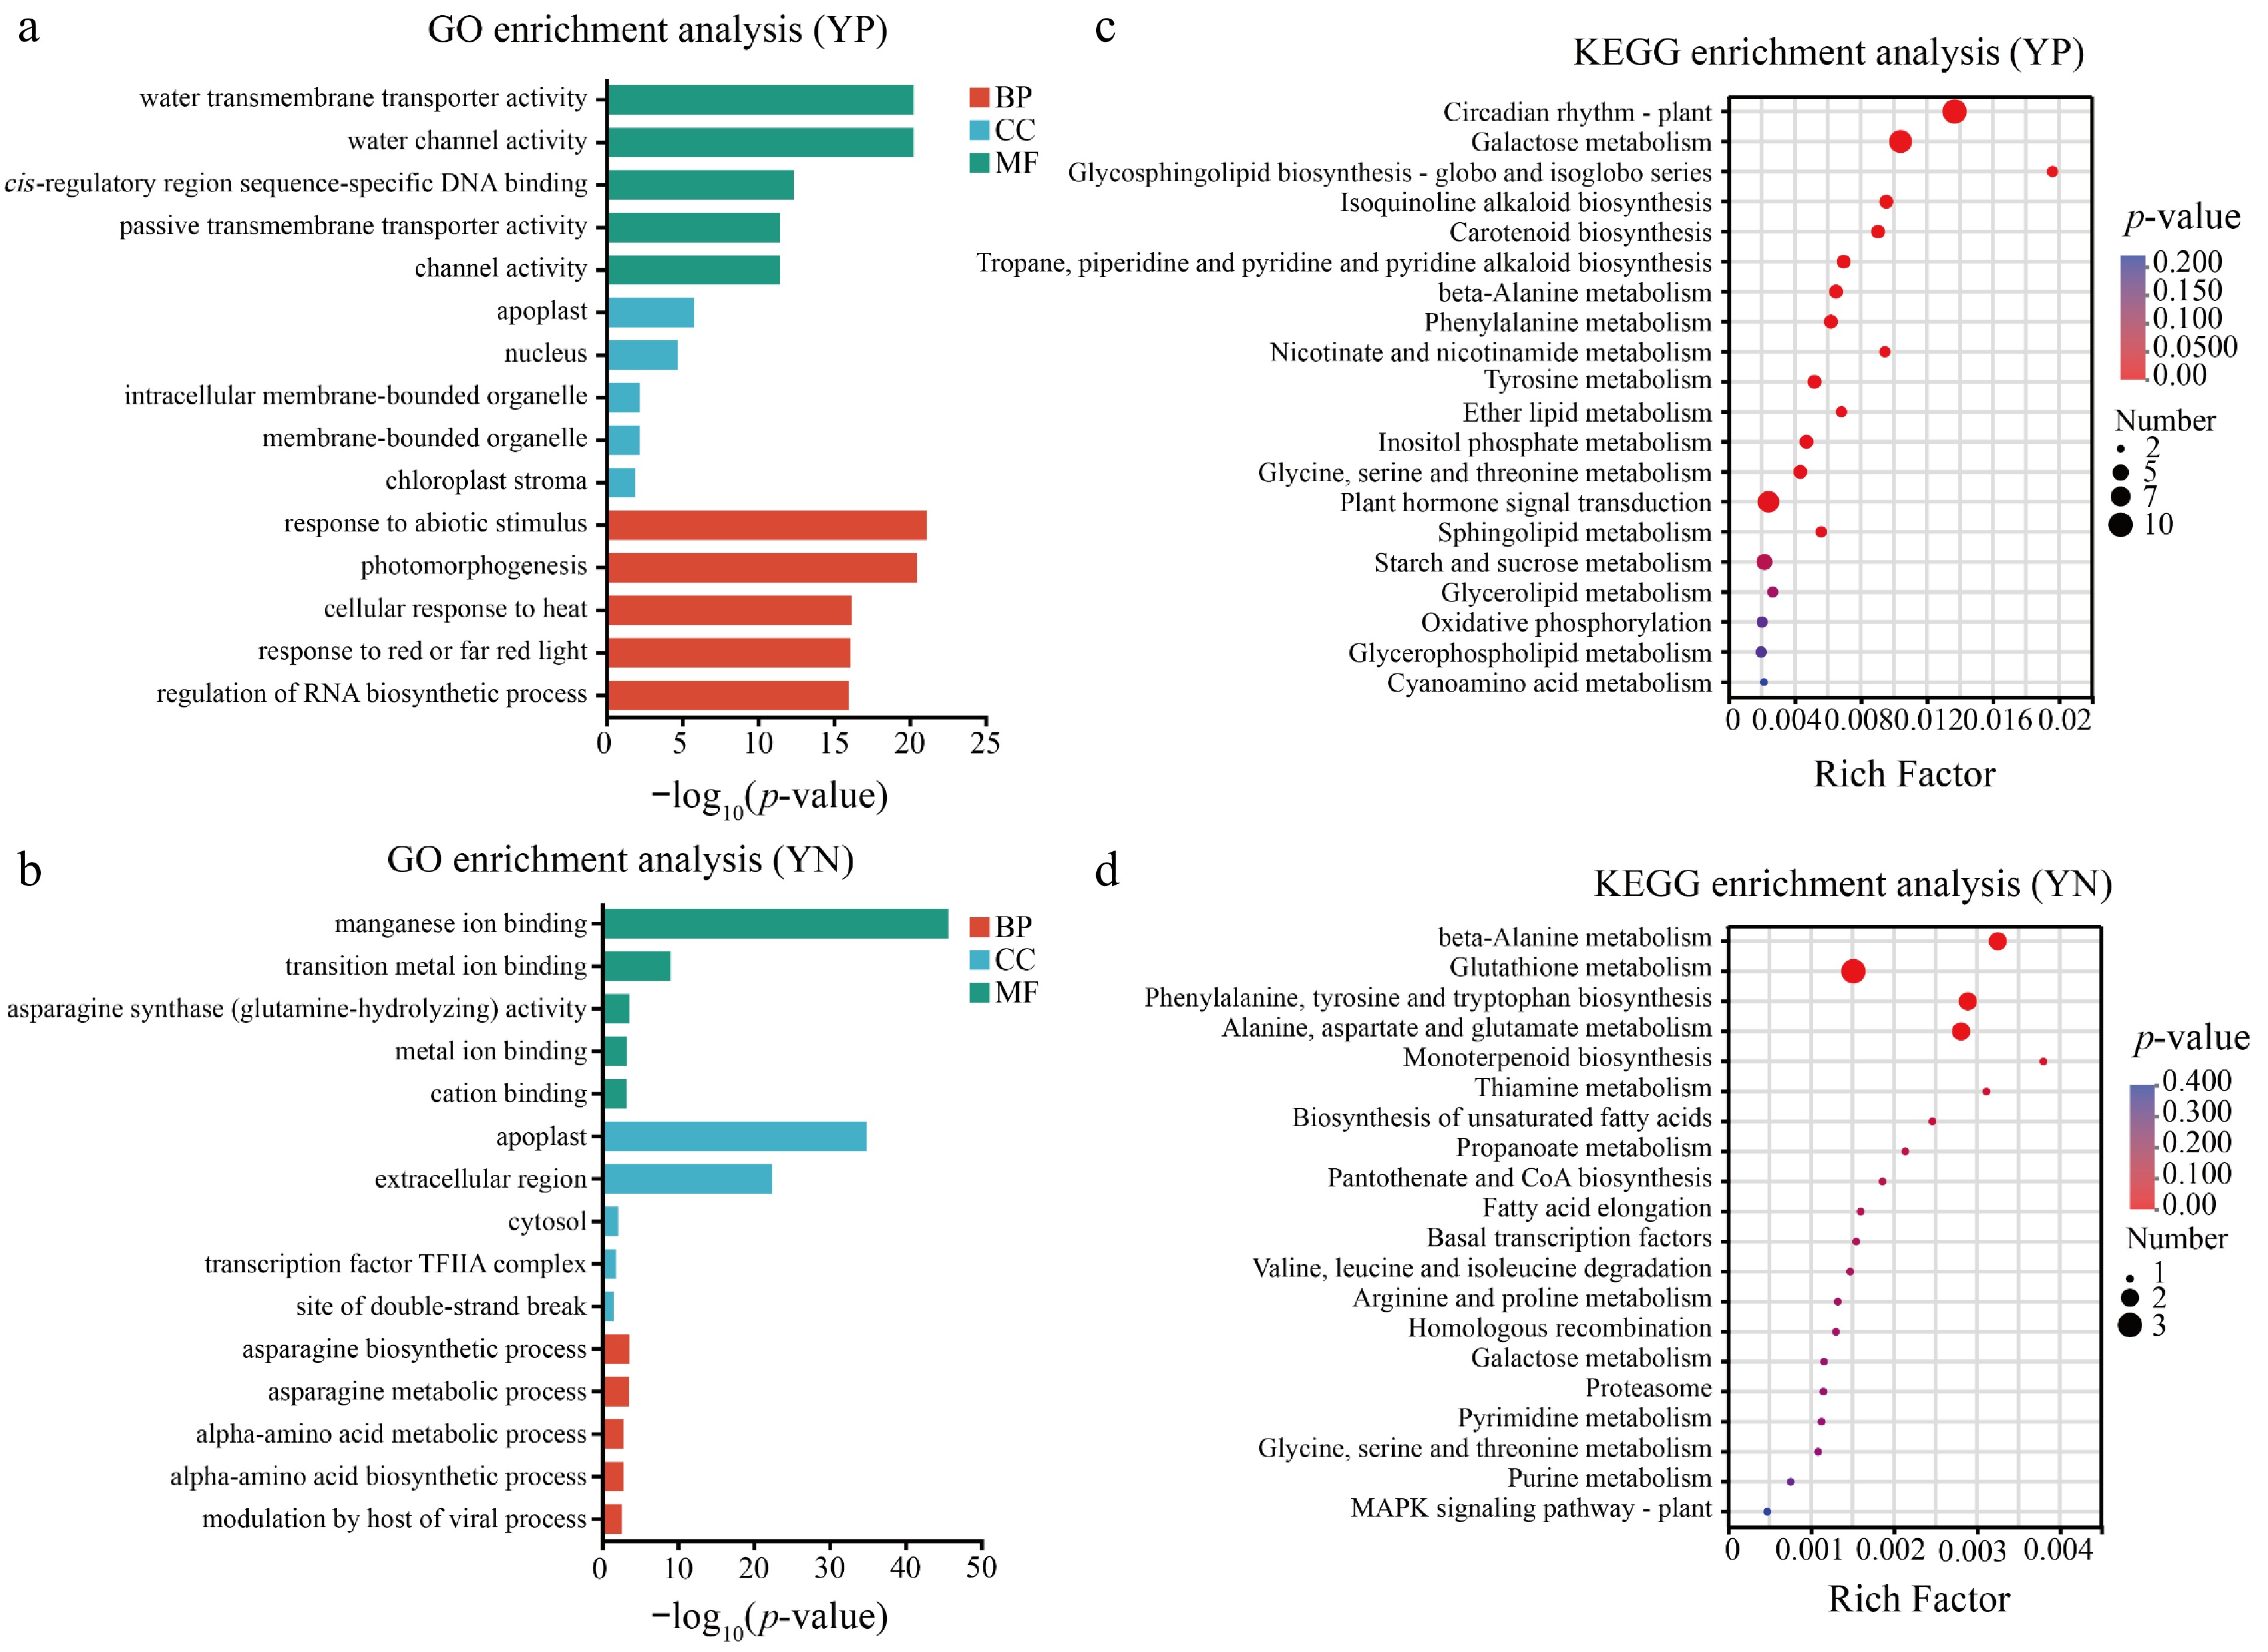
Figure 4.
GO and KEGG enrichment analyses of two distinct gene sets, YP and YN. GO enrichment results for (a) the YP and (b) YN gene sets, showing the top significantly enriched biological processes (BP), cellular components (CC), and molecular functions (MF). The x-axis represents the −log10(p-value) of enrichment significance. KEGG pathway enrichment analysis for the (c) YP and (d) YN gene sets. Dot size indicates the number of genes enriched in each pathway, while dot color reflects enrichment significance (p-value). The x-axis shows the enrichment factor, indicating the ratio of genes enriched to total genes in each pathway.
KEGG pathway enrichment analysis (Fig. 4c) further revealed the metabolic and signaling networks involving the YP gene set. Results showed significant enrichment of pathways related to energy metabolism and carbohydrate utilization, including oxidative phosphorylation (ko00190) and starch and sucrose metabolism (ko00500), indicating these genes participate in root energy supply and carbon source utilization. At the signal transduction level, enrichment of plant hormone signal transduction (ko04075) and circadian rhythm-plant (ko04712) suggested roles in environmental perception and growth rhythm regulation. Additionally, multiple secondary metabolism pathways were significantly enriched, including carotenoid biosynthesis (ko00906), isoquinoline alkaloid biosynthesis (ko00950), as well as several amino acid metabolism pathways (such as phenylalanine metabolism, tyrosine metabolism) and lipid metabolism pathways (such as sphingolipid metabolism, glycerolipid metabolism). These results indicate that the yield-positively correlated gene set coordinately participates in water absorption, energy metabolism, signal transduction, abiotic stress response, and secondary metabolism in sugarcane roots, demonstrating its multidimensional regulatory role in promoting sugarcane yield formation.
GO and KEGG enrichment analysis of yield-negatively correlated gene set YN
-
GO enrichment analysis results (Fig. 4b) showed that the yield-negatively correlated gene set (YN, 75 genes) was primarily enriched in metal ion binding-related functions at the molecular function level, including manganese ion binding, transition metal ion binding, metal ion binding, and cation binding, as well as asparagine synthase (glutamine-hydrolyzing) activity related to amino acid metabolism. At the cellular component level, significant enrichment was observed in apoplast, extracellular region, and cytosol, as well as DNA double-strand break sites and transcription factor TFIIA complex related to genome stability. Biological processes mainly involved asparagine biosynthetic process, asparagine metabolic process, alpha-amino acid metabolic process, alpha-amino acid biosynthetic process, and regulation of host viral process.
KEGG pathway enrichment analysis revealed 20 significantly enriched metabolic pathways (Fig. 4d). Pathways closely related to plant stress response, including MAPK signaling pathway-plant (ko04016) and glutathione metabolism (ko00480) involved in antioxidant defense, were significantly enriched, suggesting this gene set participates in stress signal transduction and antioxidant defense mechanisms. Pathways related to cellular damage repair and protein degradation, such as homologous recombination (ko03440) and proteasome (ko03050), were also significantly identified. Additionally, multiple amino acid degradation pathways were enriched, including valine, leucine, and isoleucine degradation (ko00280), alanine, aspartate, and glutamate metabolism (ko00250), and arginine and proline metabolism (ko00330). Basal transcription factors (ko03022) and multiple nucleotide metabolism pathways (purine metabolism, pyrimidine metabolism) were also significantly enriched. These results indicate that the yield-negatively correlated gene set mainly participates in plant stress signal transduction, oxidative stress defense, DNA damage repair, intracellular protein degradation, and various amino acid degradation metabolic processes, revealing complex regulatory networks and biological pathways underlying yield decline.
Identification of core genes in key modules and interaction network analysis
-
To screen hub genes within key modules, we considered both module membership (kME) and gene significance (GS) for yield. Genes with kME > 0.9 were selected as candidate hub genes. GS was calculated as the absolute Pearson correlation between each gene's expression level and yield across samples. All 23 candidate hub genes exhibited high GS values (absolute correlation coefficients ranging from 0.75 to 0.88, Supplementary Table S5), confirming their strong association with yield. Using an edge weight threshold of 0.1, the interaction networks of these hub genes were visualized with Cytoscape software (Fig. 5). Among them, 17 genes were positively correlated with yield, and six were negatively correlated (Supplementary Table S5). These genes were subsequently subjected to homology comparison with Arabidopsis to predict their potential functions.
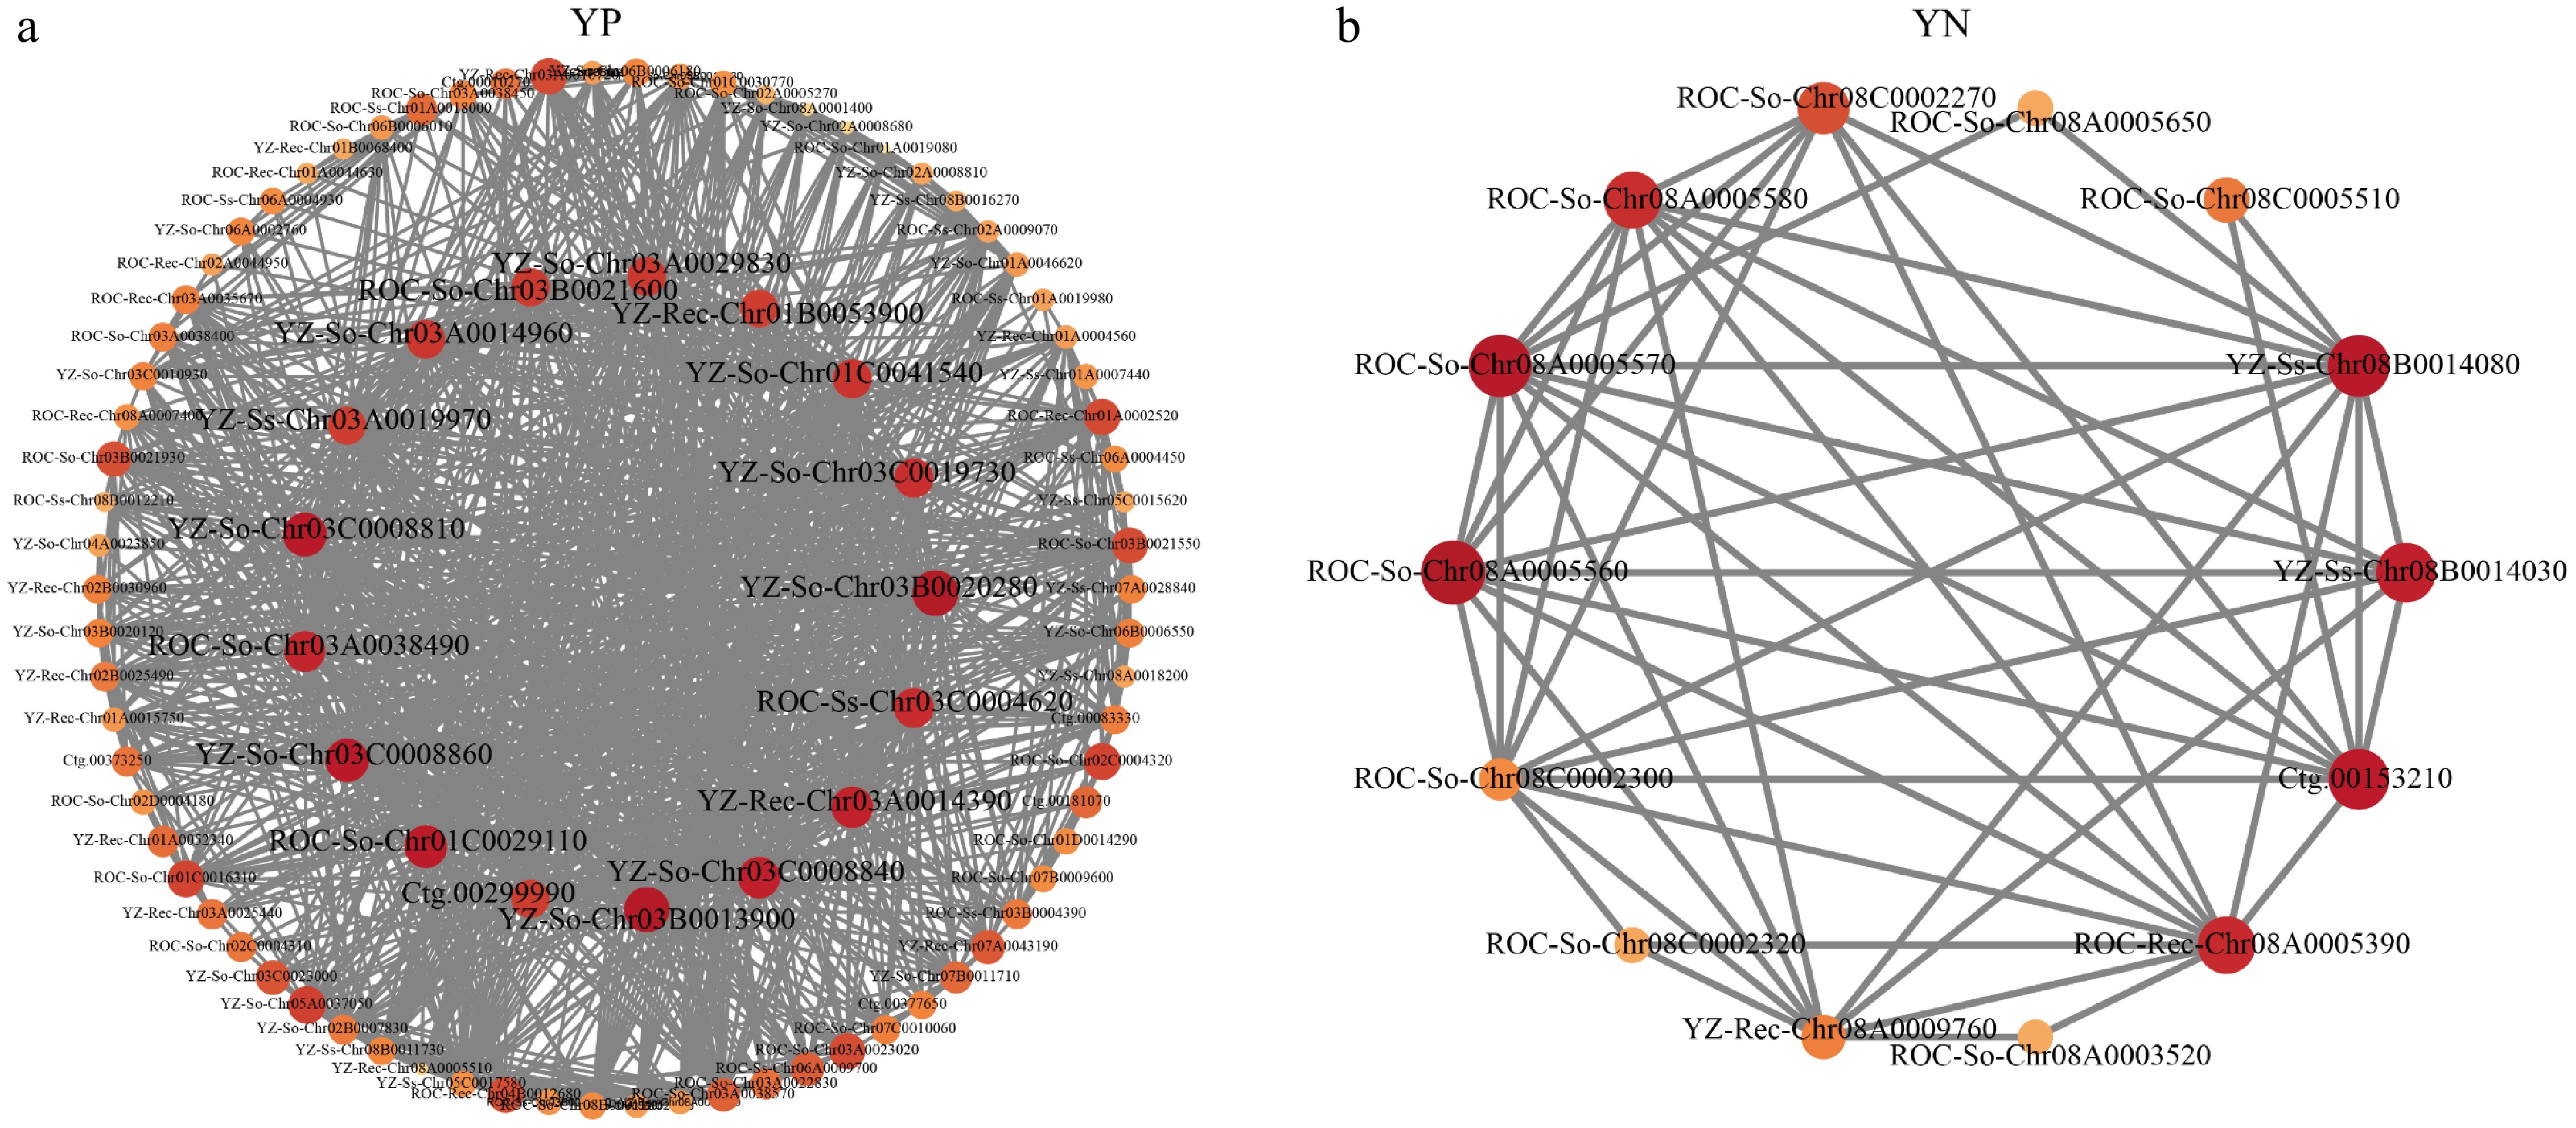
Figure 5.
Co-expression networks of core genes in YP and YN modules. (a) YP module network containing 17 hub genes (dark red nodes) and their co-expressed genes. (b) YN module network containing six hub genes (dark red nodes) and their co-expressed genes. Node size reflects gene connectivity; edges represent co-expression relationships. Selection criteria: kME > 0.9, weight > 0.1.
Results showed that among the 17 positively correlated hub genes in the YP module, five genes (ROC-So-Chr03B0021600, ROC-Ss-Chr03C0004620, YZ-Rec-Chr03A0014390, YZ-So-Chr03A0014960, and YZ-So-Chr03C0019730) were homologous to Arabidopsis AT1G06040 (STO), encoding B-box zinc finger proteins. These transcription factors are involved in multiple biological processes, including light signal transduction, salt stress response, and photoperiod regulation[33,34]. Four genes (YZ-So-Chr03B0013900, etc.) were homologous to heat shock transcription factor AT3G24520 (HSFC1), playing key roles in heat shock response, oxidative stress defense, and protein folding quality control[35,36]. Another four genes (Ctg.00299990, etc.) encoded MIP aquaporin proteins (PIP1;5 homologs), localized to the plasma membrane and involved in root water absorption and regulation[37]. Additionally, ROC-So-Chr01C0029110 was homologous to AT2G22240 (myo-inositol-3-phosphate synthase, MIPS2), catalyzing inositol synthesis and participating in signal transduction and osmotic protection[38]; YZ-Rec-Chr01B0053900 was homologous to enoyl-acyl carrier protein reductase (ABA2), involved in fatty acid synthesis and abscisic acid biosynthesis[39]; YZ-So-Chr01C0041540 corresponded to AFP3, participating in signal transduction[40]; YZ-So-Chr03C0008840 was homologous to cysteine-rich receptor-like kinase CRK8, involved in plant immunity and stress recognition[41].
Among the six negatively correlated hub genes in the YN module, all genes encoded Cupin domain proteins or germin-like proteins (GLP). Two genes (ROC-So-Chr08A0005560 and ROC-Rec-Chr08A0005390) were homologous to Arabidopsis AT4G14630 (GLP9), containing an N-terminal signal peptide and potentially localized to vacuoles, plasma membrane, or extracellular space. The other four genes (ROC-So-Chr08A0005570, YZ-Ss-Chr08B0014030, YZ-Ss-Chr08B0014080, and Ctg.00153210) were homologous to AT5G39110, encoding RmlC-like cupins superfamily proteins. The Cupin domain is an evolutionarily conserved β-barrel structure with metal ion (particularly manganese ion) binding sites, capable of catalyzing superoxide dismutation, oxalate oxidation, and other enzymatic reactions[42,43]. GLP family proteins are widely involved in oxidative stress response, cell wall modification, pathogen defense, and programmed cell death in plants. Their overexpression during later ratoon stages may be closely related to root senescence, reactive oxygen species accumulation, and cell wall reinforcement, leading to reduced root vitality[44−46].
Functional annotation of these hub genes revealed that transcription factors occupy a central position in ratooning performance regulation. Through PlantTFDB database comparison, ten of the 17 positively correlated hub genes (58.8%) were identified as transcription factors. These ten transcription factors were classified into two major categories: (1) five DBB (Double B-box) family members encoding B-box zinc finger proteins, involved in light signal transduction and salt stress response; (2) five HSF (Heat Shock Factor) family members, including four HSFC1 homologs and one CRK8 receptor kinase, involved in heat shock response and oxidative defense.
Validation of candidate genes
-
To validate the accuracy of RNA-seq data, 10 genes were selected for qRT-PCR verification. These 10 selected genes included 8 genes positively correlated with yield, comprising two STO homologs, two HSFC1 homologs, two PIP1;5 homologs, one MIPS2 homolog, and one ABA2 homolog; and two genes negatively correlated with yield, including one GLP9 homolog and one gene homologous to AT5G39110. qRT-PCR results showed that expression changes of these ten genes across different ratoon year samples were highly consistent with RNA-seq data (Fig. 6b−l), demonstrating the reliability of transcriptome sequencing data obtained in this study for subsequent analysis.
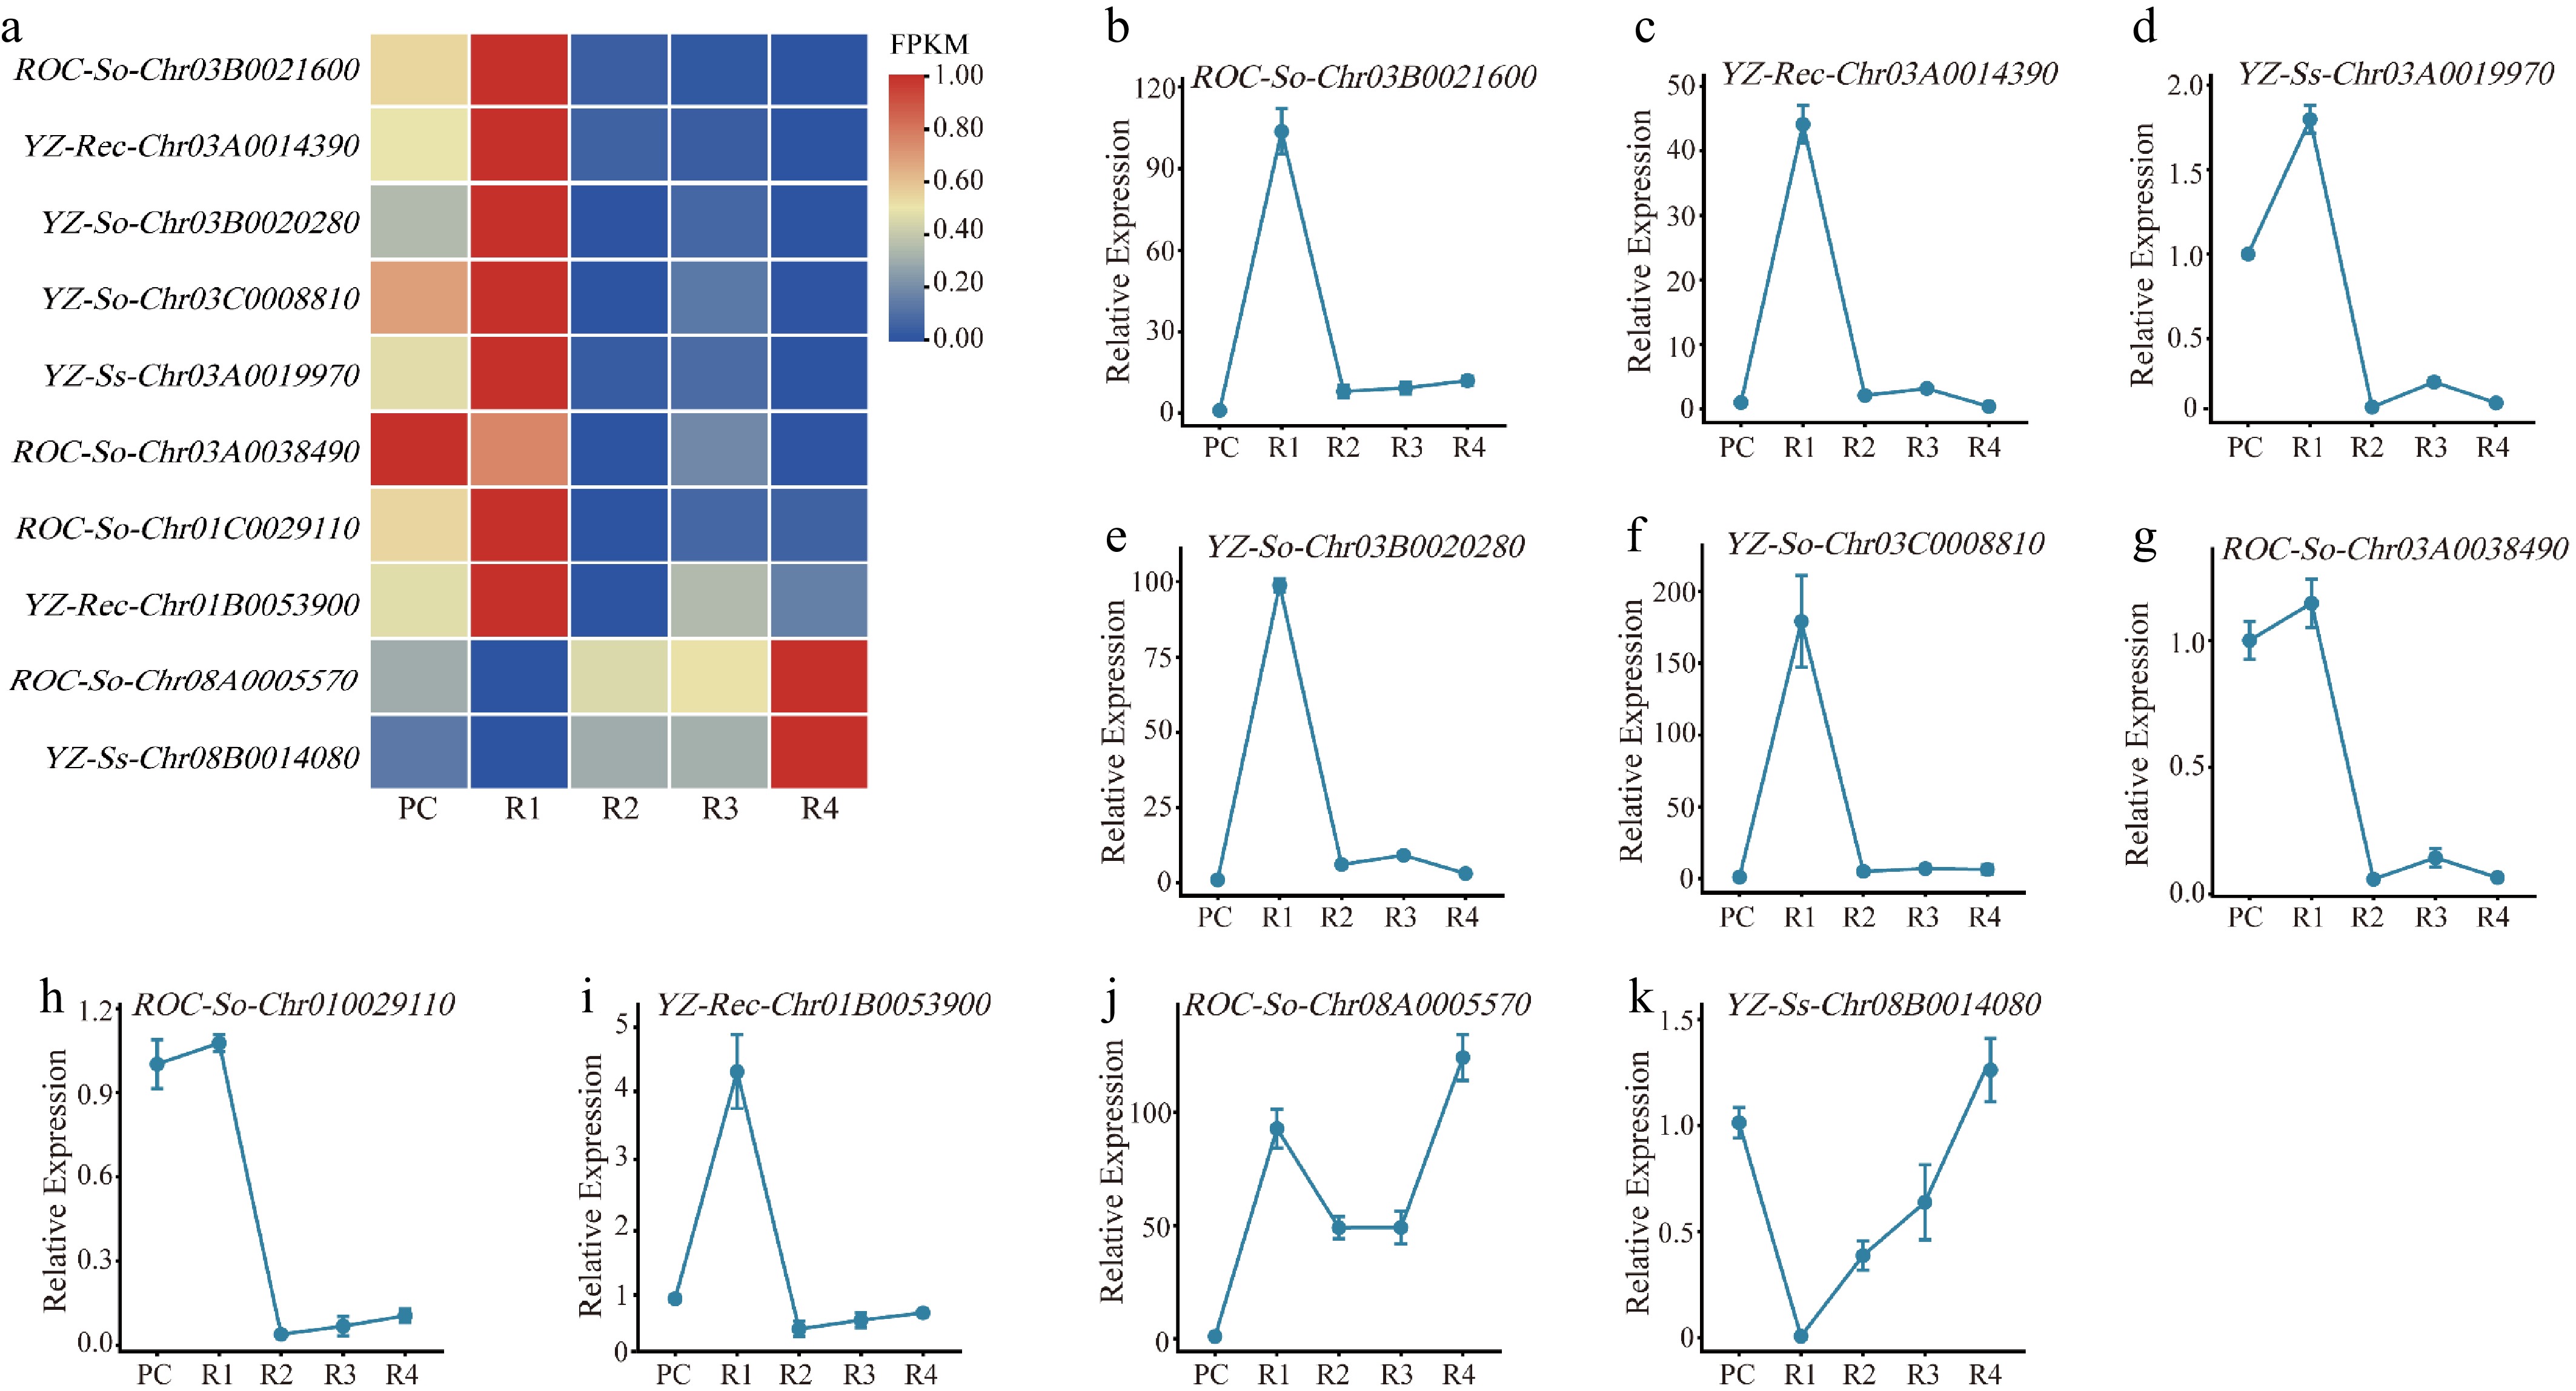
Figure 6.
Expression patterns of ten candidate genes across different planting years validated by transcriptome and qRT-PCR analysis. (a) Heatmap of expression patterns for ten candidate genes across different planting years. Expression levels of ten candidate genes in sugarcane roots at different planting years. Color scale represents normalized relative expression levels, with red indicating high expression and blue indicating low expression. (b)–(k) qRT-PCR validation of the relative expression levels of the ten candidate genes in sugarcane roots. Expression was calculated using the 2−ΔΔCᴛ method with UBQ as the internal reference gene and plant cane (PC) samples as the calibrator (set to 1). Data are presented as mean ± standard error of the mean (SEM) from three biological replicates, each with three technical replicates. The error bars represent the SEM. The qRT-PCR results were highly consistent with the RNA-seq data (shown as colored lines in each panel), confirming the reliability of the transcriptome analysis.
-
YZ08-1609 is a medium-large stalk sugarcane variety bred in Yunnan, possessing excellent characteristics including early maturity, high yield, high sugar content, strong drought resistance, and strong ratoonability. It exhibits moderate resistance to smut disease, high resistance to mosaic disease, and good storability[47]. However, under continuous ratoon cultivation, this variety still displayed obvious yield decline, accompanied by progressive reductions in growth indicators such as plant height and stalk diameter. It is noteworthy that millable stalk number did not change significantly across ratoon years in this study, while plant height showed a pronounced decline. This observation suggests that, in the YZ08-1609 variety, the reduction in plant height was a major contributor to yield loss. Stalk diameter showed no clear linear trend; its transient recovery to the level of plant cane at R3 may be attributable to the relatively high variation among the three biological replicates within the R3 group (SD = 0.07) rather than a consistent biological phenomenon. These partially inconsistent trait patterns underscore that ratoon yield decline is a complex trait governed by multiple growth processes, and different yield components may respond independently to ratoon stress. Moreover, the relative contribution of each yield component to overall yield may vary by genotype, and the present results reflect the specific response pattern of YZ08-1609 under the experimental conditions.
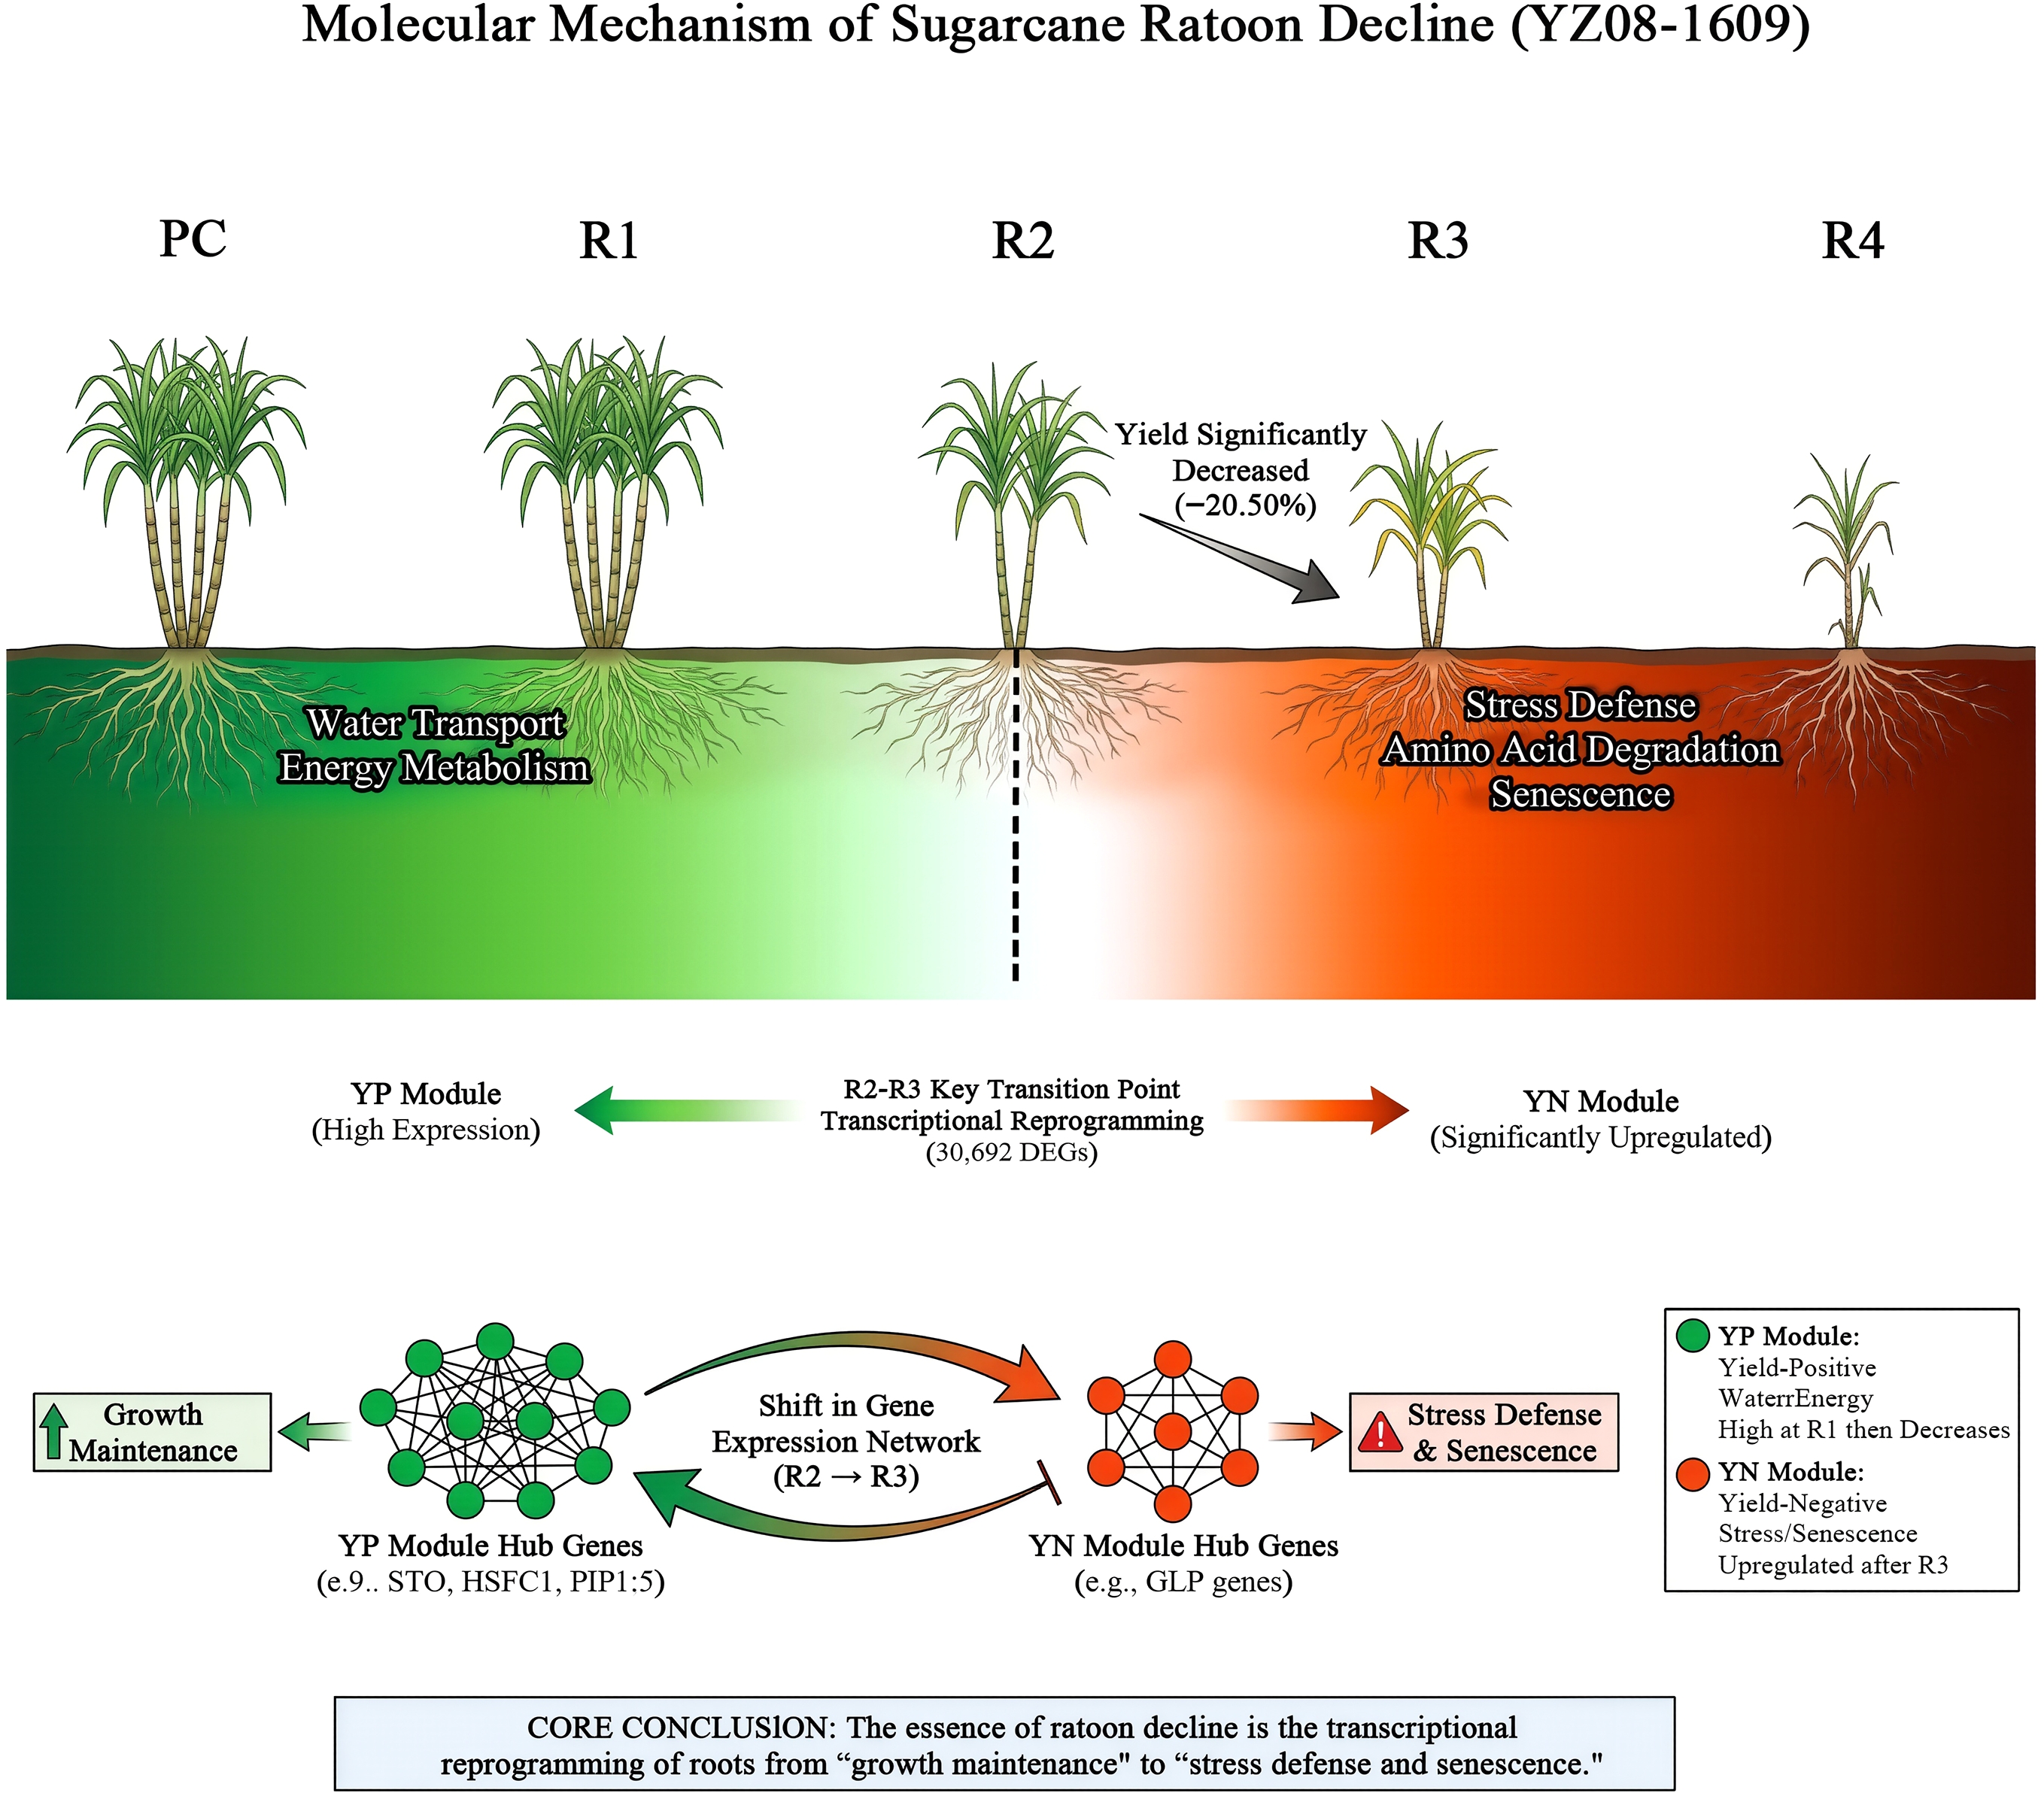
WGCNA analysis identified a yield-positively correlated gene set (YP, N = 276) and a yield-negatively correlated gene set (YN, N = 75), whose expression dynamics systematically mapped the functional decline process of ratoon roots (Fig. 3). The YP gene set (enriched in water transport, energy metabolism and other pathways) showed high expression during early ratoon stages (R1) followed by continuous decline, while the YN gene set (enriched in MAPK signaling, antioxidant metabolism, and amino acid degradation pathways) was significantly upregulated only during later ratoon stages (after R3) (Fig. 4). The significant decline in plant height and stalk diameter during early ratoon stages suggested that root function may have been impaired at this time (Fig. 1, Supplementary Table S2); however, the high expression of YP genes may have partially buffered the immediate impact on yield. This is similar to strategies observed in perennial fruit trees, where roots upregulate water transport and nutrient absorption-related genes following pruning or environmental stress to maintain aboveground growth[48−50]. However, as ratoon years increased, YP gene expression continued to weaken (Fig. 6a), which was associated with progressive loss of root capacity to maintain growth. These correlative data suggest that the decline in YP expression is strongly associated with the significant yield reduction observed at R3, although causality cannot be inferred from transcriptomic data alone. Notably, the significant upregulation of the YN gene set occurred after a significant yield decline, and this temporal pattern suggests that its activation was more likely a response to environmental changes, soil microbiome shifts, and increased soil stress (deep stress response and senescence) rather than an initial driver. Similarly, in rice leaf senescence, activation of amino acid degradation and other pathways also marks the transition from anabolic to catabolic metabolism[51−53]. Although YN genes are not direct drivers of yield decline, their sustained high expression during later ratoon stages may exacerbate the senescence process by redirecting limited resources toward defense and repair rather than growth. Therefore, the present study suggests that ratooning performance decline is associated with a transcriptional reprogramming of roots from 'growth maintenance' toward 'stress defense and senescence'.
Among the 17 hub genes in the YP module, ten were annotated as transcription factors (58.8%), a proportion that was numerically higher than the background frequency in the entire YP module (39.9%) but not statistically significant (Fisher's exact test, p = 0.1256). This likely reflects the central topological role of transcription factors in co-expression networks[54]. These transcription factors are mainly classified into the DBB (Double B-box) family and HSF (Heat Shock Factor) family (Fig. 5, Supplementary Table S5). Five DBB family genes encode B-box zinc finger proteins homologous to Arabidopsis thaliana STO (AT1G06040), which promotes plant adaptation to environmental changes by regulating the expression of light signal transduction and salt stress response genes[55]. Sugarcane ratoon roots face multiple stresses, including soil moisture fluctuations and temperature changes after harvest, and high expression of DBB family genes may help roots rapidly restore absorption function by activating stress defense-related genes[56,57]. Four HSF family genes are homologous to HSFC1 (AT3G24520), which plays key roles in heat shock response, oxidative stress defense, and protein folding quality control[36]. In ratooning rice, microbial agent-induced upregulation of OsHsfC1b was closely associated with significant yield improvements in both main and ratoon seasons[58]. In this study, the expression of these transcription factor genes peaked during early ratoon stages and then gradually declined, a dynamic pattern highly consistent with the temporal progression of root functional decline, suggesting that their expression decline may contribute to weakened root functional maintenance capacity. Besides transcription factors, four aquaporin genes (PIP1;5 homologs) also play critical roles in ratooning performance maintenance. In grapevine studies, PIP family gene expression levels are positively correlated with root water transport capacity, and their downregulation leads to increased water stress sensitivity[59,60]. In this study, the declining expression trend of PIP1;5 homologous genes was synchronized with the continuous decrease in plant height and stalk diameter, indicating that weakened root water supply capacity may directly limit aboveground vegetative growth. Additionally, MIPS2 homologous genes participate in osmotic protection and signal transduction, while ABA2 homologous genes are involved in abscisic acid biosynthesis. The coordinated expression of these genes with aquaporin genes collectively constitutes the root water balance regulatory network[61,62]. Therefore, transcription factors maintain root function by regulating stress responses and protein homeostasis, while aquaporins and related metabolic enzymes directly participate in water and nutrient absorption and transport. The synergistic action of both may contribute to root functional compensation during early ratoon stages, and their expression decline is closely associated with ratooning performance deterioration.
All six hub genes in the YN module encode germin-like proteins (GLP) containing Cupin domains (Fig. 5, Supplementary Table S5). These genes maintained low expression during early ratoon stages, only began to be upregulated after significant yield decline, and showed significantly high expression in the fourth ratoon year, at which point yield had decreased by 20.50% compared to plant cane (Fig. 1, Supplementary Table S2). This temporal pattern indicates that GLP gene activation is a consequence rather than an initial cause of root decline, but its sustained high expression may further accelerate the senescence process. GLP proteins possess superoxide dismutase activity and oxalate oxidase activity, participating in oxidative stress response and cell wall modification[63]. Their catalytic product, hydrogen peroxide (H2O2), if not promptly scavenged, can cause oxidative damage. Wheat research has shown that GLP overexpression leads to excessive H2O2 accumulation and reduced root vitality[44]. Meanwhile, GLP-mediated excessive cell wall lignification reduces root water absorption capacity, a similar phenomenon observed in aging rice roots[44]. Under chronic stress conditions during later ratoon stages, sustained activation of GLP genes reflects a state of 'excessive defense' in roots, and this over-defense response may accelerate root decline through oxidative damage and reduced absorption capacity[63]. Therefore, reducing GLP expression through gene editing or screening for low-expression alleles may represent an effective approach for improving ratooning performance.
-
This study identifies a core correlative characteristic of root gene expression during sugarcane ratoon yield decline, namely a programmed-like transition from 'growth maintenance' to 'stress defense and senescence' that is strongly associated with yield decline. Functional validation (e.g., gene overexpression or knockout) is required to establish causal relationships. Expression of key hub genes that maintain root function during early stages (such as aquaporins and transcription factors, including B-box and HSF families) attenuates with extended ratoon years. Simultaneously, defense and catabolic pathways represented by GLP family genes are continuously activated. This systematic reprogramming profile provides a theoretical basis and molecular targets for delaying root senescence and improving ratooning performance through targeted breeding strategies.
-
The transcriptomic analyses and WGCNA presented here are correlated by nature. While we identified strong associations between YP/YN gene expression and yield decline, we cannot infer causality without direct physiological measurements of root function (e.g., root hydraulic conductivity, nutrient uptake rates, oxidative stress markers) or genetic manipulation of candidate hub genes. Future studies should integrate these approaches to validate the functional roles of the identified hub genes in ratoon performance decline.
-
The authors confirm their contributions to the paper as follows: data visualization, writing – draft manuscript preparation: Yang Z; investigation: Li Y, Zhang Z; writing − revision & editing: Deng J, Liu J, Zan F, Lu X, Wu J, Gao Y; Zhao Y; conceptualization: Zhao Y, Zhang Y. All authors reviewed the results and approved the final version of the manuscript.
-
The datasets presented in this study can be found in online repositories. The raw reads have been deposited in the Genome Sequence Archive (GSA, https://ngdc.cncb.ac.cn/gsa) under accession number CRA032661. All other generated datasets are provided within the manuscript and supplementary information files.
-
This research was funded by National Key Research and Development Program of China (Grant No. 2025YFD2300103), National Natural Science Foundation of China (Grant No. 32560521), Earmarked Fund for China Agriculture Research System (Grant No. CARS-17), Yunnan Province Xingdian Talent Technical Support Program Project (Grant No. XDYC-YLXZ-2022-0038), Central Guidance Fund for Local Science and Technology Development (Grant No. 202407AB110007), Technology Innovation talents in Yunnan Province (Grant Nos 202305AD160041, 202205AM070001).
-
The authors declare that they have no conflict of interest.
-
accompanies this paper online at: https://doi.org/10.48130/tp-0026-0020.
-
Received 3 March 2026; Accepted 6 May 2026; Published online 13 July 2026
- Supplementary Table S1 Primer sequence for qRT-PCR.
- Supplementary Table S2 Performance of key agronomic traits in sugarcane across different planting years.
- Supplementary Table S3 Assessment of sample sequencing quality.
- Supplementary Table S4 Statistics of differentially expressed genes in pairwise comparisons.
- Supplementary Table S5 Homology analysis and protein annotation of key genes in the target modules against Arabidopsis thaliana.
- Supplementary Fig. S1 Overall characteristics of gene expression profiles in sugarcane roots across different planting years.
- Supplementary Fig. S2 Venn diagram analysis of differentially expressed genes (DEGs).
- Supplementary Fig. S3 Heatmap and hierarchical clustering of correlations between modules.
- Copyright: © 2026 by the author(s). Published by Maximum Academic Press on behalf of Hainan University. This article is an open access article distributed under Creative Commons Attribution License (CC BY 4.0), visit https://creativecommons.org/licenses/by/4.0/.
-
About this article
Cite this article
Yang Z, Li Y, Zhang Z, Deng J, Liu J, et al. 2026. Identification of hub genes associated with yield through root transcriptome dynamics under sugarcane ratoon cropping. Tropical Plants 5: e024 doi: 10.48130/tp-0026-0020 

Identification of hub genes associated with yield through root transcriptome dynamics under sugarcane ratoon cropping
- Received: 03 March 2026
- Revised: 14 April 2026
- Accepted: 06 May 2026
- Published online: 13 July 2026
Abstract: Sugarcane ratoon yield decline is closely related to root function, yet the molecular mechanisms linking root transcriptome dynamics to yield decline under ratoon cropping remain unclear. Using YZ08-1609, a major cultivar in Yunnan, we constructed a five-year root transcriptome time series from plant cane to the fourth ratoon, generating 150.64 Gb of high-quality data. Integrating agronomic traits (yield, plant height, stalk diameter, and millable stalks) with weighted gene co-expression network analysis (WGCNA), we identified core modules and hub genes associated with ratoon yield decline. Yield significantly decreased by 20.50% in the third ratoon compared with plant cane (one-way ANOVA with Tukey's HSD post-hoc test, p < 0.05). Using thresholds of |log2(fold change)| ≥ 1 and false discovery rate (FDR) < 0.05, we identified 30,692 differentially expressed genes between the second and third ratoon years, indicating large-scale transcriptomic reprogramming at this stage. WGCNA revealed a yield-positively correlated module (YP, 276 genes) enriched in water transport, energy metabolism, and hormone signaling, containing 17 hub genes (ten transcription factors, four aquaporins) that showed compensatory high expression in early ratoon followed by continuous decline, impairing root function. A yield-negatively correlated module (YN, 75 genes) enriched in stress defense and amino acid degradation contained six hub genes encoding germin-like proteins, which were upregulated after yield decline and accelerated root senescence via oxidative stress and cell wall fortification. qRT-PCR validated the transcriptome data. This study suggests that ratoon yield decline is associated with a transcriptional transition from growth maintenance to defense and senescence in roots, providing potential molecular targets for genetic improvement of sugarcane ratoon performance.
-
Key words:
- Sugarcane /
- Ratoon /
- Transcriptome /
- WGCNA /
- Yield decline