-
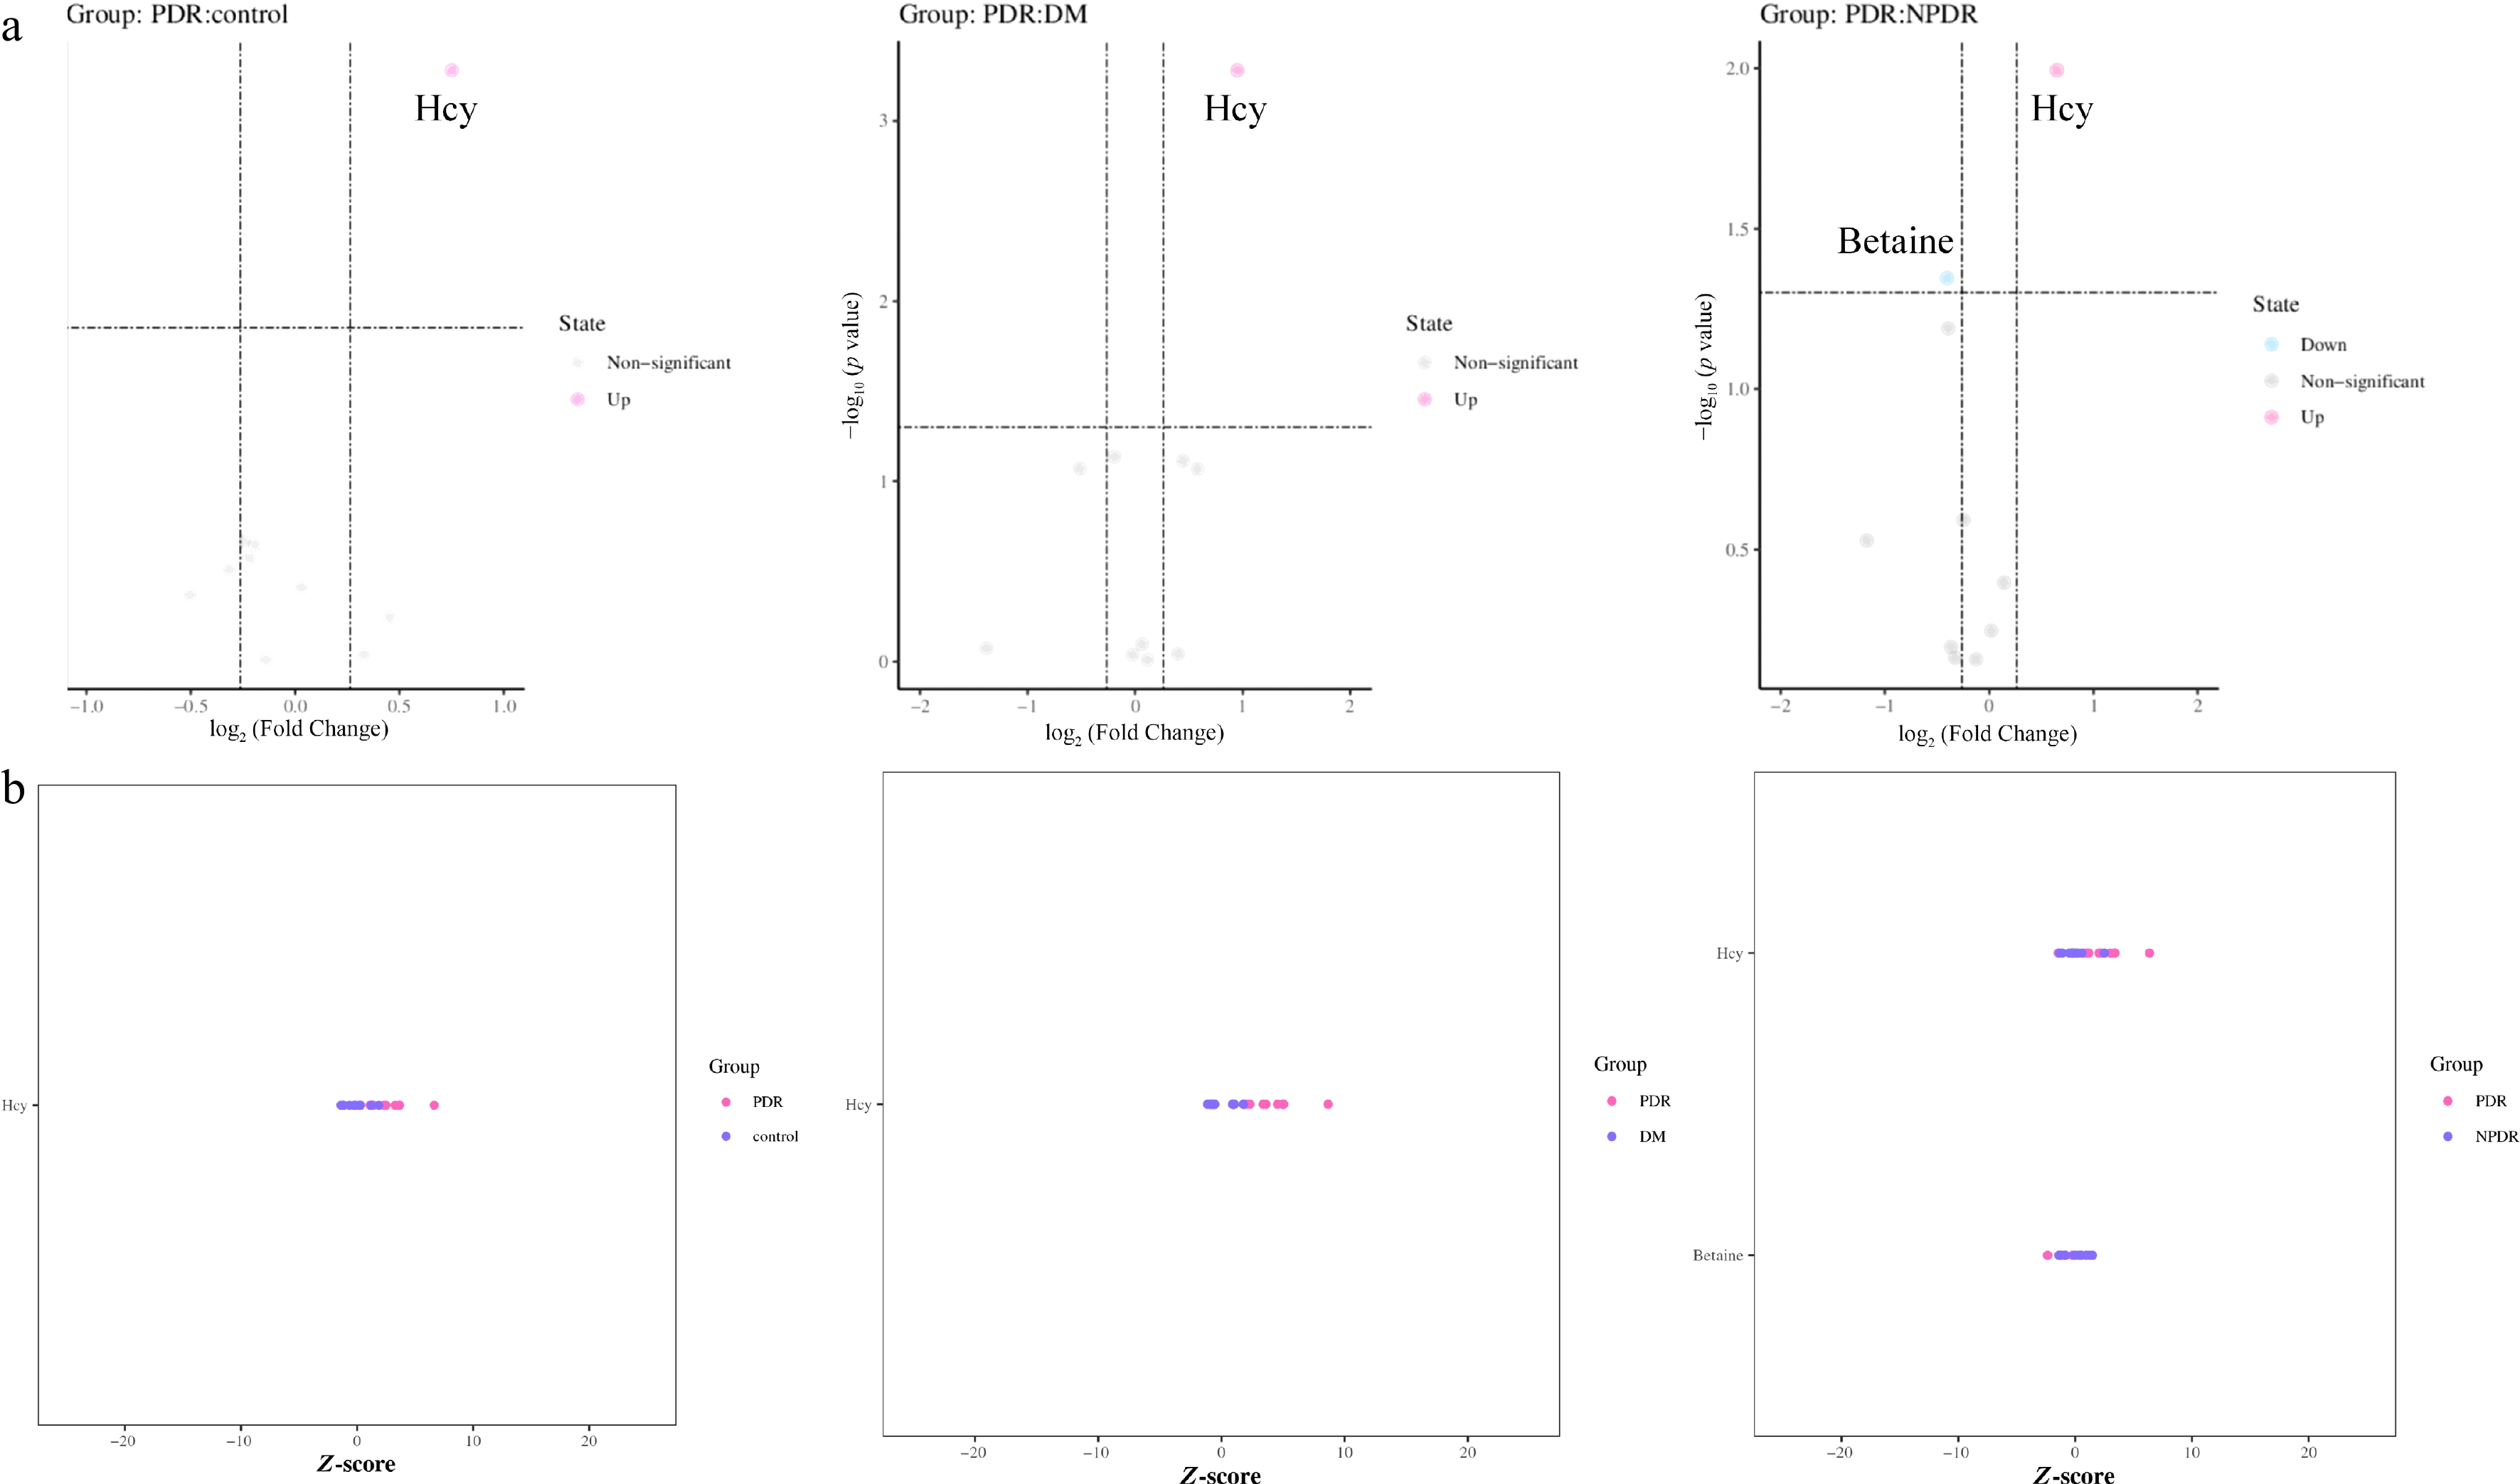
Figure 1.
Differential methionine-cycle metabolites in PDR. (a) Volcano plot showing significantly altered metabolites based on fold change > 1.2 or < 0.83 and p < 0.05. Homocysteine and betaine are labeled. (b) Z-score heatmap showing the metabolic profile across groups.
-
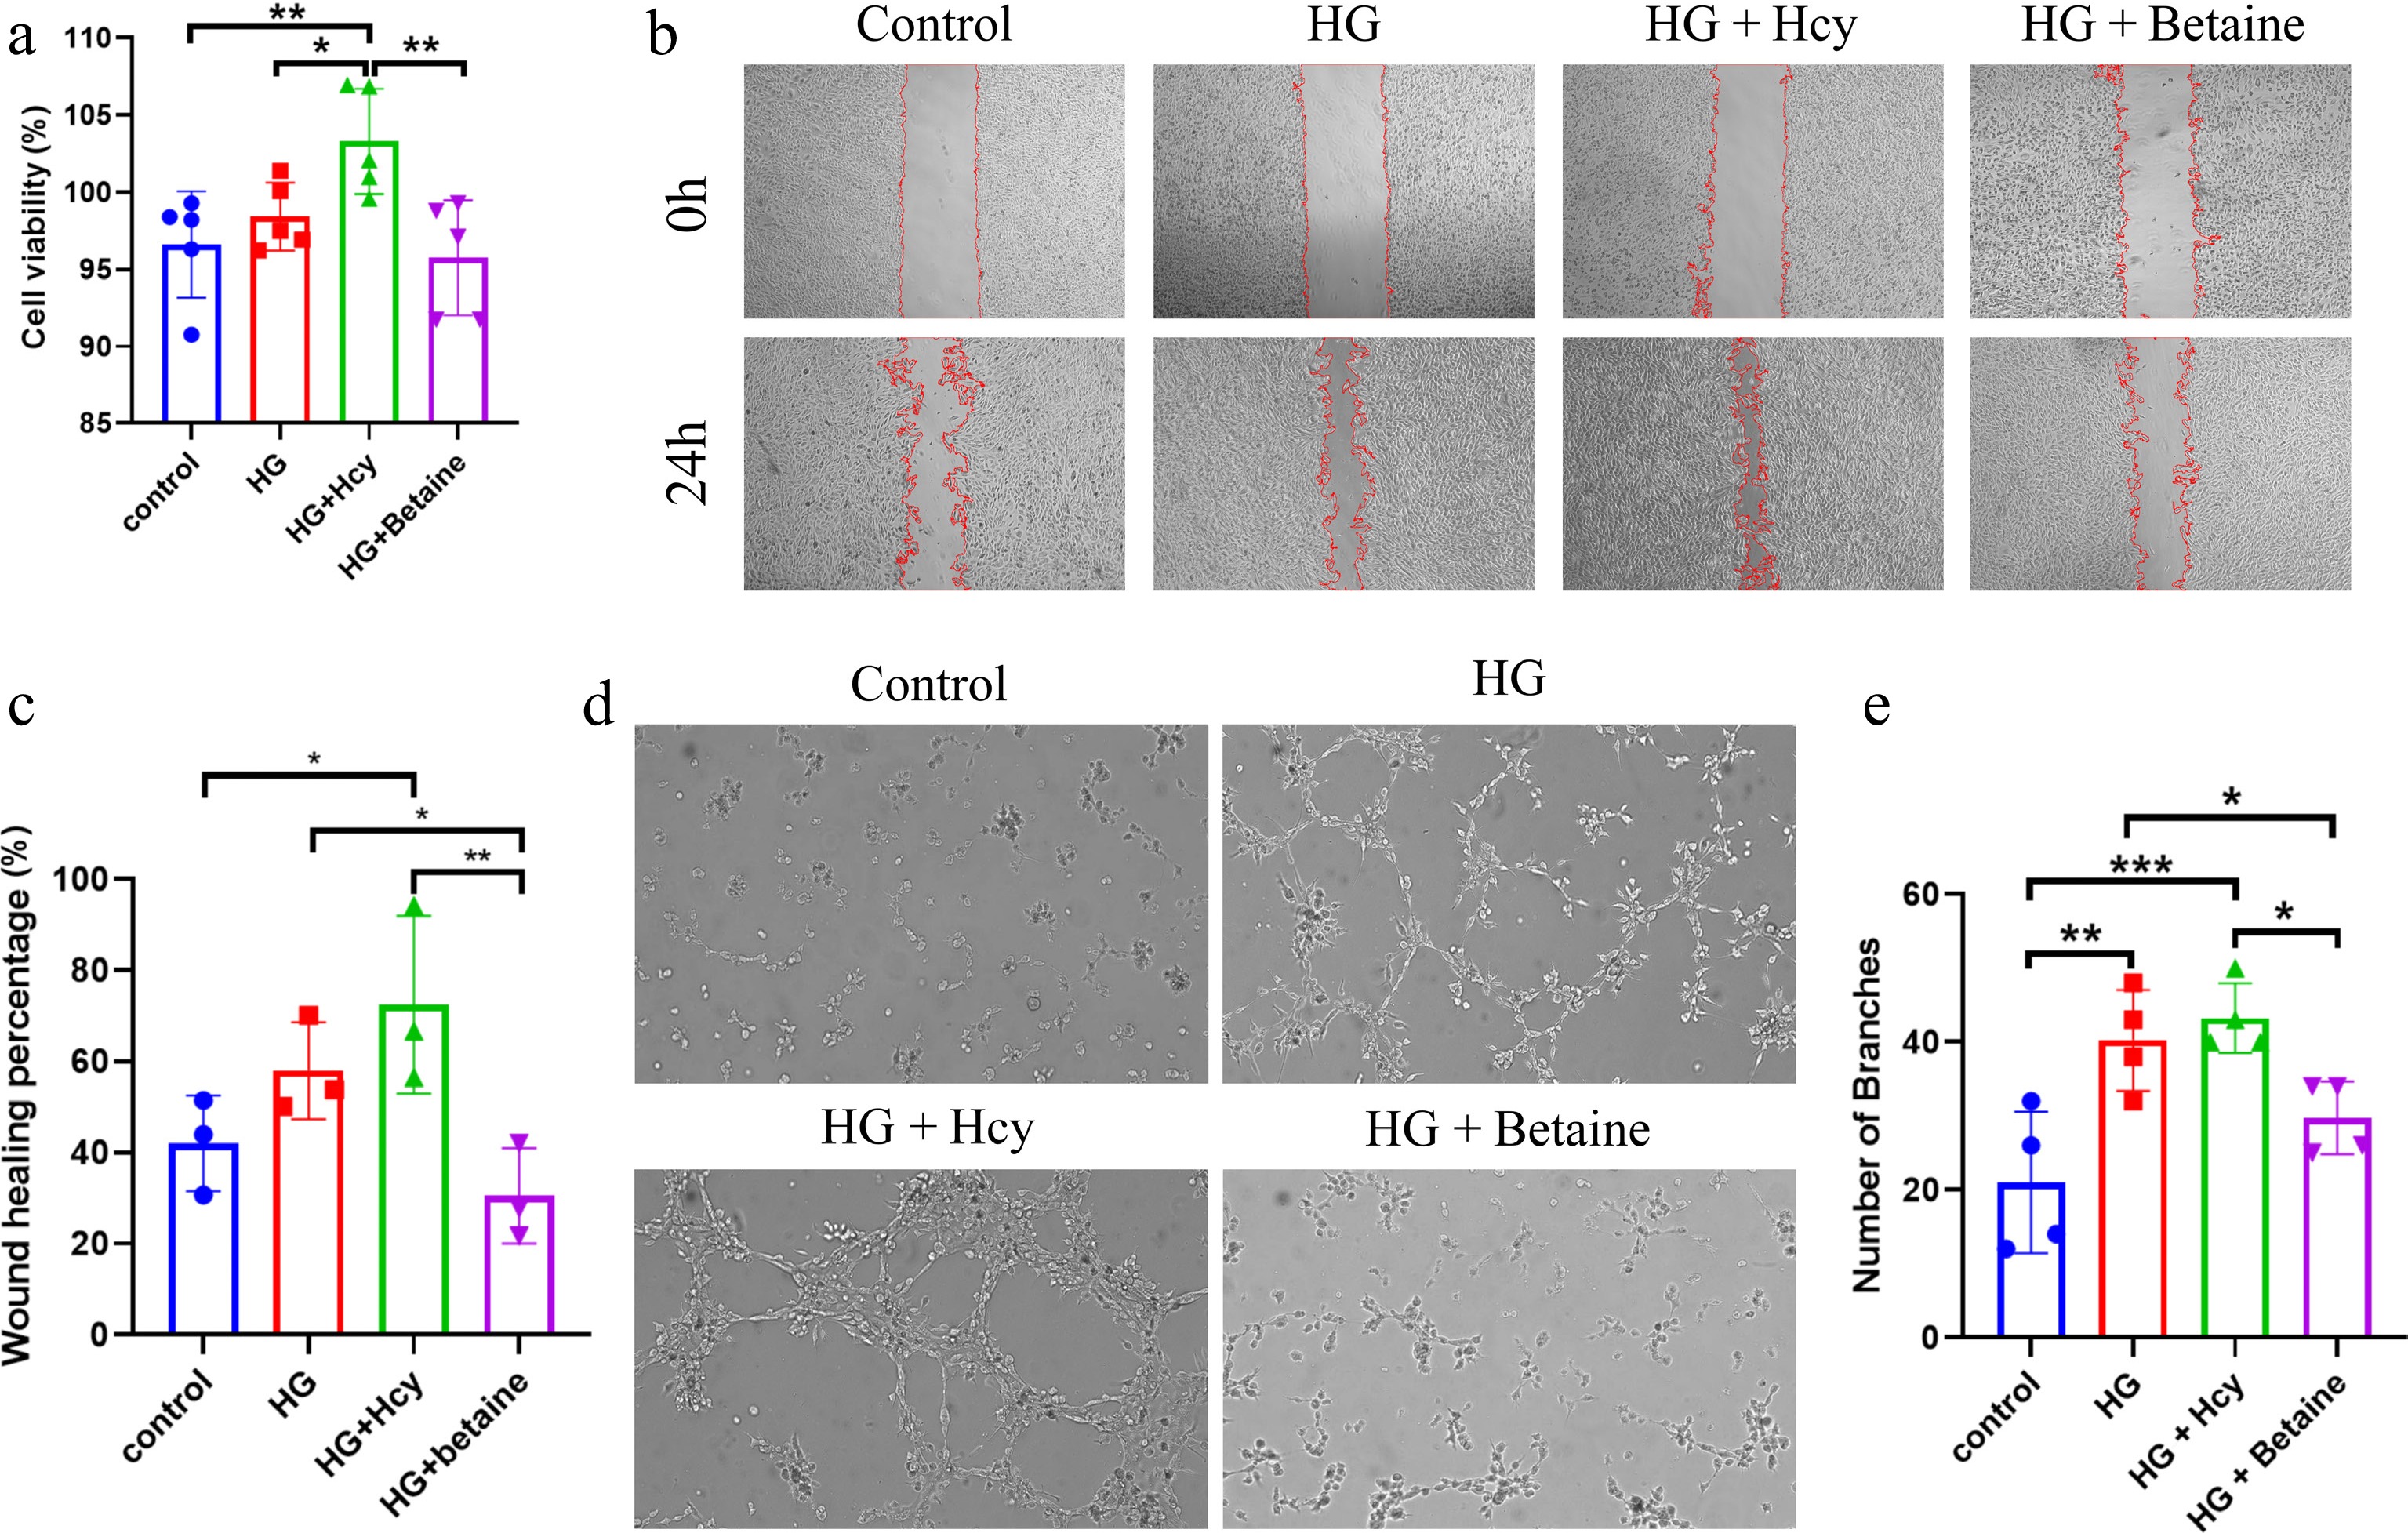
Figure 2.
Effects of betaine on high-glucose-induced angiogenic responses in HRMECs. (a) CCK-8 assay. (b, c) Scratch migration assay. (d, e) Tube formation assay. * p < 0.05, ** p < 0.01.
-
Variable Control DM without DR NPDR PDR p-Value Participants, n (female) 10 (5) 9 (3) 8 (3) 7 (2) 0.815 Age, years 72.3 ± 11.46 70.78 ± 6.85 51.63 ± 14.06 49.86 ± 8.59 < 0.001 Eyes 10 10 10 10 − Type 2 diabetes, n − 9 8 7 − Duration of DM, years − 7.57 ± 6.15 9.63 ± 5.76 16.71 ± 10.59 < 0.001 FBG, mmol/L 7.69 ± 1.90 9.06 ± 2.96 9.50 ± 3.78 8.21 ± 2.95 0.851 HbA1c, % − 7.42 ± 1.64 11.43 ± 8.78 7.4 ± 1.02 0.315 Participants with hypertension, n 6 3 5 2 0.423 Table 1.
Demographic and clinical characteristics of the study participants.
-
Metabolite Imaging parameter r p-Value Betaine DVC (0–21 mm) 0.734 0.007** DVC (6–12 mm) 0.804 0.002** DVC (15–21 mm) 0.636 0.026* RNFL (3–6 mm) −0.692 0.013* CI 0.804 0.002** FD 0.657 0.020* Hcy SVC-I −0.623 0.030* SAM/SAH DVC (0–3 mm) 0.601 0.039* DVC (1–3 mm) 0.634 0.027* DVC-N 0.678 0.015* SVC-S 0.585 0.046* SVC (12–15 mm) 0.602 0.038* VB2 RNV −0.893 0.007** SVC: superficial vascular complex; RNFL: retinal nerve fiber layer; DVC: deep vascular complex; CI: circularity index; FD: fractal dimension; RNV: retinal neovascularization; S: superior; I: inferior; N: nasal. * p < 0.05, ** p < 0.01. Table 2.
Key correlations between methionine-cycle metabolites and WF SS-OCTA parameters.
Figures
(2)
Tables
(2)