













-
Diabetic retinopathy (DR) remains a leading cause of vision loss among the working-age population and represents one of the most prevalent microvascular complications of diabetes worldwide[1,2]. Despite advances in glycemic, blood pressure, and lipid control, a substantial proportion of individuals still develop DR, whereas others with long-standing diabetes remain unaffected. Traditional risk factors, including glycated hemoglobin (HbA1c), explain only a small proportion of interindividual variation in DR risk, underscoring the need to identify additional pathogenic mechanisms[3].
Proliferative diabetic retinopathy (PDR) is the most vision-threatening stage of DR, characterized by retinal neovascularization (RNV) and associated complications such as vitreous hemorrhage, tractional retinal detachment, and macular edema[4]. Although laser photocoagulation and intravitreal anti-vascular endothelial growth factor (anti-VEGF) therapy remain the current standard treatments, many patients experience incomplete responses or require repeated injections, which may be associated with systemic cardiovascular risks[5,6]. Consequently, identifying the novel pathways underlying neovascularization is critical for developing alternative therapeutic strategies.
Recent studies have increasingly applied metabolite profiling to explore the biochemical alterations associated with DR[7,8]. Rather than providing a global molecular overview, metabolomics captures downstream metabolic disturbances that more directly reflect cellular dysfunction[9]. This approach is therefore particularly suited to investigating the metabolic pathways implicated in microvascular injury[10]. Preliminary untargeted vitreous metabolomic profiling in PDR identified 165 differential metabolites and 21 significantly enriched Kyoto Encyclopedia of Genes and Genomes (KEGG) pathways. Among pathways with a differential metabolite count ≥ 5, five showed significant enrichment. These included methionine and cysteine metabolism, together with glycine, serine and threonine metabolism, ascorbate and aldarate metabolism, biosynthesis of amino acids, and central carbon metabolism in cancer[11]. We therefore selected the methionine cycle for targeted validation because it represents a key component of one-carbon metabolism and links methylation capacity, homocysteine (Hcy) remethylation, glutathione synthesis, redox homeostasis, and endothelial function. Elevated Hcy has been associated with oxidative stress, endothelial dysfunction, and microvascular injury in diabetes. Betaine serves as a methyl donor for Hcy remethylation and has been implicated in anti-inflammatory, antioxidant, and anti-angiogenic responses[12,13]. These biological and preliminary metabolomic findings provided the rationale for focusing on methionine-cycle metabolites in the aqueous humor (AH) from patients with PDR.
Concurrently, widefield swept-source optical coherence tomography angiography (WF SS-OCTA) enables quantitative and noninvasive visualization of retinal vasculature over 120°–130° of the fundus, extending beyond the posterior pole. Parameters such as non-perfusion area, capillary dropout, and RNV area reflect disease severity and can serve as imaging biomarkers[14].
Building upon preliminary signals from untargeted metabolomics, this study used a targeted approach to quantify metabolites within the methionine cycle in the AH of patients with PDR. We further integrated in vitro endothelial assays to examine the biological relevance of betaine and used WF SS-OCTA in a subset of eyes to perform exploratory analyses linking metabolite levels with clinically relevant retinal microvascular parameters.
-
This retrospective observational study included 40 eyes from 34 patients. Participants were consecutively enrolled from patients scheduled for cataract surgery or intravitreal injection at the Department of Ophthalmology, Guangdong Provincial People's Hospital, between August 2022 and October 2024.
The inclusion criteria were as follows: age ≥ 18 years; availability of AH samples; completion of a comprehensive ophthalmic examination; and provision of informed consent. Control participants were non-diabetic patients undergoing cataract surgery for age-related cataract. Diabetic participants had a documented diagnosis of diabetes mellitus and were classified as diabetes without DR, non-proliferative diabetic retinopathy (NPDR), or PDR according to retinal examination and imaging findings.
Exclusion criteria included ocular trauma, previous intraocular surgery, glaucoma or ocular hypertension, uveitis, age-related macular degeneration, retinal vascular occlusion, other retinal vascular diseases, active ocular infection, systemic autoimmune or inflammatory disease, malignancy, organ transplantation, and insufficient clinical information for DR grading.
The patients were divided into four groups: (1) non-diabetic control individuals diagnosed with age-related cataract (10 eyes from 10 patients); (2) diabetic patients without DR (10 eyes from 9 patients); (3) diabetic patients with NPDR (10 eyes from 8 patients); and (4) diabetic patients with PDR (10 eyes from 7 patients). The control eyes were obtained from patients undergoing cataract surgery for age-related cataract and with no history of diabetes mellitus or diabetic retinopathy. Diabetic patients with age-related cataract or requiring intravitreal injection were included according to their DR status. Diabetes without DR was defined as diabetes mellitus without visible retinal microaneurysms, hemorrhages, hard exudates, cotton-wool spots, or neovascularization. NPDR was defined by the presence of retinal microaneurysms and/or intraretinal hemorrhages, hard exudates, cotton-wool spots, venous beading, or intraretinal microvascular abnormalities without retinal or optic disc neovascularization. PDR was defined by the presence of retinal or optic disc neovascularization and/or vitreous or preretinal hemorrhage. The study was conducted in accordance with the Declaration of Helsinki. The protocol was approved by the Ethics Committee of Guangdong Provincial People's Hospital (No. KY2025-208-01, March 21, 2025) and waived the requirement for informed consent due to the retrospective nature of the study and the use of anonymized data. Given the exploratory and hypothesis-generating nature of this study, a formal a priori power calculation was not performed. The sample size of 10 eyes per group was determined based on practical and clinical feasibility constraints, including the availability of AH samples from consecutively selected patients within the sample collection period, and is consistent with the scale of prior exploratory AH metabolomics studies conducted in those with DR. The adequacy of this sample size for detecting metabolic group differences was supported post hoc by the observed effect sizes and nominal statistical significance of key comparisons; however, the authors acknowledge that the study may be underpowered to detect minor effects, and the findings should be considered preliminary pending replication in larger cohorts.
All patients underwent a complete ophthalmological examination, including assessment of best-corrected visual acuity (BCVA), non-contact tonometry for intraocular pressure (IOP, mmHg), anterior segment biomicroscopy, and dilated fundus examination. Demographic data (age and sex) were collected, and fasting blood glucose (mmol/L) and glycated hemoglobin (%) were recorded in all 40 patients. Durations of diabetes (years) and anti-diabetes treatment were recorded for the diabetic patients.
Sample acquisition
-
All surgeries and intravitreal injection procedures were performed by a single experienced surgeon under topical anesthesia. For control eyes, AH samples were collected at the beginning of age-related cataract surgery, before any intraocular manipulation. Before collection of the samples, topical anesthesia was administered using Alcaine® eye drops (0.5% proparacaine hydrochloride ophthalmic solution). A total volume of 0.1–0.2 mL of AH was harvested with a 30 G tuberculin syringe via the first paracentesis, which allowed access into the anterior chamber. Samples were immediately transferred into Eppendorf tubes and stored at −80 °C until analysis.
Targeted metabolomic analysis of methionine cycle
Metabolomic analysis of AH
-
AH samples were processed using a standardized protocol. Briefly, 150 μL of AH was transferred to each well of a 96-well plate, followed by the addition of 50 μL of internal standard solution. After incubation at room temperature for 30 min, 600 μL of methanol was added, and the mixture was vortexed and centrifuged for 15 min. A 500 μL aliquot of the supernatant was collected, dried under nitrogen, and reconstituted with 75 μL of solution prior to liquid chromatography-mass spectrometry (LC-MS) analysis.
In total, nine methionine-cycle-related metabolites were detected in the targeted metabolomics panel: 4-pyridoxic acid, 5-methyltetrahydrofolate, betaine, choline, dimethylglycine, Hcy, S-adenosylhomocysteine (SAH), S-adenosylmethionine (SAM), and vitamin B2 (VB2). The SAM/SAH ratio was calculated as an index of methylation potential.
Metabolomic profiling was performed using a Waters UPLC I-Class Plus system (Waters, USA) coupled to a QTRAP6500Plus mass spectrometer. Chromatographic separation was achieved on an HSS T3 column (100 mm × 2.1 mm, 1.8 μm) at 45 °C, with mobile phases consisting of water (0.1% formic acid) and methanol (0.1% formic acid). The injection volume was 10 μL. Data acquisition and peak extraction were carried out using MultiQuant software (SCIEX, v.3.0.2).
Bioinformatics analyses
-
Bioinformatics analyses were performed using MetaX and included data preprocessing, quality control, global profiling, differential metabolite screening, and correlation analysis. Missing values were imputed with minimum positive values (0.000001–0.000005, randomly assigned). Because the metabolites were quantified in absolute concentration units using an internal-standard-based LC-MS/MS workflow, no additional normalization was applied. No batch correction was performed. Principal component analysis (PCA) was used to assess the sample distribution and identify potential outliers after log transformation and Pareto scaling. Identified metabolites were annotated using the human metabolome database (HMDB,
https://hmdb.ca ) and KEGG databases (www.genome.jp/kegg/ ). Partial least squares discriminant analysis (PLS-DA) and orthogonal PLS-DA (OPLS-DA) were used to evaluate group separation and identify metabolites contributing to discrimination. Differential metabolites were screened using fold change criteria (≥ 1.2 or ≤ 0.83) and p < 0.05.In vitro experiments
Cell culture
-
Human retinal microvascular endothelial cells (HRMECs) were obtained from Yansheng Industrial (Shanghai, China) and cultured in Dulbecco's Modified Eagle Medium (DMEM) supplemented with 10% fetal bovine serum (FBS, v/v) and 1% penicillin/streptomycin (v/v) at 37 °C in a humidified atmosphere containing 5% CO2. Previous evidence has shown that plasma Hcy levels are elevated in patients with DR[15], and that Hcy may further exacerbate diabetes-related metabolic disturbances under high-glucose (HG) conditions. In vitro studies have commonly used Hcy concentrations of 100–200 μM without apparent cytotoxicity[16,17]. Therefore, the cells were assigned to four experimental groups: control (5.5 mmol/L glucose), HG (25 mmol/L glucose), HG + Hcy (25 mmol/L glucose + 200 μM Hcy), and HG + betaine (25 mmol/L glucose + 1,000 μM betaine).
CCK-8 assay
-
HRMEC viability after each treatment was quantified using the Cell Counting Kit-8 (CCK-8) colorimetric assay following the manufacturer's instructions. Briefly, HRMECs were seeded into 96-well plates at a density of 3 × 10³ cells per well and allowed to adhere overnight. Experimental and blank control wells (containing only the culture medium, with no cells) were set up. At least five replicate wells were set up for each group. Cells were then treated according to the four experimental conditions for 72 h. Thereafter, 10 µL of CCK-8 solution was added to each well and the plates were incubated at 37 °C for 1–2 h. Absorbance was measured at 450 nm using a microplate reader. The CCK-8 assay was performed with five independent biological replicates.
Wound migration assay
-
The migratory response of HRMECs was examined using an in vitro scratch assay. Following 72 h of treatment under the designated experimental conditions, HRMECs were seeded into 6-well plates at a density of 1.5 × 10⁶ cells per well and cultured until full confluence. A uniform wound was introduced into the monolayer using a sterile 20 μL pipette tip. After washing with phosphate-buffered saline (PBS) to remove detached cells, serum-free medium was added to eliminate proliferation. Cell migration into the wound area was monitored under a phase-contrast microscope (×10 magnification), and the migration area was quantified using ImageJ software. The wound migration assay was performed with three independent biological replicates.
Tube formation assay
-
Matrigel (Corning, NY, USA) was uniformly coated onto 24-well culture plates and allowed to polymerize for 30 min at 37 °C. Subsequently, HRMECs were seeded at a density of 1.5 × 10⁵ cells per well onto the polymerized Matrigel surface. Cells were treated with 200 μM Hcy or 1,000 μM betaine for 24 h. Following incubation, morphological changes and tube-like structures were observed and imaged using an inverted microscope at a magnification of ×10. Angiogenic network formation was quantified from randomly selected microscopic fields by calculating the proportion of cells incorporated into connected tube-like structures. Each experimental condition was evaluated in three independent replicates. The tube formation assay was performed with four independent biological replicates.
Widefield swept-source OCTA imaging and analysis
-
WF SS-OCTA was performed using a commercial device with Angio 26 mm × 21 mm and Macular Angio 6 mm × 6 mm scan patterns (VG200, Intalight Imaging, Zhengzhou, China). The following parameters were quantified automatically or semi-automatically using built-in software and ImageJ (National Institutes of Health, USA): vascular density, including vessel density of the superficial vascular complex (SVC) and deep vascular complex (DVC); foveal avascular zone (FAZ) parameters, including area, perimeter, circularity index (CI), and fractal dimension (FD); and retinal layer thickness, including thickness of the ganglion cell-inner plexiform layer (GC-IPL) and macular retinal nerve fiber layer (mRNFL). For eyes with DR, the areas of RNV and non-perfusion areas (NPAs) were manually delineated.
Statistical analyses
-
Statistical analyses were performed using SPSS 26.0 (IBM Corp., Armonk, NY, USA) and R software. The normality of data distribution was assessed using the Shapiro–Wilk test. For normally distributed data, group comparisons were performed using one-way ANOVA followed by post hoc tests; otherwise, the Kruskal–Wallis test was used. Correlations between metabolite levels and imaging parameters were analysed using Pearson's or Spearman's correlation coefficients, as appropriate. Given the limited number of eyes with available WF SS-OCTA data, these imaging–metabolite correlation analyses were considered exploratory and hypothesis-generating. A two-tailed p value < 0.05 was considered nominally significant. Given the targeted nature of the metabolomics panel (nine pre-specified metabolites) and the exploratory design of the imaging–metabolite correlation analyses, no formal correction for multiple comparisons (e.g., Benjamini–Hochberg false discovery rate) was applied. All reported p values are therefore nominal and should be interpreted as hypothesis-generating rather than confirmatory. The detailed methodology for vitreous humor metabolomic profiling is provided in the Supplementary Methodology.
-
For this study, we enrolled 40 eyes from 34 participants, divided into four groups according to disease severity: 10 eyes from 10 non-diabetic controls, 10 eyes from 9 diabetic patients without DR, 10 eyes from 8 patients with NPDR, and 10 eyes from 7 patients with PDR. The baseline demographic and clinical characteristics of the four groups are shown in Table 1. No significant differences were observed among the four groups in sex distribution (p = 0.815), fasting blood glucose (FBG) (p = 0.851), or hypertension prevalence (p = 0.423). HbA1c did not differ significantly among the three diabetic groups despite a numerically higher mean value in the NPDR group, likely due to the small sample size and wide inter-individual variability within this subgroup. Notably, the PDR group was younger but had a longer duration of diabetes than the other diabetic groups, highlighting age and disease duration as potential confounding factors when interpreting the observed metabolic differences.
Table 1. Demographic and clinical characteristics of the study participants.
Variable Control DM without DR NPDR PDR p-Value Participants, n (female) 10 (5) 9 (3) 8 (3) 7 (2) 0.815 Age, years 72.3 ± 11.46 70.78 ± 6.85 51.63 ± 14.06 49.86 ± 8.59 < 0.001 Eyes 10 10 10 10 − Type 2 diabetes, n − 9 8 7 − Duration of DM, years − 7.57 ± 6.15 9.63 ± 5.76 16.71 ± 10.59 < 0.001 FBG, mmol/L 7.69 ± 1.90 9.06 ± 2.96 9.50 ± 3.78 8.21 ± 2.95 0.851 HbA1c, % − 7.42 ± 1.64 11.43 ± 8.78 7.4 ± 1.02 0.315 Participants with hypertension, n 6 3 5 2 0.423 Targeted metabolomic analysis
-
Targeted metabolomic analysis of AH revealed a distinct methionine cycle profile in PDR eyes. Compared with the control, DM without DR, and NPDR groups, PDR eyes showed consistently higher Hcy levels, whereas betaine was reduced, most notably relative to NPDR eyes (Fig. 1a). This reciprocal pattern of Hcy elevation and betaine depletion suggests impaired remethylation capacity and progressive perturbation of the methionine cycle during neovascular progression. The Z-score heatmap further illustrated the distinctive metabolic signature of PDR, characterized by relatively increased Hcy and decreased betaine levels compared with the other groups (Fig. 1b). In parallel, non-targeted metabolomic analysis of vitreous humor in an independent cohort confirmed broader metabolic disturbances, with pathway analysis highlighting significant enrichment of methionine and cysteine metabolism (Supplementary Results, Supplementary Fig. S1)[11]. Together, these findings support methionine-cycle dysregulation as a prominent metabolic feature of advanced DR. Given the marked alteration in betaine levels in PDR, we next examined its functional effects on endothelial behavior under HG conditions.
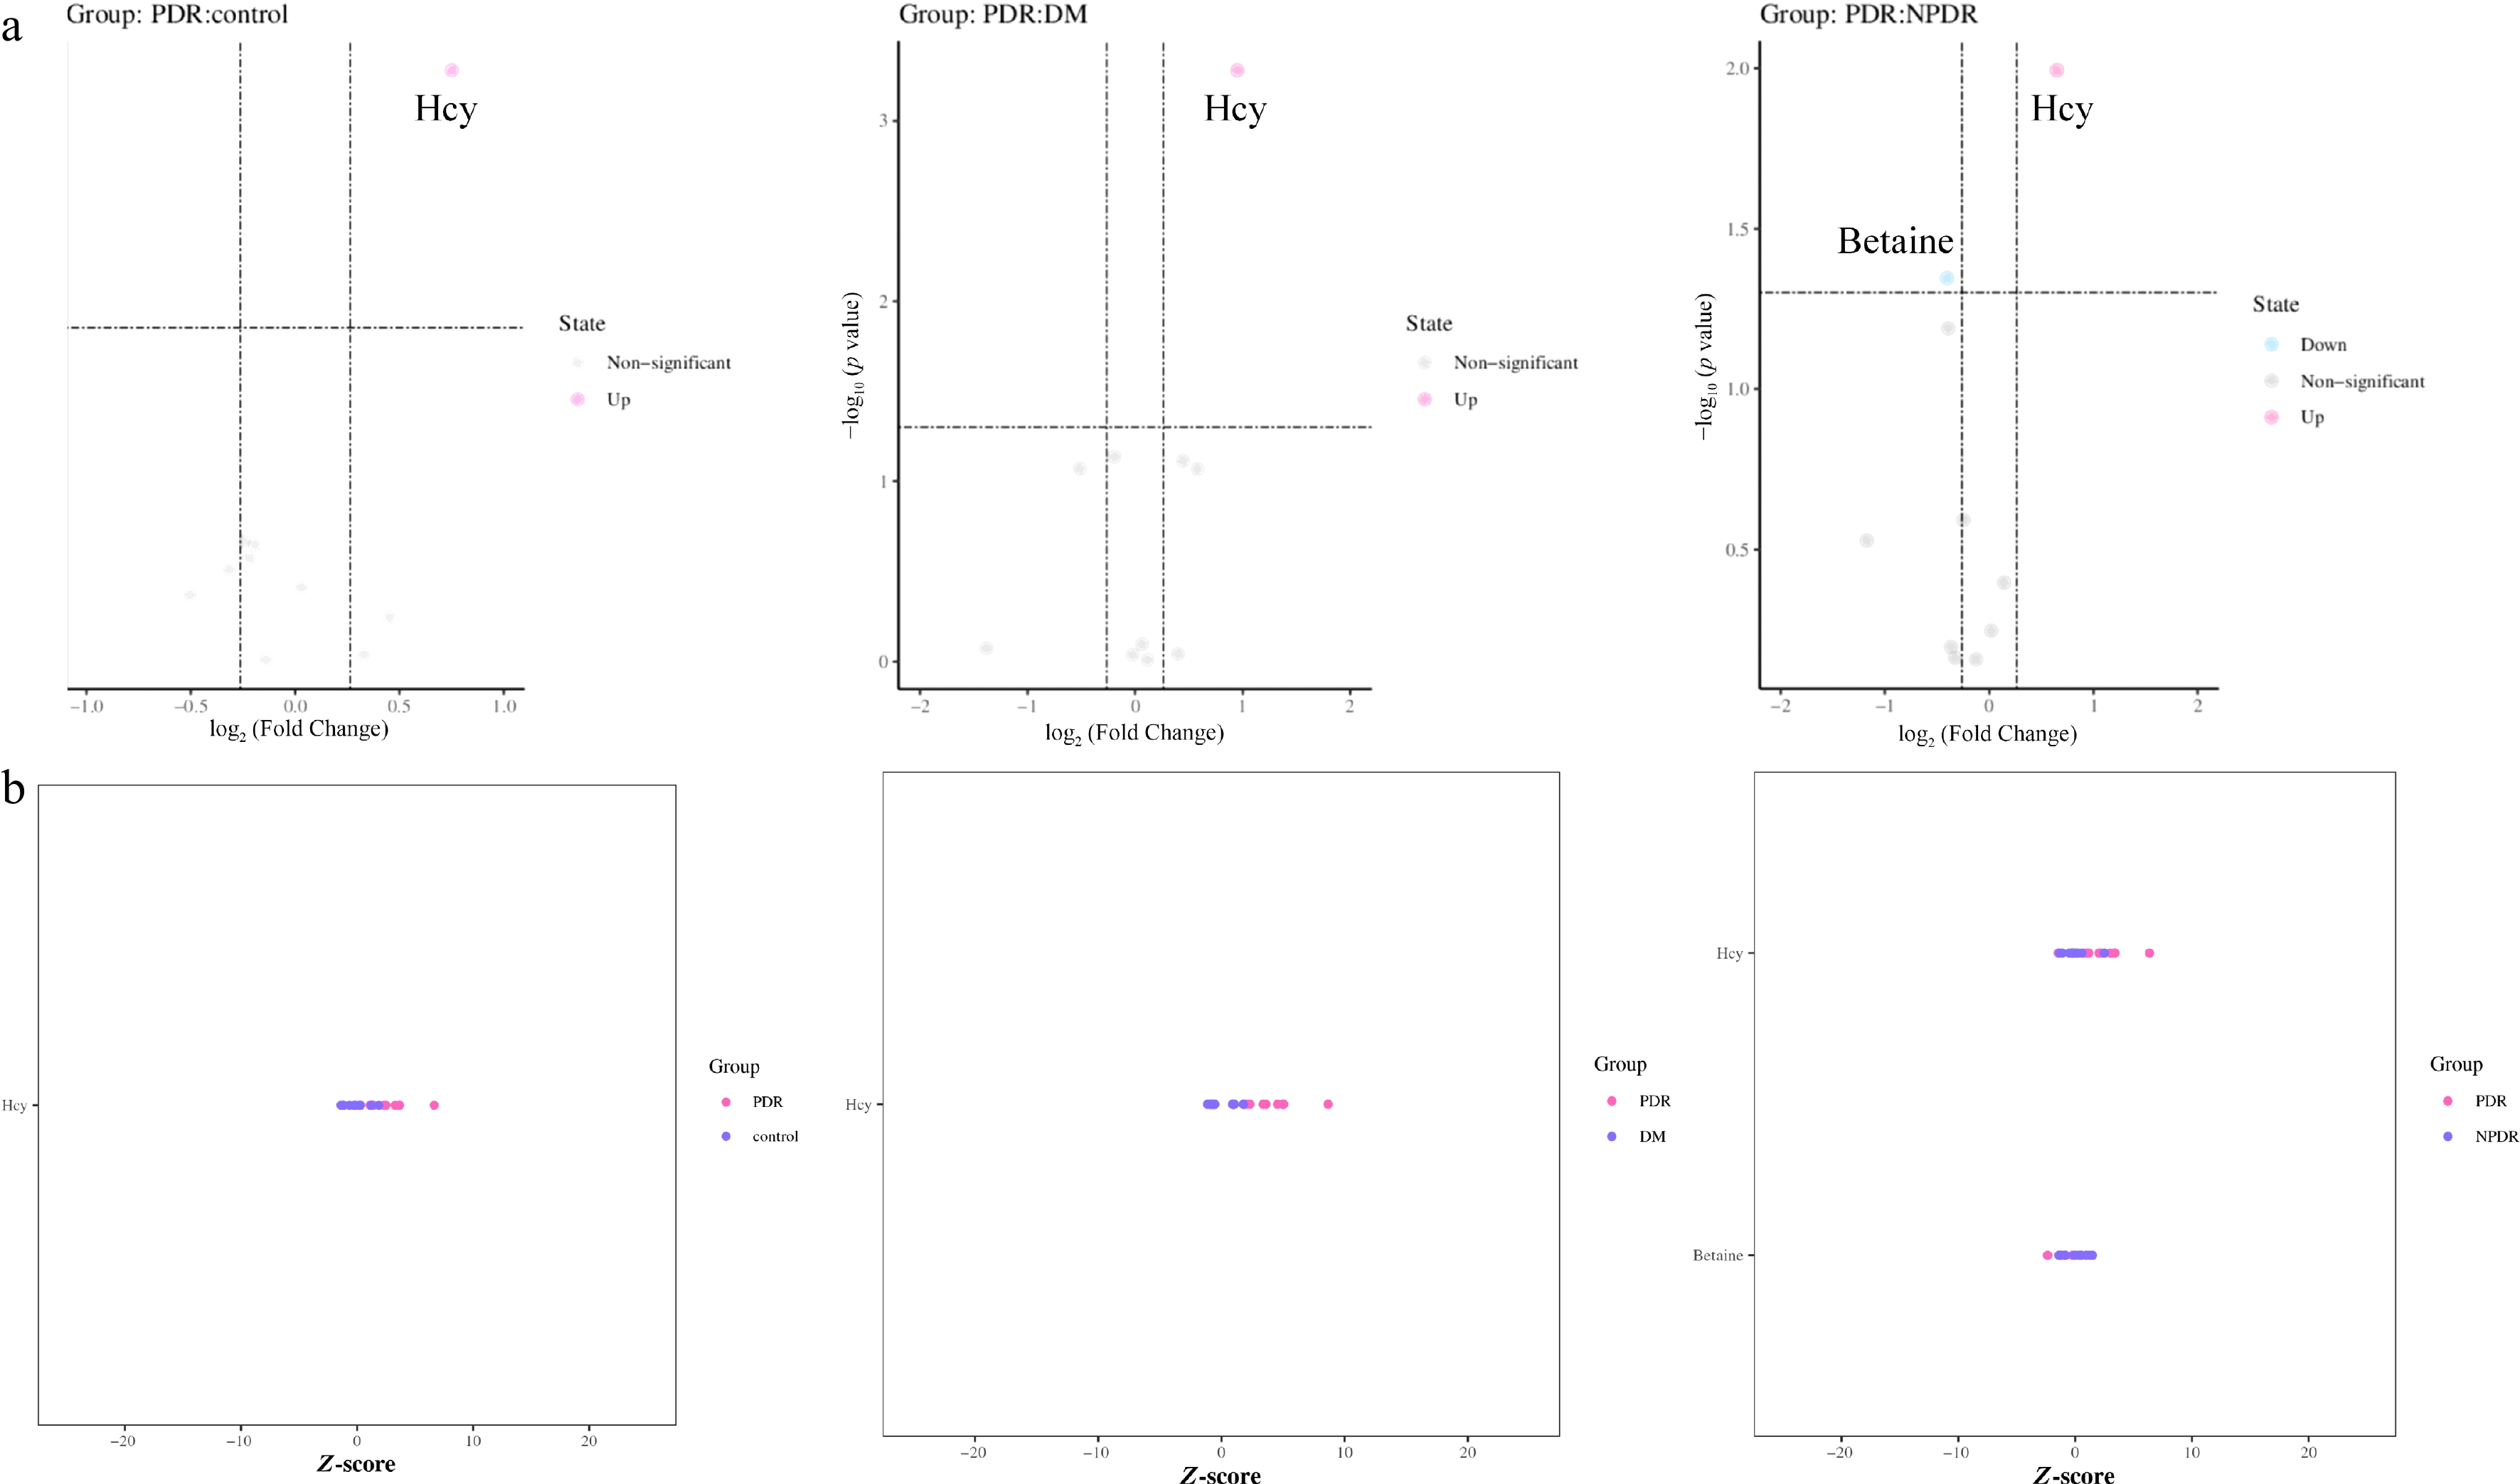
Figure 1.
Differential methionine-cycle metabolites in PDR. (a) Volcano plot showing significantly altered metabolites based on fold change > 1.2 or < 0.83 and p < 0.05. Homocysteine and betaine are labeled. (b) Z-score heatmap showing the metabolic profile across groups.
In vitro results
-
To determine whether the betaine depletion observed in the case of AH with PDR has functional consequences for endothelial behavior, we assessed the effects of betaine on HG-stimulated HRMECs across three complementary assays. As determined by the CCK-8 assay, Hcy treatment significantly enhanced HRMEC proliferation compared with the control group; this pro-proliferative effect was markedly suppressed by co-treatment with 1,000 μM betaine (p < 0.01), indicating that betaine can attenuate abnormal endothelial growth under diabetic-like metabolic conditions (Fig. 2a).
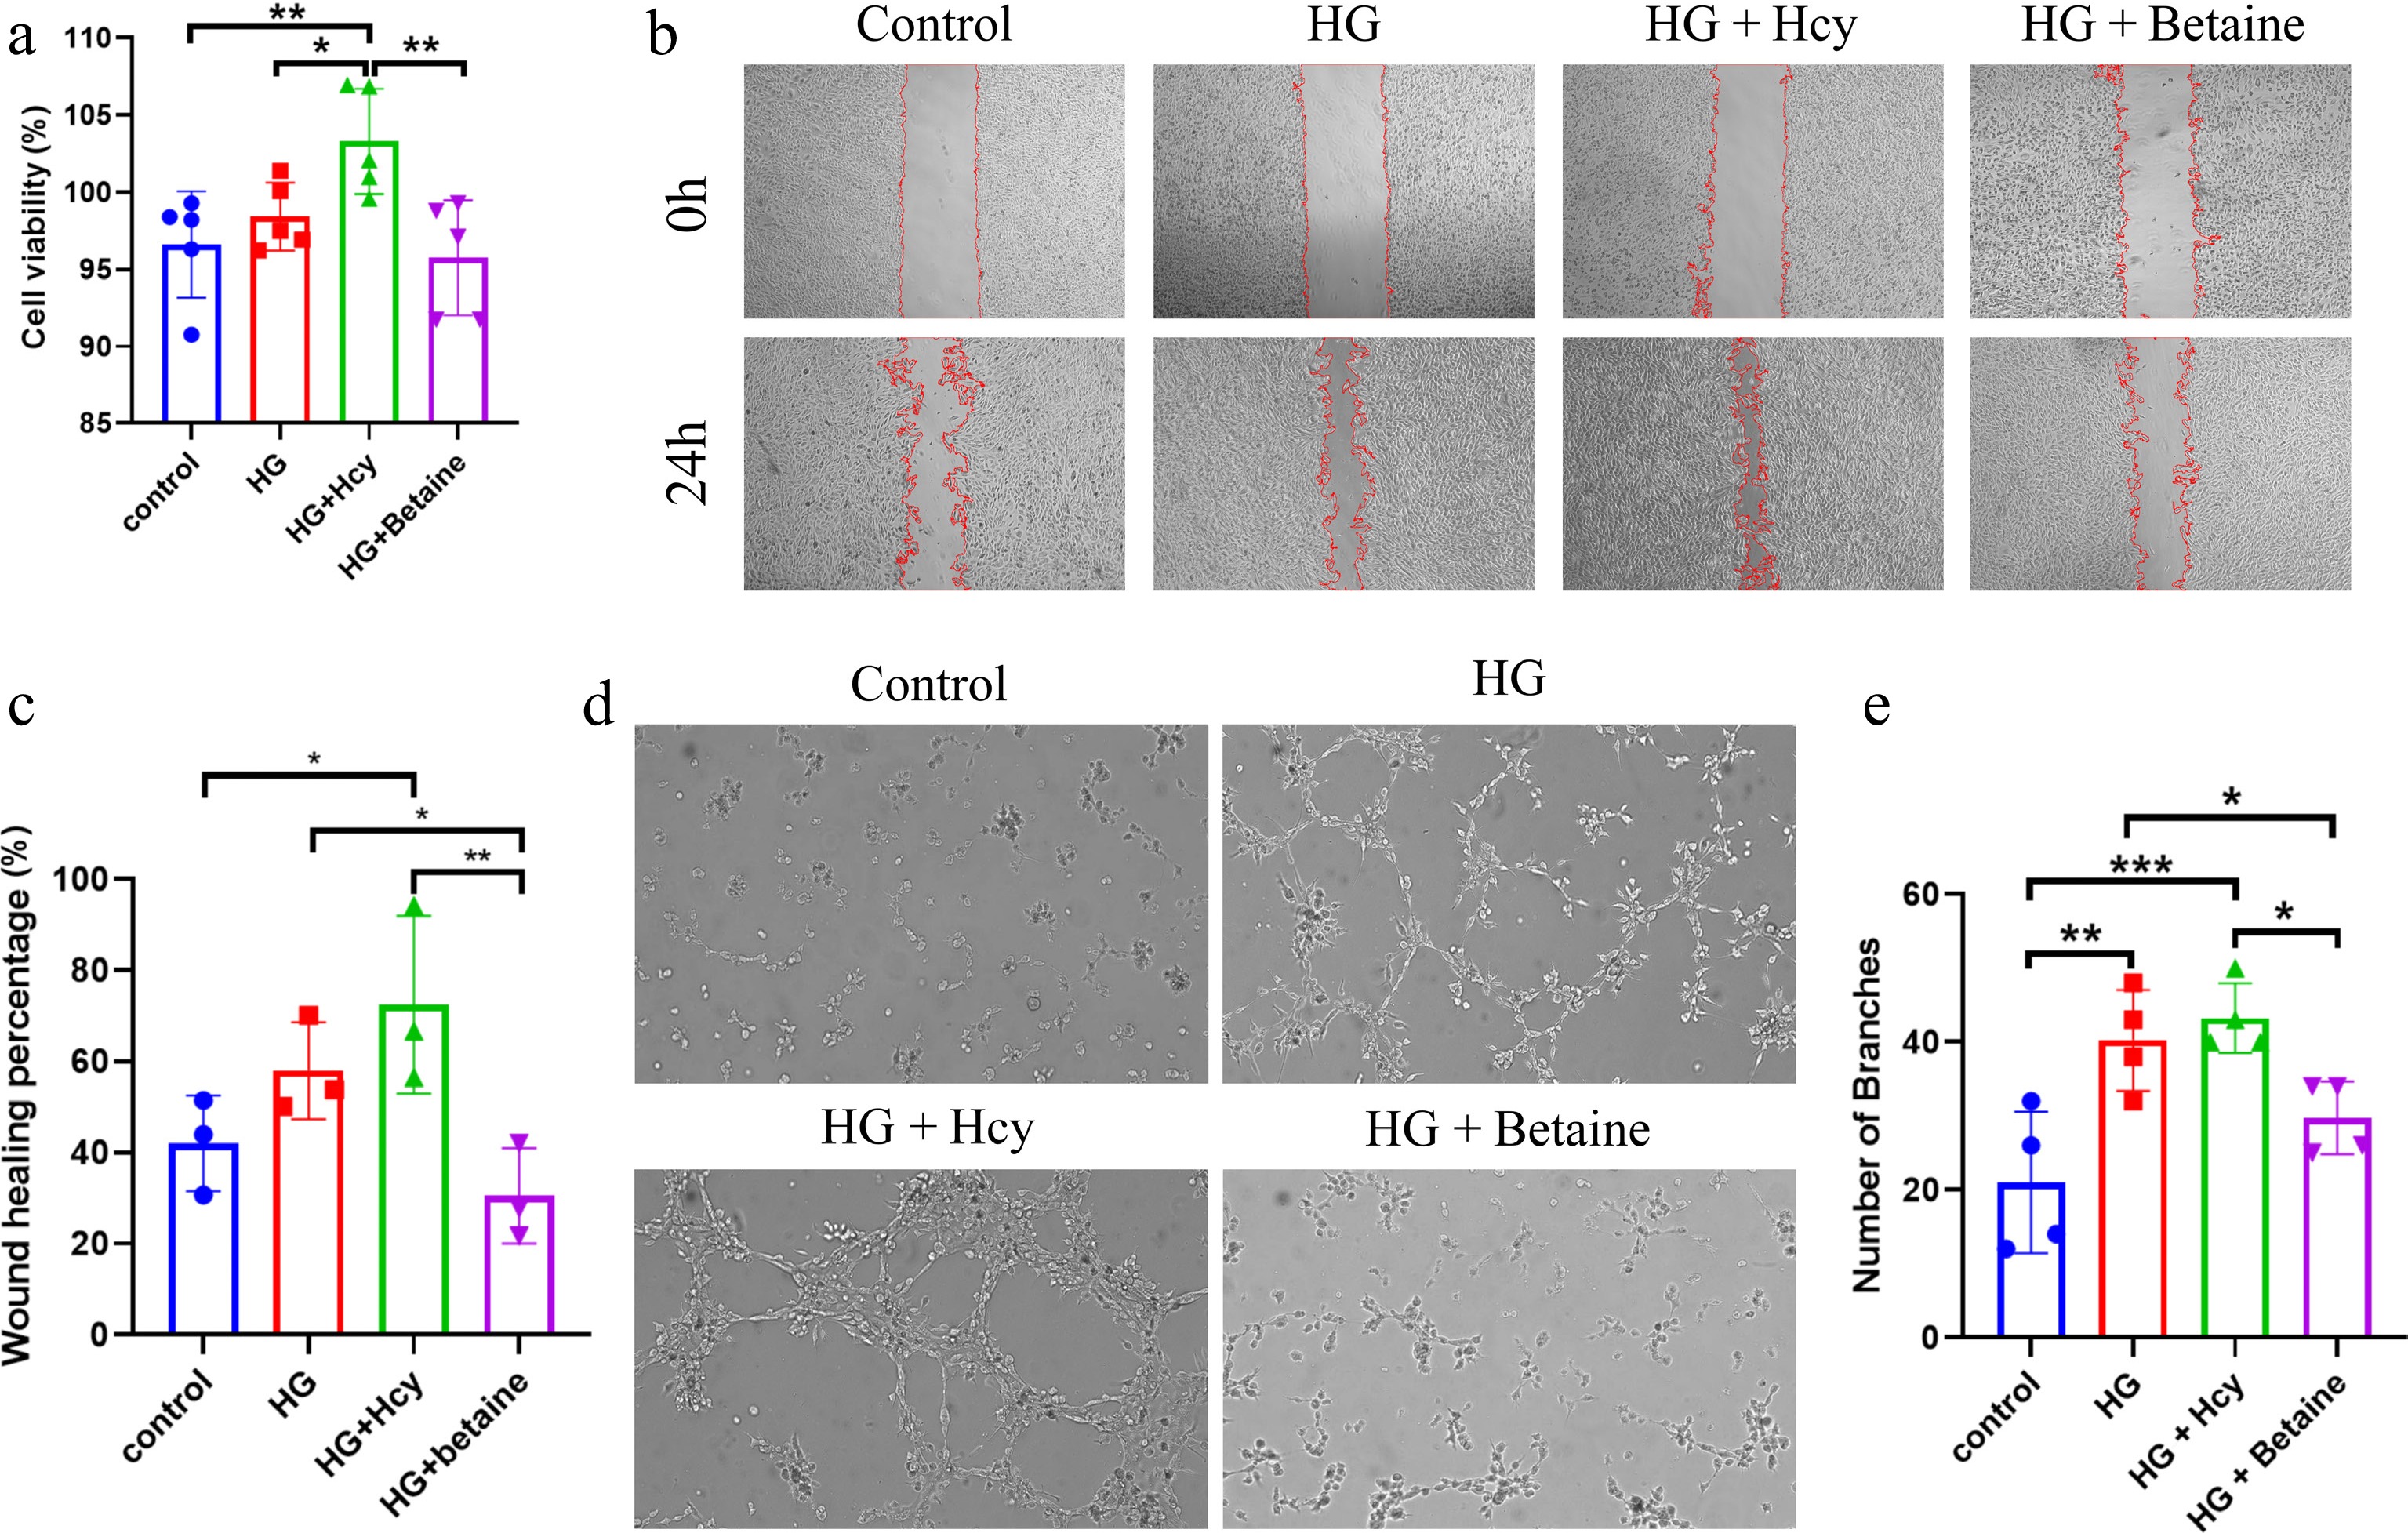
Figure 2.
Effects of betaine on high-glucose-induced angiogenic responses in HRMECs. (a) CCK-8 assay. (b, c) Scratch migration assay. (d, e) Tube formation assay. * p < 0.05, ** p < 0.01.
Consistent with this anti-proliferative effect, cell migration assessed by the scratch wound assay was also significantly increased by HG and Hcy exposure compared with controls (p < 0.05), whereas betaine supplementation effectively inhibited this migratory response (p < 0.01) (Fig. 2b, c).
Furthermore, when the angiogenic potential of HRMECs was assessed using a Matrigel-based tube formation assay, HG stimulation was found to significantly promote the formation of capillary-like structures (p < 0.01), whereas betaine treatment attenuated this pro-angiogenic effect (p < 0.05) (Fig. 2d, e). Taken together, these in vitro findings demonstrate that betaine consistently suppresses HG-induced endothelial proliferation, migration, and tube formation, providing functional evidence that the betaine depletion identified in AH with PDR may contribute to endothelial angiogenic activation in the diseased retina.
To determine whether these metabolic alterations were reflected in vivo, we further explored their relationships with retinal microvascular parameters using WF SS-OCTA.
Correlation between metabolites and imaging parameters
-
Targeted metabolomic analysis was performed on 40 eyes from 34 patients. Among them, WF SS-OCTA data were available for 12 eyes from 9 patients, distributed as follows: healthy controls (3 eyes from 3 patients), NPDR group (2 eyes from 2 patients), and PDR group (7 eyes from 4 patients). Correlation analysis demonstrated significant associations between imaging parameters, including DVC, CI, and FD, and specific metabolites, particularly betaine and choline. Representative correlations most relevant to methionine-cycle dysregulation and retinal microvascular alterations are summarized in Table 2, and the complete correlation results are provided in the Supplementary Results (Supplementary Table S1). Given the exploratory nature of the imaging–metabolite correlation analysis, these associations provide descriptive insights and require validation in larger cohorts.
Table 2. Key correlations between methionine-cycle metabolites and WF SS-OCTA parameters.
Metabolite Imaging parameter r p-Value Betaine DVC (0–21 mm) 0.734 0.007** DVC (6–12 mm) 0.804 0.002** DVC (15–21 mm) 0.636 0.026* RNFL (3–6 mm) −0.692 0.013* CI 0.804 0.002** FD 0.657 0.020* Hcy SVC-I −0.623 0.030* SAM/SAH DVC (0–3 mm) 0.601 0.039* DVC (1–3 mm) 0.634 0.027* DVC-N 0.678 0.015* SVC-S 0.585 0.046* SVC (12–15 mm) 0.602 0.038* VB2 RNV −0.893 0.007** SVC: superficial vascular complex; RNFL: retinal nerve fiber layer; DVC: deep vascular complex; CI: circularity index; FD: fractal dimension; RNV: retinal neovascularization; S: superior; I: inferior; N: nasal. * p < 0.05, ** p < 0.01. -
This study extends previous untargeted metabolomic observations by integrating targeted methionine-cycle profiling, in vitro endothelial assays, and exploratory imaging–metabolite correlation analysis in PDR. Complementary vitreous metabolomic data further supported the relevance of metabolic alterations in PDR (Supplementary Results, Supplementary Figs. S2 and S3)[11]. Using targeted AH metabolomic analysis, we identified a distinct methionine-cycle profile in PDR eyes, characterized by higher Hcy and lower betaine levels. In vitro experiments further suggested that betaine may modulate endothelial angiogenic responses under diabetic-like stress, while WF SS-OCTA correlations linked methionine-cycle metabolites with retinal microvascular parameters. Together, these findings provide multidimensional evidence linking methionine cycle imbalance to PDR-related microvascular abnormalities, without establishing direct causality.
Our targeted findings align with previous reports of amino-acid and one-carbon metabolic disturbances in PDR[7,8], while localizing these changes primarily to the methionine cycle. Elevated Hcy has been associated with endothelial dysfunction, oxidative stress, inflammation, and angiogenic signalling[18−20]. The concurrent reduction in betaine—a methyl donor for Hcy remethylation—may indicate impaired remethylation capacity and a metabolic milieu permissive to Hcy-related endothelial stress. As the methionine cycle intersects with the folate/B12-dependent remethylation and transsulfuration pathway, SAM, SAH, VB2, choline, and related metabolites should be interpreted as components of a broader one-carbon network rather than isolated markers[21,22].
The in vitro results support the biological plausibility of a link between methionine-cycle imbalance and endothelial angiogenic behavior. Betaine's anti-angiogenic effect may relate to its role in Hcy remethylation, as well as its broader cytoprotective properties—including anti-inflammatory activity, oxidative-stress regulation, and osmoprotection[22,23]. Previous studies have shown that betaine suppresses angiogenesis by inhibiting Nuclear factor kappa B (NF-κB)/Akt signaling and attenuating reactive oxygen species (ROS)-mediated VEGF/VEGF receptor 2 (VEGFR2) activation in retinal neovascularization models[24,25]. Therefore, our findings should be interpreted as evidence that betaine modulates angiogenic behavior under HG conditions, but they do not establish that this effect is mediated exclusively through the methionine cycle. Future studies incorporating pathway-specific inhibition and measurements of the SAM/SAH ratio, methylation status, oxidative stress markers, osmotic stress responses, and VEGF-related signaling are needed to define the relative contributions of these mechanisms in PDR.
The integration of WF SS-OCTA further links these molecular and cellular findings to clinically relevant retinal microvascular changes. WF SS-OCTA enables noninvasive, high-resolution assessment of widefield retinal microvasculature and neovascularization without dye injection[26,27]. Betaine levels were positively correlated with DVC density and FD, whereas Hcy showed negative associations with superficial vascular parameters, suggesting that Hcy–betaine imbalance may be associated with microvascular compromise in vulnerable retinal capillary compartments[28,29]. The negative correlation between VB2 and RNV further raises the possibility that B-vitamin metabolism is linked to neovascular burden. Metabolites such as pyruvate also showed promising discriminatory performance in ROC analyses, presented in the Supplementary Results (Supplementary Fig. S4), supporting the potential value of metabolomic profiling for future biomarker research[11]. However, because these correlations were derived from a small imaging subset, they should be interpreted as exploratory associations requiring validation in larger cohorts.
These findings have potential translational relevance. AH metabolites may complement conventional structural assessments—such as fundus examination, fluorescein angiography, and OCTA-derived vascular metrics—by capturing metabolic stress within the ocular microenvironment. Consistent with prior reports of elevated Hcy across plasma, aqueous, and vitreous humor in PDR[18], and meta-analytic evidence linking Hcy to DR risk and severity[19,30], combining targeted metabolomics with WF SS-OCTA may offer a complementary value for future risk stratification, pending validation in larger longitudinal cohorts. Notably, PDR patients were younger but had longer diabetes duration, and because young-onset type 2 diabetes and prolonged exposure are associated with greater retinopathy susceptibility[31,32], the observed Hcy–betaine imbalance may partly reflect this phenotype; future analyses should adjust for age at onset and diabetes duration.
Therapeutically, methionine-cycle dysregulation may represent an upstream or parallel metabolic pathway contributing to endothelial activation, oxidative stress, and pathological angiogenesis. Given the limitations of current treatments—including variable anti-VEGF responses and the need for repeated injections[5,6,33]—targeting the Hcy–betaine axis warrants consideration as a potential adjunctive metabolic strategy, not a replacement for established therapy. This approach should encompass the broader one-carbon network, including folate, VB2, VB6, VB12, and choline, as B-vitamin status and metabolic context influence Hcy homeostasis and vascular risk[34,35]. Clinical translation nevertheless remains preliminary: it is unclear whether systemic betaine supplementation can help achieve sufficient intraocular concentrations, whether local delivery is safe and durable, or whether Hcy/betaine modulation improves long-term retinal outcomes, particularly given context-dependent effects in diabetic animal models[23,25]. Future studies should incorporate ocular pharmacokinetic analyses, dose–response experiments, and prospective interventional trials to assess whether Hcy-lowering or betaine-restoring strategies can complement existing PDR therapies.
A key methodological consideration is that AH was used as a surrogate for retinal metabolic alterations. Although vitreous humor may better reflect the posterior segment, AH is safer to collect and has been increasingly used in ocular biomarker studies, with recent evidence showing substantial molecular overlap and correlation between aqueous and vitreous humor in retinal diseases[36]. Nevertheless, as AH composition may be influenced by anterior segment tissues, intraocular diffusion, and ocular barrier permeability, our findings reflect the broader intraocular metabolic milieu rather than retinal metabolism directly; paired aqueous–vitreous analyses are needed to clarify the spatial origin and transport dynamics of methionine-cycle metabolites in PDR.
Beyond the microvascular perspective, growing evidence supports DR as a neurovascular disorder in which neurodegeneration may precede clinically visible vascular lesions, and impaired neurovascular unit communication can disrupt blood–retinal barrier integrity and visual function[37,38]. The OCTA-derived vascular alterations observed here may therefore reflect not only endothelial injury but also disturbed neuron–glia–vascular interactions in the diabetic retina. The methionine cycle is particularly relevant to this framework, as Hcy, SAM, SAH, and betaine are all integral to one-carbon metabolism, methylation homeostasis, and redox balance; methionine-cycle dysregulation may therefore carry broad implications for the metabolically demanding retinal neurovascular unit[39].
The main limitations of this study include its cross-sectional design, which precludes causal inference, and the modest sample size for imaging–metabolite correlation analysis. Thus, the observed metabolite changes and imaging findings should be interpreted as correlations rather than as causal relationships. In addition, the PDR group was younger and had a longer diabetes duration than the other diabetic groups; because age, age at diabetes onset, and diabetes duration may affect systemic metabolism and retinal pathology, residual confounding cannot be excluded. Multiple metabolite–imaging correlations were also tested without formal multiplicity correction, so these findings should be considered exploratory and hypothesis-generating. Larger longitudinal studies are needed to clarify the temporal relationship between methionine-cycle dysregulation and DR development, while diabetic animal models, ocular pharmacokinetic studies, and prospective interventional trials are warranted to determine whether modulation of the Hcy–betaine axis can safely improve retinal microvascular outcomes in PDR.
-
This study demonstrates that methionine-cycle imbalance, reflected by elevated Hcy and reduced betaine levels, is associated with PDR and its microvascular abnormalities. Betaine showed anti-angiogenic effects in vitro, and exploratory analyses indicated nominal correlations between metabolite levels and WF SS-OCTA vascular metrics. These findings suggest a potential metabolic contribution to PDR pathology. However, the imaging–metabolite associations remain preliminary, and their clinical or therapeutic implications require confirmation in larger longitudinal and interventional studies.
This study was supported by the Applied Basic Research Foundation of Guangdong Province (2024A1515010933) and 2024 Healthcare and Sanitation Technology Projects in Baiyun District, Guangzhou (2024-YL-056). The authors would like to thank all the participants involved in the study.
-
The Ethics Committee of Guangdong Provincial People's Hospital approved this study (No. KY2025-208-01, March 21, 2025) and waived the requirement for informed consent due to the retrospective nature of the study and the use of anonymized data. The HRMECs were commercially obtained from Yansheng Industrial (Shanghai, China). Ethical approval was not required as the cells were purchased from a commercial supplier with established ethical sourcing.
-
The authors confirm their contributions to the paper as follows: interpretation, methodology, and manuscript drafting: Li Y, Mo Z; data analysis and methodology: Chi M; investigation and data acquisition: Guo T, Huang X; data acquisition: Liu Y; supervision: Tian Z, Huang Z; data analysis: Xi L; funding acquisition, study design, and guarantor: Cui Y. All authors reviewed the results and approved the final version of the manuscript.
-
The data supporting the findings of this study are available from the corresponding author upon reasonable request.
-
The authors declare that they have no conflict of interest.
-
accompanies this paper online at: https://doi.org/10.48130/vns-0026-0038.
-
# Authors contributed equally: Yuman Li, Zhixin Mo
- Supplementary Table S1 Complete correlation analysis between methionine-cycle metabolites and WF SS-OCTA parameters.
- Supplementary Fig. S1 Heatmaps of significantly enriched KEGG pathways (Differential metabolite count ≥ 5).
- Supplementary Fig. S2 PLS-DA score plots from vitreous metabolomics data in (A) positive and (B) negative ion modes.
- Supplementary Fig. S3 Volcano plots of differential metabolites in (A) positive and (B) negative ion modes.
- Supplementary Fig. S4 ROC curves for key diagnostic metabolites: (A) Pyruvate, (B) Threonine, (C) Serine, (D) D-2-Phosphoglycerate.
- Copyright: © 2026 by the author(s). Published by Maximum Academic Press, Fayetteville, GA. This article is an open access article distributed under Creative Commons Attribution License (CC BY 4.0), visit https://creativecommons.org/licenses/by/4.0/.
-
About this article
Cite this article
Li Y, Mo Z, Huang X, Chi M, Guo T, et al. 2026. Association of methionine-cycle dysregulation and reduced betaine with proliferative diabetic retinopathy and retinal microvascular alterations. Visual Neuroscience 43: e039 doi: 10.48130/vns-0026-0038 

Association of methionine-cycle dysregulation and reduced betaine with proliferative diabetic retinopathy and retinal microvascular alterations
- Received: 10 April 2026
- Revised: 08 July 2026
- Accepted: 10 July 2026
- Published online: 27 August 2026
Abstract: Proliferative diabetic retinopathy (PDR) is the most vision-threatening stage of diabetic retinopathy (DR), a condition increasingly recognized as a neurovascular disorder in which dysregulation of the methionine cycle may impair the retinal neurovascular unit. In this retrospective observational study, targeted metabolomic profiling of the aqueous humor (AH) was performed in 40 eyes from 34 participants categorized into four groups: non-diabetic control individuals; (2) patients without DR; (3) patients with non-proliferative diabetic retinopathy (NPDR); and (4) patients with PDR. Eyes with PDR exhibited markedly elevated homocysteine (fold change 2.31, p < 0.05 vs. controls, with age and diabetes duration acknowledged as potential confounders, given the younger age and longer disease duration in the PDR group) and significantly reduced betaine (fold change 0.61, p < 0.05 vs. NPDR) levels, indicating disruption of the methionine cycle at the neovascular stage. To establish the biological relevance of these findings in AH, in vitro experiments in high-glucose-stimulated human retinal microvascular endothelial cells were performed, which demonstrated that betaine (1,000 μM) significantly suppressed endothelial proliferation, migration, and tube formation (p < 0.01 for proliferation and migration; p < 0.05 for tube formation) compared with high-glucose controls—providing a mechanistic link between the observed aqueous betaine depletion and pathological retinal angiogenesis. In an exploratory subset evaluated with widefield swept-source optical coherence tomography angiography (WF SS-OCTA; 12 eyes from 9 patients), betaine levels were found to be positively correlated with deep vascular complex density (r = 0.734, p = 0.007) and fractal dimension (r = 0.657, p = 0.020), while homocysteine was found to be negatively correlated with superficial vascular parameters (r = −0.623, p = 0.030), suggesting that methionine-cycle imbalance may reflect a broader neurovascular dysfunction. These findings position betaine as a candidate metabolic indicator warranting further investigation in PDR.