-
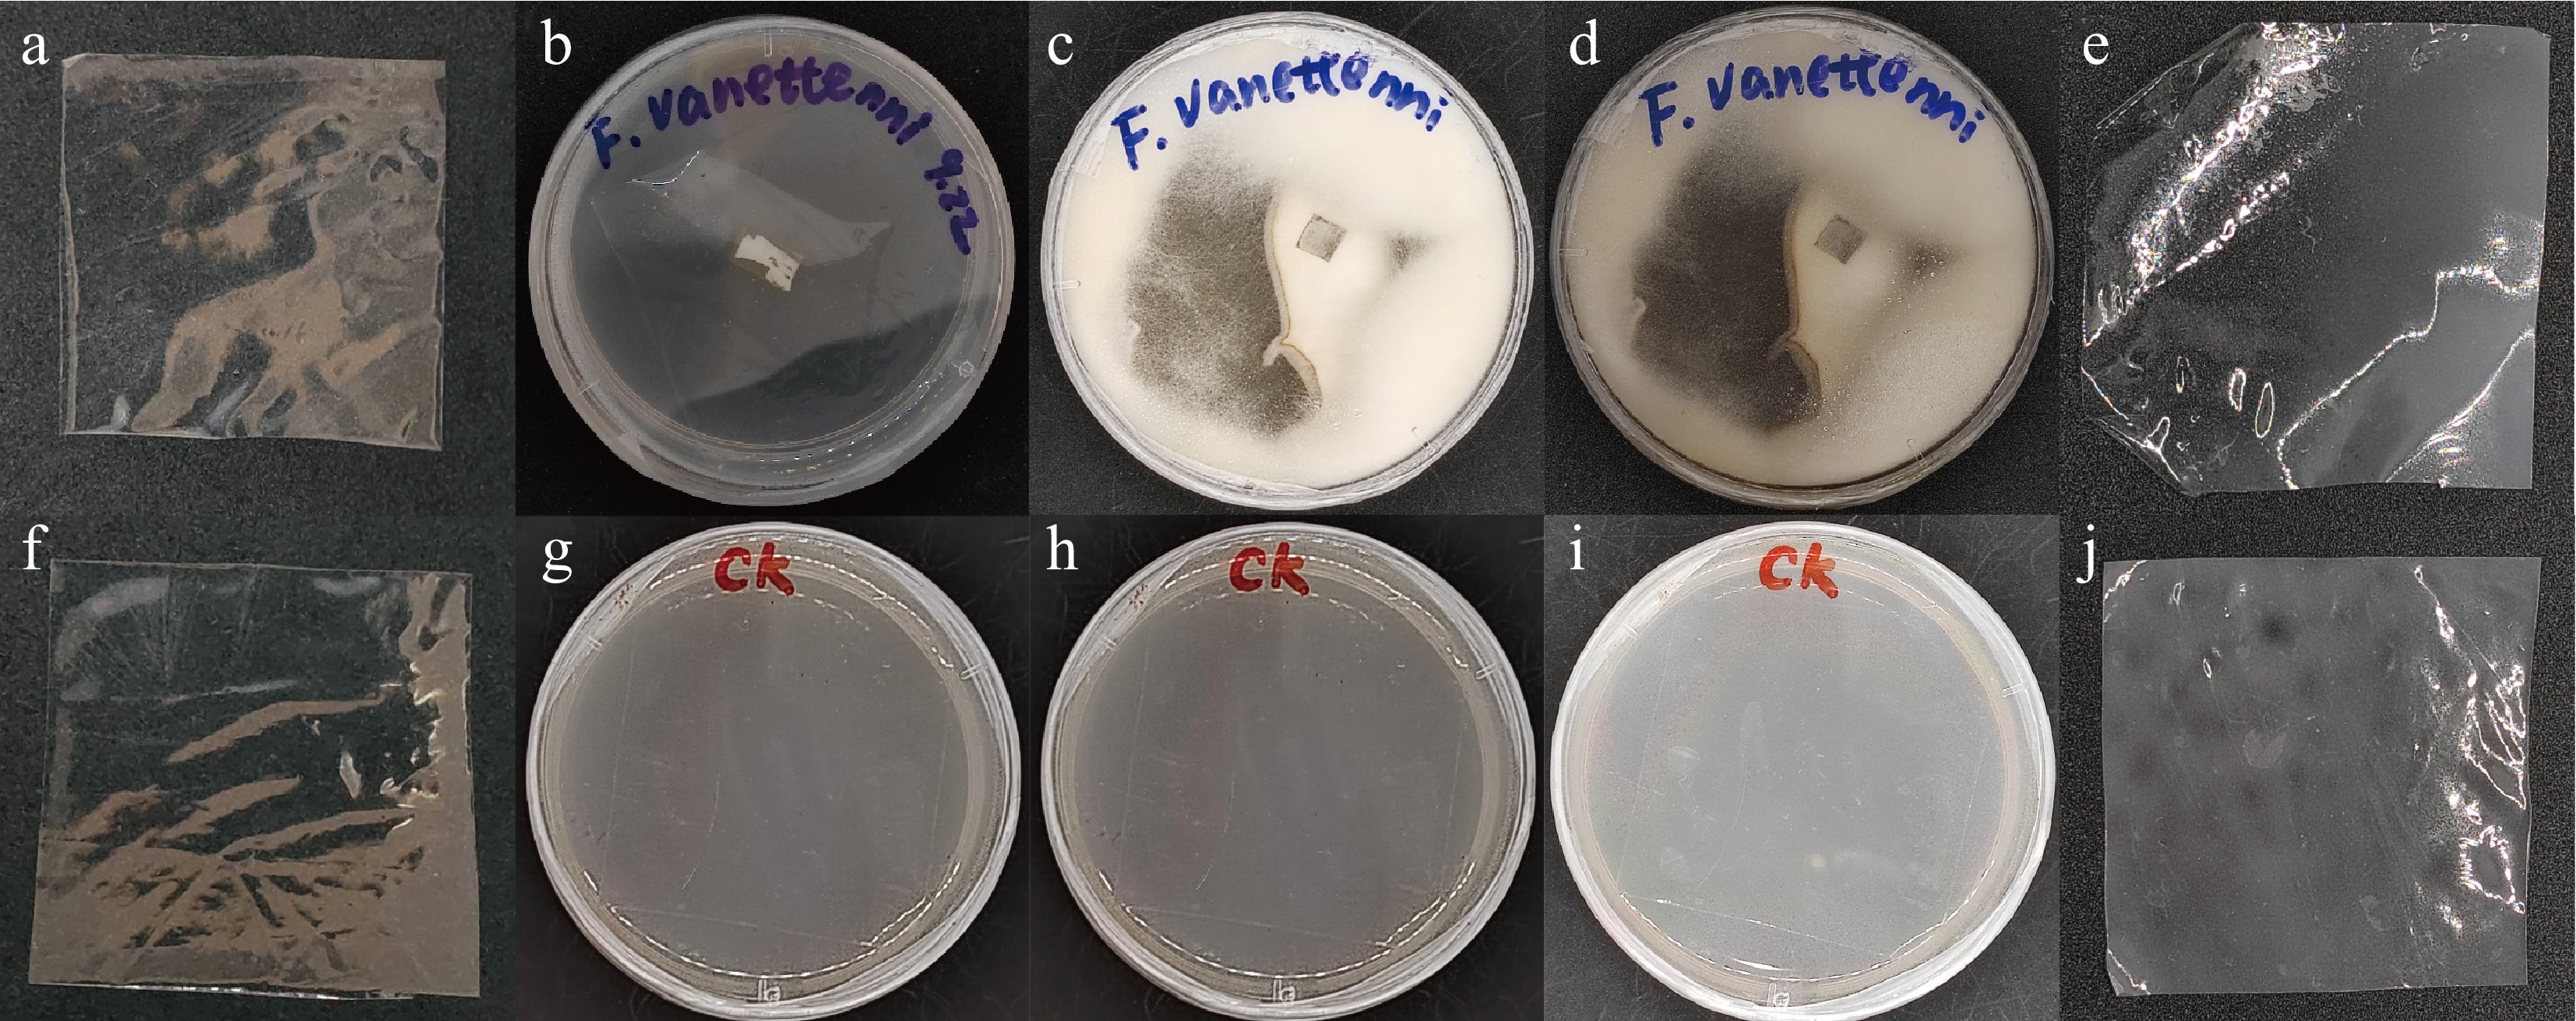
Figure 1.
Morphological changes of PLA films before and after fungal inoculation. (a), (f) Original PLA films. (b) Petri dish immediately after inoculation with F. vanettenii. (c) Petri dish after 1 month of incubation by F. vanettenii. (d) Petri dish after 2 months of incubation with F. vanettenii. (e) PLA film retrieved from (d). (g) Control Petri dish with agar medium only (without fungal inoculation) on day 0. (h) Control dish after 1 month of incubation. (i) Control dish after 2 months of incubation. (j) PLA film retrieved from (i).
-
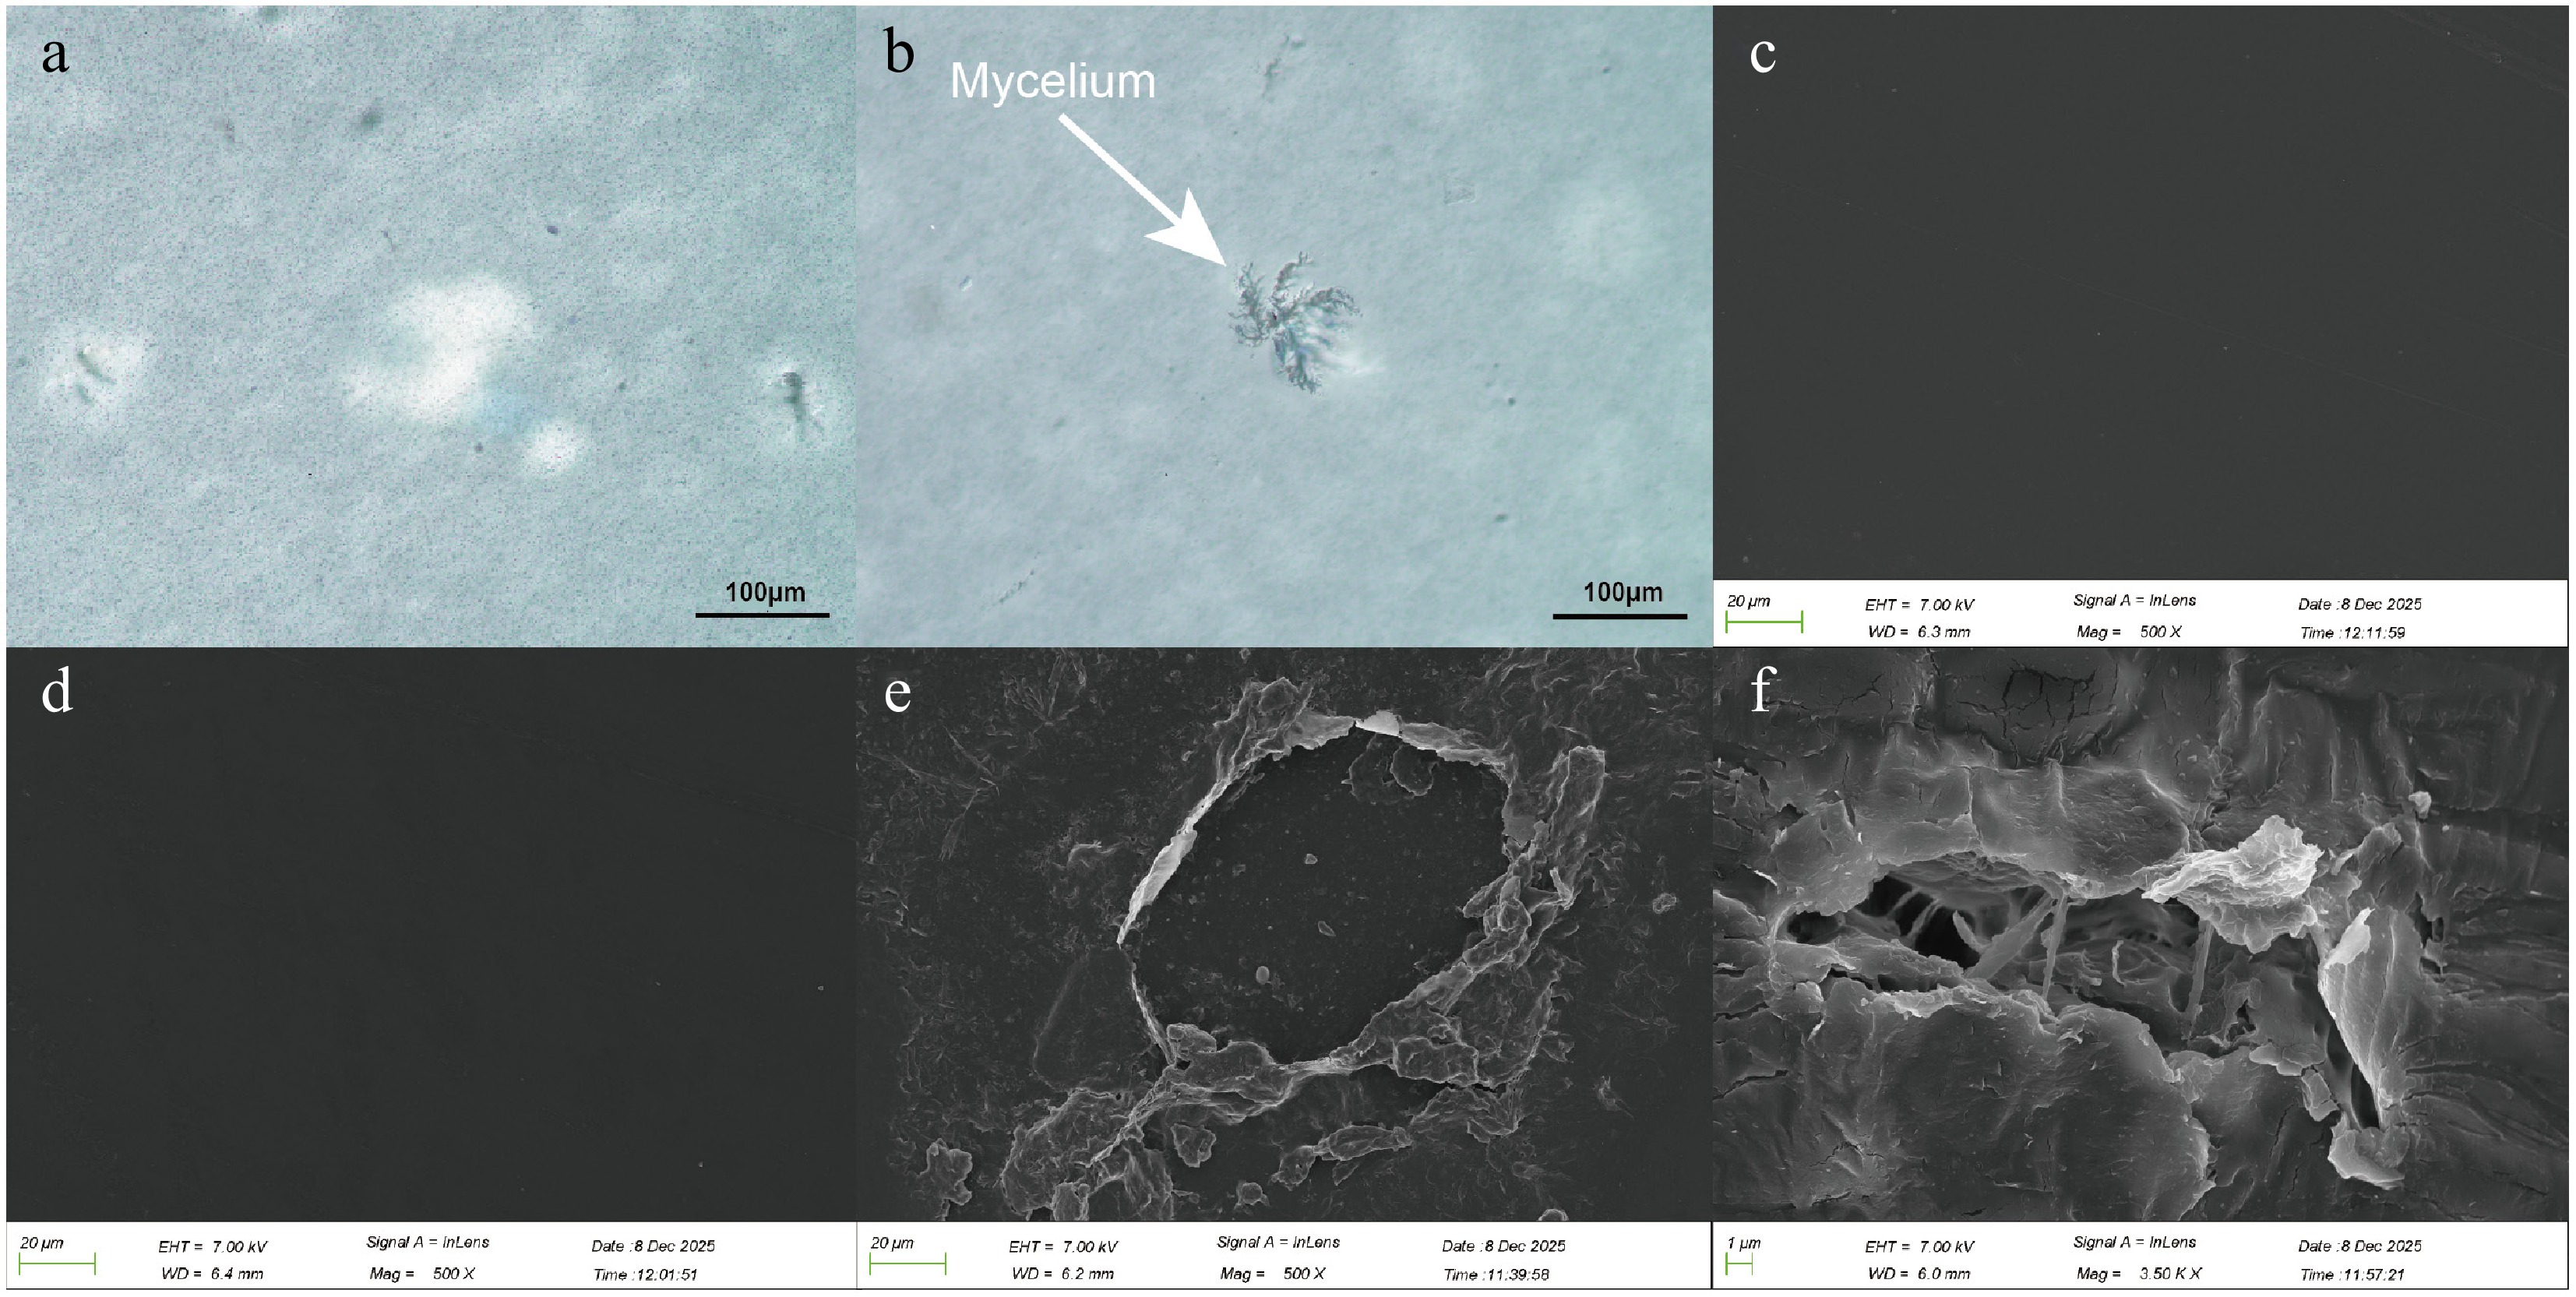
Figure 2.
Observation of the microscopic structure of PLA films. (a) Optical microscope image of the PLA film from the control group (CK). (b) Optical microscope image of the PLA film after 2 months of incubation by F. vanettenii. (c) SEM image of the PLA film surface before incubation. (d) SEM image of the PLA film surface from the control group (CK) after 2 months. (e), (f) SEM images of the PLA film surface after 2 months of incubation by F. vanettenii; (e) shows the formed pores, and (f) shows the generated cracks.
-
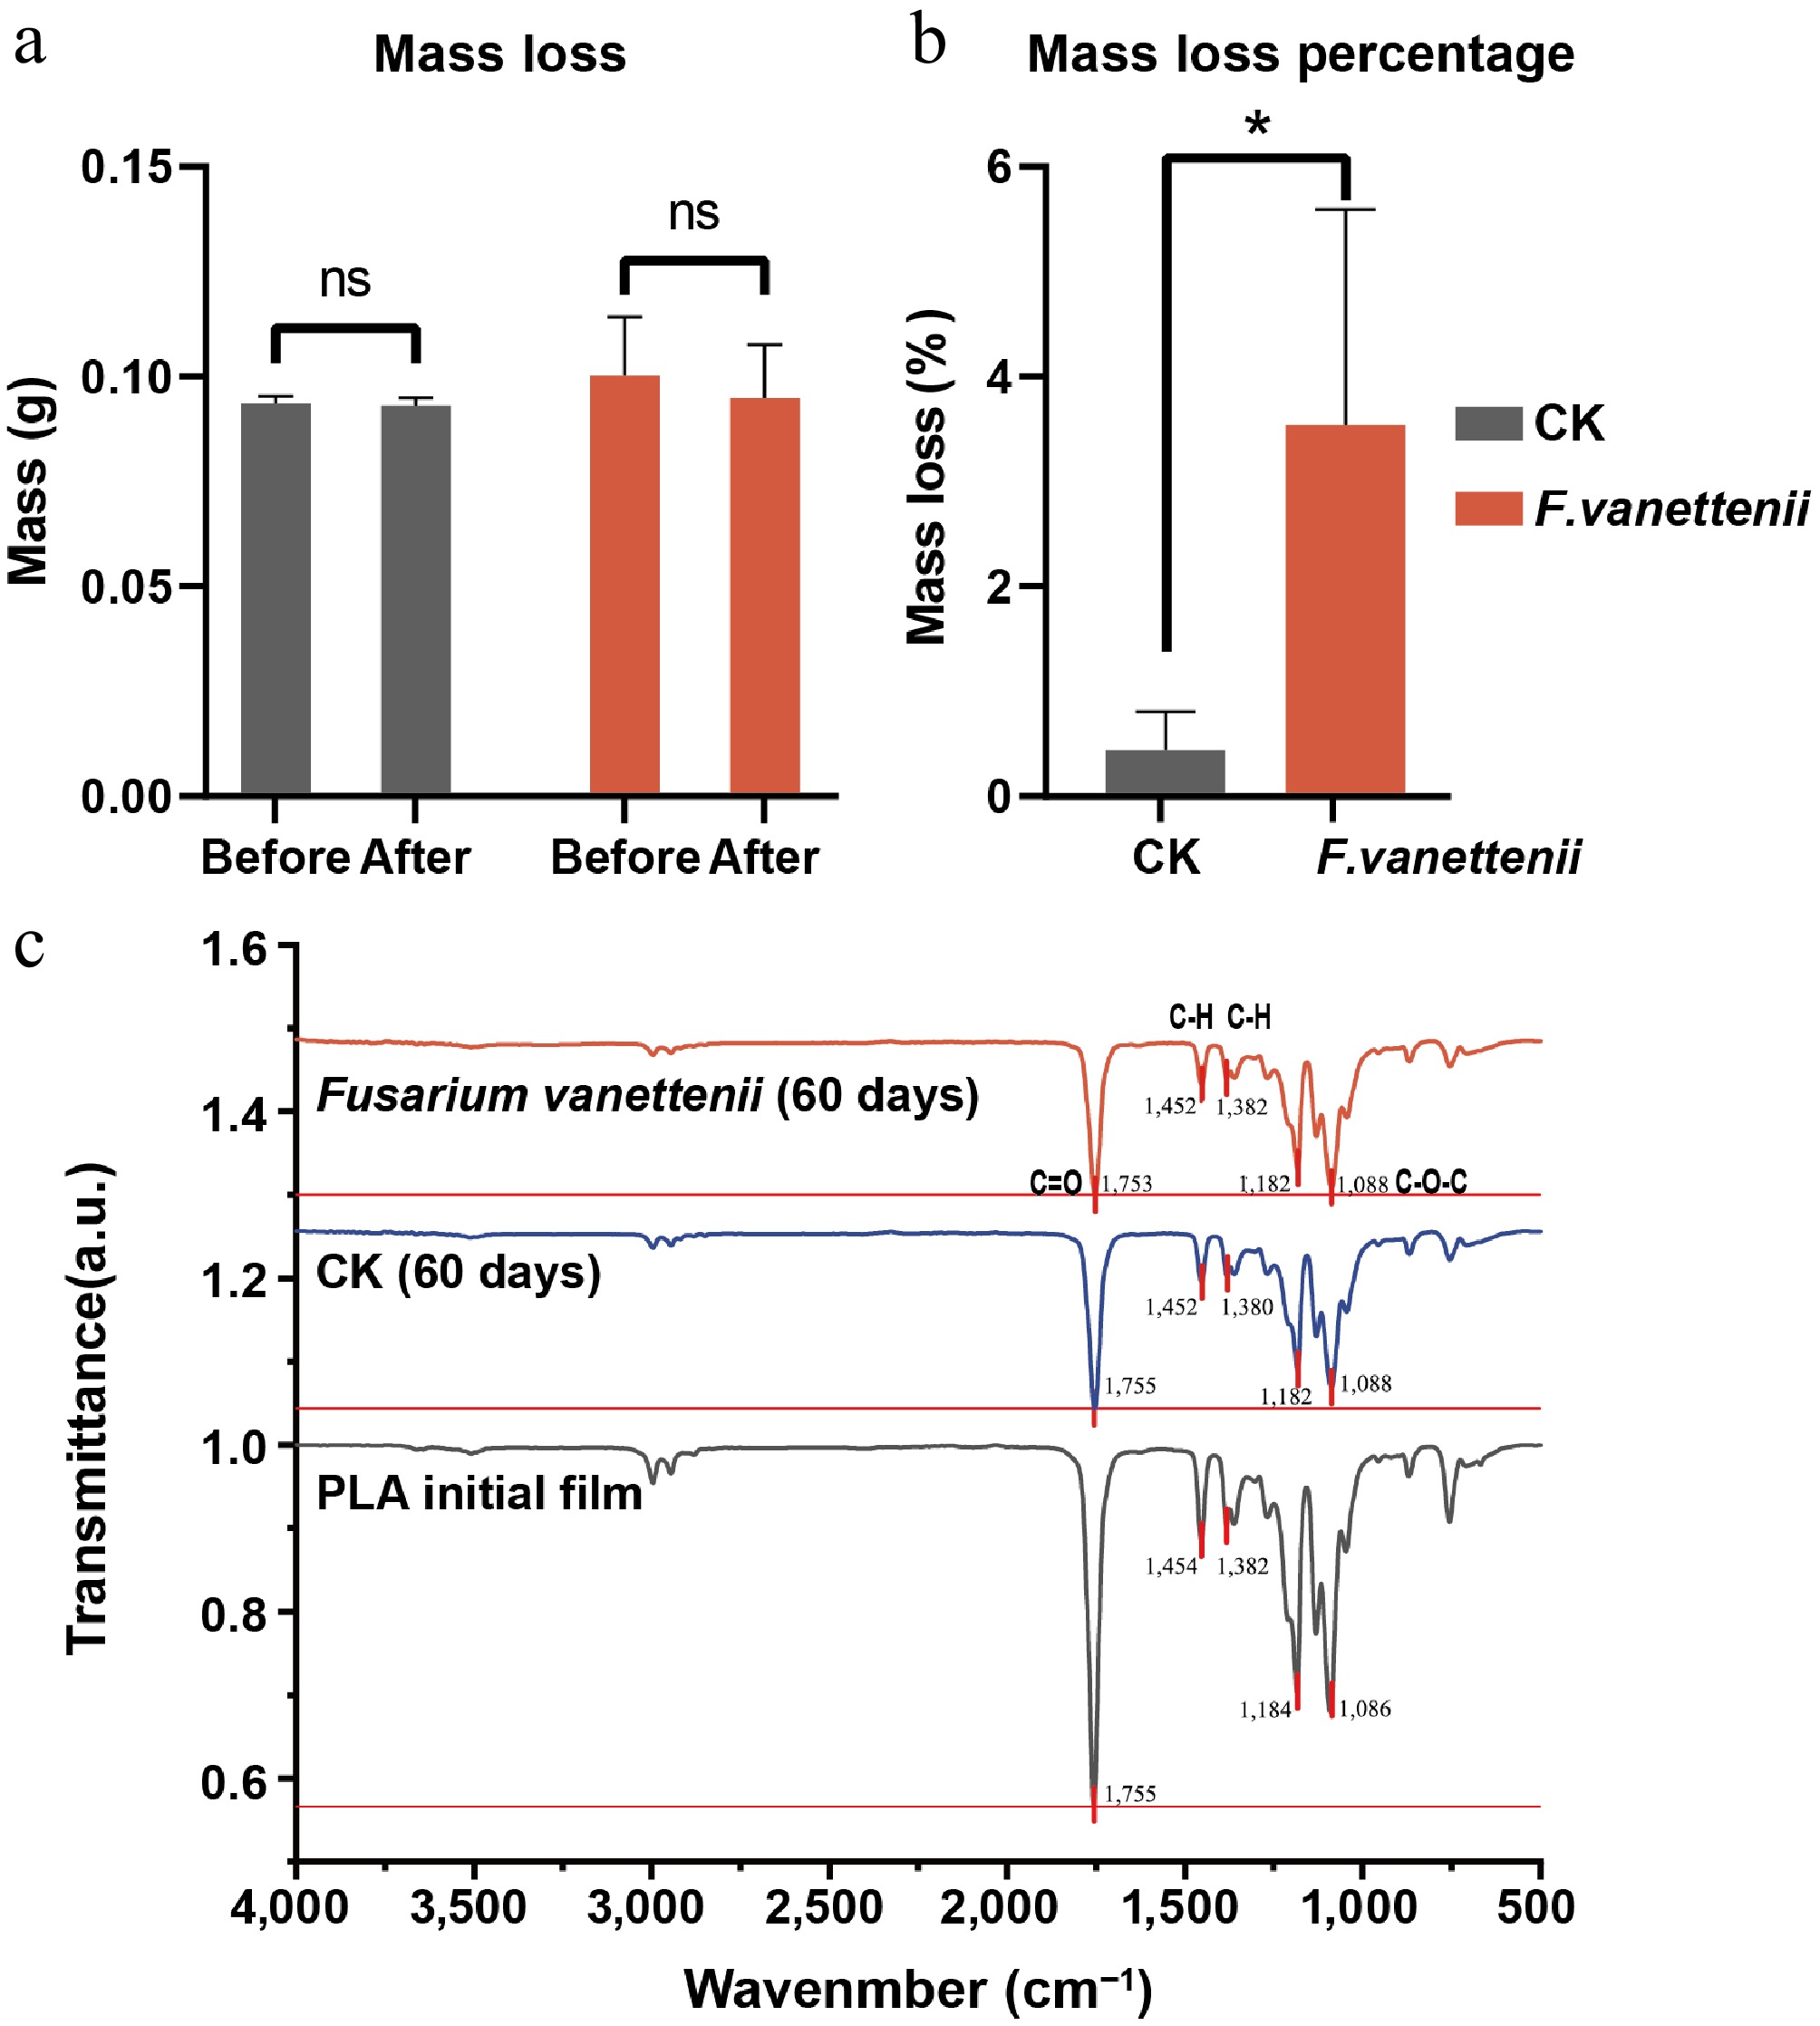
Figure 3.
Mass loss and chemical construction determination of PLA films. (a) Absolute mass of PLA films before and after cultivation. The data points represent individual repetitions. The points of the same PLA film before and after cultivation are connected by lines. The error bars represent the mean ± standard deviation (n = 3). (b) Mass loss percentage of PLA films after cultivation. The bar chart represents the group mean, and the error bars are the standard deviation (n = 3). (c) FTIR spectroscopy results. * Represents p < 0.05, ns represents not significant.
Figures
(3)
Tables
(0)