Processing math: 100%
ARTICLE   Open Access    

Discrimination capacity analysis of FTIR-PCA and EEM-PARAFAC on dandelion tissues extracts

More Information
  • Dandelion root contains triterpenoids, polyphenols and flavonoids, dandelion leaf is rich in polyphenols, flavonoids, flavonoids glycosides, and dandelion flower mainly contains flavonoids, among other substances. These different substance content leads to specific benefits and function effects of each part. Fourier transform infrared spectroscopy, three-dimensional fluorescence spectroscopy and related multivariate statistical methods are widely used to determine sample characteristics, but limited research focuses on the substance difference and characteristics in dandelion tissues. In this paper, Fourier transform infrared spectra-principal component analysis and three-dimensional fluorescence spectroscopy-parallel factor analysis were conveyed to analyze dandelion stem, leaf, root and flower tissue extracts, for determining the substance species and content difference among dandelion tissues and evaluating the discrimination capacity of these analysis methods. The Fourier transform infrared spectroscopy of root was distinct from others, and the two principal component models could distinguish dandelion stem and flower, but failed to differentiate leaf and root; while the excitation and emission matrix showed that stem and flower, leaf and root had similar intensity band distribution but different fluorescence intensity, and the parallel factor analysis results proved that one- and three-component models cannot differentiate the tissues of stem and flower, leaf and root, since the fluorescent compounds (polyphenol, flavonoid etc.) structure and content were similar in different tissues. These results indicated that Fourier transform infrared-principal component analysis might be a useful method when various fluorescent compounds exist.
  • The United States is the world's second largest producer of strawberries (Fragaria × ananassa Duch.)[1]. In 2017, the U.S. produced 1.6 billion pounds of strawberries, with an industry value of near $3.5 billion[2,3]. Strawberry is one of the most consumed fruits in the U.S., with per capita consumption of 7.12 lbs in 2018[46]. Strawberries are rich in basic nutritional components including sugars, mineral nutrients, and vitamins, and bioactive compounds that are known to have antioxidant capacity, scavenge free radicals, and introduce health benefits such as slowing down aging, preventing cardiovascular diseases, inflammation, and certain types of cancers[7, 8].

    Cultivated strawberry plants are classified into three types of cultivars based on their flowering response to photoperiod and temperature: June-bearing, everbearing, or day-neutral[9]. June-bearing strawberries initiate flowering in response to a short photoperiod of 14 h or less, or low temperatures below 15 °C, and typically produce one flush of fruit in spring[9,10]. Ever-bearing cultivars initiate flower buds with days of greater than 12 h, resulting in a fall harvest or two crops in one year[11]. Day-neutral strawberry plants can produce crowns and flower buds whenever the temperature is within a favorable range of 4 to 29 °C regardless of the day length[12]. This ability allows for potential year-round fruit harvest in areas where summer or fall temperatures stay in this range or where high tunnels or other protected cultivation methods can produce the favorable conditions[12,13]. Commercial production of strawberries uses mostly June-bearing cultivars or a combination of June-bearing and day-neutral cultivars, with ever-bearing cultivars rarely grown outside of home gardens. There has been increasing interest in using day-neutral cultivars for extended harvest season[3].

    The leading states for strawberry production in the U.S. are California and Florida, producing approximately 91% and 8% of the nation's strawberry crop[14]. Commercial strawberry production in the U.S. uses primarily an annual hill production system featuring plasticulture and raised beds. Strawberry production in all other states is mainly small-scale and aims for local market outlets[3]. Growers are seeking ways to improve competitiveness, including using protected culture with greenhouses, high and low tunnels, or soilless culture to achieve season extension, reduce pest pressure, and improve fruit yield and quality[3,15]. Besides using an annual hill system, strawberry plants can also be grown as hanging baskets and marketed to home gardeners for both the decorative and edible attributes. Best management practices including fertilization and irrigation of containerized strawberry plants using soilless substrate largely remain unknown and merits investigation.

    There has been strong consumer demand for locally, sustainably, or organically grown fruits and vegetables with increasing consumer health consciousness[1618]. Organically grown strawberry fruit were found to have lower pesticide residues, better fruit quality, and greater antioxidant activity[17]. By comparison, Hargreaves et al.[19] found no significant differences in yield, total soluble solids content or antioxidant capacity in organically versus conventionally grown strawberries. Similar flavanol and phenolic acid contents were found in berries grown organically and conventionally by Häkkinen & Törrönen[20]. Fertilization management is an important aspect of growing strawberry plants in an alternative production system. There lacks information regarding effects of certain organic growing practices like fertilizer type on plant growth, fruit yield and quality of strawberry plants.

    An efficient irrigation program should be economically sound, and reduce excessive nutrient leaching to ground water. Deficit irrigation increased concentrations of taste- and health-related compounds including sugars and acids in strawberry fruit, but resulted in smaller fruit size[21]. Fare et al.[22] reported that splitting the irrigation volume into separate times reduced water runoff and nitrate leached from the substrate in container grown holly (Ilex crenata Thunb. 'Compacta'). Scagel et al.[23,24] reported that increased irrigation frequency decreased water stress, increased nitrogen use efficiency, and had varying effects on mineral nutrient uptake of three Rhododendron species. Irrigation applied in split intervals increased plant growth, carbon dioxide (CO2) assimilation, stomatal conductance, and water use efficiency of Cotoneaster dammeri 'Skogholm' compared with plants receiving water once in the morning[25]. Plant species varied in their response to altered irrigation frequency. Li et al.[26] found that increasing irrigation frequency from once to twice per day decreased plant growth index, root dry weight, length, surface area, and flower number per plant in Rhododendron sp. 'Chiffon'. Two irrigations per day increased plant size, substrate moisture, and N concentration in Hydrangea macrophylla 'Merritt Supreme' compared to one irrigation[27]. The effect of altering irrigation frequency on plant growth and fruit production of strawberry cultivars remains unclear.

    We hypothesized that fertilizer type and irrigation frequency may affect strawberry plant performance independently or interactively when grown in containers with soilless substrate. The objective of this study was to investigate plant vegetative growth, gas exchanges, fruit yield and quality of ten containerized strawberry cultivars, including seven June-bearing and three day-neutral, as affected by fertilizer type and irrigation frequency in USDA hardiness zone 8a.

    Seven June-bearing cultivars 'Allstar', 'Chandler', 'Darselect', 'Earlyglow', 'Honeoye', 'Jewel', and 'L'Amour', and three day-neutral cultivars 'Evie 2', 'San Andreas', and 'Seascape' were evaluated in this study. Bare root liners of the ten selected cultivars were purchased from a commercial nursery (Nourse Farms, Whately, MA, U.S.) and transplanted into 2-gallon plastic containers (C900, top diameter 24.1 cm, height 23.2 cm, volume 7.33 L; Nursery Supplies® Inc., Chambersburg, PA, U.S.) on 28 Feb. 2018. Pine bark : peat moss : perlite in a volume ratio of 4:3:1 was used as growing substrate. The substrate was incorporated with 0.89 kg·m−3 micronutrient (Micromax®; ICL Specialty Fertilizers, Summerville, SC, U.S.) and 2.97 kg·m−3 lime (Soil Doctor Pelletized Lawn Lime; Oldcastle, Atlanta, GA, U.S.). Each containerized plant was fertilized with 60 g granular organic fertilizer 5N-1.3P-3.3K (5-3-4; McGeary Organics, Lancaster, PA, U.S.) or 20 g conventional controlled-release fertilizer 15N-2P-10K (Osmocote® 15-9-12 5−6 months; Scotts Miracle-Grow Co., Marysville, OH, U.S.). All strawberry plants were maintained outdoors in full sun at the R. R. Foil Plant Science Research Center of Mississippi State University in Starkville, MS, U.S. (lat. 33.45° N, long. 88.79° W; USDA hardiness zone 8a). Strawberry plants were drip irrigated at a flow rate of half gallon per hour with the same total daily irrigation volume through two irrigation frequencies: once per day at 0800HR or twice per day at 0800HR (half volume) and 1430HR (half volume). Plants were irrigated to replace daily water loss plus 10% to 15% leaching fraction. Irrigation volume was determined by randomly selecting ten plants and measuring their daily water use approximately once per month.

    Local outdoor air temperature in Starkville were obtained from the website of the USDA-Natural Resources Conservation Service[28]. Growing degree days (GDDs) were calculated daily by [(Daily maximum temperature + Daily minimum temperature)/2 – Base temperature]. Cumulative GDDs between certain time periods were estimated by summing daily GDDs. The base temperature used for strawberry was 3 °C[29].

    Plant height and widths (width 1, the widest point of canopy; width 2, perpendicular width of width 1) of each plant were measured on 22 June 2018. Plant growth index (PGI) was calculated as the average of the plant height and two widths to estimate plant size. On 20 June, relative leaf chlorophyll content was estimated by SPAD readings. Leaf SPAD readings were measured from the terminal leaflet of three fully expanded new leaves using a chlorophyll meter (SPAD 502 Plus; Konica Minolta, Inc., Osaka Japan). An average of the three readings were calculated to represent relative leaf chlorophyll content of an individual plant. Plant visual quality was evaluated by a five-point scale, where 1 = poor quality with severe leaf damage over 70%; 2 = leaf damage of 50% to 70%, 3 = moderate quality with 20% to 50% leaf damage; 4 = good quality with minor leaf damage of less than 20%; 5 = excellent quality without any leaf damage. A dead plant was rated 0 for the visual score.

    One plant from each treatment combination was destructively harvested with three replications. For each individual plant, shoots were separated from roots, and roots were then cleaned free of substrate. Roots and shoots samples were oven dried at 60 °C to constant weight. The number of crowns from each harvested plant and the dry weight of each sample were recorded.

    Daily water use (DWU) was determined in plants irrigated once per day using a gravimetric method by subtracting pot weight (plant included) 24 h after irrigation from pot weight at container capacity (about half an hour after irrigation). Daily water use was measured twice on 19 June and 27 June, respectively. Substrate moisture at 6-cm depth was measured using a soil moisture sensor (ML2x; Delta-T Devices, Cambridge, England) with two readings collected from each container. The moisture sensor was connected to a soil sensor reader (HH2; Delta-T Devices) for instant moisture readings. Substrate moisture was measured on 27 June before scheduled daily irrigation in the morning.

    To evaluate physiological activities of plants affected by fertilizer type and irrigation frequency, leaf net photosynthetic rate (Pn), stomatal conductance (gs), and transpiration rate (E) of strawberry plants were measured between 1100HR and 1500HR on 27 June and 28 June using a portable photosynthesis system (LI-6400XT; LI-COR, Lincoln, NE, U.S.). Three plants were randomly selected from three different blocks for gas exchange measurements for each treatment combination. One recent fully expanded leaf, not shaded by other leaves, was selected for the measurement. The selected leaf was enclosed into a 2-cm2 leaf chamber with a fluorometer (6400-40; LI-COR) as the light source. A reference CO2 concentration of 400 µmol·mol−1 and photosynthetically active radiation (PAR) of 1500 µmol·m−2·s−1 were maintained inside the leaf chamber during gas exchange measurements. Block temperature was maintained according to outdoor air temperature on the measurement date.

    Strawberry fruit was harvested once per week. The date of first fruit harvest was recorded for each plant. Strawberries were culled for misshaped, disease- or insect-damaged fruits. Fruit yield and the number of fruit at each harvest were recorded. Yield from each harvest was summed up for a season total. Soluble solids content of strawberry fruit from each plant were measured using a digital refractometer (PR-32α; Atago U.S.A., Inc., Bellevue, WA, U.S.). Fruit firmness was measured with a fruit hardness tester (FR-5120; Lutron Electronic Enterprise CO., LTD, Taipei, Taiwan, ROC). One marketable fruit was used to measure soluble solids content and fruit firmness from each plant, respectively.

    The experiment was designed in a factorial randomized complete block design with five replications. Three mains factors are strawberry cultivar (10), fertilizer type (2), and irrigation frequency (2), resulting in 40 treatment combinations. Each replication contained two single-plant subsamples. Due to the large number of treatment combinations, data of plant dry weights and gas exchange were measured with three replications, where the three plants were randomly selected from different blocks. Data were analyzed by analysis of variance (ANOVA) using the PROC GLIMMIX procedure in SAS (version 9.4; SAS Institute, Cary, NC, U.S.). Where indicated by ANOVA, means were separated using Tukey's Honest Significant Difference (HSD) test at P ≤ 0.05.

    Plant vegetative growth variables including plant growth index (PGI) (P < 0.0001), leaf relative chlorophyll content measured as leaf SPAD (P < 0.0001), number of crowns per plant (P = 0.040), visual score (P < 0.0001), and root dry weight (P < 0.0001) varied among cultivars (Table 1), with PGI (P = 0.0003), SPAD (P < 0.0001), and plant visual score (P < 0.0001) also affected by the main effect of fertilizer type without interactions (Table 2).

    Table 1.  Vegetative growth of seven June-bearing ('Allstar', 'Chandler', 'Darselect', 'Earlyglow', 'Honeoye', 'Jewel', and 'L'Amour') and three day-neutral ('Evie 2', 'San Andreas', and 'Seascape') strawberry cultivars grown in Starkville, Mississippi in 2018.
    CultivarPGI1, 2 (cm)SPADNumber of crowns
    (per plant)
    Visual score
    (1-5)3
    Shoot dry wt.
    (g per plant)
    Root dry wt.
    (g per plant)
    Allstar41.2 ab31.9 def4.1 ab3.0 bcde71.413.5 abcd
    Chandler37.4 c30.1 f4.3 ab2.9 bcde65.810.1 d
    Darselect39.5 abc31.0 ef3.8 ab2.6 e65.114.6 abc
    Earlyglow38.3 bc32.9 de4.0 ab2.8 cde63.711.9 cd
    Evie 237.0 c36.3 ab3.8 ab3.0 bcde58.89.6 d
    Honeoye40.9 ab35.3 bc4.2 ab3.8 a81.516.5 ab
    Jewel41.6 a30.4 f3.5 b2.7 de67.512.9 abcd
    L'Amour38.5 abc33.5 cd4.4 ab3.2 bc75.917.3 a
    San Andreas37.6 c37.5 a4.2 ab2.9 cde64.412.3 bcd
    Seascape38.7 abc35.7 abc5.2 a3.3 b63.211.5 cd
    P-value<.0001<.00010.040<.00010.13<.0001
    1 Plant growth index (PGI) = [plant height + widest width 1 + width 2 (width at the perpendicular direction to width 1]/3.
    2 Different lower-case letters within a column suggest significant difference indicated by Tukey's HSD test at P ≤ 0.05.
    3 Plant visual quality was evaluated by a five-point scale, where 1 = poor quality with severe leaf damage over 70%; 2 = leaf damage of 50% to 70%; 3 = moderate quality with 20% to 50% leaf damage; 4 = good quality with minor leaf damage of less than 20%; 5 = excellent quality without any leaf damage. A dead plant was rated 0 for the visual score.
     | Show Table
    DownLoad: CSV
    Table 2.  Effect of fertilizer type on plant growth index (PGI), leaf SPAD, visual score, yield in May, daily water use, substrate moisture, and net photosynthetic rate (Pn) of container-grown strawberries grown in Starkville, Mississippi.
    Fertilizer1PGI2 (cm)SPADVisual score
    (1−5)
    Yield in May
    (g per plant)
    Daily water use (L per day)Substrate moisture (%)Pn
    (µmol·m−2·s−1)
    19 June26 June
    Organic38.3 b32.3 b2.8 b57.9 b0.54 b0.62 b27.2 a10.7 b
    Conventional39.9 a34.6 a3.2 a67.9 a0.65 a0.73 a24.6 b12.0 a
    P-value0.0003< 0.0001< 0.00010.044< 0.00010.0003< 0.00010.0059
    1 Strawberry plants were fertilized with a conventional controlled release fertilizer or an organic fertilizer at comparable rates.
    2 Different lower-case letters within a column suggest significant difference indicated by Tukey's HSD test at P ≤ 0.05.
     | Show Table
    DownLoad: CSV

    'Allstar', 'Jewel', and 'Honeoye' had comparable highest PGIs ranging from 40.9 to 41.6 cm, higher than 'Chandler', 'Evie 2', or 'San Andreas' with the lowest PGIs of 37.0 to 37.6 cm (Table 1). The other four cultivars 'Darselect', 'Earlyglow', 'L'Amour', and 'Seascape' had similar PGIs of 38.3 to 39.5 cm. The three day-neutral cultivars 'Evie 2', 'San Andreas', and 'Seascape' had the comparable highest leaf SPAD ranging from 35.7 to 37.5, with 'Allstar', 'Chandler', 'Darselect', and 'Jewel' having the lowest SPAD ranging from 30.4 to 31.9. Ten tested cultivars generally produced similar number of crowns per plant averaged 3.5 to 5.2 per plant. 'Honeoye' had the highest visual scores averaged 3.8 with minor leaf diseases. 'L'Amour' and 'Seascape' had intermediate visual scores of 3.2 and 3.3, respectively. 'Allstar', 'Chandler', 'Darselect', 'Earlyglow', 'Evie 2', 'Jewel', and 'San Andreas' had comparable visual scores ranging from 2.6 to 3.0 out of 5.

    Shoot dry weight ranged from 58.8 to 81.5 g per plant, similar among all tested cultivars. 'Allstar', 'Darselect', 'Honeoye', 'Jewel' and 'L'Amour' had comparable root dry weights of 12.9 to 17.3 g per plant, with 'Chanlder', 'Earlyglow', 'Evie 2', 'San Andreas', and 'Seascape' having comparable root dry weights of 9.6 to 12.3 g per plant (Table 1).

    When affected by the main effect of fertilizer type, the conventional fertilizer increased PGI, SPAD, and visual score by 4.2%, 7.1%, and 14.3% compared to the organic fertilizer, respectively (Table 2). Fertilizer type did not affect other vegetative growth variables including number of crowns, shoot, and root dry weight.

    Affected by the interaction between fertilizer type and irrigation frequency (P = 0.049), strawberry plants fertilized with the conventional fertilizer and irrigated twice per day produced higher shoot dry weight of 81.8 g per plant than plants fertilized with organic fertilizer and irrigated twice per day, or plants irrigated once per day fertilized with the conventional or the organic fertilizer (Table 3). Irrigation frequency did not affect plant vegetative growth variables including PGI, SPAD, number of crowns, visual score, and root dry weight.

    Table 3.  Shoot dry weight affected by the interaction between irrigation frequency and fertilizer type and substrate moisture affected by the main effect of irrigation frequency of container-grown strawberries.
    Irrigation frequency1FertilizerShoot dry wt
    (g per plant)2
    Substrate moisture (%)
    OnceOrganic60.3 b21.21 b
    Conventional68.1 b
    TwiceOrganic60.7 b30.55 a
    Conventional81.8 a
    P-value0.049< 0.0001
    1 Seven June-bearing ('Allstar', 'Chandler', 'Darselect', 'Earlyglow', 'Honeoye', 'Jewel', and 'L'Amour') and three day-neutral ('Evie 2', 'San Andreas', and 'Seascape') strawberry cultivars were grown in 2-gal containers irrigated once or twice per day with the same total irrigation volume, and fertilized with a conventional controlled release fertilizer or an organic fertilizer at comparable rates.
    2 Different lower-case letters within a column suggest significant difference indicated by Tukey's HSD test at P ≤ 0.05.
     | Show Table
    DownLoad: CSV

    When transplanted on 28 Feb, 2018, fruit harvest of tested strawberry cultivars started 49.4 days after transplanting (DAT) in 'Honeoye' to 65.7 DAT in 'Chandler' in the 2018 growing season (Table 4), with correspondent cumulative GDDs of 536 and 783 (Fig. 1a), respectively. The day-neutral cultivar 'Evie 2' was the second latest-fruiting cultivar with the first harvest being 60.9 DAT. Local average daily air temperature was in between 12.8 to 23.6 °C during the first fruit harvest of tested cultivars (Fig. 1b). Fertilizer type or irrigation frequency did not affect the fruit production timing of any tested cultivar. The first fruit harvest was on 19 Apr and the last fruit harvest was on 13 June 2018 with a total of ten harvests.

    Table 4.  Fruiting characteristics including first harvest date, number of fruit per plant, berry size, soluble solids content, and fruit firmness of seven June-bearing ('Allstar', 'Chandler', 'Darselect', 'Earlyglow', 'Honeoye', 'Jewel', and 'L'Amour') and three day-neutral ('Evie 2', 'San Andreas', and 'Seascape') strawberry cultivars grown in Starkville, Mississippi in 2018.
    CultivarFirst harvest date1 (DAT)Number
    of fruit
    (per plant)
    Berry size (g per berry)Soluble
    solids content
    (°Brix)
    Fruit firmness (N)
    Allstar58.6 bc6.9 c8.8 e10.5 a1.89 abc
    Chandler65.7 a4.6 cd11.7 d10.4 a1.32 e
    Darselect54.0 def4.7 cd14.0 bc11.5 a1.48 de
    Earlyglow51.3 fg3.9 cd9.3 e11.5 a1.49 de
    Evie 260.9 b16.5 a14.8 b8.4 c1.53 de
    Honeoye49.4 g4.4 cd10.1 de10.4 ab1.60 cde
    Jewel58.4 bcd6.0 cd10.2 de10.3 ab1.73 bcd
    L'Amour57.3 bcde3.1 d12.2 cd11.1 a2.00 ab
    San Andreas53.7 efg5.0 cd17.8 a8.7 bc2.17 a
    Seascape54.4 cdef12.3 b14.2 bc10.9 a1.65 cd
    P-value< 0.0001< 0.0001< 0.0001< 0.0001< 0.0001
    1 Different lower-case letters within a column suggest significant difference indicated by Tukey's HSD test at P ≤ 0.05.
     | Show Table
    DownLoad: CSV
    Figure 1.  (a) Cumulative growing degree days (GDDs) and (b) outdoor daily air temperatures from 1 Mar to 15 June 2018 in Starkville, Mississippi, U.S. GDDs = (Tdaily max + Tdaily min)/2– Tbase. Tbase = 3 °C for strawberries. GDDs was calculated on a daily basis, and cumulative GDDs during certain time periods were estimated by summing up daily GDDs; Local outdoor air temperature data was obtained from the USDA Natural Resources Conservation Service website.

    In April, five cultivars 'Darselect', 'Earlyglow', 'Honeoye', 'San Andreas', and 'Seascape' produced similar yield ranging from 17.9 to 24.4 g fruit per plant, higher than 'Allstar', 'Chandler', or 'Jewel' (Table 5). In May, the two day-neutral cultivars 'Evie 2' and 'Seascape' produced the highest and second highest yield of 170.6 and 135.7 g fruit per plant, with 'Chandler', 'Darselect','Earlyglow', 'Honeoye', and 'L'Amour' producing the lowest yield of 16.6 and 50.2 g fruit per plant. The cultivars 'Allstar', 'Jewel', and 'San Andreas' produced similar intermediate yields of 52.0 to 61.1 g fruit per plant in May. The conventional fertilizer increased yield in May by 17.3% compared with the organic fertilizer (Table 2). In June, 'Evie 2' produced the highest yield of 56.8 g fruit per plant, with all other cultivars producing similar yield below 10 g fruit per plant. 'Darselect' and 'Jewel' did not produce any fruit in June. Except for the two early ripening cultivars 'Earlyglow' and 'Honeoye' producing peak harvest in April, the other eight cultivars produced peak harvest in May, which was 68% to 92% of total yield.

    Table 5.  Monthly and total yield of seven June-bearing ('Allstar', 'Chandler', 'Darselect', 'Earlyglow', 'Honeoye', 'Jewel', and 'L'Amour') and three day-neutral ('Evie 2', 'San Andreas', and 'Seascape') strawberry cultivars grown in Starkville, Mississippi in 2018.
    CultivarStrawberry yield in 2018 (g per plant)1
    AprilMayJuneTotal
    Allstar5.0 c52.0 cd1.5 b58.4 cd
    Chandler3.5 c50.2 cde1.9 b55.7 cd
    Darselect18.6 ab47.3 cde0 b65.8 cd
    Earlyglow17.9 ab16.7 e0.6 b35.2 d
    Evie 28.9 bc170.6 a56.8 a236.3 a
    Honeoye24.4 a16.6 e0.5 b41.5 d
    Jewel4.6 c53.8 cd0 b58.5 cd
    L’Amour10.0 bc25.3 de0.5 b35.8 d
    San Andreas23.4 a61.1 c5.3 b89.8 c
    Seascape22.5 a135.7 b9.4 b167.6 b
    P-value< 0.0001< 0.0001< 0.0001< 0.0001
    1 Different lower-case letters within a column suggest significant difference indicated by Tukey's HSD test at P ≤ 0.05.
     | Show Table
    DownLoad: CSV

    For total yield, the two day-neutral cultivars 'Evie 2' and 'Seascape' ranked first and second producing yield of 236.3 and 167.6 g per plant, respectively (Table 5). 'Evie 2' and 'Seascape' also produced the highest and the second highest fruit number of 16.5 and 12.3 per plant among all tested cultivars (Table 4). The seven June-bearing cultivars Allstar', 'Chandler', 'Darselect', 'Earlyglow', 'Honeoye', 'Jewel', and 'L'Amour' generally produced similar total yield and number of fruit per plant ranging from 35.2 to 65.8 g per plant and 3.1 to 6.9 fruits per plant, respectively.

    The day-neutral cultivar 'San Andreas' produced the largest berry size averaged 17.8 g per berry, higher than 'Darselect', 'Evie 2', or 'Seascape' producing berry size of 14.0 to 14.8 g per berry. 'Allstar', 'Earlyglow', 'Honeoye', and 'Jewel' produced comparable lowest berry sizes of 8.8 to 10.1 g per berry (Table 4).

    'Allstar', 'Chandler', 'Darselect', 'Earlyglow', 'Honeoye', 'Jewel', 'L'Amour', and 'Seascape' had comparable soluble solids content ranging from 10.3 to 11.1 °Brix, with 'Evie 2' and 'San Andreas' producing fruit with the lowest soluble solids content of 8.4 and 8.7 °Brix, respectively. 'San Andreas', 'L'Amour', and 'Allstar' produced the firmest strawberry fruit of 1.89 to 2.17 N, higher than 'Chandler', 'Darselect', 'Earlyglow', or 'Evie 2' producing the least firm fruit of 1.32 to 1.53 N (Table 4).

    Fruiting characteristics including time of fruit harvest, strawberry yield, berry size, number of fruit per plant, fruit soluble solids content and firmness were not affected by fertilizer type or irrigation frequency.

    Daily water use was significantly different among cultivars on June 19 but similar among cultivars on June 26 ranging from 0.57 to 0.78 L per day (Table 6). On June 19, eight cultivars had similar daily water use ranging from 0.54 L ('San Andreas') to 0.67 L ('Allstar'), with 'L'Amour' and 'Seascape' having the highest and lowest daily water use of 0.71 and 0.53 L per day, respectively. Substrate moisture at 6-cm depth was generally similar among cultivars ranging from 23.1% in 'Darselect' to 28.0% in 'Allstar'. Organic fertilizer resulted in increased substrate moisture by 10.6% compared to the conventional fertilizer (Table 2). Two irrigations per day also increased substrate moisture by 44.0% compared to one irrigation per day (Table 3).

    Table 6.  Daily water use measured on two dates and substrate moisture measured on 27 June 2018 of seven June-bearing ('Allstar', 'Chandler', 'Darselect', 'Earlyglow', 'Honeoye', 'Jewel', and 'L'Amour') and three day-neutral ('Evie 2', 'San Andreas', and 'Seascape') strawberry cultivars grown in containers in Starkville, Mississippi.
    CultivarDaily water use
    (L per day)1
    Substrate moisture (%)
    19 June26 June27 June
    Allstar0.67 ab0.7828.0 a
    Chandler0.58 abc0.7325.0 ab
    Darselect0.60 abc0.6623.1 b
    Earlyglow0.58 abc0.6726.8 ab
    Evie 20.53 bc0.6526.9 ab
    Honeoye0.65 abc0.7227.5 a
    Jewel0.57 abc0.6227.3 ab
    L'Amour0.71 a0.7223.8 ab
    San Andreas0.54 bc0.6125.5 ab
    Seascape0.53 c0.5725.0 ab
    P-value0.00040.0740.0037
    1 Different lower-case letters within a column suggest significant difference indicated by Tukey's HSD test at P ≤ 0.05.
     | Show Table
    DownLoad: CSV

    Net photosynthetic rate (Pn) was the highest in 'L'Amour' of 14.4 µmol·m−2·s−1, similar to 'San Andreas' or 'Seascape', but higher than the other seven cultivars ranging from 9.7 to 11.2 µmol·m−2·s−1 (Table 7). Stomatal conductance (gs) was similar among all cultivars ranging from 0.072 mol·m−2·s−1 in 'Darselect' to 0.14 mol·m−2·s−1 in 'L'Amour' or 'San Andreas'. The conventional fertilizer increased Pn by 12.1% compared with the organic fertilizer (Table 2). 'San Andreas' had the highest transpiration rate (E) of 6.65 mmol·m−2·s−1, similar to 'Allstar', 'Chandler', 'Earlyglow', 'Evie 2', 'L'Amour', and 'Seascape', but higher than 'Darselect', 'Honeoye', or 'Jewel' with E ranging from 3.16 mmol·m−2·s−1 to 3.98 mmol·m2·s−1. Gas exchange measurements including Pn, gs, and E were not affected by irrigation frequency.

    Table 7.  Gas exchange measurements including net photosynthetic rate (Pn), stomatal conductance (gs), and transpiration rate (E) of seven June-bearing ('Allstar', 'Chandler', 'Darselect', 'Earlyglow', 'Honeoye', 'Jewel', and 'L'Amour') and three day-neutral ('Evie 2', 'San Andreas', and 'Seascape') strawberry cultivars grown in containers in Starkville, Mississippi.
    CultivarPn
    (µmol·m−2·s−1)1
    gs
    (mol·m−2·s−1)
    E
    (mmol·m−2·s−1)
    Allstar9.8 d0.10 a4.37 ab
    Chandler11.2 bcd0.12 a4.73 ab
    Darselect10.3 bcd0.072 a3.16 b
    Earlyglow10.7 bcd0.11 a5.57 ab
    Evie 211.2 bcd0.11 a4.61 ab
    Honeoye9.7 d0.089 a3.74 b
    Jewel9.9 cd0.083 a3.98 b
    L'Amour14.4 a0.14 a5.53 ab
    San Andreas13.4 ab0.14 a6.65 a
    Seascape13.0 abc0.12 a5.09 ab
    P-value< 0.00010.0260.0006
    1 Different lower-case letters within a column suggest significant difference indicated by Tukey's HSD test at P ≤ 0.05.
     | Show Table
    DownLoad: CSV

    The ten cultivars tested in this study generally showed satisfactory vegetative growth in terms of PGI, leaf SPAD, shoot and root dry weights, with five cultivars 'Allstar', 'Evie 2', 'Honeoye', 'L'Amour', and 'Seascape' having visual scores of 3 or above. The earliest ripening cultivars in this study were June-bearing 'Honeoye' and 'Earlyglow', producing ripe fruit 49.4 and 51.3 DAT, with cumulative GDDs of 536 and 556, respectively. The June-bearing 'Chandler' were the latest ripening cultivar, producing ripe fruit 65.7 DAT, with 783 GDDs.

    Strawberry harvest season in midsouthern states including Arkansas, Louisiana, Mississippi, Oklahoma, and Texas occurs from February to late May or early June, with peak production typically in April to May[3]. The first fruit harvest was in late April in this study, consistent with local strawberry harvest timing in an open field production system[30]. In this current study, the two earliest ripening June-bearing cultivars 'Earlyglow' and 'Honeoye' produced peak yield in April, all other tested cultivars produced peak yield in May. They may potentially be used in fall planting or in protected culture like high tunnels for off-season strawberry production.

    The ten cultivars generally produced lower yield and smaller fruit than reported ranges[13,31,32]. A possible reason might be the time of transplanting in spring using bare root liners. Local open field or high tunnel strawberry production systems in Mississippi typically use fall planting with plugs, which allows plants to establish vegetatively before flower and fruit production in spring[10]. Fall planted strawberry cultivars required 1,249.1 to 1,374.3 GDDs from transplanting to first ripe fruit in a high tunnel production system in the same location (unpublished data), and resulted in higher yield than spring planting. However, containerized strawberry plants can be marketed as hanging baskets and serve as ornamental plants, where overall visual quality can be valued as much as yield. The two day-neutral cultivars 'Evie 2' and 'Seascape' produced the highest and second highest total yield of all tested cultivars, higher than all June-bearing cultivars. 'Evie 2' also produced yield of 56.8 g per plant in June when all June-bearing cultivars produce less than 2 g berry per plant, showing potential for season extension into months with warmer temperatures. Local daily average air temperatures during the first two weeks of June were between 22.2 and 29.2 °C, with daily maximum air temperature ranging from 30 to 33.9 °C. High temperatures are the major limiting factor of using day-neutral cultivars to extend harvest season in Mississippi, requiring heat tolerant cultivars.

    Compared with the organic fertilizer, the conventional fertilizer increased plant growth index, leaf SPAD, visual score, yield in May, daily water use, and net photosynthetic rate regardless of strawberry cultivars in this current study. This agreed with our previous study using the same two fertilizer types but in container grown southern highbush blueberry (Vaccinium corymbosum L.) cultivars, where the conventional fertilizer increased blueberry yield in 2016[33]. The conventional fertilizer also tended to advance blueberry ripening for approximately one week compared to the organic fertilizer[33], whereas the same two fertilizer types resulted in similar strawberry harvest date in this study. Nutrients in organic fertilizers are in organic forms and must go through mineralization for nutrients to be available to plant uptake[34,35], resulting in a slow release of nutrient. Gaskell et al.[36] reported it to be unpredictable to synchronize nitrogen (N) demand for establishing strawberry plants with release of N from various organic nutrient sources compared to conventional N sources. Large quantity and continuous application of organic fertilizers are required to achieve certain fertility and soil organic matter level for optimal yield in organic farming[37,38]. The two fertilizer types are applied in proportion to provide the same total amount of nutrients. Their effects on plant growth and fruit production are subject to the rate of nutrient release and the total amount of fertilizer available to plants. Their different effects on plant growth and crop yield may become more significant over time. Therefore, organic fertilization in container grown strawberry plant may require supplement of liquid fertilizer for its fast-acting effects.

    The effect of irrigation frequency varied among plant species with different water requirements or soilless growing substrates with varying physical and chemical properties[26,27,39]. Increasing irrigation frequency can improve growth and plant nutrient uptake by continually resupplying nutrient solution to the depletion zone around the roots. Silber et al.[40] found that higher irrigation frequency led to more vegetative growth and higher concentrations of less mobile nutrients in iceberg lettuce (Lactuca sativa L.). Rhododendron species with low water requirement benefited from one irrigation per day over two irrigations: Encore azalea 'Chiffon' produced greater PGI, root biomass, and improved mineral nutrient uptake in roots under one irrigation per day[26]. Biomass production of Hydrangea macrophylla 'Merritt's Supreme' was not affected by irrigation frequency[27]. In this current study, two irrigations per day increased substrate moisture, which may affect nutrient availability in the substrate and merits further investigation. Two irrigations per day also increased plant shoot dry weight when fertilized with the conventional fertilizer, but did not affect plant size, visual quality, gas exchange, strawberry yield, or fruit quality of the ten tested strawberry cultivars. This was in agreement with Silber et al.[40] that higher irrigation frequency leads to increased vegetative growth, which can potentially be used in strawberry plant propagation to increase the number of runners per plant.

    Soilless culture of strawberries is used in limited areas due to high production cost and high demands for management expertise. It is mostly used in greenhouses or high tunnels, where off-season strawberry production and high market demand can justify the production cost[15]. Planting strawberry plants in containers alleviates extensive soil management and the need for soil fumigation, and may potentially increase production sustainability[41]. This study provides reference in fertilization and irrigation management in containers with soilless substrate. There might be potential of using container-grown strawberry plants in nursery production for propagation purposes or to be used in small-scale production for certain niche markets, which warrants further investigation.

    Of the ten tested cultivars, the two day-neutral cultivars 'Evie 2' and 'Seascape' produced higher total and late-season yields than any other June-bearing cultivar, with 'Earlyglow' and 'Honeoye' being the most early ripening cultivar. The conventional fertilizer increased plant vegetative growth, yield in May, and net photosynthesis of strawberry plants compared to the organic fertilizer at comparable rates, but did not affect time of fruit production or fruit quality. Organically fertilized strawberry plants grown in soilless substrate would likely require a combination of granular and liquid fertilizer sources to satisfy plant nutrient requirements effectively. More frequent irrigation in combination with the conventional fertilizer was beneficial for plant vegetative growth with improved shoot dry weight

    This work was supported by the United States Department of Agriculture (USDA) National Institute of Food and Agriculture Hatch Project MIS-112040 and the Mississippi State University Agricultural and Forestry Experimental Station Strategic Research Initiative. Mention of a trademark, proprietary product, or vendor does not constitute a guarantee or warranty of the product by Mississippi State University or the USDA and does not imply its approval to the exclusion of other products or vendors that also may be suitable.

  • Guihong Bi and Tonyin Li are the Editorial Board members of journal Technology in Horticulture. They were blinded from reviewing or making decisions on the manuscript. The article was subject to the journal's standard procedures, with peer-review handled independently of these Editorial Board members and their research groups.

  • [1]

    González-Castejón M, Visioli F, Rodriguez-Casado A. 2012. Diverse biological activities of dandelion. Nutrition Reviews 70:534−47

    doi: 10.1111/j.1753-4887.2012.00509.x

    CrossRef   Google Scholar

    [2]

    Law SK, Lo C, Han J, Chuanshan X, Leung A. 2021. Traditional Chinese herbal, "Dandelion" and its applications on skin-care. Traditional and Integrative Medicine 6:152−57

    doi: 10.18502/tim.v6i2.6794

    CrossRef   Google Scholar

    [3]

    Menke K, Schwermer M, Felenda J, Beckmann C, Stintzing F, et al. 2018. Taraxacum officinale extract shows antitumor effects on pediatric cancer cells and enhance mistletoe therapy. Complementary Therapies in Medicine 40:158−64

    doi: 10.1016/j.ctim.2018.03.005

    CrossRef   Google Scholar

    [4]

    Park S, Kim DS, Wu X, Yi QJ. 2018. Mulberry and dandelion water extracts prevent alcohol-induced steatosis with alleviating gut microbiome dysbiosis. Experimental Biology and Medicine 243:882−94

    doi: 10.1177/1535370218789068

    CrossRef   Google Scholar

    [5]

    Xue Y, Zhang S, Du M, Zhu MJ. 2017. Dandelion extract suppresses reactive oxidative species and inflammasome in intestinal epithelial cells. Journal of Functional Foods 29:10−18

    doi: 10.1016/j.jff.2016.11.032

    CrossRef   Google Scholar

    [6]

    Mahboubi M, Mahboubi M. 2020. Hepatoprotection by dandelion (Taraxacum officinale) and mechanisms. Asian Pacific Journal of Tropical Biomedicine 10:1−10

    doi: 10.4103/2221-1691.273081

    CrossRef   Google Scholar

    [7]

    Williams CA, Goldstone F, Greenham J. 1996. Flavonoids, cinnamic acids and coumarins from the different tissues and medicinal preparations of Taraxacum officinale. Phytochemistry 42:121−27

    doi: 10.1016/0031-9422(95)00865-9

    CrossRef   Google Scholar

    [8]

    Domitrović R, Jakovac H, Romić Ž, Rahelić D, Tadić Ž. 2010. Antifibrotic activity of Taraxacum officinale root in carbon tetrachloride-induced liver damage in mice. Journal of Ethnopharmacology 130:569−77

    doi: 10.1016/j.jep.2010.05.046

    CrossRef   Google Scholar

    [9]

    Yarnell E, Abascal K. 2009. Dandelion (Taraxacum officinale and T mongolicum). Integrative Medicine 8:35−38

    Google Scholar

    [10]

    Hu C. 2018. Taraxacum: Phytochemistry and health benefits. Chinese Herbal Medicines 10:353−61

    doi: 10.1016/j.chmed.2018.08.003

    CrossRef   Google Scholar

    [11]

    Jia XX, Li S, Han DP, Chen RP, Yao ZY, et al. 2022. Development and perspectives of rapid detection technology in food and environment. Critical Reviews in Food Science and Nutrition 62:4706−25

    doi: 10.1080/10408398.2021.1878101

    CrossRef   Google Scholar

    [12]

    Sainani KL. 2014. Introduction to principal components analysis. PM& R 6:275−78

    doi: 10.1016/j.pmrj.2014.02.001

    CrossRef   Google Scholar

    [13]

    Carrascal LM, Galván I, Gordo O. 2009. Partial least squares regression as an alternative to current regression methods used in ecology. Oikos 118:681−90

    doi: 10.1111/j.1600-0706.2008.16881.x

    CrossRef   Google Scholar

    [14]

    Abbas O, Zadravec M, Baeten V, Mikuš T, Lešić T, et al. 2018. Analytical methods used for the authentication of food of animal origin. Food Chemistry 246:6−17

    doi: 10.1016/j.foodchem.2017.11.007

    CrossRef   Google Scholar

    [15]

    Jamwal R, Amit, Kumari S, Sharma S, Kelly S, et al. 2021. Recent trends in the use of FTIR spectroscopy integrated with chemometrics for the detection of edible oil adulteration. Vibrational Spectroscopy 113:103222

    doi: 10.1016/j.vibspec.2021.103222

    CrossRef   Google Scholar

    [16]

    Måge I, Böcker U, Wubshet SG, Lindberg D, Afseth NK. 2021. Fourier-transform infrared (FTIR) fingerprinting for quality assessment of protein hydrolysates. LWT 152:112339

    doi: 10.1016/j.lwt.2021.112339

    CrossRef   Google Scholar

    [17]

    Sazonova S, Grube M, Shvirksts K, Galoburda R, Gramatina I. 2019. FTIR spectroscopy studies of high pressure-induced changes in pork macromolecular structure. Journal of Molecular Structure 1186:377−83

    doi: 10.1016/j.molstruc.2019.03.038

    CrossRef   Google Scholar

    [18]

    Vera M, Cruz S, Boleda MR, Mesa J, Martín-Alonso J, et al. 2017. Fluorescence spectroscopy and parallel factor analysis as a dissolved organic monitoring tool to assess treatment performance in drinking water trains. Science of The Total Environment 584-585:1212−20

    doi: 10.1016/j.scitotenv.2017.01.184

    CrossRef   Google Scholar

    [19]

    Bro R, Vidal M. 2011. EEMizer: Automated modeling of fluorescence EEM data. Chemometrics and Intelligent Laboratory Systems 106:86−92

    doi: 10.1016/j.chemolab.2010.06.005

    CrossRef   Google Scholar

    [20]

    He XS, Fan QD. 2016. Investigating the effect of landfill leachates on the characteristics of dissolved organic matter in groundwater using excitation–emission matrix fluorescence spectra coupled with fluorescence regional integration and self-organizing map. Environmental Science and Pollution Research 23:21229−37

    doi: 10.1007/s11356-016-7308-7

    CrossRef   Google Scholar

    [21]

    Callejón RM, Amigo JM, Pairo E, Garmón S, Ocaña JA, et al. 2012. Classification of Sherry vinegars by combining multidimensional fluorescence, parafac and different classification approaches. Talanta 88:456−62

    doi: 10.1016/j.talanta.2011.11.014

    CrossRef   Google Scholar

    [22]

    Pan Z, Li RH, Cui YY, Wu XJ, Zhang YY, et al. 2021. A simple and quick method to detect adulterated sesame oil using 3D fluorescence spectra. Spectrochimica Acta Part A:Molecular and Biomolecular Spectroscopy 245:118948

    doi: 10.1016/j.saa.2020.118948

    CrossRef   Google Scholar

    [23]

    Wu P, Ben T, Zou H, Chen Y. 2022. PARAFAC modeling of dandelion phenolic compound fluorescence relation to antioxidant properties. Journal of Food Measurement and Characterization 16:2811−19

    doi: 10.1007/s11694-022-01389-z

    CrossRef   Google Scholar

    [24]

    Mohsin GF, Schmitt FJ, Kanzler C, Hoehl A, Hornemann A. 2019. PCA-based identification and differentiation of FTIR data from model melanoidins with specific molecular compositions. Food Chemistry 281:106−13

    doi: 10.1016/j.foodchem.2018.12.054

    CrossRef   Google Scholar

    [25]

    Mooi E, Sarstedt M, Mooi-Reci I. 2018. Principal component and factor analysis. In Market Research: The Process, Data, and Methods Using Stata. Singapore: Springer. pp. 265−311. https://doi.org/10.1007/978-981-10-5218-7_8

    [26]

    Bro R. 1997. PARAFAC. Tutorial and applications. Chemometrics and Intelligent Laboratory Systems 38:149−71

    doi: 10.1016/S0169-7439(97)00032-4

    CrossRef   Google Scholar

    [27]

    Harshman RA, Lundy ME. 1994. PARAFAC: Parallel factor analysis. Computational Statistics & Data Analysis 18:39−72

    doi: 10.1016/0167-9473(94)90132-5

    CrossRef   Google Scholar

    [28]

    Durak T, Depciuch J. 2020. Effect of plant sample preparation and measuring methods on ATR-FTIR spectra results. Environmental and Experimental Botany 169:103915

    doi: 10.1016/j.envexpbot.2019.103915

    CrossRef   Google Scholar

    [29]

    Lever J, Krzywinski M, Altman N. 2017. Principal component analysis. Nature Methods 14:641−42

    doi: 10.1038/nmeth.4346

    CrossRef   Google Scholar

    [30]

    Murphy KR, Stedmon CA, Graeber D, Bro R. 2013. Fluorescence spectroscopy and multi-way techniques. PARAFAC. Analytical Methods 5:6557−66

    doi: 10.1039/c3ay41160e

    CrossRef   Google Scholar

    [31]

    Murphy KR, Stedmon CA, Wenig P, Bro R. 2014. OpenFluor - an online spectral library of auto-fluorescence by organic compounds in the environment. Analytical Methods 6:658−61

    doi: 10.1039/C3AY41935E

    CrossRef   Google Scholar

    [32]

    Walker SA, Amon RMW, Stedmon C, Duan S, Louchouarn P. 2009. The use of PARAFAC modeling to trace terrestrial dissolved organic matter and fingerprint water masses in coastal Canadian Arctic surface waters. Journal of Geophysical Research: Biogeosciences 114:G00F06

    doi: 10.1029/2009jg000990

    CrossRef   Google Scholar

  • Cite this article

    Li G, Zou H, Chen Y. 2023. Discrimination capacity analysis of FTIR-PCA and EEM-PARAFAC on dandelion tissues extracts. Food Innovation and Advances 2(4):247−254 doi: 10.48130/FIA-2023-0026
    Li G, Zou H, Chen Y. 2023. Discrimination capacity analysis of FTIR-PCA and EEM-PARAFAC on dandelion tissues extracts. Food Innovation and Advances 2(4):247−254 doi: 10.48130/FIA-2023-0026

Figures(6)

Article Metrics

Article views(2908) PDF downloads(460)

Other Articles By Authors

ARTICLE   Open Access    

Discrimination capacity analysis of FTIR-PCA and EEM-PARAFAC on dandelion tissues extracts

Food Innovation and Advances  2 2023, 2(4): 247−254  |  Cite this article

Abstract: Dandelion root contains triterpenoids, polyphenols and flavonoids, dandelion leaf is rich in polyphenols, flavonoids, flavonoids glycosides, and dandelion flower mainly contains flavonoids, among other substances. These different substance content leads to specific benefits and function effects of each part. Fourier transform infrared spectroscopy, three-dimensional fluorescence spectroscopy and related multivariate statistical methods are widely used to determine sample characteristics, but limited research focuses on the substance difference and characteristics in dandelion tissues. In this paper, Fourier transform infrared spectra-principal component analysis and three-dimensional fluorescence spectroscopy-parallel factor analysis were conveyed to analyze dandelion stem, leaf, root and flower tissue extracts, for determining the substance species and content difference among dandelion tissues and evaluating the discrimination capacity of these analysis methods. The Fourier transform infrared spectroscopy of root was distinct from others, and the two principal component models could distinguish dandelion stem and flower, but failed to differentiate leaf and root; while the excitation and emission matrix showed that stem and flower, leaf and root had similar intensity band distribution but different fluorescence intensity, and the parallel factor analysis results proved that one- and three-component models cannot differentiate the tissues of stem and flower, leaf and root, since the fluorescent compounds (polyphenol, flavonoid etc.) structure and content were similar in different tissues. These results indicated that Fourier transform infrared-principal component analysis might be a useful method when various fluorescent compounds exist.

    • Dandelion is a perennial herb of compositae family, native to Europe and widely grown in temperate regions of the northern hemisphere[1]. In Chinese traditional medicine books, its effects of dispelling wind-heat, detoxification and detumescence, diuresis, defecation, jaundice, liver and gallbladder detoxification ability are comprehensively described in detail, and as a medicinal plant, it has anti-inflammatory, anti-oxidation, anti-tumor, antibacterial, hypoglycemic, liver and gallbladder, regulation of gastrointestinal microecology and other therapeutic effects[24], so it has been widely investigated as an ingredient in the health care industry for various foods.

      Dandelion is rich in a variety of bioactive substances, including polyphenols (trans-p-hydroxyphenylpropofol, trans-p-hydroxyphenylacrolein, p-hydroxybenzoic acid, p-hydroxyphenylpropionic acid, protocatechualdehyde), flavonoids (rutin and quercetin), polysaccharides and triterpenoids, etc. Moreover, the types and content distribution of functional components in different tissues are different[5], leading to different roles. According to the existing research results, dandelion leaves are rich in caffeic acid, coumarin, chlorogenic acid, flavonoid glycosides, and chicoric acid; dandelion roots contain triterpenoids, chlorogenic acid, caffeic acid, rutin, and vanillic acid; dandelion flowers are rich in flavonoids, free luteolin, chelonethylene glycol, and chrysol[68]. It is widely believed that dandelion leaves can be used as a gallbladder, diuretic, and bitter digestive irritant, while the root is also used as an alternative to help relieve skin diseases, treat digestive disorders, increase bile flow, and can promote appetite[9,10]. Considering the differences in the types and distribution of compounds, a more effective way of dandelion utilization is to divide the whole plant into different parts for individual bioactivity compound extraction and specific beneficial effects evaluation. The results of compound identification and differentiation in dandelion tissue using different spectral techniques and multivariate statistical techniques have not yet been systematically studied.

      Spectroscopic techniques used for compound identification mainly include infrared spectroscopy (different chemical functional groups absorb different frequencies of infrared light, the optical technology can detect the vibration and rotation of molecular bonds, and can be used for chemical fingerprint identification, chemical imaging and chemical structure analysis) and fluorescence spectrum (each organic compounds has a separate maximum emission / excitation wavelength at different wavelengths, parallel factor analysis (PARAFAC) was used to process the excitation-emission matrices (EEMs) and determine the characteristics of samples)[11].

      Fourier transform infrared spectroscopy (FTIR) is a vibration spectroscopy technology based on the mathematical processing of Fourier transform, which has been widely used in food quality control, food structure and function research due to its characteristics of high speed, high accuracy and resolution. Studies have shown that FTIR spectrum combined with a variety of analysis methods, such as principal component analysis (PCA, a statistical technique to reduce the dimension of data, can use less dimensions to describe the change of data, but still contains most information[12]) and partial least squares regression (PLS-R, a multiple linear regression analysis, reduce the raw data to less and maximizing the explained variance to detect the relationship between predictor and response variables[13]). It can accurately and rapidly predict edible oil adulteration, distinguish coffee bean samples from different origins, detect meat and meat product adulteration, monitor biochemical, microbial spoilage and shelf life, and determine protein and lipid structure changes[1417].

      Three-dimensional fluorescence spectrum (known as excitation-emission matrix) could quickly determine the fluorescence intensity of a substance in different excitation wavelength and emission wavelength ranges, and mixtures can be directly detected and distinguished by the different fluorophores structures of each compound and the corresponding three-dimensional fluorescence spectral information[18]. Parallel factor analysis is an efficient method to decompose fluorescence excitation-emission matrices into their underlying chemical components, this analysis method can lead to the mathematical identification and quantification of independently varying fluorophores (individual component with fluorescent group) from the complex, obtain excitation and emission spectra and their corresponding concentration or content[19]. Three-dimensional fluorescence spectroscopy combined with parallel factor analysis has the advantages of high sensitivity, good selection performance and no damage to samples, and has been widely used in the detection and identification of chemical components in vinegar, wine and other foods as well as water quality assessment[2022].

      Without sample pretreatment and chromatographic conditions optimization, or time-consuming mass spectrum processing and compound identification, the Fourier transform infrared spectroscopy and three-dimensional fluorescence spectrum combined with corresponding analytical methods have been widely used in the extraction and classification of plant species, tissues and functional compounds. The spectroscopy technologies have been used by thousands of researchers for commercial or academic purposes, but their application scope and analysis results have not yet been systematically analyzed, which also limits the mining and comparison of spectral data and hinders the correct technical selection. In this paper, dandelion roots, stems, flowers and leaves were obtained and prepared for water extraction preparation, the FTIR spectroscopy combined with PCA analysis, and three-dimensional fluorescence spectroscopy combined with PARAFAC analysis were used to establish corresponding models to identify the extracts of dandelion tissues, so as to compare the classification results of different tissues (roots, stems, flowers and leaves) of dandelion. Based on the research of substance species and content distribution in dandelion tissues, this paper tried to fill the gap between molecular spectroscopy discrimination results and substance differences, without comparing individual compound contents in each tissue. In addition, the discrimination capacity difference between Fourier transform infrared spectroscopy and three-dimensional fluorescence spectrum were discussed, and the internal relationships between molecular bond vibrations and rotations spectrum and fluorescent compounds structure and content contour were also investigated. In summary, this paper aims to compare the Fourier transform infrared spectroscopy and fluorescence spectroscopy analysis results systematically.

    • Dried dandelion plant was purchased from a local pharmacy, and stored in sealed light resistant packaging at 4 °C before use. Formic acid, deuterium oxide for infrared spectrum and three-dimensional fluorescence spectrum were of chromatographic grade and obtained from Shanghai Maclin Biochemical Co., Ltd. (Shanghai, China). Deionized water used to prepare solutions was 18 MΩ and purified using an ultra-pure water system.

    • Different dandelion tissue extracts were prepared according to previous research literature[23]. The roots, stems, flowers and leaves of the whole dried dandelion were cut out and oven-dried separately at 60 °C until the dry weight was constant. The same tissues from different plants were milled, and the resulting particles were mixed and screened using a 60-mesh sieve. Six grams of root, stem, flower and leaf powder was mixed with 60 mL of 1‰ formic acid water solution separately, and vortexed at 20 °C for 2 h. After centrifugation at 8,000 r/min for 15 min, the supernatants of different dandelion tissues were taken and filtered through a 0.22 μm nylon filter to yield the crude extract, and all the processed extracts were stored at 4 °C in the dark.

    • The obtained tissue extracts were freeze-dried, 0.4 g of the samples were dissolved in 5 mL of deuterium oxide, then filtered with a needle filter of 0.22 μm before testing. About 3 mL of liquid was placed in a diamond ATR module, and the FTIR spectrum was collected by Bruker Tensor 27 Fourier Infrared spectrometer. Instrument parameters were set as follows: the wavelength range was 4,000−400 cm−1, with a spectrum resolution of 1 cm−1, the scan number was set as 32, the temperature was 25 °C, and the spectrum of deuterium oxide was used as the blank sample[15, 16].

    • The principal component analysis was performed in the window between 3,900 and 400 cm−1. Baseline were first corrected for all samples, then the spectra were normalized (all spectra were centered on the mean, and the mean absorbance was calculated and then subtracted from the spectrum. The FTIR spectra were scaled to make the sum squared deviation over the indicated wavelengths equal one.) and smoothed with polynomial 2nd order using the Savitzky-Golay-algorithm[24]. Then the covariance matrix of normalized spectra was computed to identify the variables with respect to others. The eigenvectors and eigenvalues of the covariance matrix were calculated and ordered by eigenvectors values in descending order, to determine the proper principal components in order of significance. Recast the data along the axes of principal components using the eigenvectors of the covariance matrix, which could be done by multiplying the transpose of the original data set[25].

      PCA was used to decompose the data matrix, and covariance data matrices were used to calculate the principal components (PCs). The principal components of PC1 to PC3, and their corresponding PC loadings were calculated. The PCA analysis was conveyed by the additional automatic application following the above steps, and the results were illustrated using the software of Origin 9.0 (Origin Lab, Northampton, USA).

    • The processed extracts of root, stem, flower and leaf obtained from whole dried dandelion were diluted 20 times to obtain the tested liquid for three-dimensional fluorescence spectrum measurement. The fluorescence analysis was performed using the PerkinElmerLS55 system with 1 cm quartz colorimeter, the device was validated with deionized water, the Raman and Rayleigh peaks were measured and used to correct the original spectrum. Then the tested extracts of different tissues were placed at the excitation wavelength of 200−400 nm and the emission wavelength of 220−600 nm to obtain the three-dimensional fluorescence spectrum. The excitation interval was set at 10 nm, the voltage was set as 700 V, and the excitation and emission slit width were both 20 nm.

    • Parallel factor analysis statistically decomposes the three-dimensional fluorescence spectrum into individual fluorescence components and a residual matrix. The individual fluorescence components are directly proportional to the component concentration in the sample and could be converted into actual concentration when the excitation and emission of each component are known[19, 26].

      xijk=Fn=1ainbjnckn+εijk

      where, xijk is the fluorescence intensity of the ith dandelion extraction at the kth excitation and jth emission wavelength, ain is directly proportional to the concentration of the nth fluorophore in the ith sample, bjn and ckn are estimates of emission and excitation spectra of nth fluorophore at wavelength j and k. F is the number of components, and εijk is the residual matrix.

      In this paper, the PARAFAC analysis was conveyed using the N-way program[26] following the steps of blank spectrum subtracting, outliers removed, limiting the Raman scattering, data normalization, and parallel factor analysis model establishing using the inner automatic functions. After subtracting deuterium oxide spectrum manually, and loading the total three-dimensional fluorescence spectrum containing 379 × 21 intensity readings, the program first eliminated Rayleigh and Raman scattering peaks of each scan centered on the respective scattering peak by excising portions (10 and 20 nm at each excitation wavelength). The PARAFAC model was then established with default PARAFAC constraints, no negative values in concentration, emission and excitation wavelength were applied to process the data. The PARAFAC model was tested from one to five component by means of fitting values, core consistency, and split-half quality calculation. Samples with high leverage (the elements on the diagonal of the hat matrix of the score matrix) or high sum-squared residual were removed until no samples were assessed as outliers by default set, and the PARAFAC model of proper component number was identified.

    • All the tissue extracts of dandelion root, stem, flower and leaf for FTIR, and three-dimensional fluorescence spectrum acquisition were repeated three times, and the data were expressed as mean ± standard deviation. The PCA analysis was carried out using the additional application in the software of Origin 9.0, and the PARAFAC analysis was conveyed by the N-ways program.

    • The Fourier transform infrared (FTIR) spectroscopy of dandelion tissues extracts of root, stem, flower and leaf were measured respectively, and their absorbance spectrum was recorded. As shown in Fig. 1, the FTIR of dandelion stem, flower and leaf have the same peak location wavelength and similar fingerprint, the dandelion root had two distinct peak wavelengths between 2,500−1,750 cm−1 and 3,500−2,750 cm−1. The absorbance spectrum indicated that stem, flower and leaf might have the same compounds with different content, while the substances in root extracts were different.
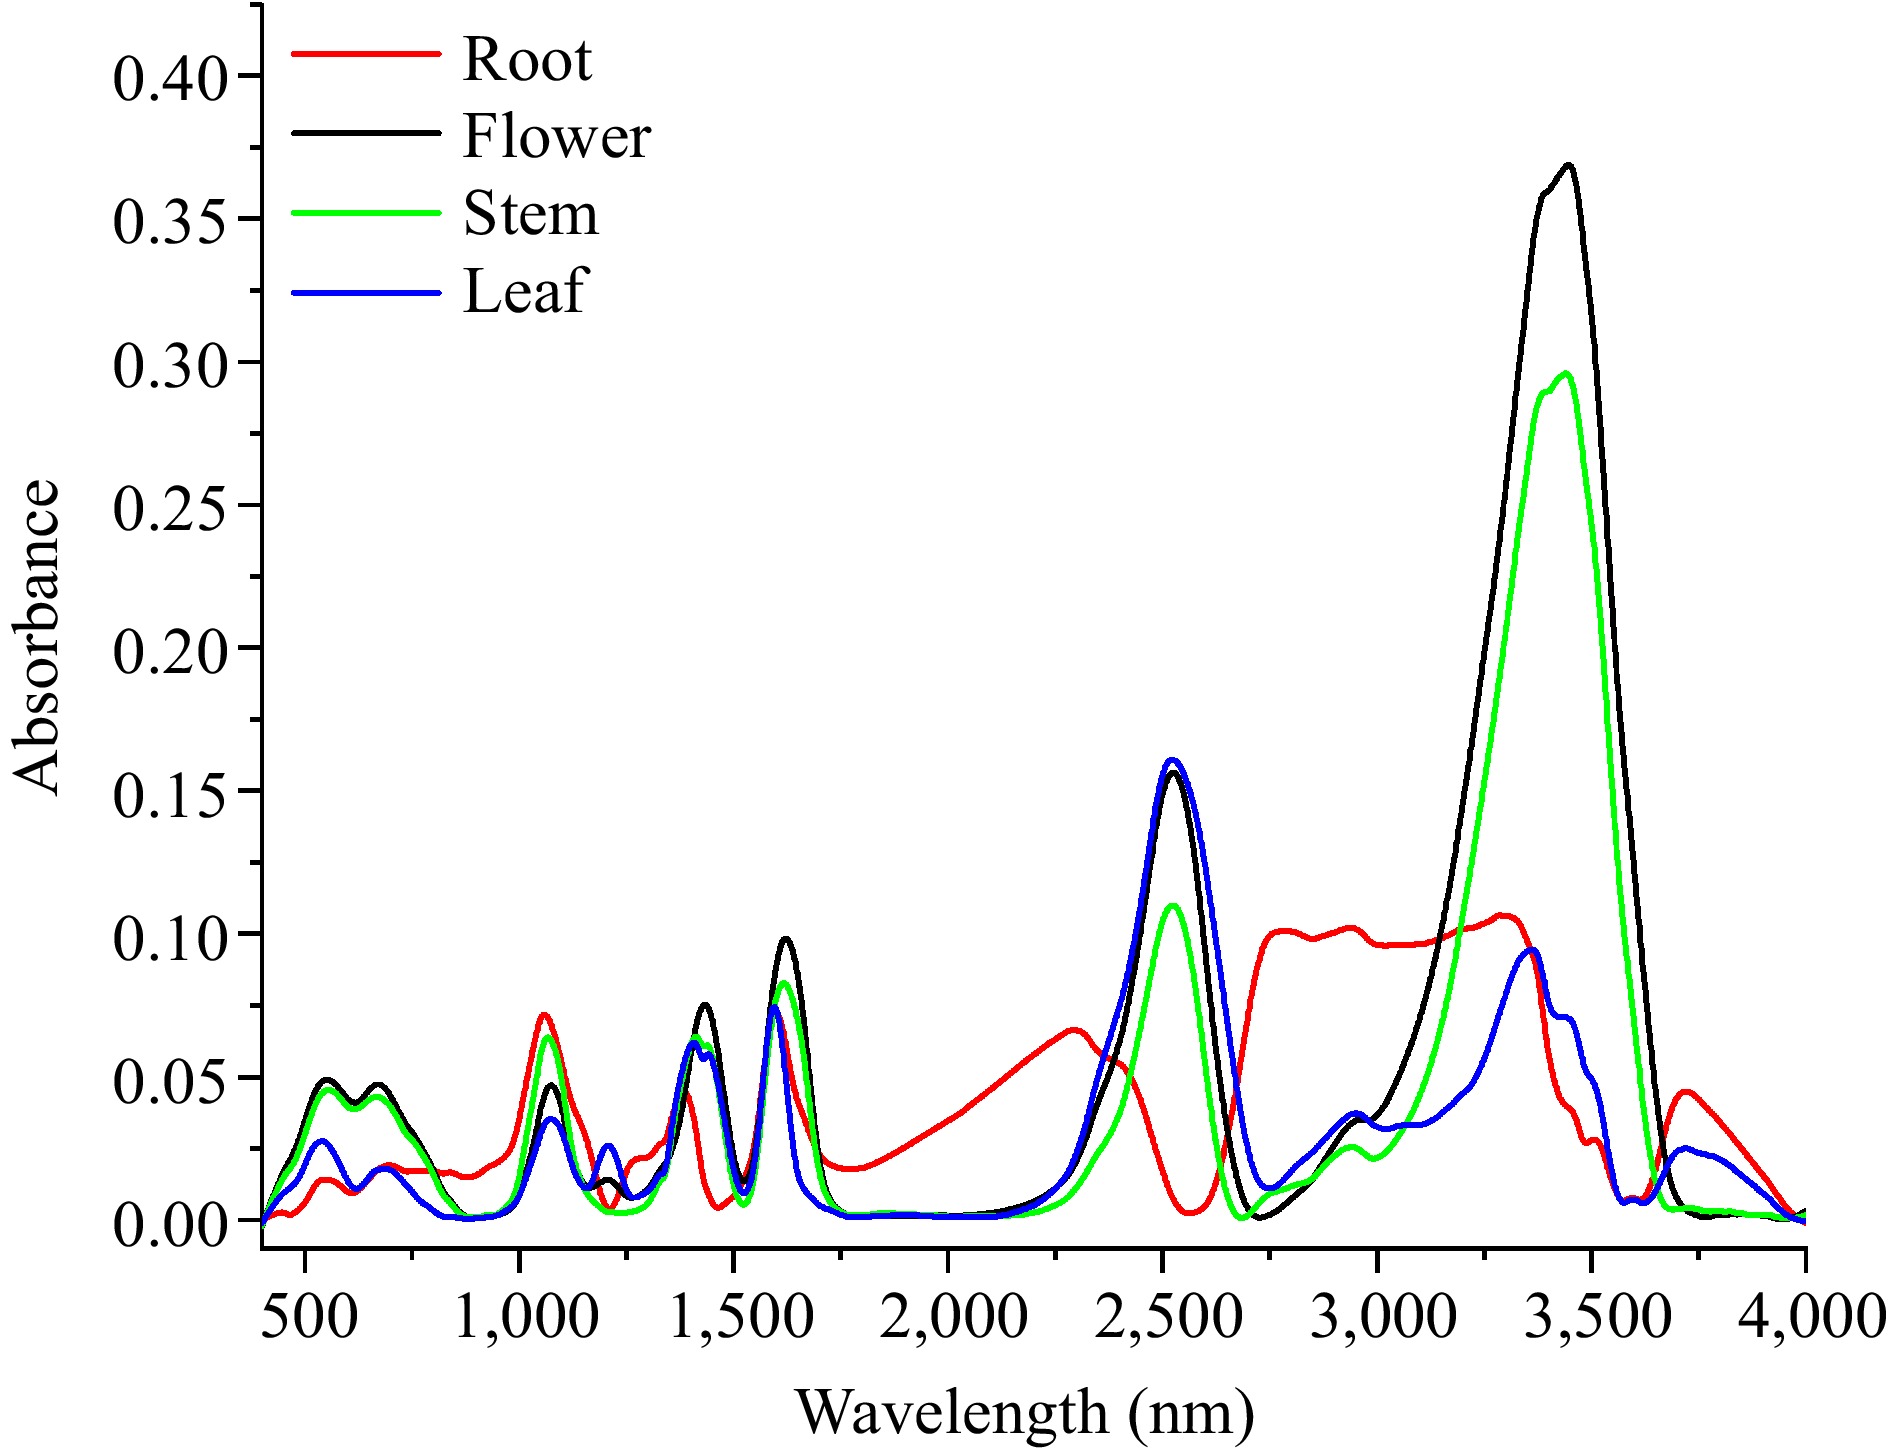
      Figure 1. 

      Fourier transform infrared spectroscopy of dandelion tissue extracts.

      Since the differences in absorbance spectra are due to compound species and contents of compounds in different tissues, the identification efficiency was evaluated by principal component analysis (PCA). As shown in Fig. 2, two main components of PC1 (factor 1, 59%) and PC2 (factor 2, 38%) were extracted according to the above steps in the method section with the cumulative variance contribution rate of 97%, which indicated that the two-component model could explain the total 97% of the absorbance spectroscopy difference determined by the dandelion tissues, and could be used to distinguish the test dandelion tissues. Although obvious difference existed between the three repeated experiments of stem, flower and leaf tissue extracts, the PCA maps showed the Fourier transform infrared spectroscopy characteristics of dandelion tissues. Dandelion leaf, represented by green points, accounted for the comparatively higher values in PC1 and PC2 dimensions, ranging from 0.5 to 0.8 and −0.2 to 0 respectively; the dandelion stems (marked as blue points) values varied in the moderate range, which changed in the range of −0.1 to 0.3 in the PC1 axis and −0.4 to −0.1 in the PC2 axis. For the dandelion flowers in the red group, its values were of the comparatively lower range, showing a narrow area in the PC1 coordinate (−0.2 to 0) and a large area in the PC2 coordinate (−0.3 to −0.6). The dandelion root (black points) group showed a different tendency compared to the other tissues, with a smaller repeat difference and high values in both PC1 and PC2. According to the PCA analysis results, dandelion tissue extract could be divided into three groups, dandelion root group and dandelion leaf were not well disguised from each other.
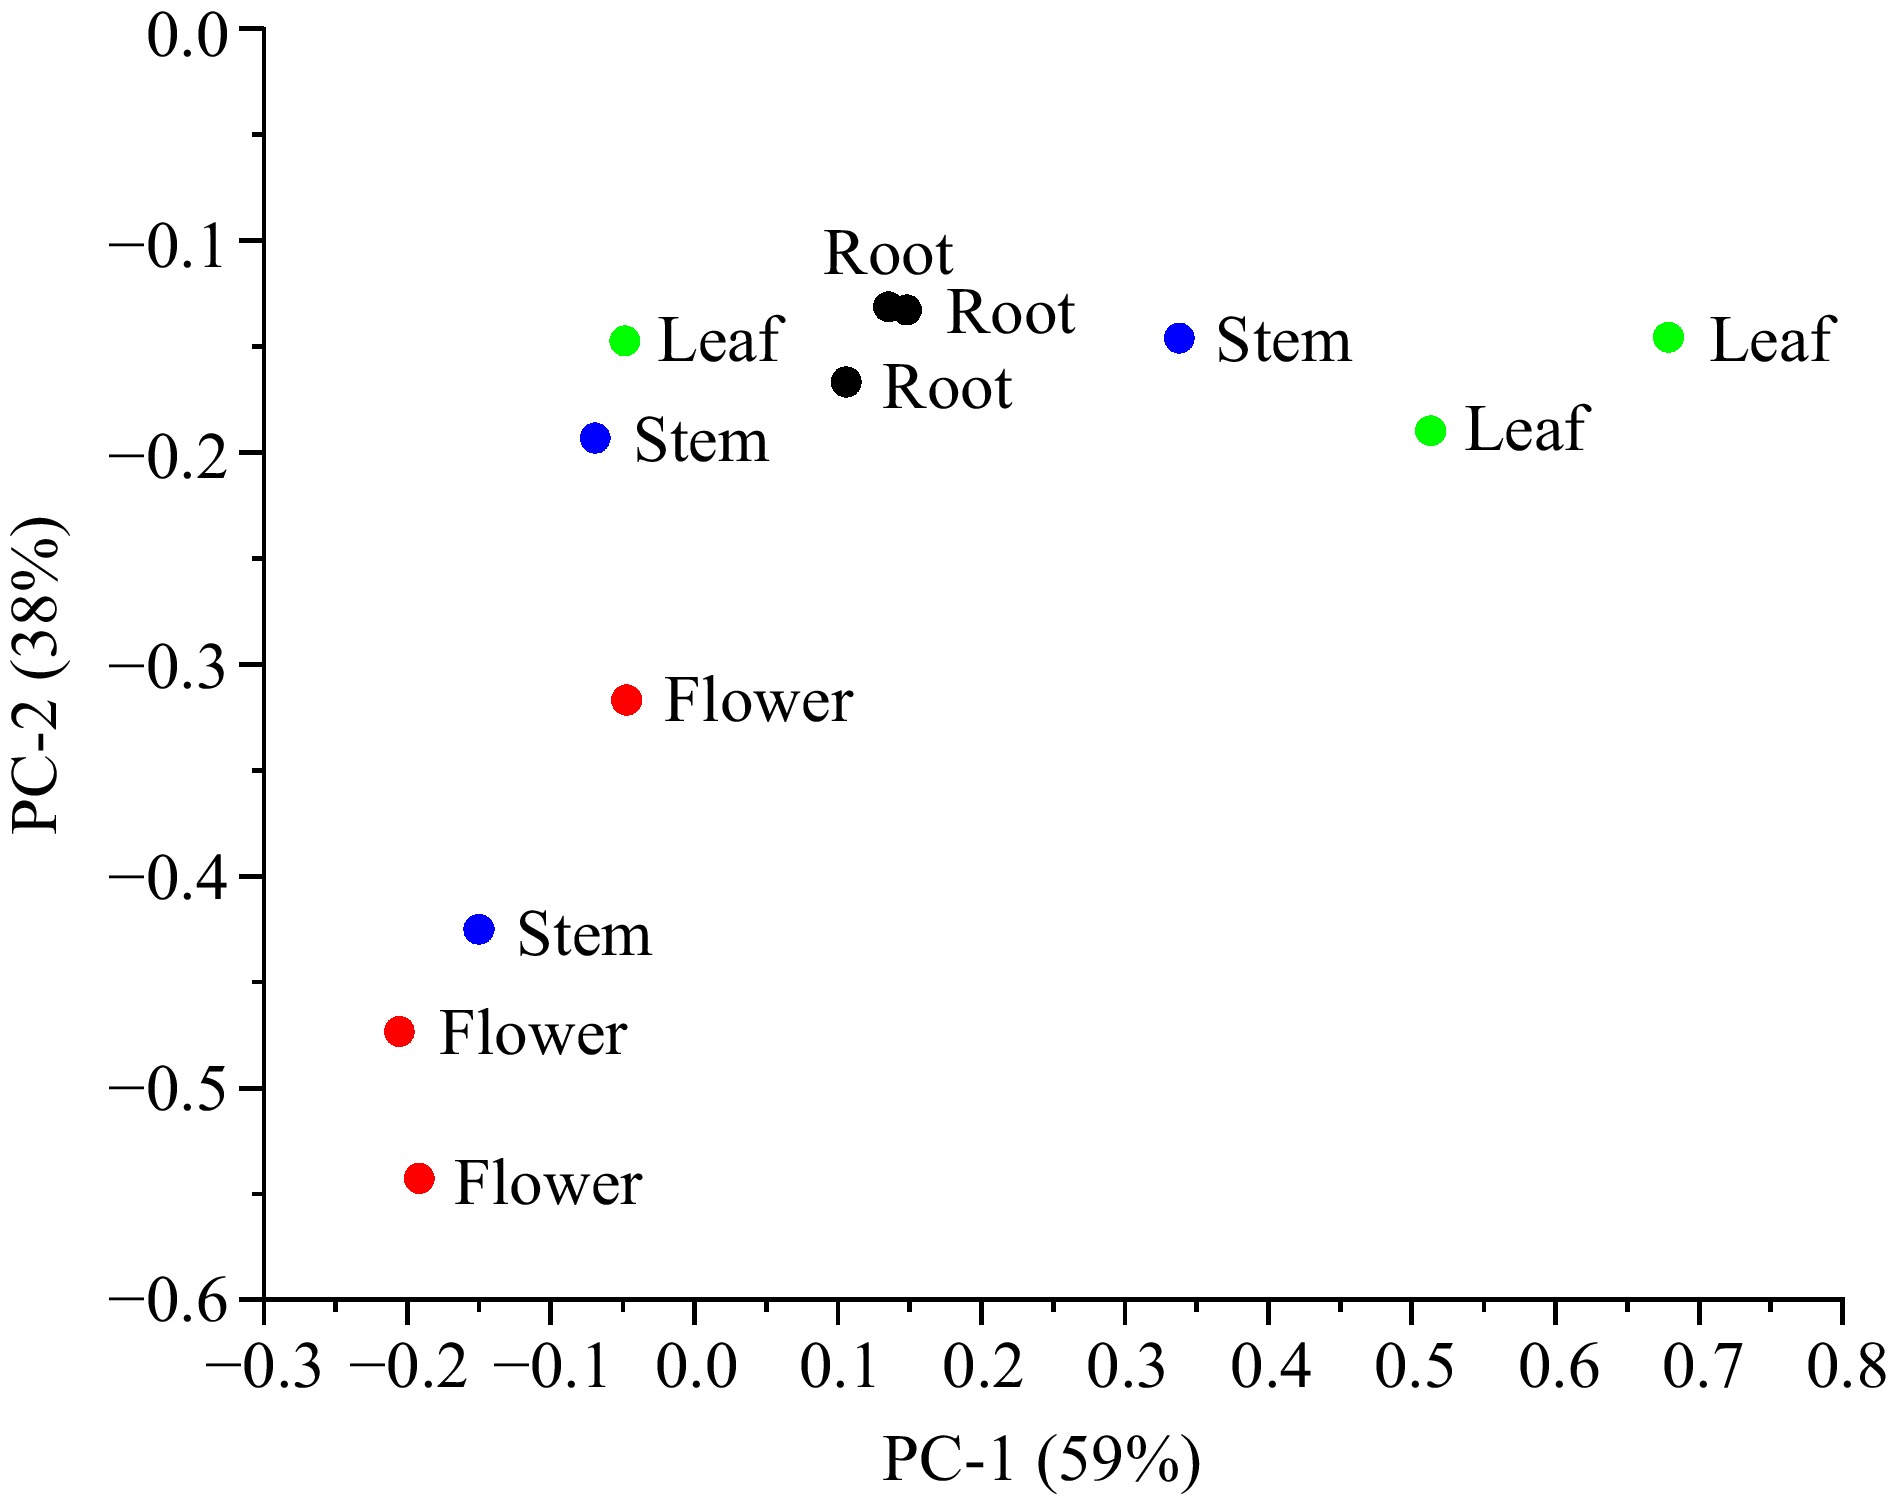
      Figure 2. 

      Score cluster plot with top two principal components (PCs) for different dandelion tissues.

    • Different dandelion tissue extracts were scanned to obtain raw three-dimensional fluorescence spectra (excitation-emission matrices, EEMs) in the excitation range of 200−400 nm and the emission range of 220−600 nm. As shown in Fig. 3, where a, b, c, and d correspond to the spectrum of dandelion root, flower, stem, and leaf extracts respectively. The fluorescence spectra of dandelion tissue extracts showed different fluorescence fingerprints with one or two relatively intense bands, the fluorescence spectra of dandelion root and leaf had one strong band and maximum excitation / emission wavelengths of about 260 nm / 370 nm with obvious intensity difference, while the dandelion stem and flower fluorescence spectrum had two intense bands at 220 nm / 370 nm and 260 nm / 370 nm, and the excitation wavelength at 220 nm had higher fluorescence intensity compared to the ones at 260 nm. In addition, the fluorescence intensity of all the tissues had a fluorescent band around 260 nm / 370 nm, and the obtained three-dimensional fluorescence spectrum could be divided into two distinct groups with different intensity bond distribution and fluorescence intensity.

      Figure 3. 

      Three-dimensional fluorescence spectra of dandelion tissue extracts. (a) Root, (b) flower, (c) stem, (d) leaf).

    • The PARAFAC model was established from component number 1-5 after removing Rayleigh and Raman scattering from the original fluorescence spectra. In order to determine appropriate component numbers, the residual sum of the square, core consistence and interaction number were compared and evaluated. As shown in Fig. 4, the residual sum of the squares decreased as more components were selected. The core consistency analysis of the model reaches 100 at the first component and decreased in the second, third, fourth, and fifth component models, while the interaction number remained at the lowest level at one- component model, followed by the second and third component models. Considering all the test indicators, one and three component models were identified for the fluorescence dataset based on the higher residual sum of the square and lower interaction number. The core consistence retained some variability, while the four and five component models were rejected due to their lower residual sum of square and higher interaction number. Although one and three components were selected to model, it does not indicate that only one or three types of fluorophores were present in these extracts[27].
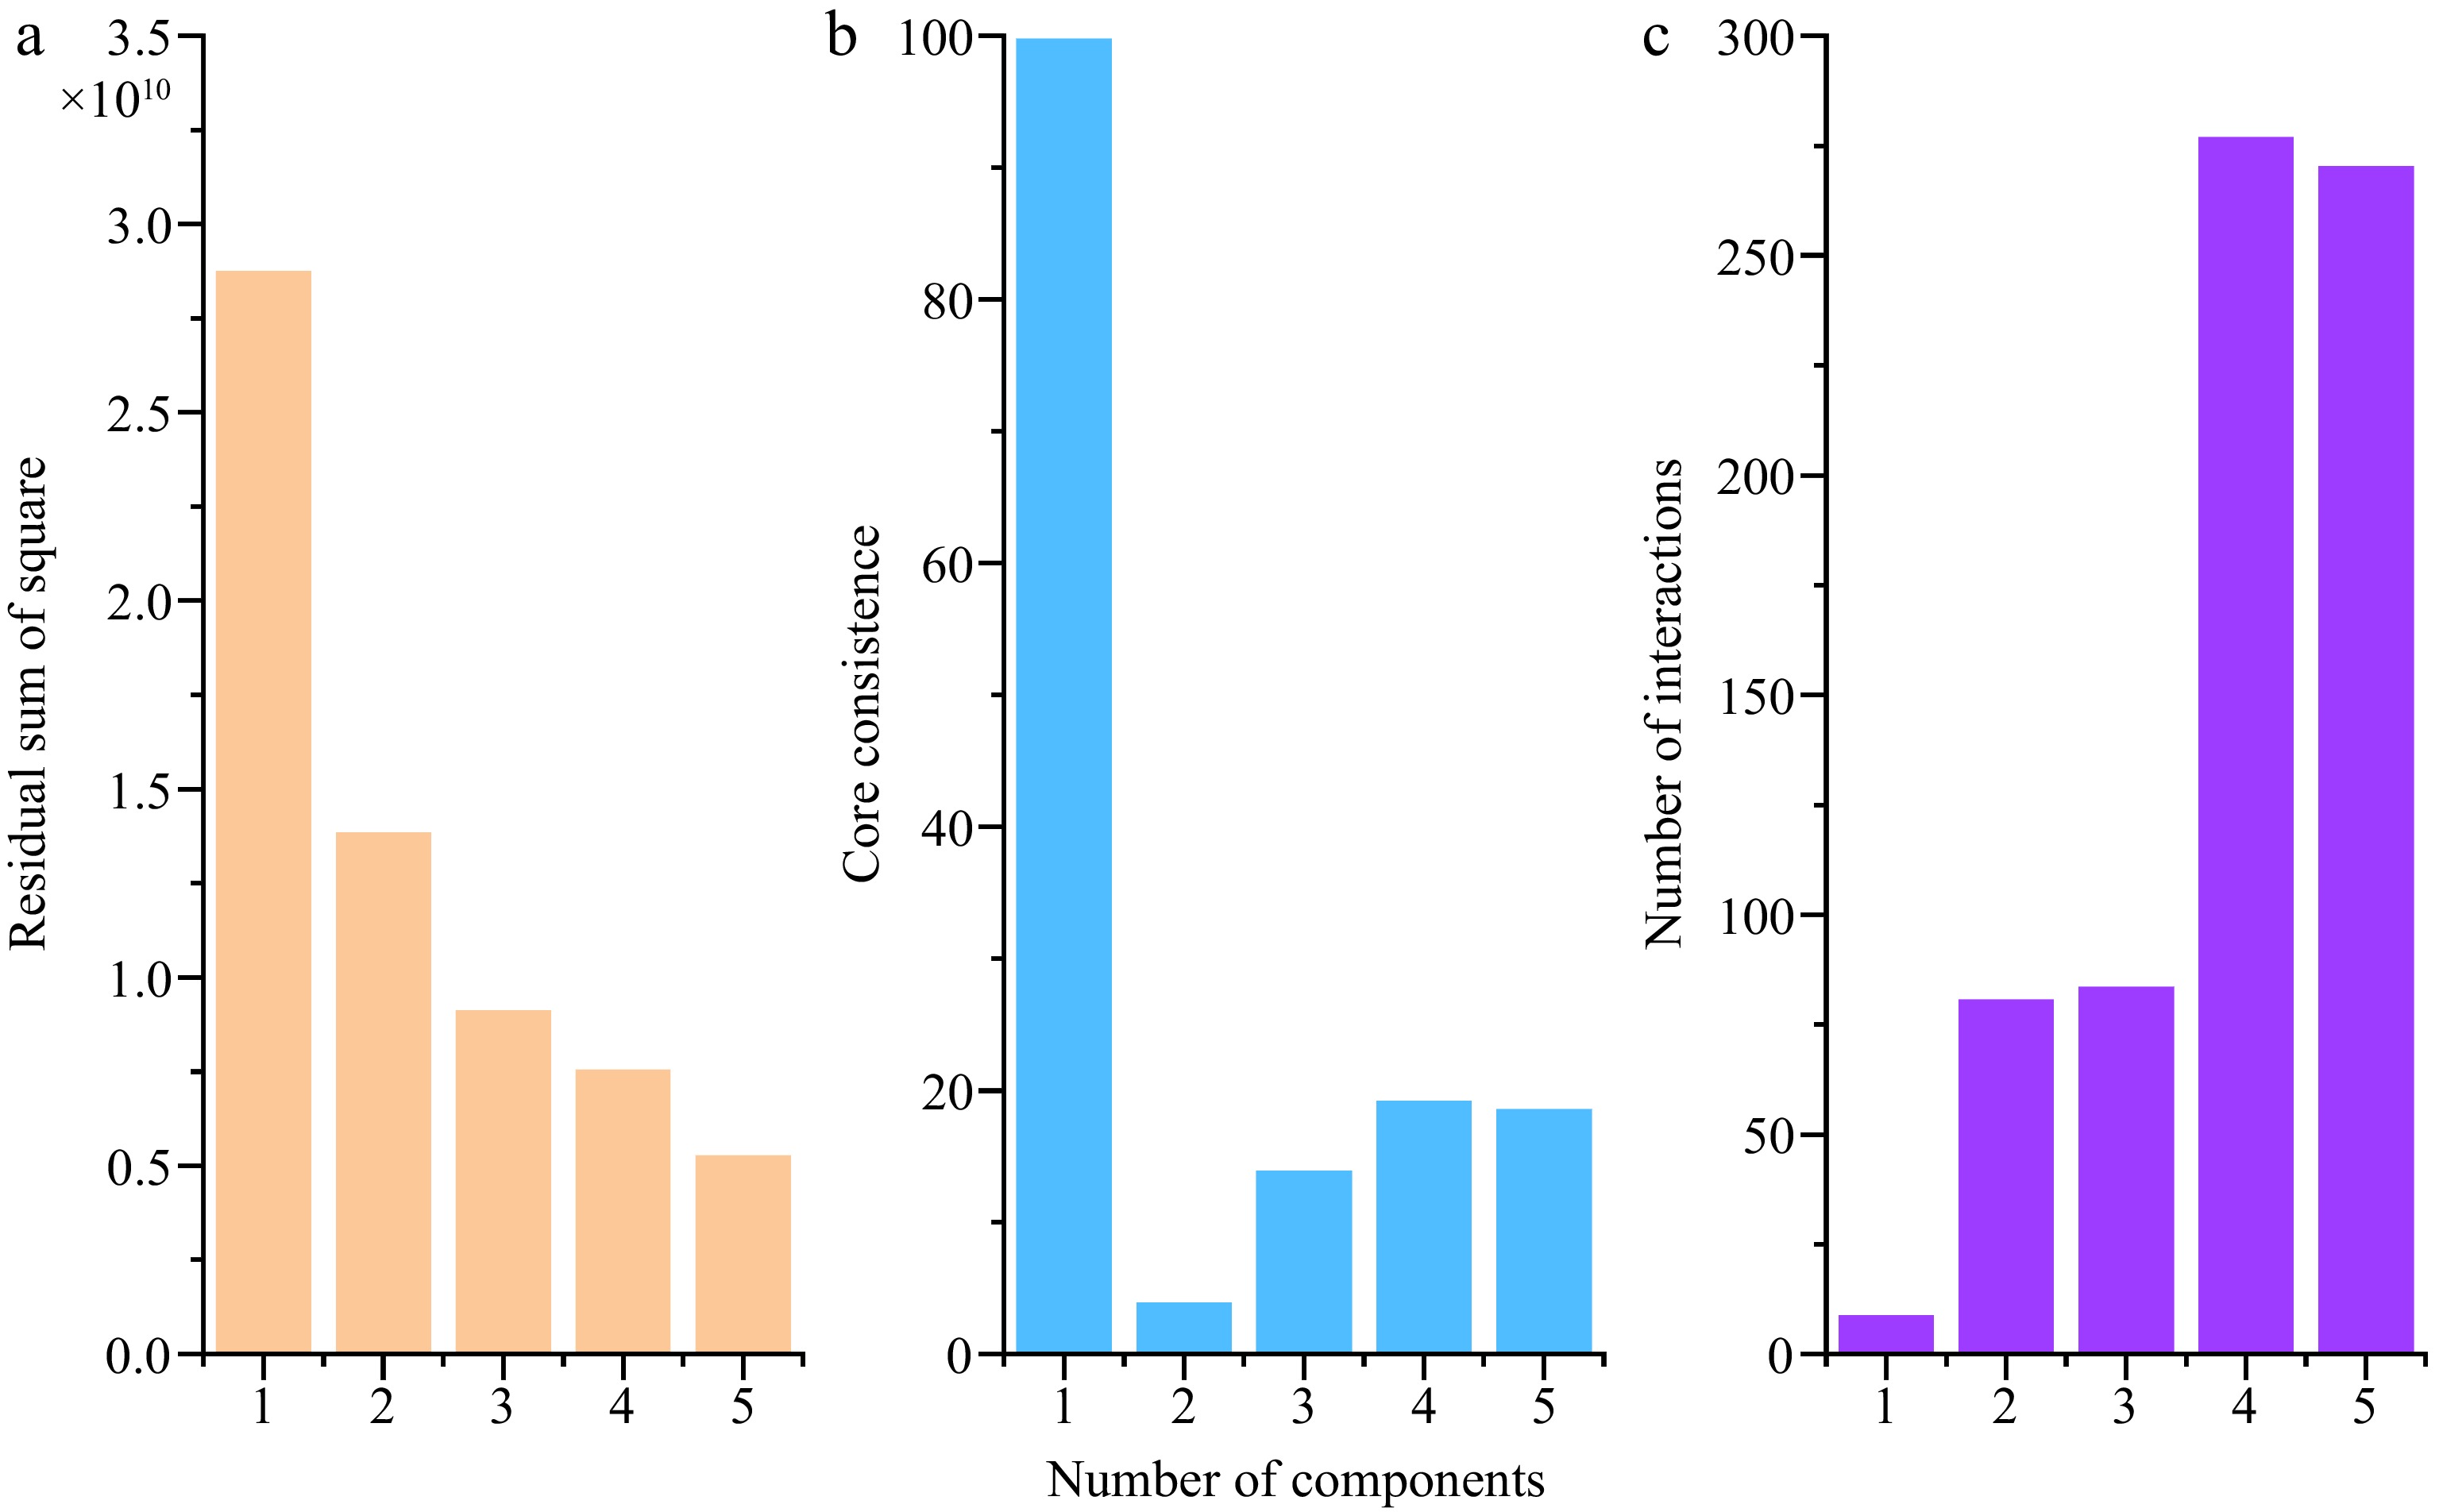
      Figure 4. 

      Analysis diagram of the parallel factor model. (a) Square residual, (b) core consistence, (c) interaction number.

      Figure 5 showed the excitation and emission spectrum and calculated concentrations determined by the one component PARAFAC model. The maximum excitation wavelength of the first component was about 260 nm, and the maximum emission wavelength was about 370 nm, and the obtained concentration of dandelion flower extract was the highest, followed by tissues of stem, leaf and root. In addition, the obtained concentration of dandelion flower and stem, root and leaf overlapped with each other, this result indicated that one-component model cannot distinguish tissues of flower and leaf tissue, as well as root and leaf. Then the three-component model was established and shown in Fig. 6. The first component represented by the black line had a maximum excitation wavelength at about 260 nm and a maximum emission wavelength at about 370 nm, which were the same as the one component model, the second component marked with the red line had a maximum excitation wavelength at about 270 nm and a maximum emission wavelength at about 370 nm, while the third component of the blue line had a maximum excitation wavelength at about 230 nm and a maximum emission wavelength at about 350 nm. The concentration distribution was the same as the component one model, for the stem tissue had the highest concentration, followed by tissues of flower, leaf, and root respectively. While the second component had the opposite tendency, the concentrations of root and leaf were higher compared to the flower and stem, and the concentration distribution of the third component was the same as the first, where the flower and stem concentration had a higher value, than root and leaf.
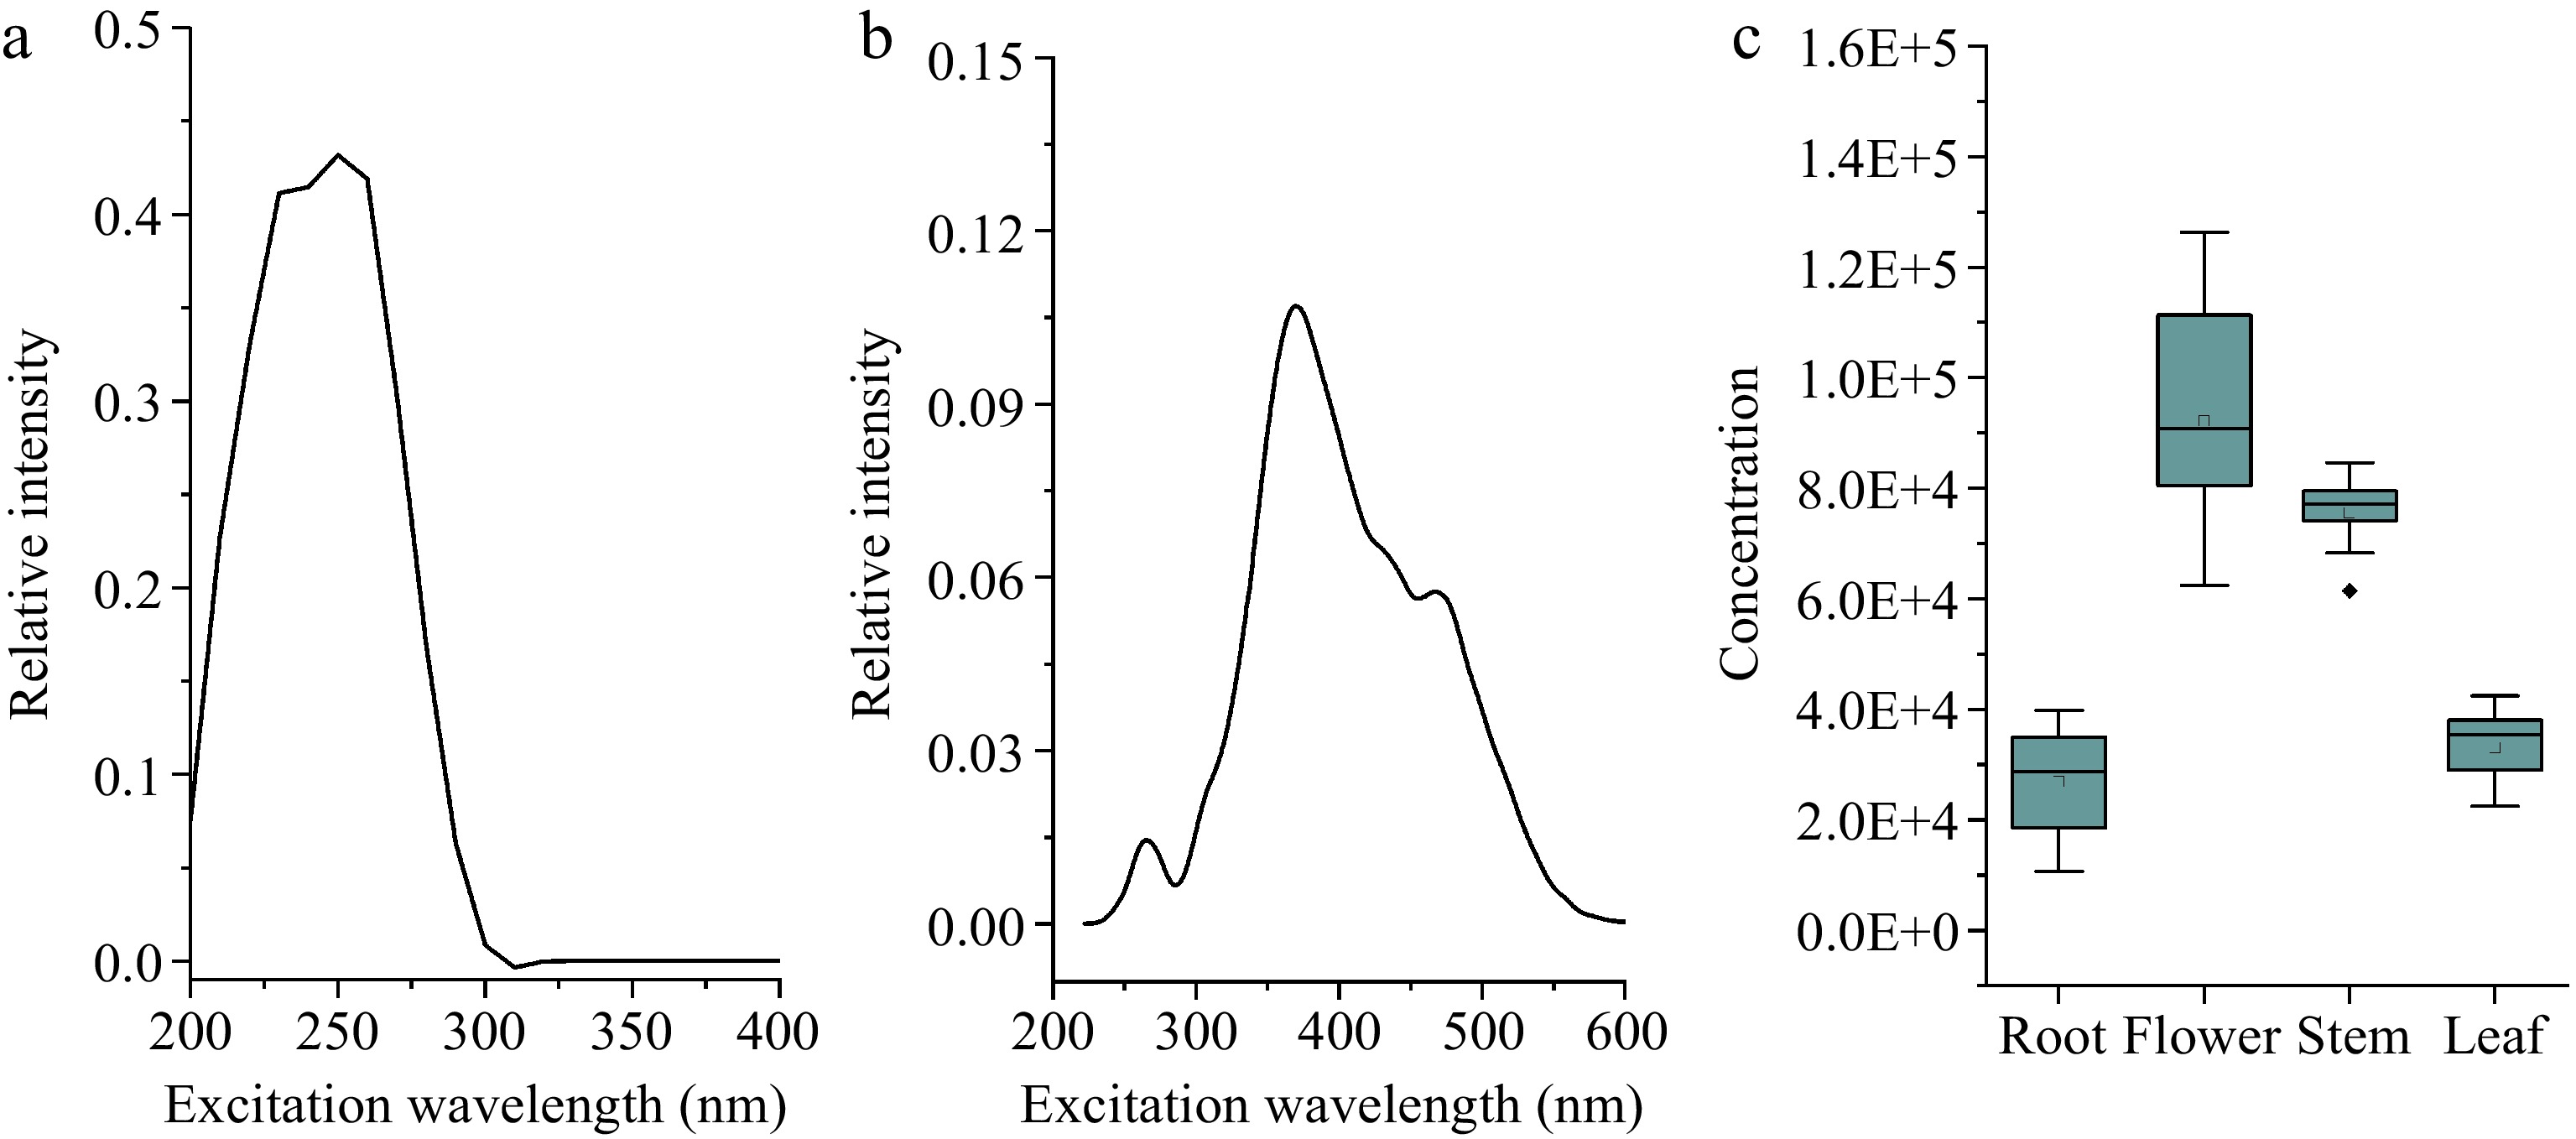
      Figure 5. 

      Results of one component PARAFAC model of dandelion tissue extracts. (a) Excitation specta, (b) emission spectra, (c) relative concentration of dandelion tissue extract.
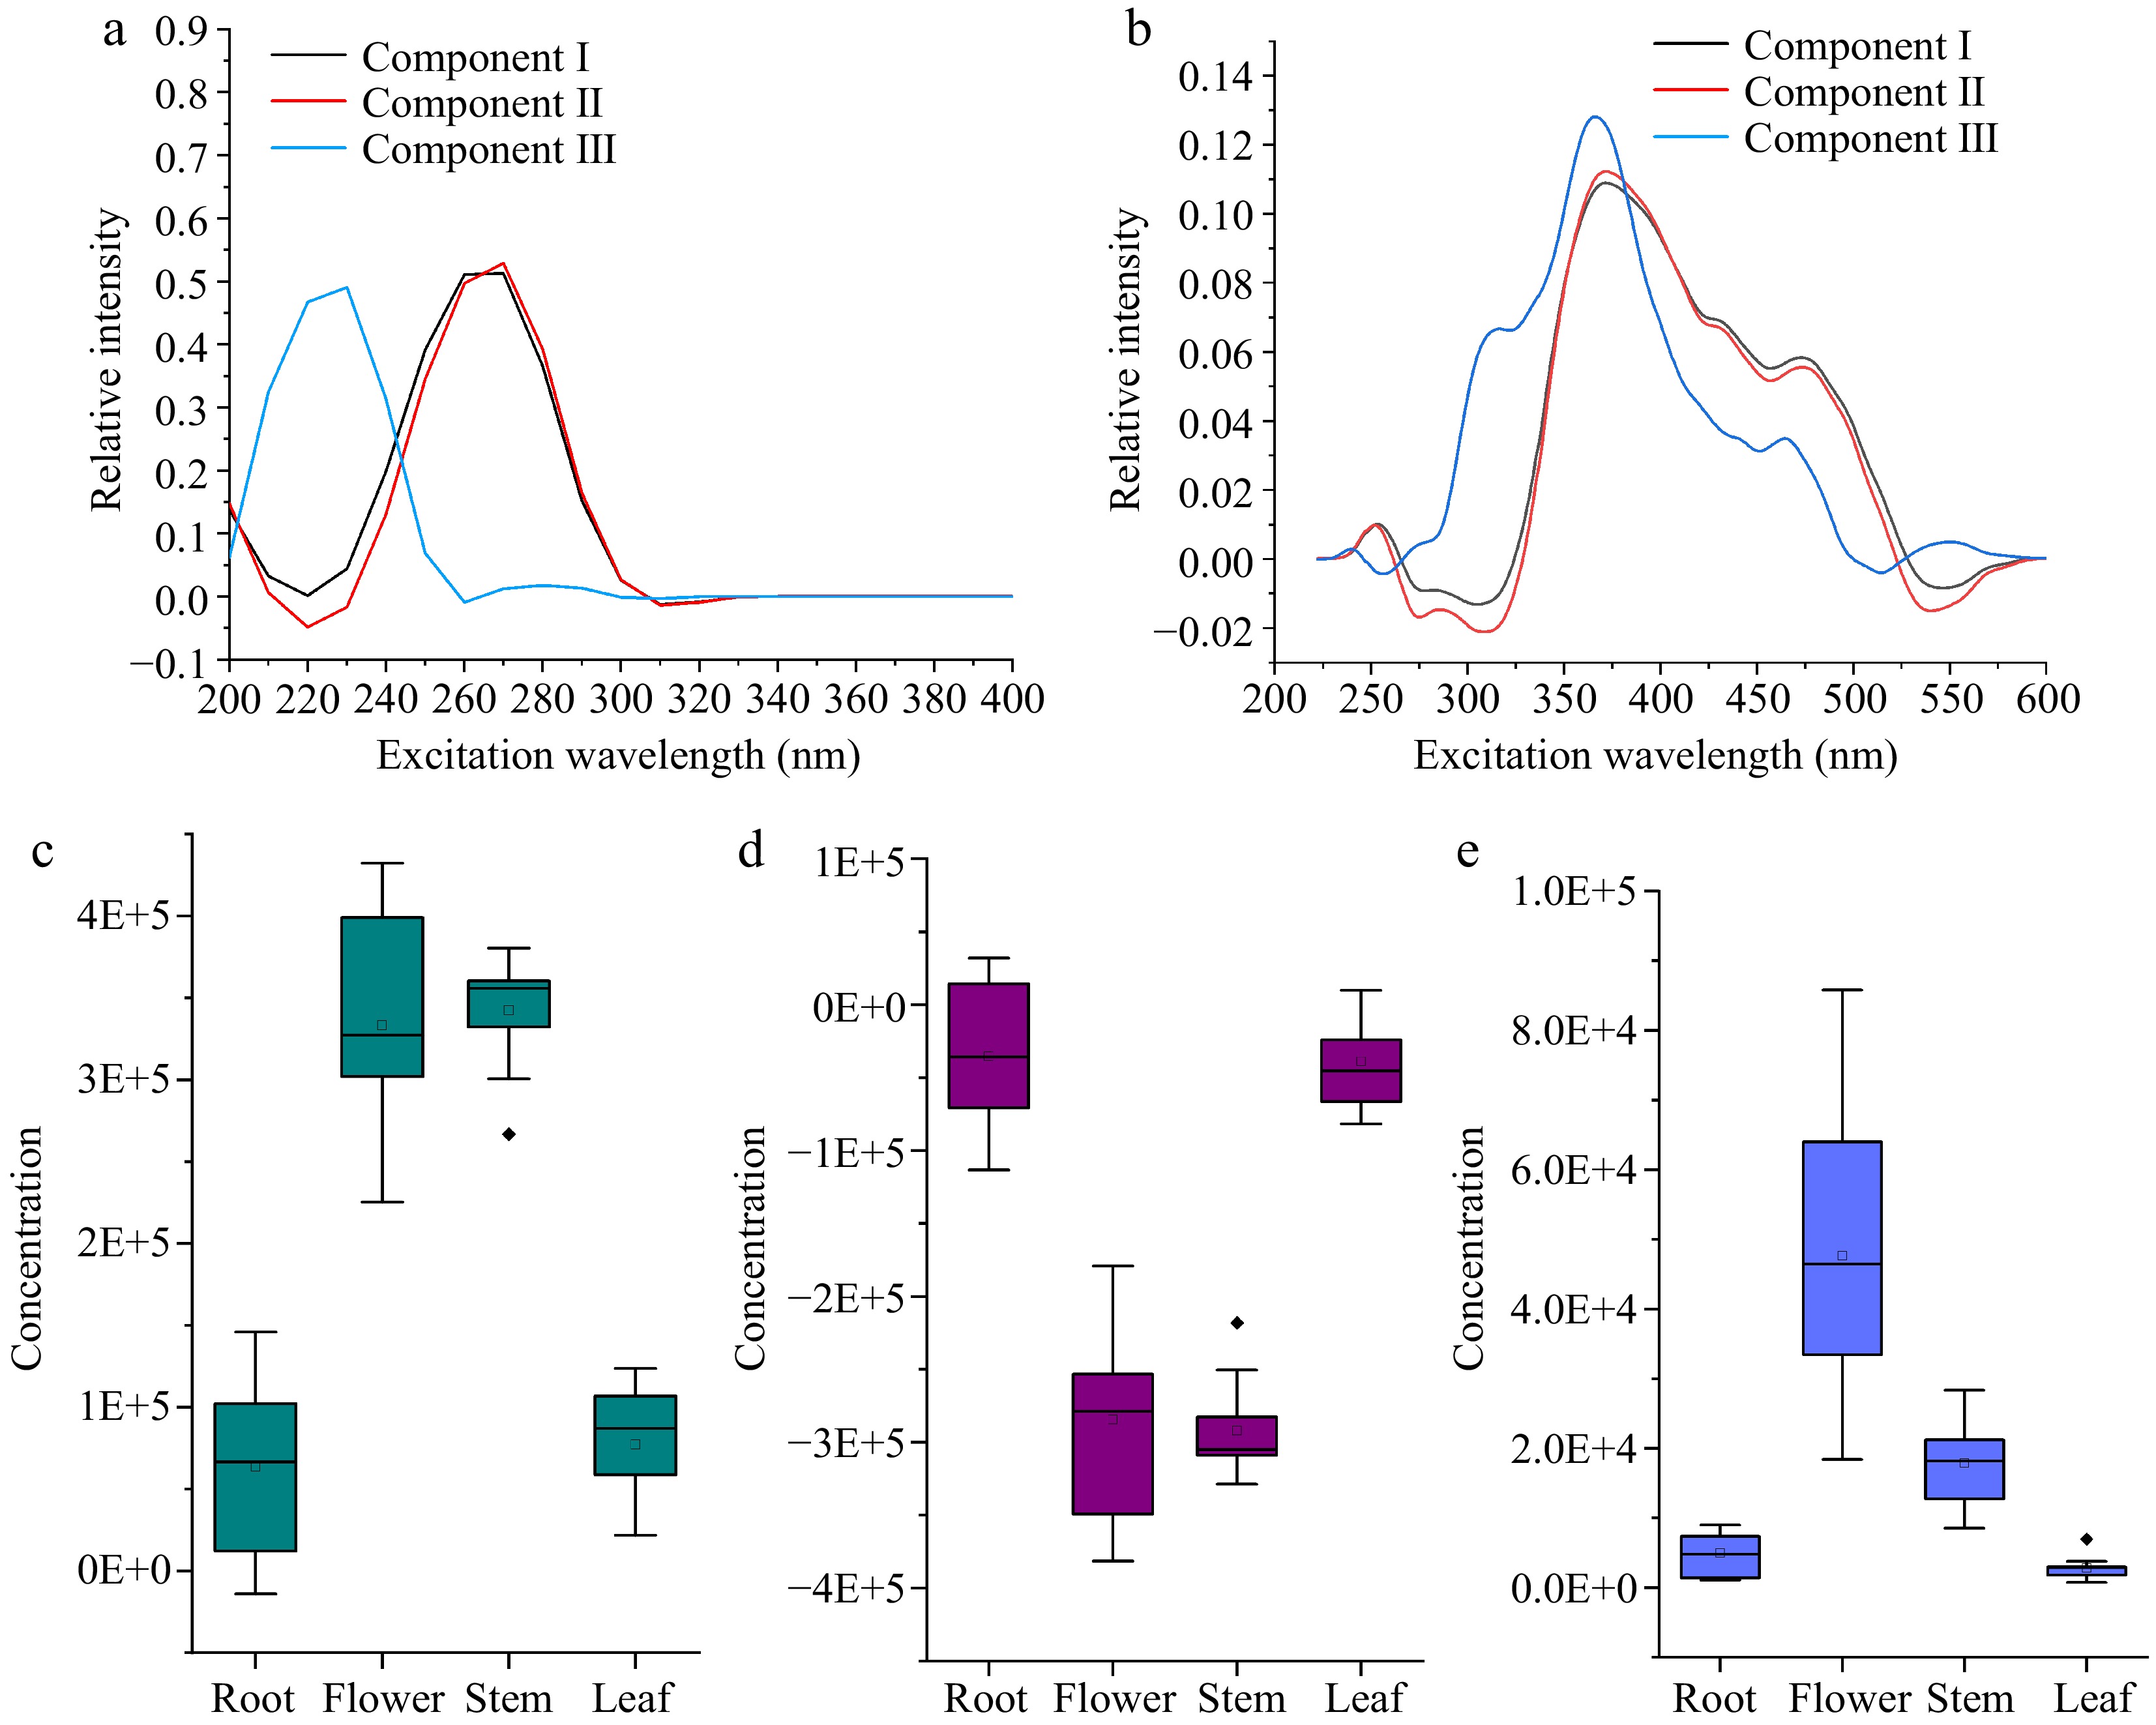
      Figure 6. 

      Results of three component PARAFAC model of dandelion tissue extracts (a-b were (a) Excitation spectra, (b) emission spectra, (c) - (e) relative concentrations of dandelion tissue extracts in components I−III.

    • Fourier transform infrared spectroscopy with principal component analysis, and three-dimensional fluorescence coupled with parallel factor analysis have been used to identify plant species and origin or determine the effects of processing on food quality. In this paper, these two methods were used to process spectrum data, and evaluate the component characteristics of different dandelion tissues.

      Fourier transform infrared spectroscopy coupled with PCA analysis could well distinguish the stem and flower, but failed to discriminate the root and leaf tissue. Former research proved that dandelion root, leaf, and flower contain polyphenols and flavonoids, while dandelion root contains unique triterpenoids, and dandelion leaf contains unique flavonoid glycosides[5]. The peak list contains O-H aromatic (3,400 cm−1), C-H aromatic (2,900 cm−1), C-H aliphatic (2,800 cm−1), C=O (1,743 cm−1), C=C (1,640 cm−1), C=C aromatic (1,550 cm−1), C-O (1,100 cm−1), C-H alkanes (1,450 cm−1) and C-N (1,240 cm−1), these functional groups indicated that phenolic acids, alcohols, esters, carboxylic acids widely exist in the extracts of various dandelion tissues, which is also proven by former research on FTIR analysis results[28]. The FTIR spectrum includes absorption, reflection, emission, or photoacoustic spectrum, and all the substance species and content difference contribute to the spectrum characteristics. On the other hand, PCA summarises the obtained data features, without reference to prior knowledge about whether the samples come from the same dandelion tissues, or the species and content of polyphenol flavonoids, triterpenoids and lavonoid glycosides[29]. Therefore, the dandelion origin, experiment error, and even repeat number could all impact the PCA analysis results. As shown in Fig. 2, two dimensional principal component analysis (PCA) was used to analyze the difference of extracts from different tissues of dandelion. The obtained information is the trend of the point pattern relative to the other patterns, the close point distance of tissue sample reflects the higher similarity among tissues, while the far sample distance of each point represents a comparatively obvious difference[12]. In this case, it is a combination of similarity and difference in FTIR spectral patterns. The higher repeat difference might be related to the lower classical PCA efficiency, it implies that the PCA model failed to classify different tissues. Increasing the number of repeated experiments could improve the discriminant efficiency and the robustness of the model, but the calculated principal component values and the distribution in the score cluster graph will not change.

      Three-dimensional fluorescence spectrum showed all the fluorescent compound fingerprints at specific excitation and emission wavelengths, with various bond distribution and fluorescence intensity. Based on the available fluorescence data and former research, it could be referred that polyphenols show fluorescent peaks at 220 nm / 370 nm, with a higher maximum intensity in flower extracts, than the ones of stem, leaf and root[23, 30]. Although other compounds of flavonoids, triterpenoids and lavonoid glycosides have unique fluorescence absorption and emission, their maximum wavelength of excitation and emission are closed to typical polyphenol, and cannot be detected or discriminated by the fluorescence scan[31].

      In order to compare and distinguish the fluorescence spectra of different dandelion tissues, the PARAFAC method was then used to extract the characteristic components and corresponding spectral features. When compared to the PARAFAC models, the obtained concentrations of leaf and root, as well as the stem and flower tissues overlapped with each other, in both one- (Fig. 5c) and three- (Fig. 6ce) component models. This result indicated that calculated one- and three-component models had similar efficiency, since we cannot distinguish dandelion tissues in box plot of one component or all three components. On the other hand, the calculated excitation and emission spectra of the first component in the one-component model were the same as the third component in the three-component model, and both fluorescence spectra referred to the existence of classical phenolic compounds. The fluorescence spectrum only reflects the fluorescent component characteristics, this why the PARAFAC method has only successfully determined dissolved organic matter and fingerprint in wastewater or water processing[32].

      Based on the results and discussion, it seems that the FTIR-PCA analysis had a better discrimination capacity, since all the substances including fluorescent components and non-fluorescent components could be taken into account, while the fluorescence spectrum does not have enough resolution for discrimination substances with similar structures with close excitation and emission peak wavelengths. By systematically comparing the above methods, this paper gives the limitation and potential application in plant tissue discrimination, as well as the processing effects, plant origin, and compound evaluation in the food industry.

    • Fourier transform infrared spectroscopy combined with principal component analysis, and three-dimensional fluorescence spectroscopy combined with parallel factor analysis were used to distinguish different dandelion tissue extracts. Results indicated that FTIR-PCA analysis could well discriminate tissues of stem and flower from leaf and root, while three-dimensional fluorescence spectrometry with PARAFAC analysis cannot differentiate the tissues of leaf from root, and stem from flower, for the concentrations overlapping with each other. This paper demonstrates that both methods could distinguish samples without prior knowledge of the substance type and content, and FTIR-PCA might be more suitable when fluorescent components exist in various amounts among different samples.

    • The authors confirm contribution to the paper as follows: study conception and design: Li G, Zou H; data collection: Li G; analysis and interpretation of results: Li G, Zou H; draft manuscript preparation: Li G, Chen Y. All authors reviewed the results and approved the final version of the manuscript.

    • All data generated or analyzed during this study are included in this published article.

      • This work was supported by funding: 'Innovation Project of Shandong Province Agricultural Application Technology', No 2130106.

      • The authors declare that they have no conflict of interest.

      • Copyright: © 2023 by the author(s). Published by Maximum Academic Press on behalf of China Agricultural University, Zhejiang University and Shenyang Agricultural University. This article is an open access article distributed under Creative Commons Attribution License (CC BY 4.0), visit https://creativecommons.org/licenses/by/4.0/.
    Figure (6)  References (32)
  • About this article
    Cite this article
    Li G, Zou H, Chen Y. 2023. Discrimination capacity analysis of FTIR-PCA and EEM-PARAFAC on dandelion tissues extracts. Food Innovation and Advances 2(4):247−254 doi: 10.48130/FIA-2023-0026
    Li G, Zou H, Chen Y. 2023. Discrimination capacity analysis of FTIR-PCA and EEM-PARAFAC on dandelion tissues extracts. Food Innovation and Advances 2(4):247−254 doi: 10.48130/FIA-2023-0026

Catalog

  • About this article

/

DownLoad:  Full-Size Img  PowerPoint
Return
Return