


-
Traffic is the most frequent, destructive abiotic stress imposed to all sports fields and intensively-used green areas[1]. Turfgrass quality and function, which are of high priority in sports fields, are strongly affected by traffic[2]. Traffic stress induces several types of damage to sports fields, including wear and soil compaction[2,3]. Soil compaction results in reduced soil aeration and drainage and inhibited root growth[4]. Wear damage, which results from direct injury to plant tissues, is caused by pressure, abrasion, scuffing, and tearing, and it leads to the loss of leaves, stems, and crown[5,6]. Wear stress can reduce the color, quality, coverage, and plant density of turfgrass, which may cause more serious player injury[7,8]. The severity of damage varies depending on factors such as the species and cultivar, traffic intensity and duration, environmental factors, and management practices, including mowing, fertilization, irrigation, and soil moisture status during usage[8, 9]. Wear tolerance is the ability of a field to maintain adequate playability and aesthetic quality when subjected to wear by two mechanisms: durability and recovery[2,7]. The use of wear-tolerant turfgrass species and cultivars is an important means to reduce traffic-induced damage[10]. Anatomical, physiological, and morphological features can determine the degree of wear tolerance among different species and cultivars[11]. Plant characteristics, including total cell wall content, sclerenchyma fiber quantity, leaf chlorophyll content, tiller density, leaf width, leaf tensile strength, and shoot density, are associated with wear tolerance[3,5,6,12,13]. Studies have reported that several turfgrass species and cultivars with a fine leaf texture, high shoot density, and vertical growth rate are more tolerant to various traffic stresses[11,13−15]. However, increased tillering does not favor wear tolerance and wider leaves; instead, a higher number of vascular bundles improves wear tolerance in cool-season turfgrasses[10]. As with other turf traits, wear tolerance differs both among and within species. Bermudagrasses are the most widely used warm-season turfgrasses worldwide, owing to a number of important characteristics of Cynodon species[2]. In general, bermudagrass has greater wear tolerance than other warm- and cool-season turfgrasses[16]. However, varietal differences exist within bermudagrass[17−21].
Management practices, such as the maintenance of mowing height, have significant effects on the surface playability and traffic tolerance of turf[8,9]. Several playing-quality parameters of athletic surfaces improve at lower mowing heights[22]. A close-cut turf surface offers less contact for the ball, allowing it to roll without bouncing in the desired direction, which is especially important for sports such as football[23, 24]. Many sports turf managers mow turf surfaces at the lower end of the tolerance range to offer a fast-playing surface for athletes[25]. On the other hand, mowing is detrimental to the turf. Given that photosynthesis primarily occurs in leaf tissues, reducing leaf height through mowing drastically alters the physiological responses and growth patterns of turfgrasses, especially under various stresses[2]. Studies have revealed that increasing the height of cut improves the traffic tolerance of cool-season grasses[26,27]. Youngner [26] reported that wear tolerance in C3 turfgrass mixtures was lower at a shorter mowing height (1.3 cm) than at a taller mowing height (5.1 cm). However, Dalsgaard et al.[28] reported that green cover percentage (GCP) after traffic stress is improved in tall fescue by reducing the mowing height from 7.6 cm to 3.8 cm. Discrepancies in the effects of mowing height on traffic tolerance of warm-season species also exist. Traffic tolerance is increased by reducing the mowing height from 3.8 cm to 1.9 cm in bermudagrass[25]. Similarly, Braun et al.[29] reported that wear tolerance was more affected at a higher mowing height (6.3 cm) than at a lower mowing height (1.6 cm). However, Strunk et al.[30] found that a higher mowing height (2.2 cm) provides better traffic tolerance than a shorter mowing height (1.3 cm) in bermudagrass, indicating that cultivars of Cynodon spp. not only vary in traffic tolerance but also in their response to lower mowing heights under wear stress. These results support the need for further research to determine if lower mowing heights can reduce the wear tolerance of bermudagrass as it does for cool-season grasses.
Hybrid bermudagrasses [Cynodon dactylon (L.) Pers × C. transvaalensis Burt-Davy], such as 'Tifway' and 'Tifsport', are the grasses of choice, and they have been used on most golf courses, athletic fields, parks, and lawns throughout the coastal Mediterranean region for more than 40 years. In recent years, many turfgrass managers in the region have started using cultivars with increased drought and wear tolerance. Many seeded-type bermudagrass [C. dactylon (L.) Pers. var. dactylon] cultivars, such as Riviera, Princess 77, and Contessa, exhibit excellent drought tolerance and performance under Mediterranean climates and may be good alternatives to vegetatively-propagated cultivars[31,32]. Seeded-type bermudagrass cultivars may offer added advantages over vegetatively-propagated cultivars on sports fields. The area can be seeded prior to spring athletic activity without the need to wait for the optimum sprigging date, which allows for earlier recovery of worn areas[33]. Some seeded cultivars show faster recovery from divot injury[21] and faster establishment[34] than vegetative cultivars. However, few studies on the effects of mowing height on traffic tolerance exist for a number of seeded-type bermudagrasses[30]. Due to the decreasing availability of water for turfgrass irrigation in the region, drought tolerance is a major concern of breeders in the bermudagrass breeding program in Turkey. This program involves the use of highly drought-tolerant C. dactylon accessions originating from Turkey[32] that have generated seeded-type cultivars with better performance under drought and high temperature extremes (data not published). Information on the wear tolerance of these cultivars is unavailable, and studies have suggested that 'Tifway', 'Riviera', and 'Princess 77' are ideal for use as commercial standards when evaluating the traffic tolerance of experimental bermudagrasses[18,21,35]. Therefore, it is critical that seeded-type bermudagrasses be evaluated for tolerance to traffic under Mediterranean climates before they are recommended to turf managers.
The objectives of this study are to evaluate the traffic tolerance of three experimental cultivars, compare their performance to commercial seeded cultivars Riviera and Princess 77 and the vegetative hybrid bermudagrass Tifway, and determine the effects of mowing height on traffic tolerance. The following hypotheses were tested: (i) bermudagrass cultivars differ in their traffic tolerance and (ii) mowing height affects wear tolerance.
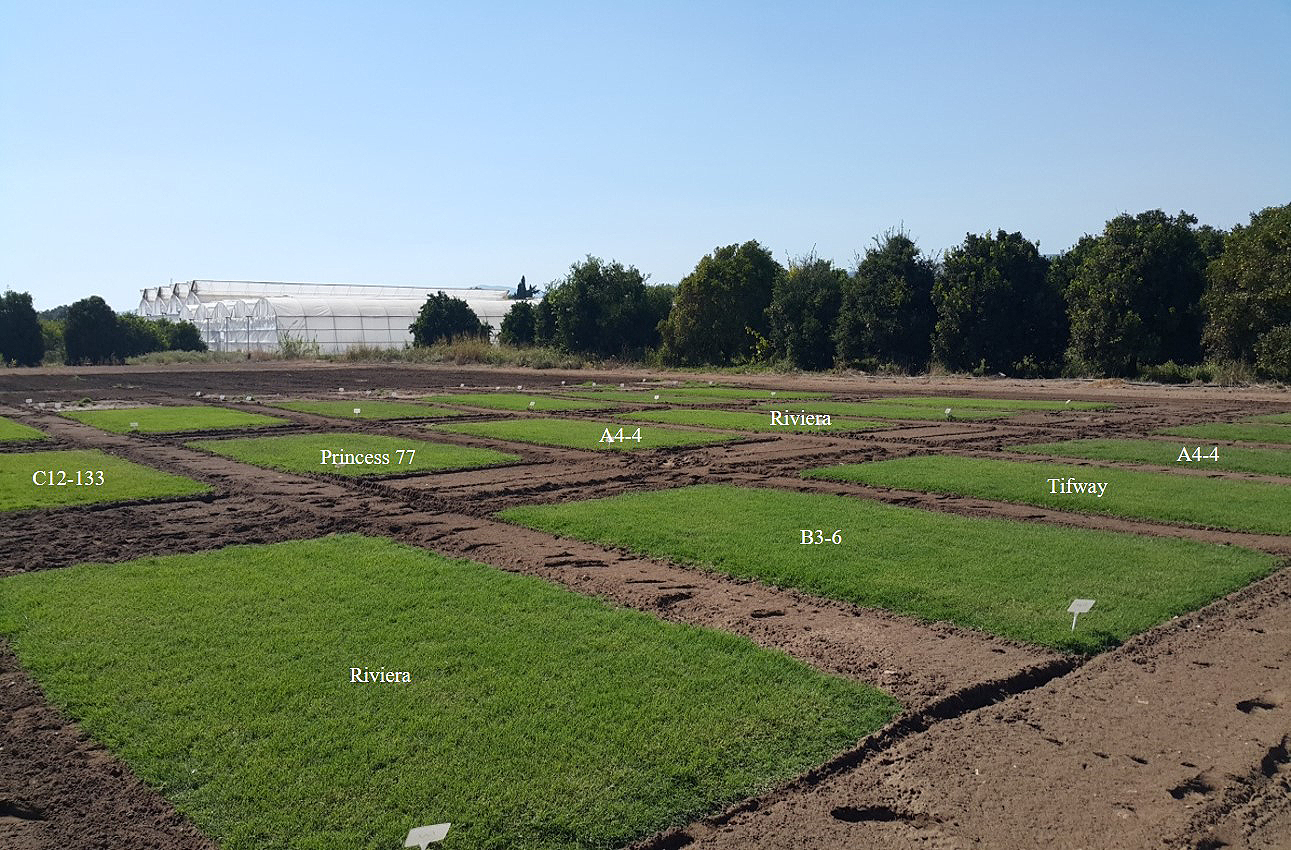
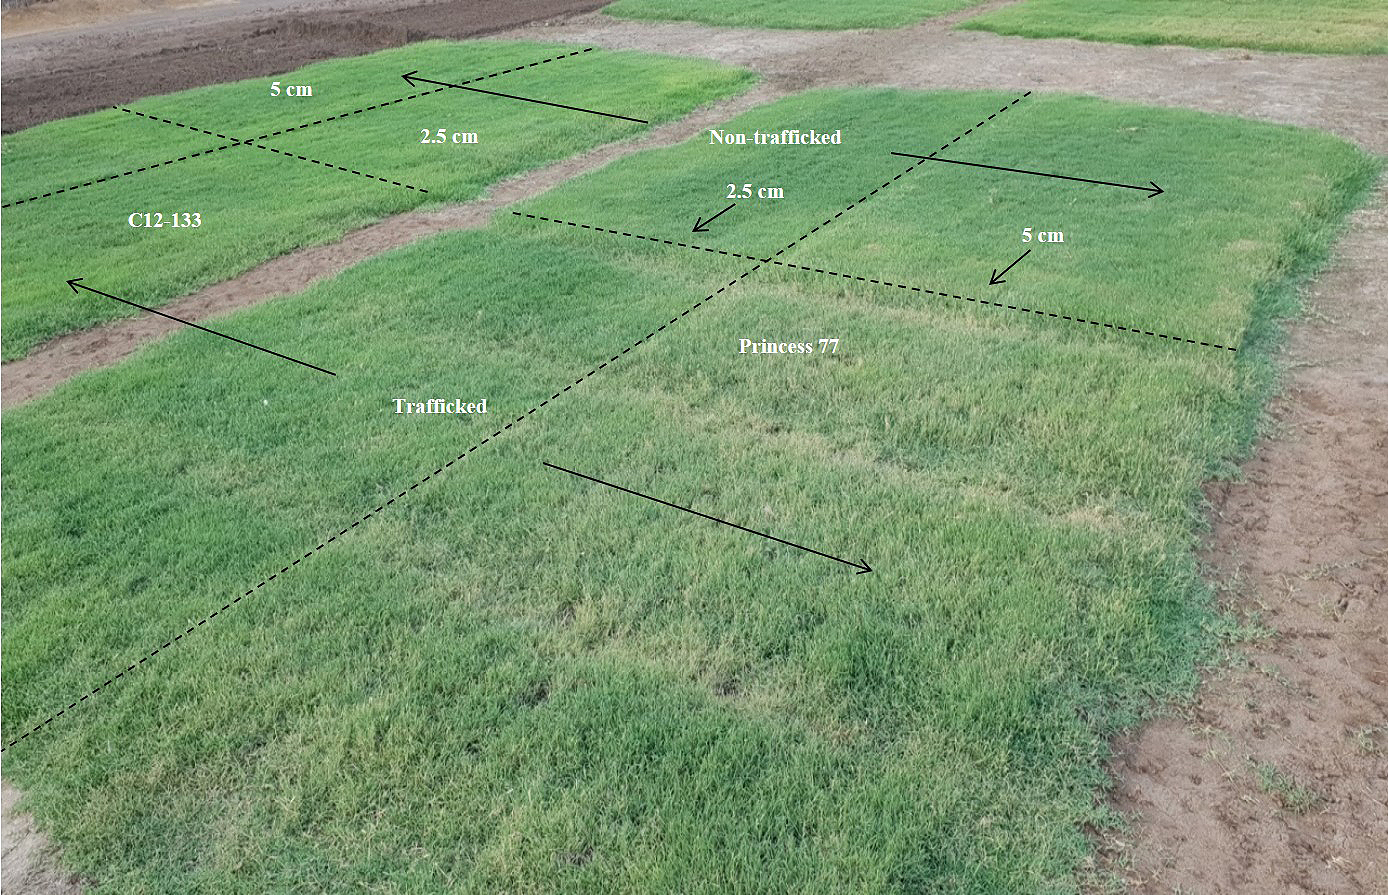
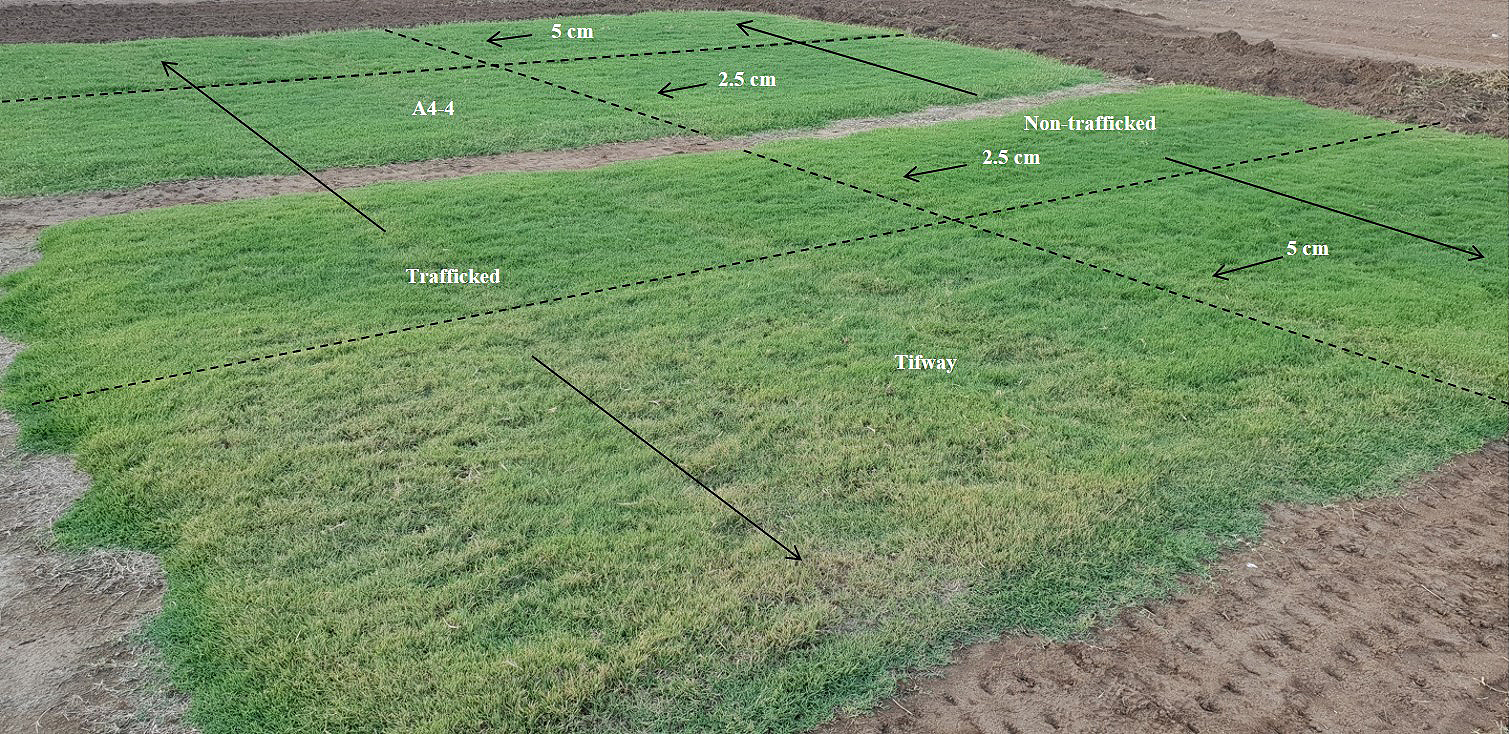
-
A 2-year field study was conducted in 2017 and 2018 at the Alata Horticultural Research Institute in Mersin, Turkey (36°37'N, long. 34°42'E). The area has a typical Mediterranean climate with dry, hot summers and mild, wet winters. Weather data were obtained from a station located 5 km away from the study area and reported in Table 1. The soil type was typic xerofluvent sandy soil (86% sand) with 1.3% organic matter, electrical conductivity of 0.18 dS·m−1, pH 8.1, phosphorous (P) content of 17 mg·kg−1, and potassium (K) content of 133 mg·kg−1. The cultivars (Riviera, Princess 77, A4-4, C12-133, and B3-6) were seeded at a rate of 5 g·m2 pure live seed in June 2016. Tifway was established by planting five greenhouse-grown 5.0-cm diameter plugs per 1 m2. Starter fertilizer (15N-6.6P-12.5K) was incorporated in the upper 25 mm of the planting bed at 5 g·N·m-2. Plots were irrigated three times daily for 2 weeks at 7 mm to enhance establishment. Subsequently, plots were irrigated to prevent turfgrass wilt. Nitrogen (5 g·N·m−2) was applied in July, August, and September of 2016 to promote plot establishment. Plots were fertilized by applying 5 g·N·m−2 from ammonium sulfate (21N-0P-0K) and 2.5 g·K·m−2 from potassium sulfate (0N-OP-50K) per month from May through October in 2017 and 2018. Plots were mowed weekly at 50-mm height with clippings removed during the establishment period. Glyphosate herbicide [N-(phosphonomethyl) glycine, isopropylamine salt] was sprayed between plots to prevent cross contamination, and weeds within plots were hand-removed. The experimental design was a strip plot split block with three replications. The dimensions of the whole plots were 3.0 m × 6.0 m, and those of the split plots were 1.5 m × 3.0 m. Whole plots assessed cultivar type, whereas split plots evaluated mowing height (2.5 cm vs 5 cm). Traffic treatments included trafficked and non-trafficked strips across the plots where half of each plot received traffic, while the other half did not receive traffic. Mowing regimes included mowing one day per week at 5 cm (high) or 2 to 3 days per week at 2.5 cm (low). Three commercially available cultivars (Princess 77, Riviera, Tifway) were chosen to represent a range of turfgrass qualities and traffic tolerance traits as previously reported[17,19,20,36]. The three experimental seeded-type bermudagrass cultivars (A4-4, B3-6, C12-133) were developed at Akdeniz University and exhibited quality traits similar to 'Riviera'.
Table 1. Meteorological parameters during the experiment period from Erdemli Weather Station in Mersin, Turkey.
Months Mean air
temperature (°C)Precipitation
(mm)Relative
humidity
(%)Wind
speed
(m·s−1)min max mean mean mean June 2017 19.8 28.7 0.2 75.0 1.8 July 2017 23.9 32.7 0.0 71.4 1.7 Aug. 2017 24.2 32.8 0.4 70.8 1.6 Sept. 2017 21.1 31.1 0.0 68.5 1.5 Oct. 2017 14.2 27.0 5.2 54.8 1.3 Nov. 2017 10.3 21.4 105.6 65.2 1.3 Dec. 2017 7.4 18.7 49.2 70.9 1.2 Jan. 2018 6.2 15.6 153.0 75.0 1.3 Feb. 2018 7.3 18.2 44.0 74.7 1.0 Mar. 2018 9.8 21.0 13.8 72.9 1.5 April 2018 12.0 23.8 10.4 69.9 1.3 May 2018 17.2 28.3 20.0 67.3 1.4 June 2018 20.5 29.7 4.0 72.4 1.8 July 2018 23.4 31.5 0.0 74.3 1.8 Aug. 2018 23.7 32.4 0.0 72.4 1.8 Sept. 2018 20.9 31.3 1.8 65.5 1.5 Oct. 2018 15.4 27.6 56.8 63.4 1.3 Nov. 2018 10.7 22.1 19.4 63.7 1.2 Assessment of traffic tolerance
-
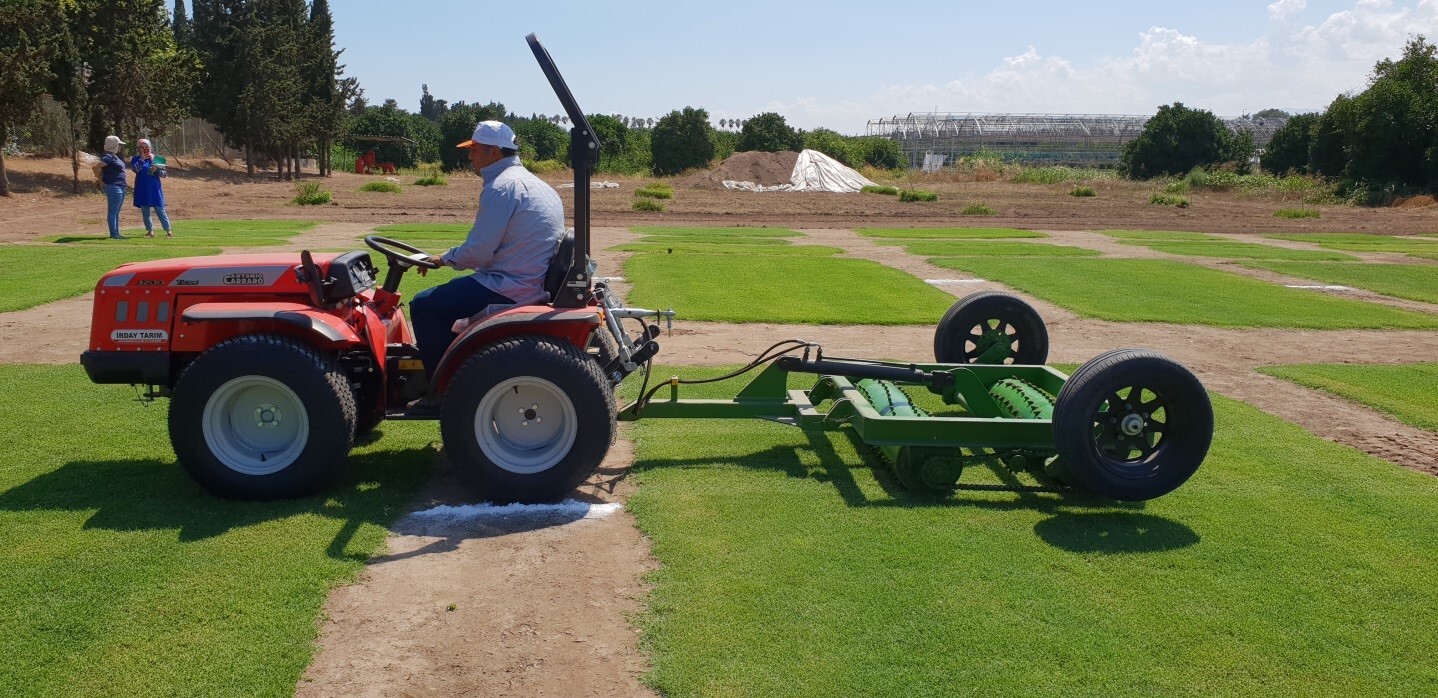
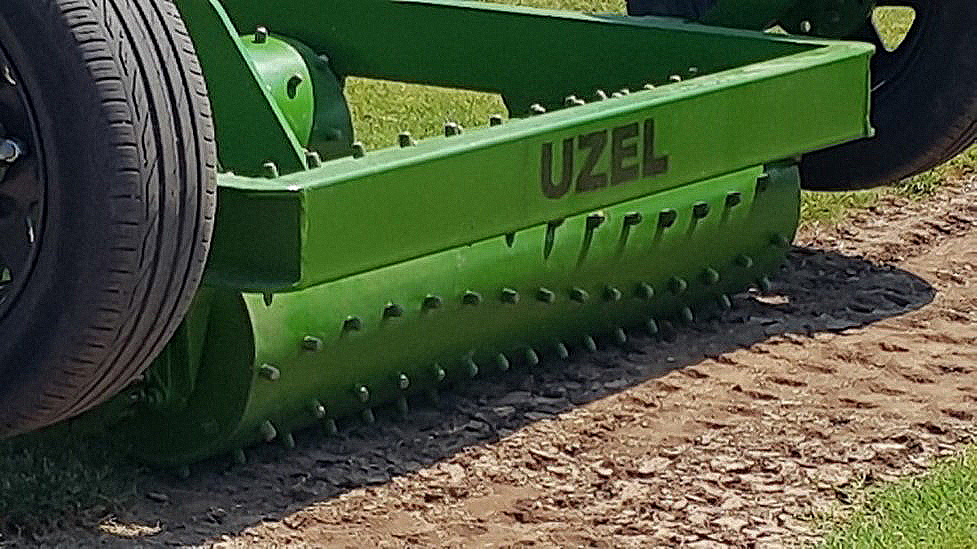
Before the application of traffic stress, all plots were established and covered with grasses (Supplemental Fig. S1). Traffic treatments were applied as a strip within replicates using a traffic simulator and the method of Cockerham & Brinkman[37]. The Brinkman traffic simulator reproduces soccer foot traffic conditions, including wear, compaction, and lateral shearing[38]. The simulator weighed 350 kg and consisted of two studded rollers with 170 soccer cleats (100 mm, diameter; 170 mm, length) and an additional smooth roller (Supplemental Figs S2 & S3). The traffic simulator was pulled by a Tigre 3,200 tractor (Antonio Carraro Products, Padova, Italy) equipped with dual tires to minimize tire wear. In 2017, four passes were made once a week for a total of 7 weeks from 14 August to 2 October. In 2018, the intensity and duration of traffic stress were increased, and plots were subjected to eight passes per week for a total of 12 weeks from 19 June to 11 September. The traffic treatments applied in 2017 and 2018 were roughly equivalent to turf damage from two and four soccer games per week[19,20].
Response variables
-
Turfgrass quality, density, leaf texture, GCP, normalized difference vegetation index (NDVI), chlorophyll content, and playing quality parameters, including surface hardness and shear strength, were determined in both years. Turfgrass quality, as an integral component of color, density, uniformity, and weed infestation, was rated visually on a scale of 1 (the worst; completely dead and brown turf) to 9 (the best), where 6 was considered acceptable quality[39]. Turf density, an estimate of living plants or shoots per unit area, was assessed on a visual scale from 1 (bare soil) to 9 (very high density). Shoot density was determined by manually counting the shoots on three 100-mm-diameter plugs randomly collected from different locations in each treatment plot. Turfgrass texture, an estimate of leaf width, was rated using a visual scale from 1 to 9, where 1 represented very coarse leaf texture and 9 represented very fine leaf texture. The GCP was rated using a visual scale of 0 to 100, where 0 indicated no green vegetation cover and 100 indicated 100% green vegetation cover. The canopy-level chlorophyll content index (CHL) was determined with a handheld chlorophyll meter (Field Scout CM 1,000; Spectrum Technologies, Inc., Plainfield, IL, USA), which measured the reflected red and far-red light ratio to calculate the relative chlorophyll content at 80-cm height above the plot surface. The output is a unitless index of chlorophyll content on a scale of 0 to 999. All measurements were taken in full sun between 1,100 and 1,300 h with the meter facing away from the sun. NDVI values were collected with a handheld turf NDVI color meter (Field Scout TCM 500 NDVI Spectrum Technologies, Inc.). CHL and NDVI values from 20 readings per plot were averaged. Surface hardness (soil compaction) was measured using a 2.5-kg Clegg impact soil tester (Turf-Tec International, Tallahassee, FL, USA), and three readings were taken for each plot. Surface hardness was measured in Gmax. Clegg impact ratings between 30 and 130 Gmax, with an optimum range of 75 to 95 Gmax, were considered as acceptable values for sports fields[40]. Shear strength was measured using a Turf-Tech Shear Strength tester (TSHEAR2-M, Turf-Tec International) with three readings per plot. The turf shear strength tester is a tool that tests the stability of athletic field turfgrass root systems. According to the test readings in Newton meters (Nm), ≥ 20 and 15–20 values correspond to exceptional and good shear strength, respectively, and 10 Nm is the minimum acceptable value given that turf is easily torn under 10 Nm[41]. Soil volumetric water content was measured using a FieldScout TDR 300 moisture meter (Spectrum Technologies, Inc.) equipped with 7.5 cm rods, and three subsamples per plot were measured before each traffic treatment.
Data were analyzed using PROC GLM of SAS (version 9.1; SAS Institute, Cary, NC, USA). Means were separated by Fisher's protected least significant difference (LSD) tests at the 0.05 level of probability. The PROC CORR procedure was used to perform correlation analyses among morphological, physiological, and playability parameters.
-
Environmental conditions, including mean air temperature and precipitation, at the experimental site were similar throughout the course of the 2-year study (Table 1). Because the duration and intensity of the traffic stress were different between the years, the data are presented separately for each year. There were no significant three-way interactions between cultivar, traffic stress, and mowing height. Significant two-way interactions between cultivar and traffic stress and between traffic stress and mowing height were found for turfgrass GCP measurements in both years. There were also significant interactions between cultivar and traffic stress for turfgrass quality in 2018, but not in 2017. The interactions are discussed below.
Green cover percentage
-
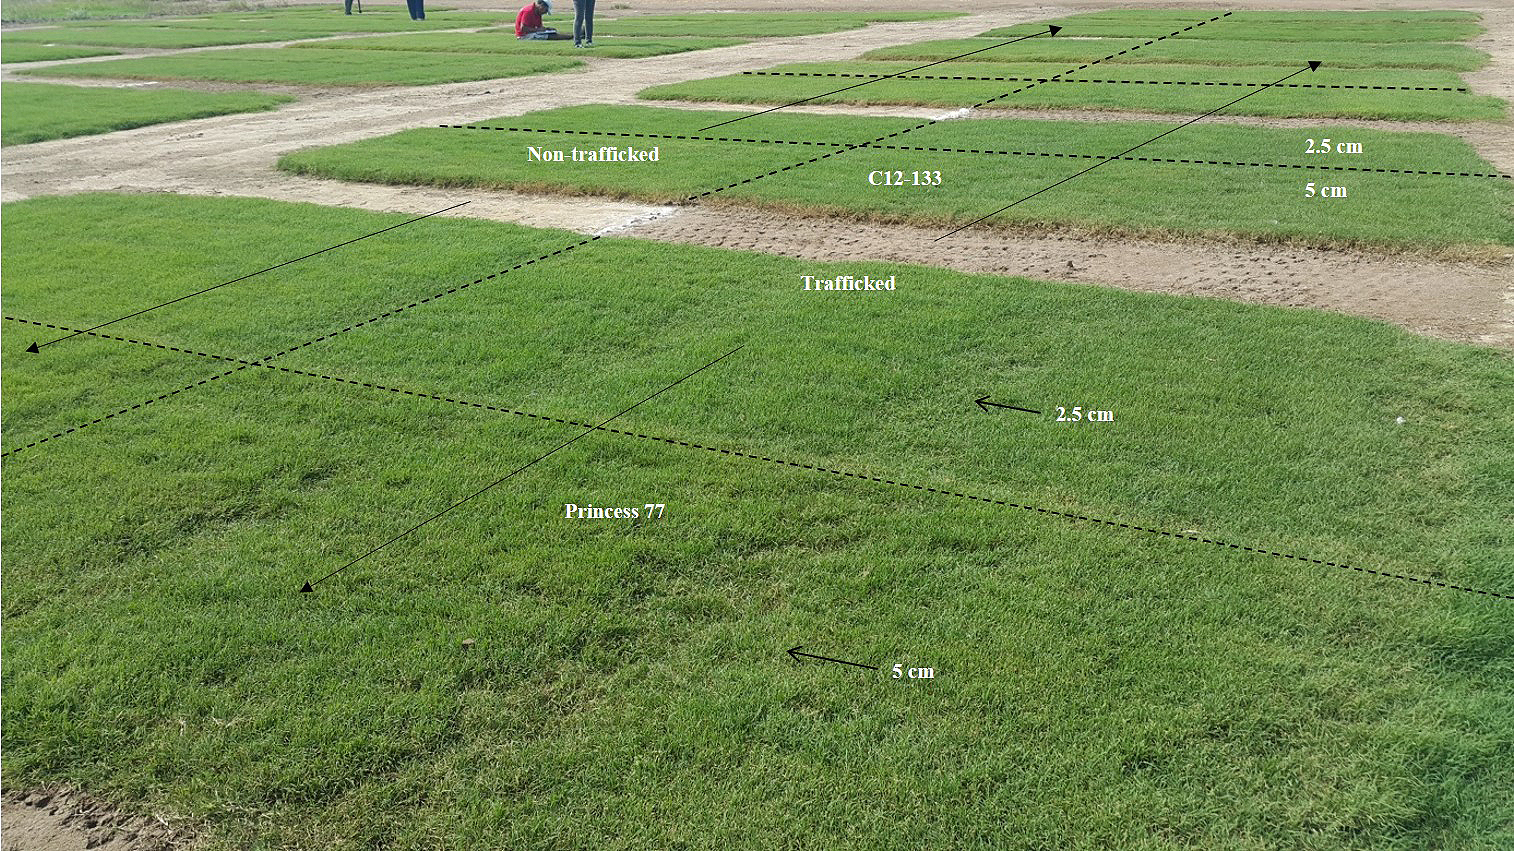
Turfgrass GCP measurements showed significant interactions between cultivar and traffic treatment in both years (Table 2). Before the application of traffic stress, the GCP was 100% in all turf plots. At the end of the study, non-trafficked control plots maintained their 100% green cover. However, the GCP was reduced by 3% to 11% and 17% to 34 % in 2017 and 2018, respectively, and differed significantly among trafficked bermudagrass cultivars. In different studies, simulated traffic causes reductions up to 90% in the GCP depending on cultivar, traffic type, and stress intensity in bermudagrass[19,20,30,36]. The GCP was significantly higher in 'Riviera', 'A4-4', and 'C12-133' plots (97, 96, and 96%, respectively) than in 'B3-6' and 'Princess 77' plots (89 and 90%, respectively) but not in the 'Tifway' plot (93%) after two games per week of simulated traffic stress in 2017 (Table 2, Supplemental Figs S4 & S5). In 2018, similar trends were observed for Riviera, C12-133, and A4-4 plots, with significantly higher GCP measurements (83, 81, and 81%, respectively) than in Tifway, Princess 77, and B3-6 plots (74, 69, and 66%, respectively) (Supplemental Fig. S6). Increased turfgrass damage, as indicated by greater GCP loss caused by the simulated traffic, was observed in 2018 than in 2017, most likely due to greater traffic stress with longer duration. The work by Carrow & Johnson[8] confirms the notion that the decline of turf canopy appearance varies depending on traffic stress intensity and duration.
Table 2. Green cover percentage as affected by cultivar, traffic and mowing height in, Mersin-Turkey, 2017 and 2018.
Year Treatment Green cover percentage* Traffic‡ No traffic Avg§ 2017 Cultivar A4-4 96 ab¶ 100 a 98.0 B3-6 89 c 100 a 94.5 C12-133 96 ab 100 a 98.0 Princess 77 90 c 100 a 95.0 Riviera 97 ab 100 a 98.5 Tifway 93 bc 100 a 96.5 Avg. 93.5 100 96.8 Mowing height 2.5 cm 96 a 100 a 98.0 5.0 cm 91 b 100 a 95.5 Avg. 93.5 100 96.8 2018 Cultivar A4-4 81 b 100 a 90.5 B3-6 66 d 100 a 83.0 C12-133 81 b 100 a 90.5 Princess 77 69 cd 100 a 84.5 Riviera 83 b 100 a 91.5 Tifway 74 c 100 a 87.0 Avg. 75.5 100 87.8 Mowing height 2.5 cm 80 b 100 a 90.0 5.0 cm 71 c 100 a 85.5 Avg. 75.5 100 87.8 * Green cover percentage (GCP) was rated using a 0–100 visual rating scale, where 0 = no green vegetation cover and 100 = 100% green vegetation cover. ‡ Traffic was applied using Brinkman Traffic simulator at a level equivalent to two and four soccer games per week in 2017 and 2018, respectively. §The interaction of cultivar and traffic level, and mowing height and traffic level were significant, so no statistical separation is applied to traffic, cultivar or mowing height averages. ¶ Means followed by the same letter within each variable are not significantly different according to Fisher's LSD (p < 0.05) test. In our study, 'Riviera' was the only commercial cultivar in the top statistical category for the assessment of GCP along with two experimental cultivars, A4-4 and C12-133. Statistically, 'Riviera' outperformed 'Tifway' and especially 'Princess77' under traffic treatment. Our results are consistent with those of Segars[42] in which experimental and commercial bermudagrass entries were evaluated for their traffic tolerance under 2.5-cm mowing height where 'Riviera' was in the top performing group, significantly outperforming 'Princess 77' and 'Tifway' cultivars. Our results are also consistent with earlier studies conducted by Trappe et al.[21], Williams et al.[20], and Strunk et al.[30] in which 'Riviera' was consistently in the best performing group of bermudagrass cultivars under traffic stress. However, in these aforementioned studies, the GCP measurements of 'Tifway' and 'Princess 77' were similar to 'Riviera' under simulated traffic. While these results appear to be contradictory to those of our study, in the studies of Trappe et al.[21] and Strunk et al.[30], 'Tifway' and 'Riviera' performed equally well when the turf was shorter (1.3 cm and 1.3–2.2 cm, respectively) and traffic stress (four passes per week during the summer season) was applied with different traffic simulators. In a study by Williams et al.[20] in which the GCP measurements for 'Riviera' and 'Princess 77' were statistically similar, the turf was maintained shorter (1.6 cm) and stress was applied in the fall season.
The interactions between traffic stress and mowing height also affected the GCP (Table 2). While no difference existed in the GCP between the two mowing heights under non-trafficked conditions, the plots maintained at 2.5-cm mowing height had significantly higher GCP values than those maintained at 5.0-cm mowing height under traffic stress in both years. Compared with non-trafficked plots, the GCP values of plots maintained at 5.0-cm and 2.5-cm mowing heights were reduced by 29% and 20%, respectively, under simulated traffic in 2018. Robinson[25] reported similar results in which the traffic tolerance of bermudagrass cultivars was increased by lowering the mowing height from 3.8 cm to 1.9 cm. More recently, Braun et al.[29] found that traffic stress affected the GCP more severely at 6.3-cm mowing height than at 1.6-cm mowing height. In their study, traffic stress at higher and lower mowing heights reduced the GCP by 43% and 26%, respectively, in warm-season turfgrasses such as buffalograss [Buchloe dactyloides (Nutt.) Engelm] and zoysiagrass (Zoysia japonica Steud.). The GCP loss after traffic stress was also greater in tall fescue at 7.6-cm mowing height than at 3.8-cm mowing height[28]. These results suggest that traffic stress may be more apparent on higher mowed turfgrass, which may be due to several factors. Longer leaves appear to exacerbate wear damage. Braun et al.[29] attributed the reduced traffic tolerance of the higher-cutting height to the greater green leaf area exposed to wear stress compared to the lower-cutting height, allowing more opportunity for GCP and quality loss. The greater traffic tolerance of the lower-mowing height may also be attributed to the increased shoot density compared to the higher-mowing height[25]. The results of Strunk et al.[30] contradict the findings of our work, as the higher-mowing height associates with higher GCP after traffic compared to the lower-mowing height in hybrid bermudagrasses such as 'Tifway'. However, the low-cutting height evaluated by Strunk et al.[30] was 1.3 cm, which is 1.2 cm lower than the low-cutting height assessed in our work. Moreover, the highest-mowing height tested by Strunk et al.[30] was 2.2 cm, which was similar to the lowest-mowing height tested in our work. The study by Strunk et al.[30] and the study performed by us were similar in terms of the intensity of traffic stress applied. While the results by Strunk et al.[30] and our study appear to be contradictory, they suggest that a height of 2.0–2.5 cm may be an ideal mowing height range for bermudagrass in terms of improved traffic tolerance.
Turfgrass quality
-
After 7 weeks of traffic stress in 2017, turfgrass quality (TQ) showed no significant interaction between treatments. However, the main effects of traffic stress, cultivar and mowing height were significant (Table 3). As expected, trafficked plots had lower TQ values than non-trafficked plots (6.6 vs 7.5) regardless of cultivar and mowing height. Furthermore, all trafficked bermudagrass cultivars maintained acceptable TQ values (6.0 or above), which indicated their good tolerance to a traffic stress level equivalent to two soccer games per week. Regardless of the traffic treatment and mowing height, 'A4-4', 'Riviera', and 'C12-133' with TQ values ranging from 7.5 to 7.2 provided significantly higher quality than 'Princess', 'Tifway', and 'B3-6' (6.8, mean) (Table 3). In a study by Williams et al.[20], 'Riviera' and 'Princess 77' exhibit the highest and the lowest TQ values, respectively, among six seeded-type bermudagrass varieties under a similar traffic treatment, although the results of Bayrer[17] partially contradict those of Williams et al. [20], revealing that 'Riviera' and 'Princess 77' outperform other bermudagrass cultivars under similar traffic treatment. However, in the study by Bayrer[17] bermudagrasses were maintained at 1.6-cm mowing height, and traffic was applied in the fall season.
Table 3. Turfgrass quality as affected by cultivar, traffic and mowing height in, Mersin-Turkey, 2017 and 2018.
Year Treatment Turfgrass quality (1 to 9)* Traffic¶ No traffic Avg 2017‡ Cultivar A4-4 7.1 7.9 7.5 a B3-6 6.2 7.3 6.7 c C12-133 6.8 7.6 7.2 b Princess 77 6.1 7.4 6.8 c Riviera 6.9 7.7 7.3 ab Tifway 6.2 7.3 6.8 c Avg. 6.6 A 7.5 B 7.1 Mowing height 2.5 cm 5.0 cm Avg 7.4 a 6.7 b 7.1 2018§ Cultivar A4-4 5.5 c 7.3 ab 6.4 B3-6 4.6 d 6.8 b 5.7 C12-133 5.5 c 7.2 ab 6.4 Princess 77 4.9 cd 7.2 ab 6.1 Riviera 5.7 c 7.4 ab 6.6 Tifway 5.0 cd 7.6 a 6.3 Avg. 5.2 7.3 6.3 Mowing height 2.5 cm 5.0 cm Avg 2.5 cm 6.4 a 6.1 a 6.3 * Turf quality was rated on a visual scale of 1 (the worst; completely dead and brown turf) to 9 (the best). ‡ In 2017 the interaction of cultivar and traffic was not significant but main effects were significant, so statistical separation is applied to cultivar and traffic averages. Upper case letters are used to differentiate between traffic levels. §In 2018 the interaction of cultivar and traffic level was significant, so no statistical separation is applied to traffic or cultivar averages. ¶ Traffic was applied using the Brinkman Traffic simulator at a level equivalent to two and four soccer games per week in 2017 and 2018, respectively. Means followed by the same letter within each variable are not significantly different according to Fisher's LSD (p < 0.05) test. In 2018, there were significant interactions between traffic stress and cultivar for the TQ. 'Riviera', 'A4-4', and 'C12-133' performed similarly and maintained significantly higher TQ values (5.7, 5.5, and 5.5, respectively) than B3-6 (4.6), but not significantly higher values than 'Tifway' (5.0) in trafficked plots (Table 3). Under non-trafficked conditions, 'Tifway' maintained a higher TQ value (7.6) than B3-6 (6.8), but not significantly higher values than 'Riviera', 'A4-4', 'Princess 77', and 'C12-133'.
Regardless of traffic treatment and cultivar, the shorter-mowing height resulted in significantly higher TQ values in 2017 (Table 3). Studies have showed that mowing height has considerable effects on quality depending on the species[25,29,43]. For example, in a study by Richie et al.[43], the visual quality of tall fescue (Festuca arundinacea Schreb.) is greatest at low mowing heights. Similarly, Braun et al.[29] reported that traffic stress reduces the TQ of warm-season grasses more severely at high- than at low-mowing heights (6.3 cm vs 1.6 cm).
Our results also showed that the TQ values of all trafficked cultivars were (5.2, mean) below the acceptable level in 2018 and lower than their respective trafficked plots (6.6, mean) in 2017 (Table 3). In addition to increased intensity and wear stress duration (two games per week for 7 weeks in 2017 vs four games per week for 12 weeks in 2018), the elevated soil compaction, as indicated by the higher surface hardness, may also be associated with the pronounced damage caused by traffic stress in 2018. In 2017, the surface hardness of trafficked plots was within the optimal range. The lower TQ values of trafficked plots were mostly due to wear damage, lateral shearing, and canopy holes. In 2018, in addition to the increased wear damage, the surface hardness was above the optimal range (96 Gmax), which added to wear stress and reduced the ability of the turf to cope with traffic stress, as suggested by Puhalla et al.[24]. Correlation analysis also showed that there was a significant negative relationship between quality and surface hardness (p < 0.001; r = −0.73) in 2018, confirming the relevant impact of soil hardness on the TQ (Table 4). Previous studies have also reported reductions in the TQ after simulated traffic[17,44,45]. The decreased TQ under traffic stress is associated with reduced shoot density, turfgrass coverage, homogeneity, color, and early shoot tissue aging as a result of crushing and tearing/fragmenting of leaf tissues[1,46]. Results from our study also confirm the effects of density (r = 0.49 and r = 0.89 in 2017 and 2018, respectively), the GCP (r = 0.77 and r = 0.91 in 2017 and 2018, respectively), and leaf texture (r = 0.35 and r = 0.53 in 2017 and 2018, respectively) on the overall TQ of bermudagrass cultivars under traffic stress as indicated by significant correlations (Table 4).
Table 4. Pearson correlations (r) among traits (SH: Surface hardness, TSS: Turf shear strength, SD: Shoot density, TVD: Turf visual density, LT: Leaf texture, NDVI: Normalized difference vegetation Index, CHL: Chlorophyll index, GCP: Green cover percentage, and TQ: Turfgrass quality) measured after simulated traffic in a field experiment conducted at Mersin, Turkey in 2017 and 2018.
SH TSS SD TVD LT NDVI CHL GCP TQ ns ***
−0,73**0.43**
0.67**−
0.57**0.49**
0.89**0.29*
0.53**0.82**
0.83**0.68**
0.85**0.77**
0.91**GCP −0.23*
−0.75**0.46**
0.73**−
0.65**0.38**
0.89**0.44**
0.58**0.72**
0.860.47**
0.82**CHL −0.42**
−0.61**0.48**
0.69**−
0.56**0.39**
0.81**0.26*
0.52**0.69**
0.87NDVI −0.24*
−0.58**0.47**
0.68**−
0.65**0.50**
0.86**0.42**
0.65**LT −0.24*
−0.38**ns
0.42**−
0.67**0.59**
0.72**TVD ns
−0.71**ns
0.68**−
0.74**SD −
−0.52**−
0.48**SHS −0.33**
−0.68**ns, *, **, indicate non-significant and significant correlations at the p = 0.05 or 0.01 respectively.
***, The values above and below within each row indicates related correlation values belongs to 2017 and 2018 respectively.Turf density
-
Turfgrass density, an important component of turfgrass quality, is under genetic control and strongly affected by abiotic and biotic stresses. Traffic stress significantly reduced the density, especially in 2018 (Table 5). The difference in density between non-trafficked and trafficked plots was 4% (7.9 vs 7.6) in 2017 and 22% (8.1 vs 6.3) in 2018 based on visual assessment. These results were confirmed by counting shoots per unit area, which showed that traffic stress reduced shoot density by 19% in 2018. Williams et al.[20] found that the shoot density of bermudagrass cultivars decreased by 10%–20% in plots after simulated traffic. For most of the cool-season turfgrasses, similar traffic treatment reduced the density by 27% on average[10]. Similar results were also reported for both warm- and cool-season turfgrass species[10,13,38,47]. Trenholm et al.[13] and Han et al.[47] revealed that the loss of turfgrass density as a result of traffic stress may be due to reduced growth and death of mature shoots.
Table 5. Turf density (visual), leaf texture, Chlorophyll index (CHL) and Normalized difference vegetation index (NDVI), Shear Strength, Surface hardness and Shoot density as affected by traffic, mowing height and cultivar in 2017 and 2018.
Treatments Turf density* Leaf texture CHL NDVI Shear strength Surface hardness Shoot density Traffic level ‡ 2017 Traffic 7.6 a§ 7.5 a 203 b 0.631 b 14.6 b 86.5 a − No Traffic 7.9 b 7.8 b 220 a 0.691 a 16.4 a 79.1 b − Mowing Height 2.5 cm 8.0 a 7.7 a 218 a 0.695 a 15.8 a 85.0 a − 5.0 cm 7.4 b 7.5 a 205 b 0.629 b 15.2 a 81.0 b − Cultivar A4-4 7.9 a 7.8 b 220 b 0.691 a 15.5 b 83.2 a − B3-6 7.5 b 7.3 e 206 c 0.614 d 15.3 b 83.8 a − C12-133 7.9 a 7.6 c 205 c 0.674 ab 15.8 b 82.7 a − Princess 77 7.5 b 7.5 d 197 d 0.625 cd 13.9 c 85.3 a − Riviera 7.5 b 7.6 c 228 a 0.703 a 17.1 a 81.9 a − Tifway 8.0 a 8.2 a 212 c 0.663 bc 15.1 b 80.4 a − Traffic level 2018 Traffic 6.3 b 7.3 b 175 b 0.528 b 12.5 a 96.1 a 310 b No Traffic 8.1 a 7.8 a 215 a 0.638 a 15.7 b 75.2 b 383 a Mowing height 2.5 cm 7.3 a 7.6 a 204 a 0.602 a 14.4 a 87.3 a 366 a 5.0 cm 6.9 b 7.4 a 186 b 0.562 a 13.8 a 84.0 a 327 b Cultivar A4-4 7.5 ab 7.7 b 200 b 0.615 ab 14.6 a 84.8 a 363 b B3-6 6.8 c 7.1 d 184 d 0.525 c 13.9 a 86.8 a 311 c C12-133 7.3 b 7.5 c 193 bc 0.597 b 14.9 a 84.8 a 382 ab Princess 77 6.8 c 7.2 d 187 cd 0.545 c 12.0 b 88.6 a 313 c Riviera 7.2 b 7.5 c 211 a 0.631 a 15.0 a 84.7 a 321 c Tifway 7.8 a 8.0 a 196 b 0.585 b 14.4 a 86.1 a 390 a * Turf density was assessed on a visual scale of 1 (bare soil) to 9 (very high density); Turfgrass texture was rated on a visual scale of 1 (very coarse) to 9 (very fine leaf texture); CHL (Canopy-level chlorophyll content index) was collected with a handheld chlorophyll meter; NDVI values were collected with a handheld turf NDVI color meter; Shear strength was measured using a Turf Tech Shear Strength tester (Nm); Surface hardness was measured using a 2.5-kg Clegg impact soil tester (Gmax); Shoot density was determined by manually counting the shoots on three 100 mm-diameter plugs randomly collected from varying locations in each treatment plot in 2018.
‡ Traffic was applied using Brinkman Traffic simulator at a level equivalent to two and four soccer games per week in 2017 and 2018, respectively.
§ Within columns, means followed by the same letter are not significantly different according to Fisher’s LSD (p < 0.05) test.Mowing treatment significantly affected the density at 2.5-cm mowing height, providing approximately 11% more shoots than at a higher mowing height in 2018 (Table 5). Visual assessment of density in both years also supported these findings. Our results are consistent with those of Robinson[25] in which a lower-mowing height (1.9 cm) and a frequent-mowing rate increased turfgrass density over a higher-mowing height (3.8 cm) for bermudagrass. Kim & Beard[48]indicated that the shoot density of 'Tifway' bermudagrass decreases as the mowing height increases from 1.3 cm to 5.0 cm. Furthermore, a study of the mowing response of Poa pratensis indicated that as the cutting height decreases from 5.0 cm to 2.5 cm, shoot density increases by 59%[49]. The recommended mowing height for seeded bermudagrass is between 2.5 cm and 5.0 cm, whereas the height for hybrids is between 1.25 cm and 2.5 cm[25]. In our study, a 2.5-cm mowing height provided denser coverage and higher quality with a lower reduction in the GCP of seeded bermudagrass cultivars after simulated traffic. These results confirm that mowing at the lower end of the tolerance range for a given species increases shoot density, thereby dampening the reduction in the total quantity of leaf area present per unit area of soil surface[2].
The main effect of cultivar on turf density was also significant. After averaging the traffic and mowing treatments (Table 5), 'Tifway' had the highest density, which was followed by 'A4-4' and 'C12-133' in both years, whereas 'Princess 77' and 'B3-6' had the lowest density, especially in 2018. The variation in shoot density among bermudagrasses has been reported with hybrid cultivars having higher shoot density than seeded-type cultivars[20,25]. As previously reported in cool-[5] and warm-season species[13,50], bermudagrass cultivars displaying higher shoot density (e.g., 'A4-4') show better wear tolerance than those showing lower shoot density (e.g. Princess 77), as indicated by a lower reduction in the GCP and TQ after simulated traffic. Trenholm et al.[13] suggested that increasing shoot density improves the traffic tolerance of hybrid bermudagrass. Tillering contributes shoot density, which affects turfgrass quality and playability under traffic stress[2]. In grasses, tillering is controlled by a complex network of genetic, hormonal, and environmental factors[51,52]. Studies have revealed the interactions of auxin, cytokinin and strigalactone in the regulation of tiller bud development and the importance of balance particularly between auxin and cytokinin in tillering[53]. Auxin, synthesized at the apical meristem and adjacent young leaves, is transported downward to the polar base where it blocks the utilization of root-synthesized cytokinin within lateral (tiller) buds, thereby inhibiting their growth, whereas cytokinin promotes this process[54]. Enhanced tillering after apical decapitation during mowing contributes to a higher ratio of cytokinin to auxin. Apical decapitation also removes the metabolic sink, thereby allowing resources to be redirected to lateral bud outgrowth[55]. Auxin production and export from the shoots is moderated by phytochrome responses to red:far-red light ratios[55] which indicates that environmental factors also control the ultimate number of tillers[56]. Grass tillering is strongly affected by the level of shading within the grass canopy due to reduced photosynthetically active radiation and reduced red:far-red ratios at the lower levels inside the canopy[57]. A low red:far-red ratio is related to reduced tillering in Lolium multiflorum Lam.[58]. When turfgrasses are subjected to shorter-mowing height, plants not only receive more light, but the red:far-red ratio of the light[59] stimulates axillary meristems to produce new tillers, resulting in enhanced turf density.
Leaf texture
-
The effects of traffic stress and cultivar on leaf texture were significant in both years (Table 5). Trafficked plots had a coarser leaf texture (7.5 and 7.3 rating scales in 2017 and 2018, respectively) than non-trafficked plots (7.8 rating scale in both years). The increase in leaf blade width (transition to coarser leaf texture) under simulated traffic stress may be associated with the reduced competition among plants for light, water, and other resources as a result of decreased tiller density. After averaging the traffic and mowing treatments, the cultivars differed in their leaf texture, ranging from 7.3 to 8.2 in 2017 and 7.1 to 8.0 in 2018 (Table 5). 'Tifway' exhibited the finest leaf texture, followed by 'A4-4'. The GCP and TQ losses were highest in 'Princess 77' and 'B3-6' trafficked plots, showing relatively coarser leaf texture, suggesting that cultivars with wider leaves (coarser leaf texture) and larger surface areas are more exposed to traffic stress. Studies have indicated that turfgrass species and varieties with fine leaf texture and increased shoot density are more tolerant to various traffic stresses[13,14,15]. Bryant et al.[60] in evaluating L. perenne found a negative correlation between the force required to break leaves and leaf width (r = 0.56, p = 0.05), indicating that the cultivars with the lowest forces required to break leaves tended to have wider leaves and higher leaf areas. The authors concluded that wider leaves often imply that sclerenchyma veins, a major contributor to the greater force required to break leaves, are further apart and therefore have a greater proportion of mesophyll tissue exposed to damage. The results of our study confirm that cultivars (B3-6 and Princess 77) with wider leaves (coarser leaf texture) had decreased wear tolerance as indicated by the greater loss in the GCP, TQ, chlorophyll index (CHL), and shear strength (Tables 2, 3 & 5). The significant correlations found between leaf texture and the GCP, TQ, and CHL in our study further confirm these findings (Table 4). In a similar field study investigating the correlations between morphology and wear tolerance of six hybrid bermudagrass, including 'Tifway', leaf width and length were correlated with traffic tolerance[11]. Trenholm et al.[50] also reported that varieties with fine-to-medium leaf texture had better wear tolerance and recovery under traffic stress in Paspalum vaginatum. Contrary to these findings, Wei et al.[61] suggested that greater leaf width and leaf angle values contribute to greater turfgrass wear tolerance. Therefore, further studies with more cultivars are justified to verify the relationship of leaf texture with wear tolerance in bermudagrass.
Chlorophyll index
-
The effects of traffic treatment and cultivar on the CHL were significant in both years, whereas the effect of mowing height on the CHL was significant only in 2018 (Table 5). Traffic stress reduced CHL values by 8% and 19% in 2017 and 2018, respectively, regardless of cultivar and mowing height. Decreased chlorophyll content under traffic stress has been reported as the physiological response of many cool- and warm-season turfgrass species[44,45,47,62]. Oxidative damage resulting from the accumulation of reactive oxygen species during traffic stress reduces the chlorophyll content[13,47]. After averaging traffic treatment and mowing height, cultivars differed in their CHL in which 'Riviera' had the highest CHL values, followed by 'A4-4' in both years. 'Princess 77' in 2017 and 'Princess 77' with 'B3-6' in 2018 had the lowest CHL values (Table 5). The cultivars with the lowest CHL values were of low quality, and they showed greater loss in the GCP (Tables 2 & 3). Lower chlorophyll content is related to sparse, low quality, and stressed turf[50]. Visual scorings of color, quality, and the GCP were significantly correlated with chlorophyll content/unit area (r = −0.97) in cool-season grasses under traffic stress[5,63]. Consistent with these earlier studies, close relationships were noted between the CHL and quality (r = 0.68 and 0.85 in 2017 and 2018, respectively), the GCP (r = 0.47 and 0.82 in 2017 and 2018, respectively), and turf density (r = 0.39 and 0.81 in 2017 and 2018, respectively) after simulated traffic in both years (Table 4).
Regardless of traffic treatment and cultivar, the CHL values of 2.5-cm mowed plots were 9% higher than those of 5.0-cm mowed plots in 2018 (Table 5). The increase in leaf chlorophyll content with a decline in mowing height within the tolerance range for a given species has been reported[2]. Fry & Huang[64] suggested that this response is an attempt by the plants to make up for the leaf area lost by the reduction in height by maximizing their ability to capture sunlight.
Normalized difference vegetation index
-
Visual ratings, including the TQ and GCP, are commonly used for screening turfgrass performance under various stress conditions, including traffic[13]. Although visual scores are more efficient than physiological measurements, they are subjective and may differ in consistency between observers[65]. Thus, use of quantitative techniques, such as the NDVI, in conjunction with visual qualitative methods is suggested for the evaluation of grasses under wear and non-wear conditions[5,50]. The NDVI has been used to assess turfgrass quality and color in various stress conditions as a means of reducing subjectivity[66,67]. The effects of traffic stress and cultivar on the NDVI were significant in both years (Table 5). Traffic stress reduced NDVI values by 9% and 17% compared to those of non-trafficked plots in 2017 and 2018, respectively. Higher NDVI values are related to higher turfgrass density and greenness[68, 69]. Regardless of the traffic treatment and mowing height, 'Riviera' had higher NDVI values than the other cultivars, except 'A4-4', whereas 'B3-6' and 'Princess' had the lowest NDVI values. The effect of mowing height on the NDVI was significant in 2017 with shorter mowed plots having 10% higher NDVI values after averaging traffic treatment and cultivar type. The effects on the NDVI were consistent with those on the visual TQ, which were confirmed by a significant correlation between the NDVI and quality (r = 0.82 and 0.83 in 2017 and 2018, respectively). Similar reductions in NDVI values in response to traffic stress and significant correlations between NDVI and visual turfgrass quality have also been reported[50, 70,71].
Turf shear strength
-
Turf shear strength, also known as traction, is related to playability, and it is another way to evaluate turfgrass wear tolerance by measuring the surface traction at its maximum torque[72]. Limited information is available on bermudagrass intraspecific differences regarding turf shear strength[73]. The main effect of traffic treatment was significant, and the reduced shear strength of bermudagrass cultivars is consistent with those of earlier studies[45,73,74]. Reductions of 20% and 11% in shear strength due to simulated traffic were noted after four and two games per week in 2018 and 2017, respectively (Table 5). Our results are consistent with those of Aldahir [73] in which bermudagrass cultivars exposed to simulated traffic with three and five games per week exhibit 9% and 25% lower shear strength values. Similarly, we have previously reported[45]that the application of traffic stress (two games per week for 7 weeks) reduces the mean shear strength of triploid bermudagrass cultivars by 15%. Previous research on cool-season grasses also demonstrated that shear strength decreases as a result of traffic[75,76]. No significant difference was observed in the shear strength between 2.5-cm and 5.0-cm mowing heights (Table 5), which agrees with the results of Rogers & Waddington[75] in which different mowing heights had no effect on the traction of tall fescue. In contrary to our findings, McNitt et al.[23] reported that lower mowing heights of tall fescue result in higher traction.
The main effect of cultivar on shear strength was significant with rankings of Riviera > C12-133 ≥ A4-4 ≥ B3-6 ≥ Tifway > Princess 77 in 2017 and Riviera ≥ C12-133 ≥ A4-4 ≥ Tifway ≥ B3-6 > Princess 77 in 2018 (Table 5). 'Riviera' and 'Princess 77' exhibited the highest and the lowest shear strengths in both years. The shear strength of the experimental cultivars was comparable to that of 'Riviera' and 'Tifway'. Significant cultivar effects on the shear strength of bermudagrass cultivars has been reported[35,73], and our results agree with those of Deaton & Williams[35] in which 'Riviera' showed the highest shear strength. After averaging mowing and traffic treatments, the shear strength values of all cultivars were above the minimum acceptable value of 10 Nm[41] in both years, varying between 17.1–13.9 Nm (15.5, mean) and 15.0–12.0 (14.1, mean) in 2017 and 2018, respectively (Table 5). The values between 15–20 Nm corresponded to good shear strength. Except for 'Princess 77', all commercial and experimental cultivars in 2017, and only 'Riviera' (15.0 Nm) and 'C12-133' (14.9 Nm) in 2018, provided good shear strength. These findings justify the use of 'Riviera' and 'C12-133' as sports turf for playability.
The shear strength of turf is controlled by the combined effects of both turfgrass and soil characteristics[23]. Studies have indicated that shear strength is positively correlated with turfgrass root and shoot densities, turf cover, and verdure biomass and negatively correlated with soil moisture content[16,73,77,78]. Consistent with earlier studies, turf shear strength was positively correlated with the GCP (r = 0.46 and r = 0.73 in 2017 and 2018, respectively) and shoot density (r = 0.48 in 2018) in our study. However, no correlation was found between soil moisture and shear strength (data not shown). Mean soil moisture content ranged from 34.6 to 41.1 (35.9, mean) and 31.8 to 46.0 (34.3, mean) in 2017 and 2018, respectively, indicating that relatively similar moisture content was maintained during the study.
Surface hardness
-
Surface hardness, the ability of a surface to absorb the energy generated upon impact, is another important property of any playing surface[79]. Softer surfaces absorb a larger proportion of the energy generated upon impact than harder surfaces[80] and reduce the probability of a fall that can result in serious injury. Traffic stress increases surface hardness, which in turn increases the chances of lower extremity injury[79]. As expected, traffic stress significantly increased the surface hardness, which was more pronounced in intensively-trafficked plots in 2018 (Table 5). The average surface hardness values were lower in non-trafficked plots with 79.1 Gmax and 75.2 Gmax (in 2017 and 2018, respectively) and reached 86.5 Gmax (9% increase) and 96.1 Gmax (22% increase) in trafficked plots after two games per week in 2017 and after four games per week in 2018, respectively. Our results agree with those of Aldahir[73] in which non-trafficked bermudagrass had the softest surface. Traffic stress equivalent to three simulated games per week resulted in increased hardness (by 26%), whereas five games per week resulted in the hardest turf surface (44% increase). Surface hardness values of 70 to 89 Gmax have been identified as the safest for reducing lower extremity injury[81]. Therefore, our results indicate that the surface hardness of all trafficked cultivars were within the acceptable range after two simulated games per week in 2017, whereas it exceeded the preferred benchmark value after four simulated games per week in 2018.
The effect of mowing height on surface hardness was significant in 2017, and plots mowed at 5 cm provided a softer surface (81 Gmax) compared to plots mowed at less than 5 cm (85.0 Gmax). A similar trend was observed in 2018. Surface hardness is dependent on turfgrass and soil parameters, including soil moisture, compaction, amount of vegetation, and thatch[75]. Softer surface associated with higher cutting height is attributed to the greater amount of vegetation and thatch that can dissipate a portion of the compaction pressure because of the cushioning effect[2]. Cultivars had no significant effect on surface hardness values, which ranged from 80.4 to 85.3 Gmax and 83.8 to 89.6 Gmax in 2017 and 2018, respectively, after averaging traffic treatment and mowing height effects. However, Aldahir[73] reported significant variation in surface hardness among bermudagrass cultivars after simulated traffic in bermudagrass. In their work, surface hardness was greater for cultivars with lower biomass and shoot density[73]. This relationship was confirmed in our study, as indicated by a significant negative relationship between surface hardness and the GCP (r = −0.75) and shoot density (r = −0.52) after four simulated games per week (Table 4).
-
'Tifway' and 'Tifsport' hybrid bermudagrasses have been used on most athletic fields throughout the coastal Mediterranean region for more than 40 years due to their tolerance to heat, drought, and wear. The use of wear-tolerant cultivars is crucial to maintain adequate green turfgrass cover with aesthetic and functional quality for sports fields exposed to heavy traffic. Traffic stress significantly reduced the green cover, turfgrass quality, shoot density, chlorophyll index, the NDVI, and affected playability parameters by decreasing turf shear strength and increasing surface hardness. The wear damage was more pronounced at higher traffic stress. Surface hardness and turfgrass quality were acceptable after two simulated games per week but not after four simulated games per week. The cultivars with higher tiller density and finer leaf texture tolerated the simulated traffic better than cultivars with lower tiller density and coarser leaf texture. Among the cultivars tested, Riviera, A4-4, and C12-133 exhibited better traffic tolerance, indicating that they can be used in intensively-used turfgrass fields and other green areas in the Mediterranean region. Traffic stress affected bermudagrass more severely at higher mowing height. Therefore, turf managers may need to be more cautious with management practices such as mowing height during traffic stress. This study focused on the summer traffic period and measured the immediate response of bermudagrass to simulated traffic. However, the traffic tolerance of the bermudagrass cultivars tested and their response to mowing height may differ for fall–winter traffic stress because of seasonal differences in weather.
This research was supported by the Scientific and Technical Research Council of Turkey under project code TUBITAK TOVAG: 214 O 067. We would like to thank Murat Hocagil, Tijen Bahar, and Kenan Karayilan at Alata Horticultural Research Institute for their valuable technical support. We would like to thank A&L Scientific Editing (
www.alpublish.com ) for its linguistic assistance during the preparation of this manuscript.-
The authors declare that they have no conflicts of interest. Songul Sever Mutlu is the Editorial Board member of Grass Research who was blinded from reviewing or making decisions on the manuscript. The article was subject to the journal's standard procedures, with peer-review handled independently of this Editorial Board member and her research groups.
- Supplemental Fig. S1 Before the application of traffic stress in 2017.
- Supplemental Fig. S2 The Brinkman traffic simulator used in the study.
- Supplemental Fig. S3 The Brinkman traffic simulator used in the study.
- Supplemental Fig. S4 The research plots after two games per week of simulated traffic stress in 2017.
- Supplemental Fig. S5 The research plots after two games per week of simulated traffic stress in 2017.
- Supplemental Fig. S6 The research plots after four games per week of simulated traffic stress in 2018.
- Copyright: © 2023 by the author(s). Published by Maximum Academic Press, Fayetteville, GA. This article is an open access article distributed under Creative Commons Attribution License (CC BY 4.0), visit https://creativecommons.org/licenses/by/4.0/.
-
About this article
Cite this article
Sancar B, Mutlu SS, Basar EK. 2023. Traffic tolerance of bermudagrass (Cynodon spp.) as affected by cultivar and mowing height. Grass Research 3:15 doi: 10.48130/GR-2023-0015 

Traffic tolerance of bermudagrass (Cynodon spp.) as affected by cultivar and mowing height
- Received: 19 March 2023
- Accepted: 20 June 2023
- Published online: 21 August 2023
Abstract: Bermudagrass (Cynodon spp.), the grass of choice, is used on most sports fields and recreational areas in Mediterranean countries. Traffic is the most frequent, destructive abiotic stress imposed on intensively-used green areas. The objectives of this study were to evaluate the traffic tolerance of three seeded-type experimental bermudagrass cultivars ('A4-4', 'B3-6', 'C12-133'), compare their performance to those of commercial cultivars 'Riviera', 'Princess 77', and 'Tifway', and determine the effects of mowing height on traffic tolerance. A 2-year field study was conducted at Mersin, Turkey. The plots were maintained at 2.5-cm and 5.0-cm mowing heights. Simulated traffic was applied at two and four soccer games per week in 2017 and 2018, respectively. Traffic stress reduced the green cover percentage, quality, shoot density, chlorophyll index, and normalized difference vegetation index, and affected playability parameters by decreasing turf shear strength and increasing surface hardness. Surface hardness was within the acceptable range after two games per week. The cultivars with higher tiller density and finer leaf texture tolerated traffic better than those with lower tiller density and coarser leaf texture. All cultivars, except 'Princess 77' in 2017 and 'Riviera' and 'C12-133' in 2018, provided good shear strength. Traffic stress affected bermudagrass more severely at 5.0-cm mowing height than at 2.5-cm mowing height. In summary, 'Riviera', 'A4-4', and 'C12-133' exhibit superior traffic tolerance and offer great potential for use in sports fields and recreational areas. The use of improved, traffic-tolerant bermudagrass cultivars with proper mowing height may help to reduce damage caused by traffic stress and produce high-quality surfaces for playability.
-
Key words:
- Traffic /
- Cynodon dactylon /
- Sports field /
- Turf shear strength