


-
Drought is a major abiotic stress affecting plant growth which becomes even more intensified as water availability for irrigation is limited with current climate changes[1]. Timely detection and identification of drought symptoms are critically important to develop efficient and water-saving irrigation programs and drought-tolerance turfgrasses. However, turfgrass assessments of stress damages have been mainly using the visual rating of turf quality which is subjective in nature and inclined to individual differences in light perception that drives inconsistency in estimating color, texture, and pattern of stress symptoms in grass species[2−4]. Remote sensing with appropriate imaging technology provides an objective, consistent, and rapid method of detecting and monitoring drought stress in large-scale turfgrass areas, which can be useful for developing precision irrigation programs and high-throughput phenotyping of drought-tolerance species and cultivars in breeding selection[5].
Spectral reflectance and chlorophyll fluorescence imaging are emerging tools for rapid and non-destructive monitoring of drought effects in crops. These tools combine imaging and spectroscopy modalities to rigorously dissect the structural and physiological status of plants[6,7]. Spectral reflectance imaging captures reflected light (one out of three fates of light: reflect, absorb and transmit when striking leaf) at different wavelengths ranging from visible to near-infrared regions to characterize vegetation traits[8,9]. Within spectral reflectance imaging, multispectral imaging on one hand measures reflected light in three to ten different broad spectral bands in individual pixels[10,11]. Hyperspectral imaging on the other hand captures reflected light in narrow and more than 200 contiguous spectral bands. Some absorbed light by leaf is re-radiated back in the form of fluorescence and fluorescence imaging utilizes those lights in red and far-red regions to capture plant physiological status[12]. When drought progresses, plants start to develop various symptoms (physiological modifications) gradually over time[13]. Some of those symptoms include stomata closure, impediment in gas exchange, change in pigment composition and distribution which result in wilting and associated morphological alteration in leaf color (senescence), shape (leaf curling) and overall plant architecture. As different plant components or properties reflect light differently at different wavelengths and patterns of reflectance and fluorescence change along with plant stress and related symptoms development, spectral reflectance and fluorescence imaging provide accurate, reliable and detailed information for crop drought monitoring. Fluorescence imaging primarily based on fluorescing plant components or chlorophyll complex in photosynthetic antenna and reaction centers and therefore it mainly monitors stress development by tracking changes in overall photosynthetic performance or other metabolism that interfere with photosynthetic operation[9,14]. Multispectral imaging, hyperspectral imaging, or chlorophyll fluorescence has been used in different studies for plant responses to drought stress in various plant species[10,15−17]. The comparative approach of multiple imaging technologies could help to find the efficient methods for the evaluation of plant responses and tolerance to drought[18].
Vegetation indices derived from multispectral or hyperspectral imaging and fluorescence parameters typically are ratio or linear combinations of reflectance and fluorescence emissions from leaves or canopy of plants, respectively[19,20]. Canopy reflectance at different wavelengths and chlorophyll fluorescence varies with canopy color and density and changes with environmental conditions that affect plant growth, including drought stress[14,20,21]. These variations in reflectance and fluorescence are captured by vegetation indices, such as normalized difference vegetation index (NDVI) and fluorescence parameters including the ratio of variable fluorescence to maximum fluorescence (Fv/m) which are commonly used to evaluate environmental impact on plant growth. Other indices reflect physiological health of plants, such as photochemical reflectance index (PRI) has recently been reported to be useful for drought stress assessment in crops[19]. Previous research identified varying sensitivity of PRI and NDVI to detect water stress; for example, Sun et al.[22] found PRI to be a prominent indicator of drought stress whereas Kim et al.[20] discovered NDVI had greater correlation with drought stress development. There are also several conflicting findings on the responsiveness of fluorescence parameters to drought stress. Photochemical efficiency of PSII (Fv/Fm) was found to be greatly related to drought stress by Panigada et al.[23] but Jansen et al.[24] reported Fv/Fm to be relatively insensitive to drought progression. Lu & Zhang[25] identified that coefficient of photochemical quenching (qP) was insensitive to drought stress whereas Moustakas et al.[26] reported that (qP) being the most sensitive indicator of such stress conditions. There is a need for a comprehensive study that examines multiple vegetation indices (both hyperspectral and multispectral indices) and fluorescence parameters, and parallelly assess their sensitivities to reflect plant growth and physiological status during drought stress.
The objectives of the current study were: (1) to perform comparative analysis of drought responses of vegetation and photosynthetic indices using multispectral, hyperspectral and chlorophyll fluorescence imaging for Kentucky bluegrass (Poa pratensis L.), a cool-season perennial grass species widely used as turfgrass; (2) identify major vegetation and photosynthetic indices from the imaging technologies and correlated to visual turf quality and leaf relative water content from the destructive measurement; and (3) determine the major vegetation and photosynthetic indices that are most responsive or sensitive to the progression of drought stress that may be useful to early detection and monitoring the level of drought stress causing growth and physiological damages in cool-season grass species.
-
Sod strips of Kentucky bluegrass cultivar 'Dauntless' were collected from established field plots at the Rutgers Plant Science Research and Extension Farm, Adelphia, NJ, USA. Sods were planted in plastic pots of 18 cm diameter and 20 cm length filled with a mixture of soil (sandy loam, semi-active, mesic Typic Hapludult; pH 6.55; 260 kg·P·ha−1, 300 kg·K·ha−1) and sand in the ratio of 2/1 (v/v). Plants were established for 50-d in a greenhouse with 24/22 °C day/night average temperatures, 12-h average photoperiod and 750 μmol·m−2·s−1 average photosynthetically active radiation (PAR) with natural sunlight and supplemental lightings. Plants were well-watered, trimmed weekly to 100 mm and fertilized weekly with a 24–3.5–10 (N–P–K) fertilizer (Scotts Miracle-Gro) at the rate of 2.6 g·N·m−2 during the establishment period in the greenhouse. Once plants were well-established, they were moved to the controlled environmental growth chamber (GC72, Environmental Growth Chambers, Chagrin Falls, OH, USA). The growth chamber was controlled at 22/18 °C day/night temperature, 60% relative humidity, 12-h photoperiod and 650 μmol·m−2·s−1 PAR at the canopy level. Plants were allowed to acclimate for a week within the growth chamber conditions and then treatments were initiated.
Experimental treatments and design
-
There were two different treatments: well-watered control and drought stress. For the well-watered control, plants were irrigated once every two days with sufficient water until drainage occurred from the pot bottom or when soil water content reached the field capacity. Drought stress was imposed by withholding irrigation from each pot throughout the experiment period. Each treatment had five replicates. The experimental treatments were arranged as a complete randomized design with plants of both treatments randomly placed and relocated in the chamber twice each week to minimize effects of potential microenvironment variations in the growth chamber.
Measurements
Soil water content and plant growth and physiological traits
-
A time-domain reflectometry system (Model 6050 × 1; Soil Moisture Equipment, Santa Barbara, CA, USA) installed with 20 cm soil moisture probe was used to measure soil volumetric water content. Volumetric water content was measured every two days in each pot to track soil moisture dynamics in control and drought stress treatments. To assess plant responses at different soil moisture levels, turfgrass quality (TQ) and leaf relative water content (RWC) were evaluated. Turfgrass quality was visually rated on a scale of 1-9 depending upon canopy color, uniformity and density[27]. A rating of 1 indicates discolored and completely dead plants, 9 indicates lush green colored healthy plants and 6 indicates the minimum acceptable turfgrass quality. Leaf RWC was measured by soaking 0.2 g fresh leaves in distilled water overnight at 4 °C[28]. Turgid leaves after overnight soaking were oven dried at 70 °C to a constant dry weight. Leaf RWC was calculated as [(fresh weight – dry weight)/ (turgid weight – dry weight)] × 100.
Hyperspectral imaging of phenotypic responses to drought stress
-
Control and drought stress pots were scanned using a close-range benchtop hyperspectral imaging system (Resonon Inc., Bozeman, MT, USA) containing Pika XC2 camera equipped with 23 mm lens. This camera took images in spectral range of 400–1,000 nm with much detailed spectral resolution of 1.9 nm in 447 different spectral channels. The camera provided 1600 spatial pixels and maximum frame rate of 165 frames per second. It had 23.1° field of view and 0.52 milli-radians instantaneous field of view. Resonon hyperspectral imaging systems are line-scan imagers (also referred to as push-broom imagers) that collect spectral data from each pixel on one line at a time. Multiple lines are imaged when an object or pot kept in scanning stage of linear stage assembly underneath the camera is moved by a stage motor. Those line images are assembled to form a complete image. The systems had regulated lights placed above the linear stage assembly to create optimal conditions for performing the scans. Lights were at the same level as the lens on a parallel plane. Distance between lens and the top of grass canopy was maintained at 0.4 m for capturing the best representation of drought progression. All scans were performed using spectronon pro (Resonon Inc., Bozeman, MT, USA) software connected to the camera using a USB cable. Before performing a scan, the lens was appropriately focused, dark current noise was removed and the system was calibrated for reflectance measurement using a white tile provided by the manufacturer. To ensure distortion-free hyperspectral datacube with a unit-aspect-ratio image, benchtop system's swatch settings were adjusted using pixel aspect ratio calibration sheet also provided by the manufacturer. Once the system was ready, controlled- and stressed-pots were scanned individually every two days throughout the experiment. As the lens was focused centrally, obtained images were of the central grass area and were processed using spectronon pro data analysis software. The entire grass image was selected using a selection tool and the spectrum was generated. From each spectrum, vegetation indices were calculated either using built-in plugins or by manually creating algorithms. The list of vegetation indices calculated using image analysis is mentioned in Table 1.
Table 1. List of vegetation indices calculated using hyperspectral and multispectral image analysis for drought stress monitoring in Kentucky bluegrass. Name and number in subscript following the letter R in each formula represent the reflectance at individual light and particular wavelength.
Vegetation index Index abbreviation and formula Hyperspectral analysis Multispectral analysis Structure Independent Pigment Index SIPI = (R800 – R445) / (R800 + R680) SIPIm = (RNIR840 – RBlue444) / (RNIR840 + RRed668) Simple Ratio Index SRI = R800 / R675 SRIm = RNIR840 / RRed668 Plant Senescence Reflectance Index PSRI = (R680 –R500) / R750 PSRIm = (RRed668 – RBlue475) / RRededge740 Photochemical Reflectance Index PRI = (R570 – R531) / (R570 + R531) PRI = (RGreen560 – RGreen531) / (RGreen560 + RGreen531) Normalized Difference Vegetation Index NDVI = (R800 – R680) / (R800 + R680) NDVIm = (RNIR840 – RRed668) / (RNIR840 + RRed668) Normalized Difference Red Edge NDRE = (R750 – R705) / (R750 + R705) NDREm = (RRededge717 – RRed668) / (RRededge717 + RRed668) Multispectral imaging of phenotypic responses to drought stress
-
Micasense Rededge-MX dual camera system (AgEagle Sensor Systems Inc., Wichita, KS, USA) was used to collect multispectral images of controlled- and drought stressed-pots placed within a light box (1.2 m × 0.6 m × 0.6 m). The multispectral camera system had 1,280 × 960 resolution, 47.2° field of view and 5.4 mm focal length. The camera captured ten different spectral bands simultaneously on a command (Table 2). To allow the multispectral camera system, which was designed for aerial operation, to work in the light box settings, a downwelling light sensor (DLS) module provided by the manufacturer was installed to the camera system. Images were captured manually through WIFI connection from mobile devices or computer to the multispectral camera system. The sensor layout of the dual camera system, while causing negligible error in aerial condition, led to mismatching between spectral bands in a close distance, therefore, spectral bands needed to be overlapped during post-processing. The captured images of individual spectral bands were stored as separate .jpgf image files and then were used to calculate the relevant vegetation indices. Multispectral image analysis was executed using Python (Version 3.10) code by Rublee et al.[29]. Image analysis aligned ten spectral bands using Oriented FAST and Rotated BRIEF algorithm to achieve complete overlap between spectral band images. The reflectance correction panel provided by the manufacturer was used to account for the illumination condition in light box environment and the correction was reflected in pixel value adjustment for each band in python code; vegetation indices based on the aligned images were then calculated using the corresponding formula (Table 1). Images that included background noise were excluded from analysis.
Table 2. Spectral band details (center wavelength and band width) for Micasense Rededge-MX dual camera system.
Band name Central wavelength (nm) Band width (nm) Blue444 444 28 Blue475 475 32 Green531 531 14 Green560 560 27 Red650 650 16 Red668 668 14 RE705 705 10 RE717 717 12 RE740 740 18 NIR840 842 57 Chlorophyll fluorescence imaging of physiological response to drought stress
-
Chlorophyll fluorescence images were taken using a pulse amplitude modulated fluorescence imaging system (FC 800-O/1010, Photon System Instruments, Drasov, Czech Republic). A high-speed charge-coupled device (CCD) camera was mounted on a robotic arm placed in the middle of LED light panels. The camera had 720 × 560 pixels spatial resolution, 50 frames per second frame rate and 12-bit depth. Four different LED light panels each of 20 cm × 20 cm size were equipped with 64 orange-red (617 nm) LEDs in three panels and 64 cool-white LEDs (6,500 k) in the rest of one panel. Before making measurements, plants were dark-adapted for 25 min in a dark room to open all PSII reaction centers. The distance between camera and the top of the grass canopy was maintained at 0.3 m while taking images to ensure optimum quality. Images were acquired following the Kautsky effect measured in a pulse amplitude modulated mode[30,31]. Briefly, dark-adapted plants were first exposed to non-actinic measuring light for 5 s to measure minimum fluorescence at the dark-adapted state (Fo). Plants were immediately exposed to 800 ms saturation pulse of 3,350 µmol·m−2·s−1 to measure maximum fluorescence after dark adaptation (Fm). They were kept under dark relaxation for 17 s and then exposed to actinic light 750 µmol·m−2·s−1 for 70 s. Plants were exposed to a series of saturating pulses at 8 s, 18 s, 28 s, 48 s and 68 s during their exposure to actinic light conditions and maximum fluorescence at different light levels and steady state were measured. They were kept under dark relaxation again for 100 s and irradiated with saturating pulses at 28 s, 58 s and 88 s during dark relaxation for measuring maximum fluorescence during the relaxation. Selected durations for each light and dark relaxation state were preset in default quenching-act2 protocol of the fluorescence imaging system. Fluorescence at different light levels and steady states were used to calculate several fluorescence parameters (Table 3).
Table 3. Chlorophyll fluorescence parameters calculated from pulse amplitude modulated fluorescence imaging system.
Chlorophyll fluorescence parameter Formula Maximum photochemical efficiency of PSII (Fv / Fm) (Fm-Fo) / Fm Photochemical efficiency of open PSII centers
(F'v / F'm)(F'm – F'o) / F'm Actual photochemical quantum yield of PSII centers Y(PSII) (F'm – Fs) / F'm Photochemical quenching coefficient (Puddle model; qP) (F'm – Fs) / (F'm – F'o) Photochemical quenching coefficient (Lake model; qL) qP × F'o / Fs Non-photochemical quenching coefficient (qN) (Fm-F'm) / Fm Non-photochemical quenching (NPQ) (Fm-F'm) / F'm Chlorophyll fluorescence decrease ratio (Rfd) (Fm-Fs) / Fs Statistical analysis
-
The two-way repeated measure analysis of variance was performed to determine treatment effects and t-test was performed to compare control and drought stress treatments at a given day of measurement. Correlation analysis using all individual observations (five replications for each control and drought stress treatments) was performed to determine the relationship among all measured traits, vegetation indices and fluorescence parameters. Partial least square regression (PLSR) models were developed in SAS JMP (version 13.2; SAS Institute, Cary, NC, USA) for comparing hyperspectral, multispectral and chlorophyll fluorescence imaging in their overall associations with physiological assessments of drought stress. Vegetation indices and fluorescence parameters from individual imaging technologies were predictor variables, and turfgrass quality and leaf relative water content were response variables. A leave one out cross validation approach was used to develop the best performing partial least square model for each imaging technology. A model was first established with all predictor variables and the variable with the lowest importance was removed from the dataset and the model was rebuilt with the remaining variables. The rebuilt model was re-validated using leave one out cross validation and assessed checking root mean PRESS and percent variation explained for cumulative Y values. From each loop of operation, one variable was removed, and a new model was developed. The whole process ended when the last variable was removed and thus no more models could be developed. Finally, a series of models was obtained, and they were compared to identify a model with the highest accuracy for individual imaging technologies. The best performing model from each imaging technology was used to estimate turfgrass quality and leaf relative water content.
-
The initial soil water content prior to drought stress was maintained at the field capacity of 29% and remained at this level in the well-watered control treatment during the entire experimental period (20 d) (Fig. 1a). SWC in the drought treatment significantly decreased to below the well-watered treatment, beginning at 4 d, and declined to 5.8% by 20 d.
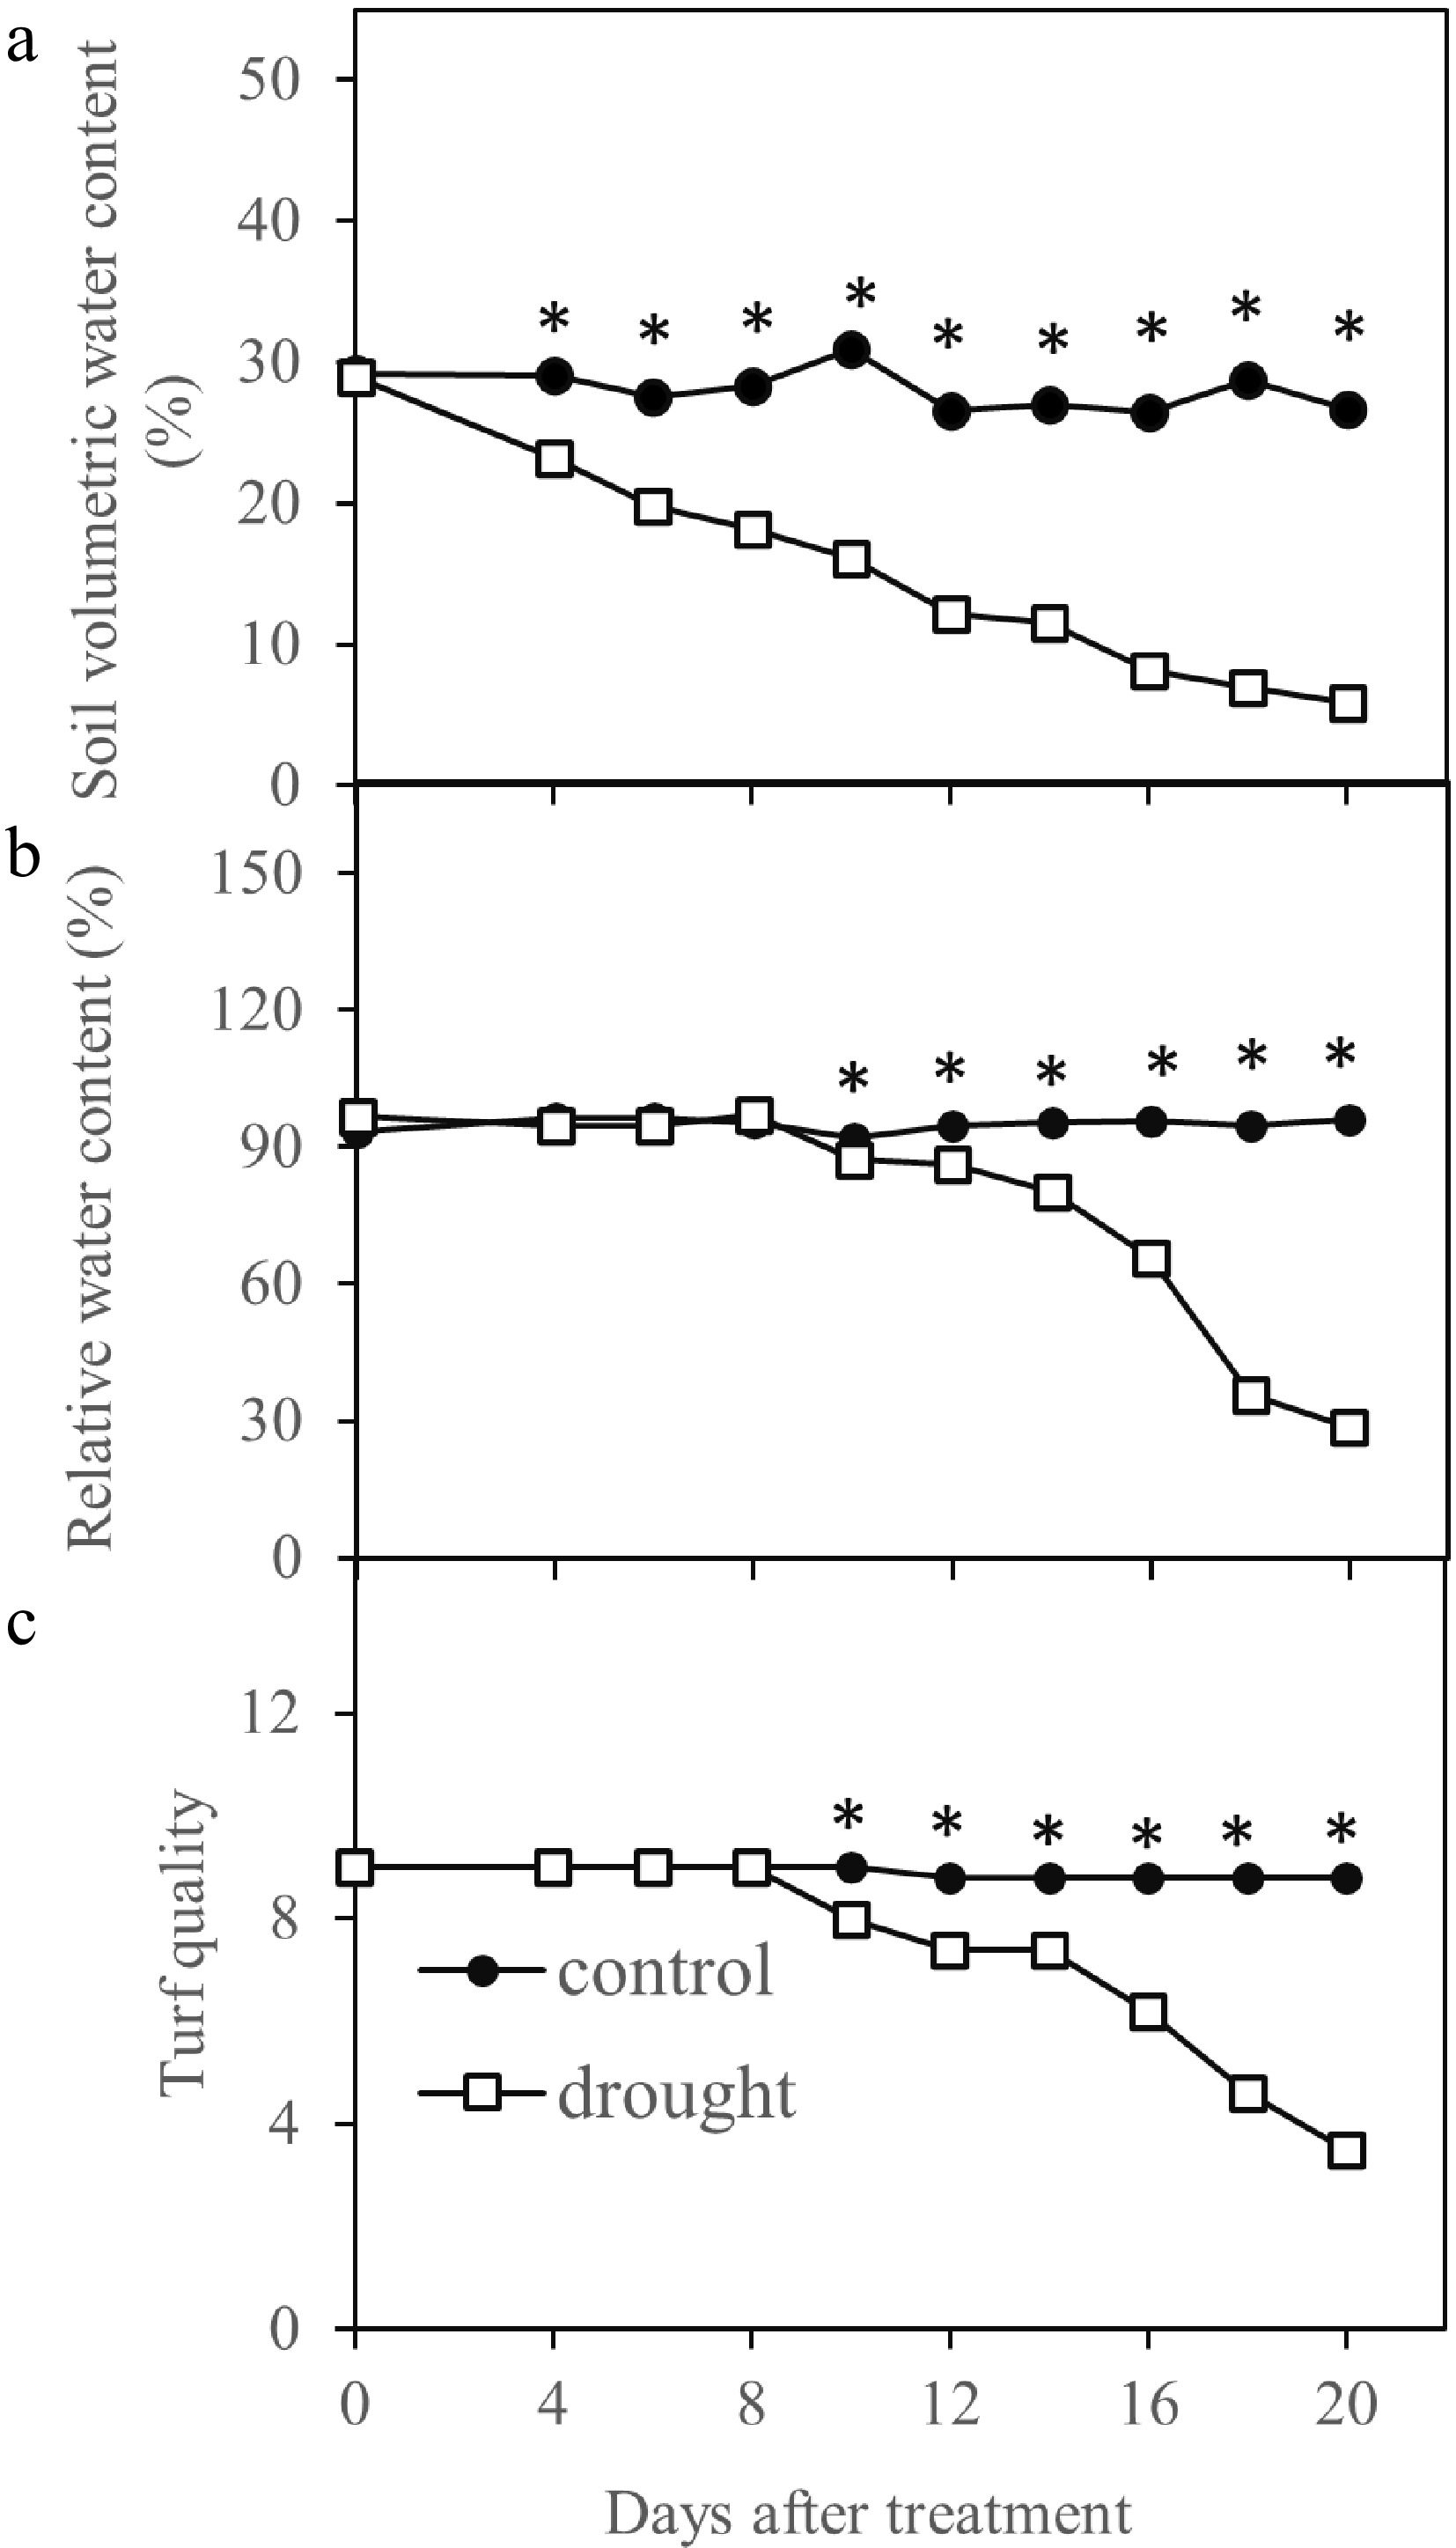
Figure 1.
Drought stress affected turf quality, leaf relative water content and soil volumetric water content during 20 d of stress period in Kentucky bluegrass. * indicates significant difference between control and drought stress treatments (p ≤ 0.05) at each day of measurement. Presented values represent average of five data points.
Leaf RWC was ≥ 93% in all plants prior to drought stress and declined to a significantly lower level than that of the control plants, beginning at 10 d of treatment when SWC declined to 16% (Fig. 1b). TQ began to decrease to a significantly lower level than the that of the well-watered plants at 10 d of drought stress at RWC of 87% and SWC of 16%, and further declined to the minimally acceptable level of 6.0 at 16 d of drought stress when RWC decreased to 66% and SWC dropped to 8% during drought stress (Fig. 1c).
Hyperspectral and multispectral imaging of phenotypic responses to drought stress
-
Most hyperspectral imaging indices, including SIPI (Fig. 2a), SRI (Fig. 2b), PRI (Fig. 2d), NDVI (Fig. 2e) and NDRE (Fig. 2f) exhibited a declining trend during 20-d drought stress while PSRI (Fig. 2C) showed increases during drought stress. The index value of drought-stressed plants became significantly lower than that of the well-watered plants, beginning at 14 d for SIPI and SRI, 16 d for PRI and PSRI, and 18 d for NDVI and NDRE. The multispectral SIPIm and SRIm did not differ between drought-stressed plants from the control plants until 18 d of treatment (Fig. 3a, b) while NDVIm, NDREm , PRIm , and PSRIm values were significantly lower than those of well-watered control plants at 16 d of drought stress (Fig. 3c−f).
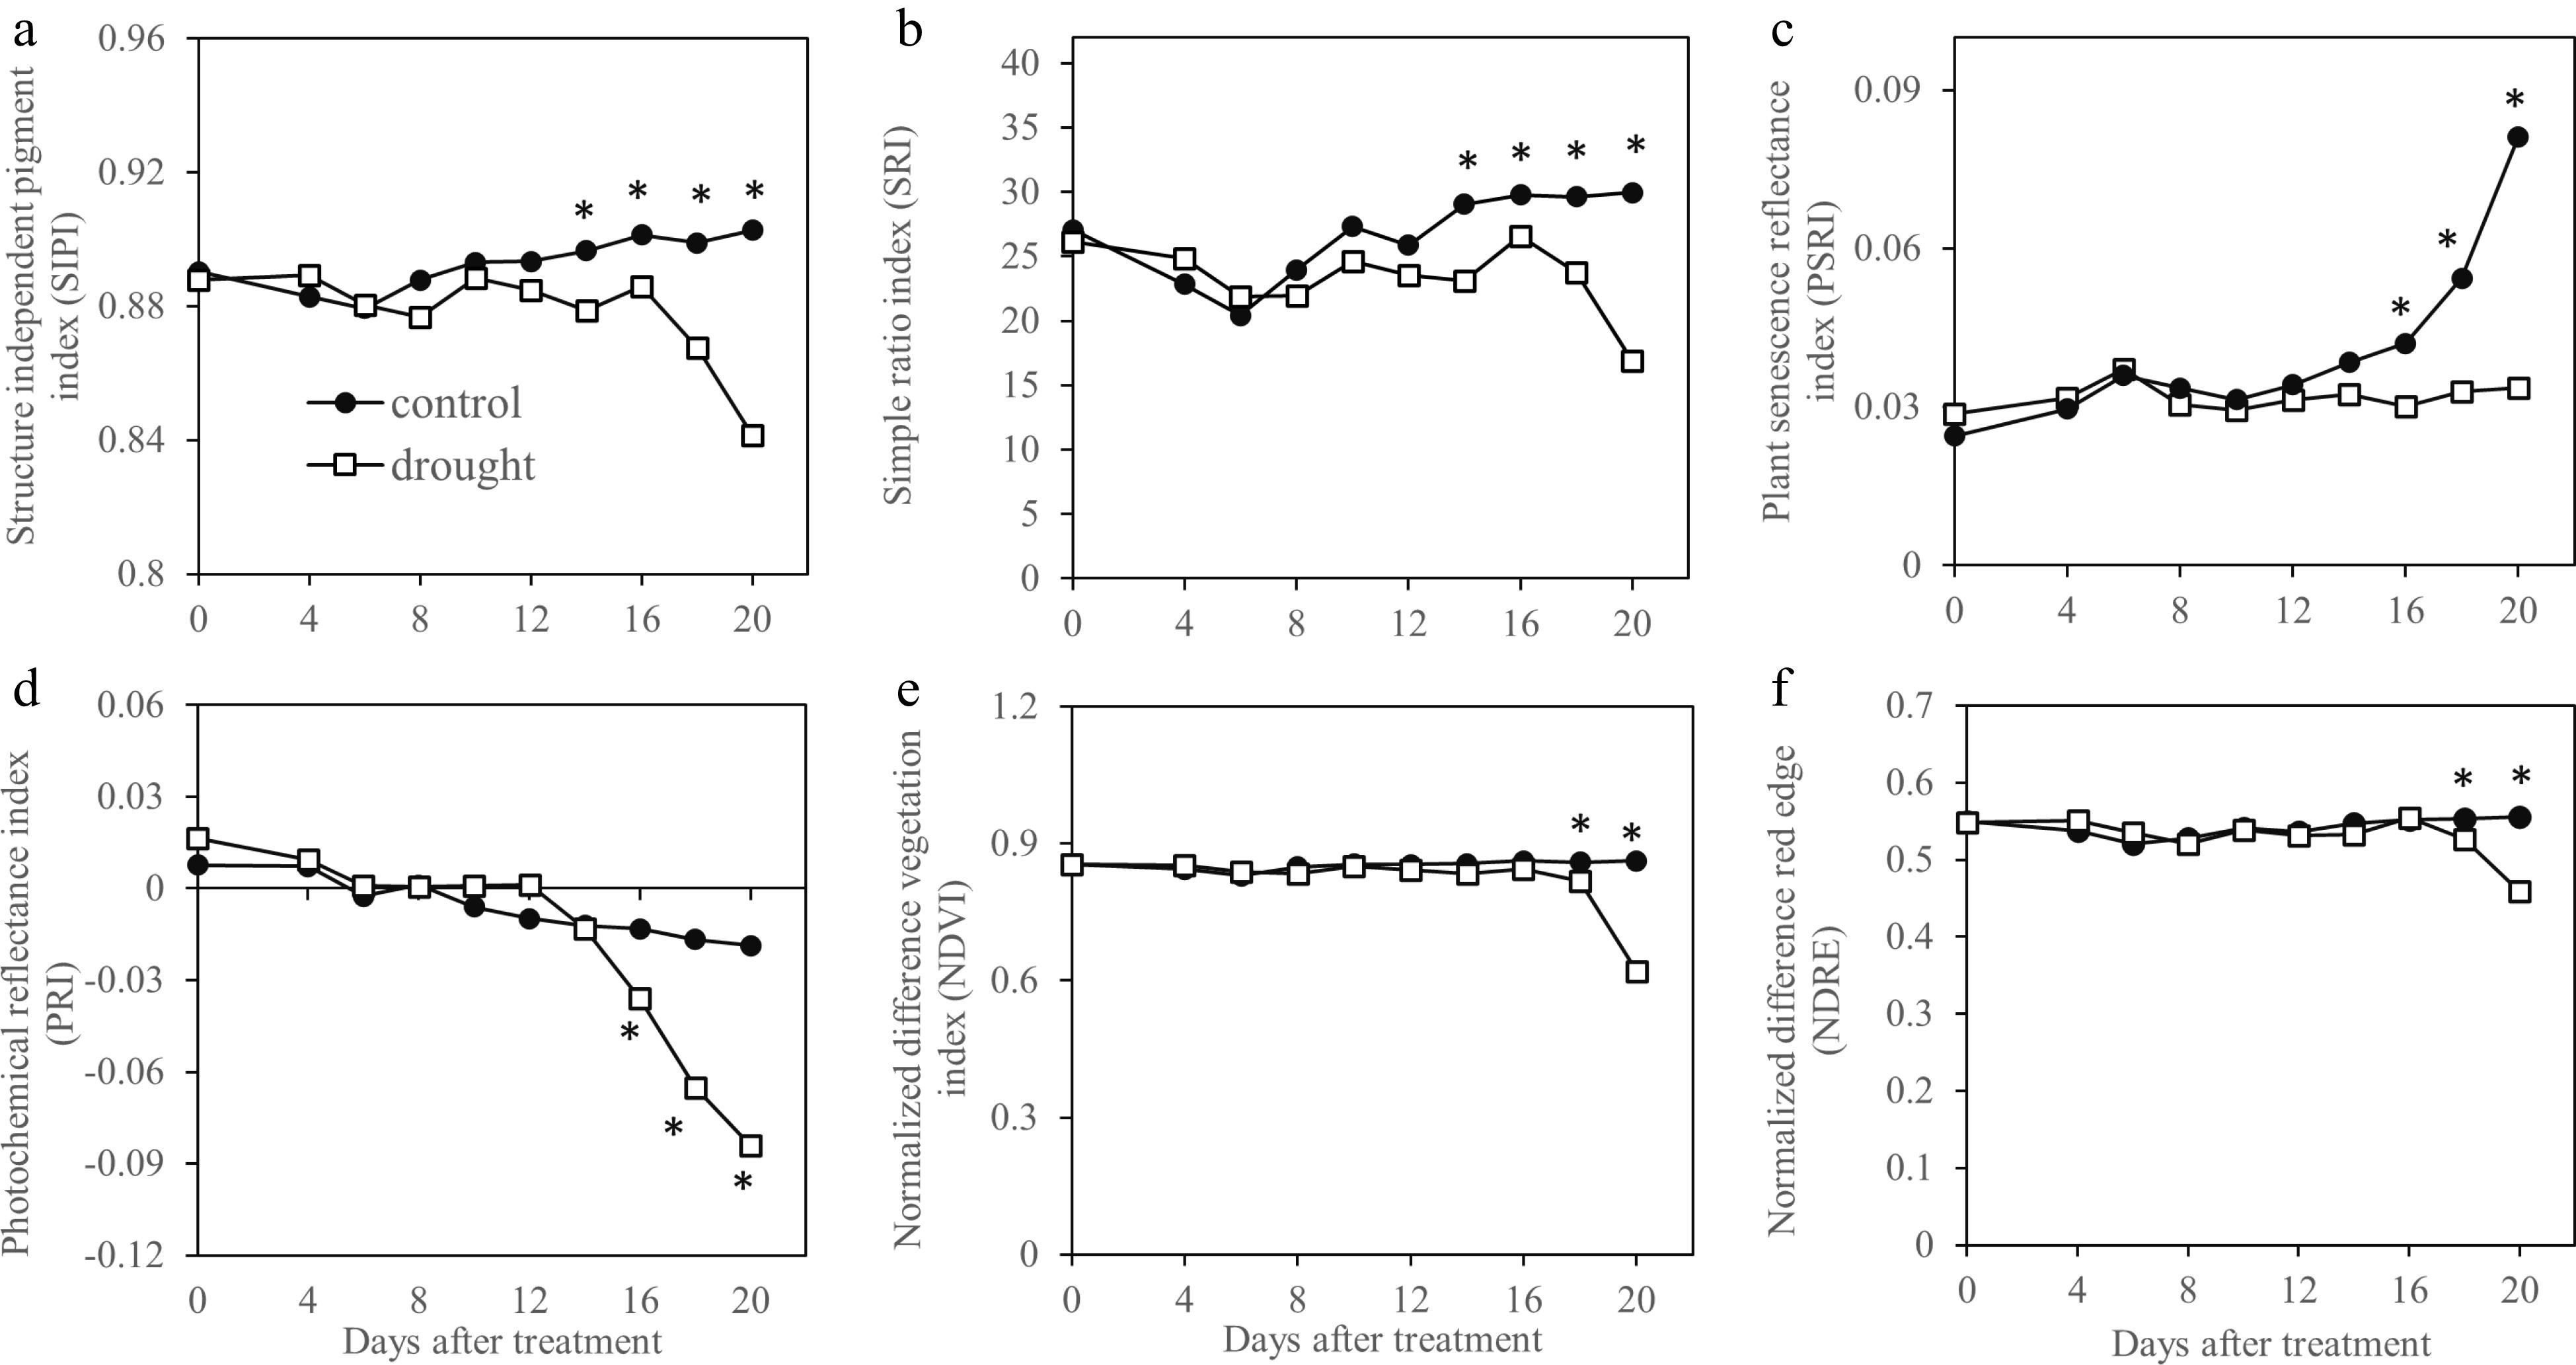
Figure 2.
Vegetation indices generated by hyperspectral sensing and sensitivity of these indices in monitoring drought in Kentucky bluegrass exposed to 20 d of drought stress. * indicates significant difference between control and drought stress treatments (p ≤ 0.05) at each day of measurement. Presented values represent average of five data points.
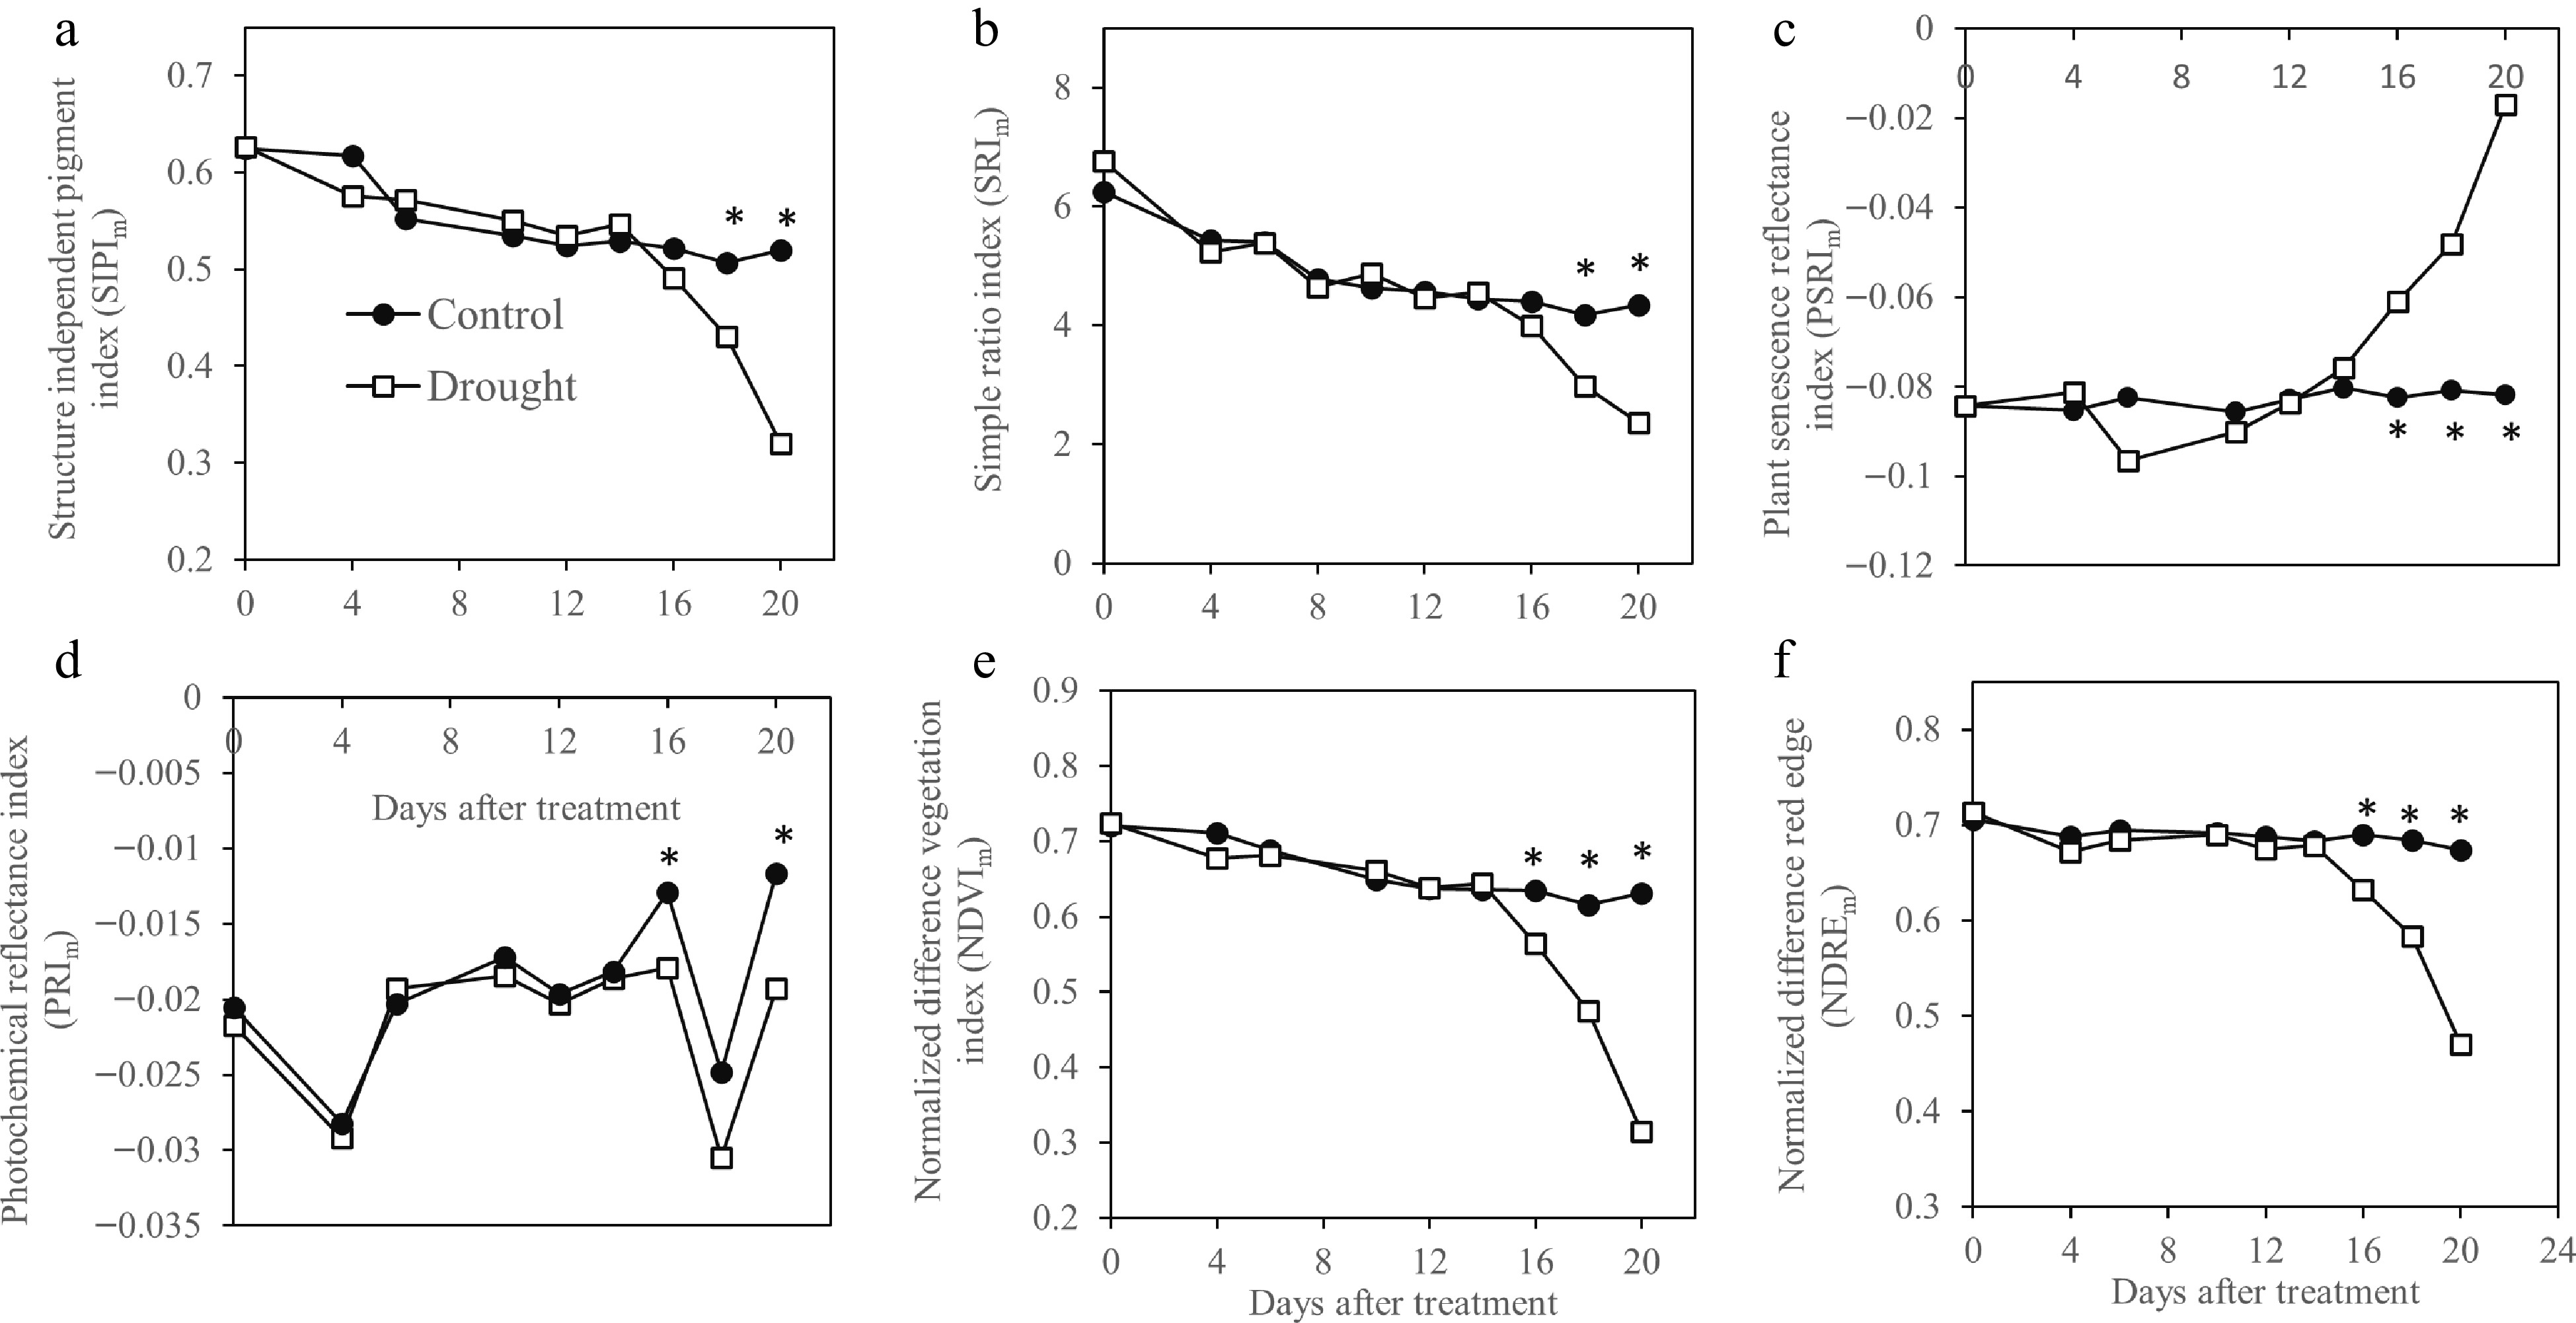
Figure 3.
Vegetation indices generated by multispectral image analysis and sensitivity of these indices in monitoring drought in Kentucky bluegrass exposed to 20 d of drought tress. * indicates significant difference between control and drought stress treatments (p ≤ 0.05) at each day of measurement. Presented values represent average of five data points.
Chlorophyll fluorescence imaging of photosynthetic responses to drought stress
-
Chlorophyll fluorescence indices detected drought damages in leaf photosynthesis systems, as shown by declines in different indices during drought stress (Fig. 4). Drought-stressed plants exhibited significant lower chlorophyll fluorescence levels than that of the well-watered plants, beginning at 12 d for NPQ (Fig. 4a), 16 d for Fv/Fm (Fig. 4b), and 18 d for F'V/F'm (Fig. 4c), Y(PSII) (Fig. 4d), qP (Fig. 4e), and qL (Fig. 4f). Separation between drought-stressed and well-watered plants were also evident in index- or parameter- generated images (Fig. 5).
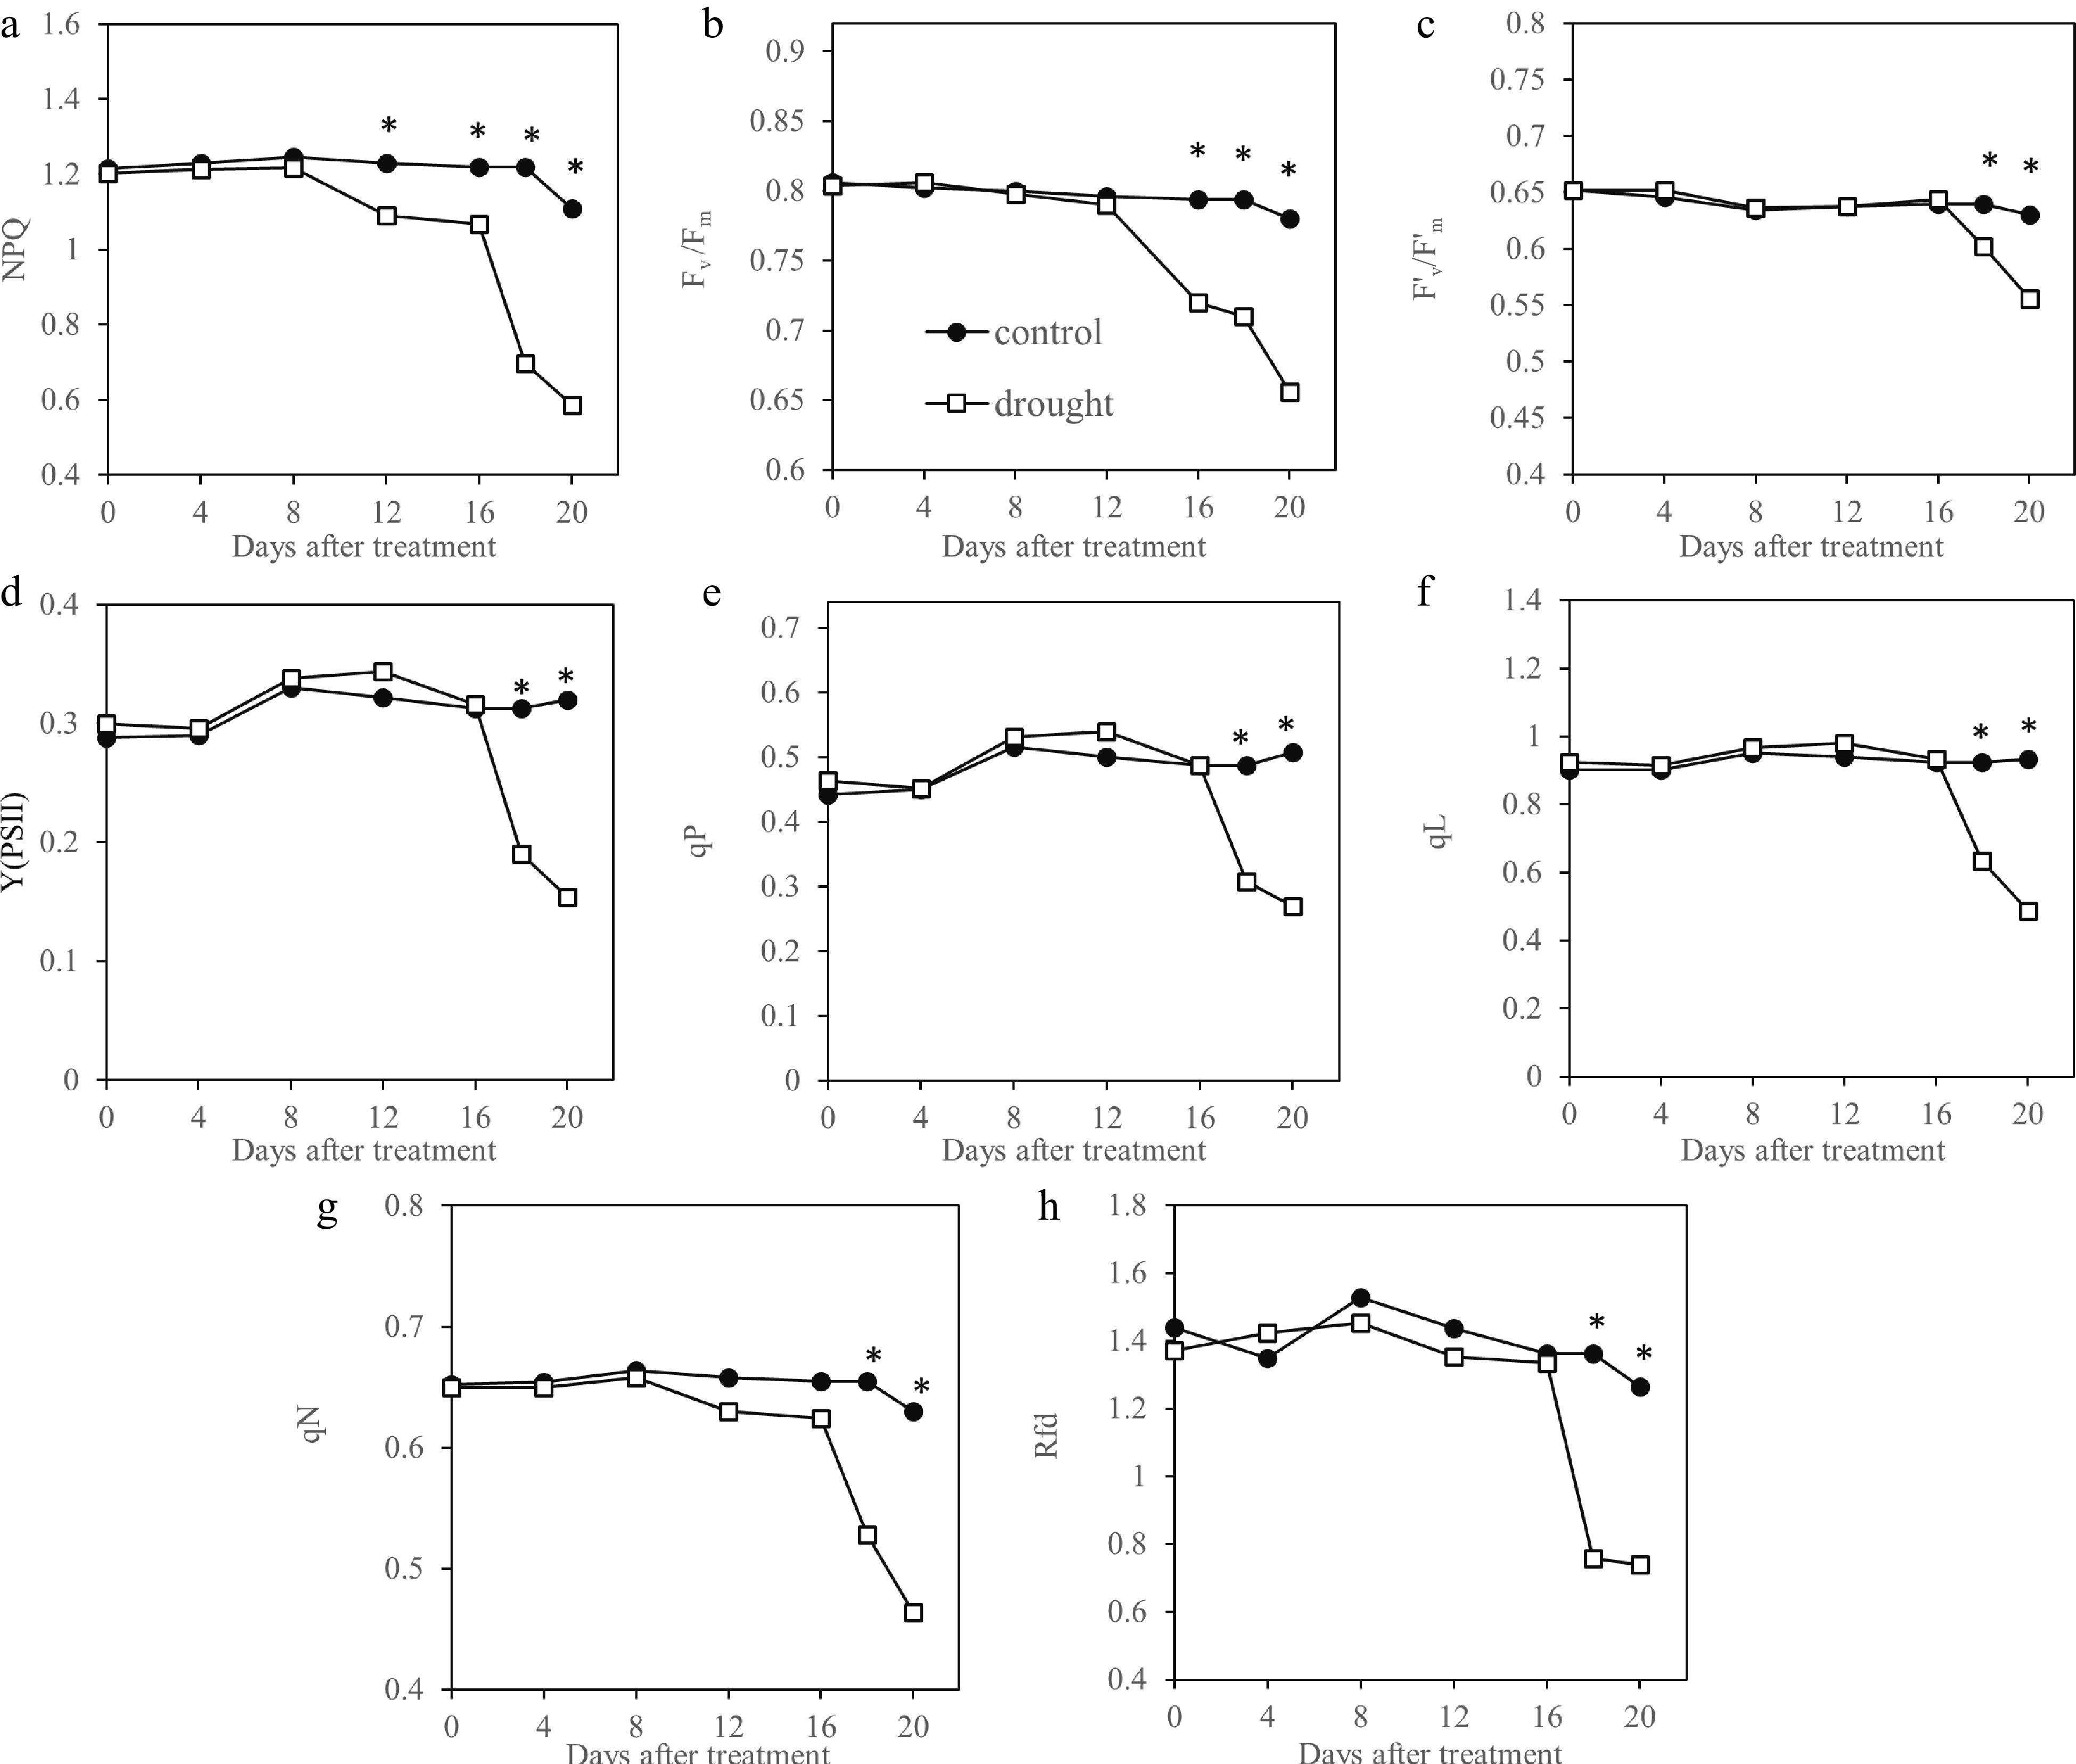
Figure 4.
Chlorophyll fluorescence parameters measured by pulse amplitude modulated fluorescence imaging system and detection of drought by these parameters in Kentucky bluegrass exposed to 20 d of drought stress. * indicates significant difference between control and drought stress treatments (p ≤ 0.05) at each day of measurement. Presented values represent average of five data points. NPQ, Non-photochemical quenching; Fv /Fm, Maximum photochemical efficiency of PSII; F'v/F'm, Photochemical efficiency of open PSII centers; Y(PSII), Actual photochemical quantum yield of PSII centers; qP, Photochemical quenching coefficient (Puddle model); qL, Photochemical quenching coefficient (Lake model); qN, Non-photochemical quenching coefficient; Rfd, Chlorophyll fluorescence decrease ratio.
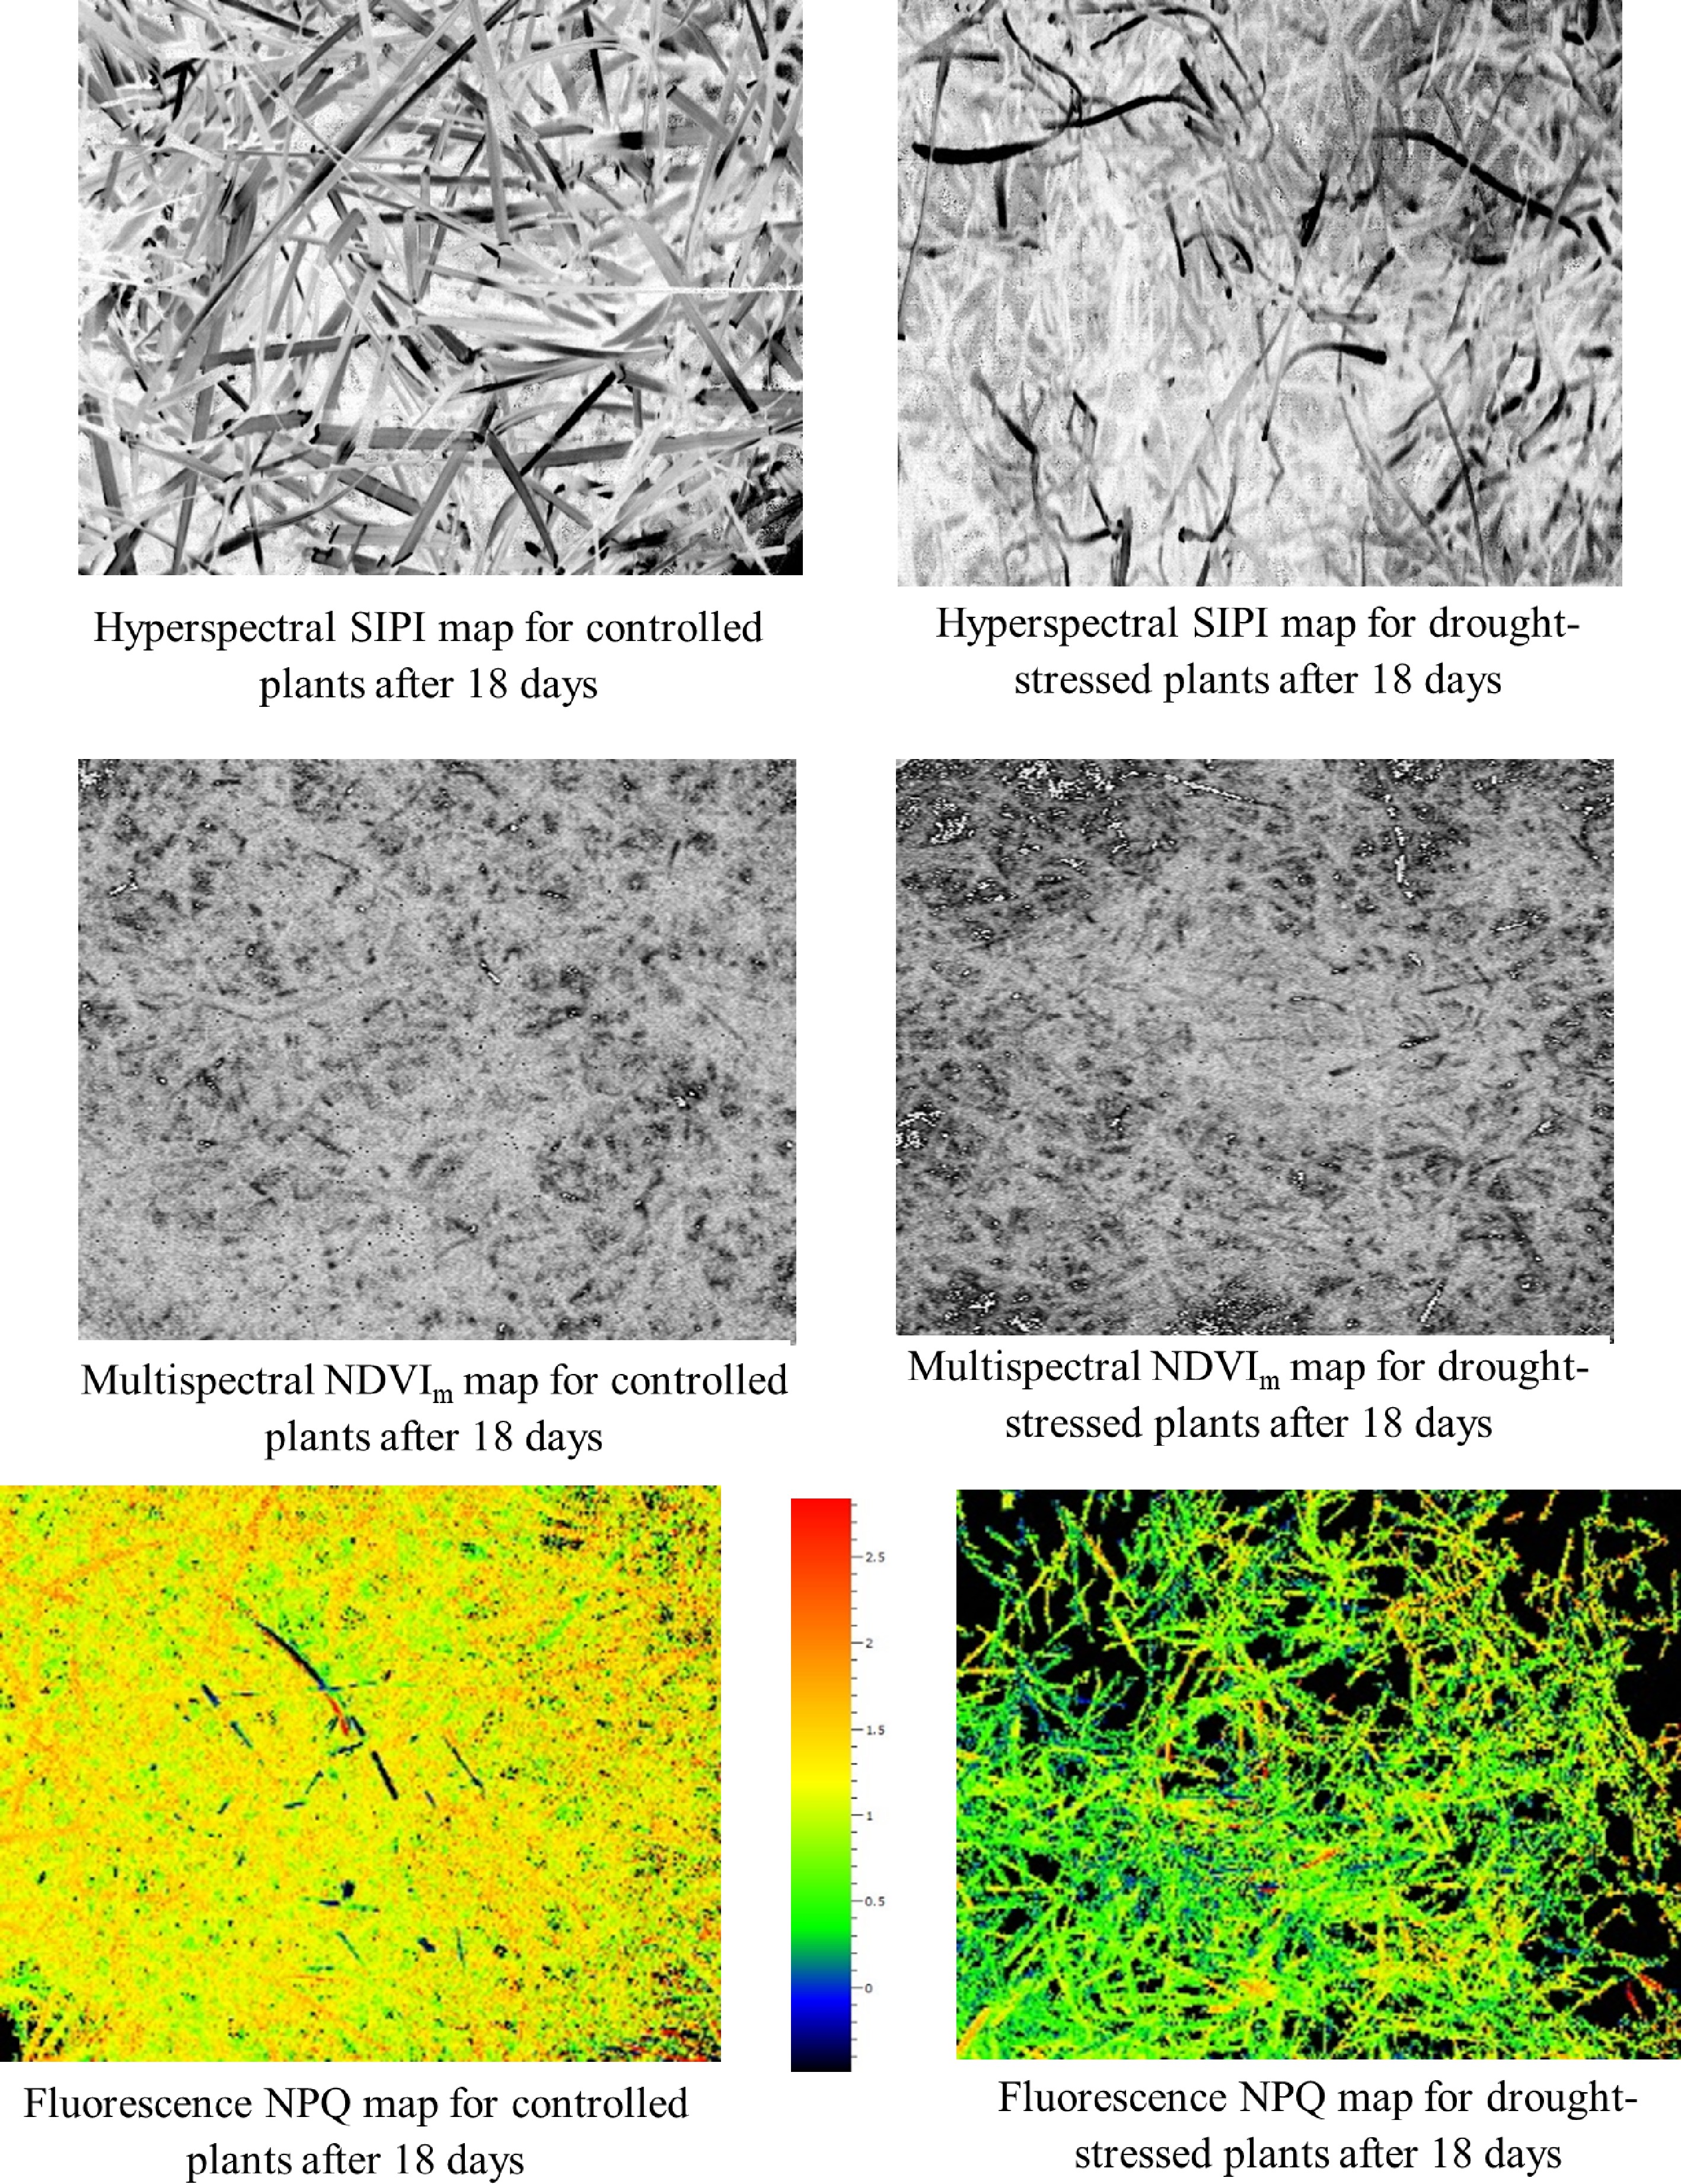
Figure 5.
Maps generated by the three most drought sensitive indices and parameters [hyperspectral structure independent pigment index (SIPI), multispectral normalized difference vegetation index (NDVIm) and chlorophyll fluorescence NPQ]. These maps clearly separated control and drought stress after 18 d of treatment when majorities of indices and parameters detected drought stress.
Correlation among individual imaging indices associated with phenotypic and photosynthetic responses to drought stress
-
Leaf RWC and TQ had significant correlation with most of indices and parameters calculated using three different imaging sensors (hyperspectral, multispectral and chlorophyll fluorescence) (Table 4). Among the indices, RWC had the strongest correlations with chlorophyll fluorescence NPQ (r = 0.88) and qL (r = 0.89), hyperspectral PRI (r = 0.94), and multispectral PSRIm (−0.92). TQ was most correlated to chlorophyll fluorescence NPQ (r = 0.89), hyperspectral PSRI (r = −0.90), and multispectral PSRIm (r = −0.85).
Table 4. Correlations among several physiological traits, vegetation indices and chlorophyll fluorescence parameters.
RWC TQ FV/Fm F'v/F'm Y(PSII) NPQ qN qP qL Rfd SIPI SRI PSRI PRI NDVI NDRE WBI SIPIm PSRIm PRIm NDVIm NDREm RWC 1.00 TQ 0.95* 1.00 FV/Fm 0.87* 0.85* 1.00 F'v/F'm 0.81* 0.77* 0.95* 1.00 Y(PSII) 0.85* 0.74* 0.80* 0.74* 1.00 NPQ 0.88* 0.89* 0.95* 0.84* 0.75* 1.00 qN 0.84* 0.83* 0.96* 0.84* 0.77* 0.96* 1.00 qP 0.82* 0.70* 0.73* 0.66* 0.99* 0.69* 0.72* 1.00 qL 0.89* 0.81* 0.90* 0.86* 0.97* 0.83* 0.86* 0.95* 1.00 Rfd 0.84* 0.82* 0.89* 0.83* 0.77* 0.92* 0.86* 0.72* 0.83* 1.00 SIPI 0.84* 0.71* 0.63* 0.58* 0.51* 0.57* 0.69* 0.48* 0.60* 0.46* 1.00 SRI 0.57* 0.62* 0.44* 0.45* 0.33 0.41* 0.45* 0.30 0.40 0.33 0.83* 1.00 PSRI −0.83* −0.90* −0.90* −0.86* −0.76* −0.83* −0.87* −0.71* −0.86* −0.76* −0.75* −0.57* 1.00 PRI 0.94* 0.82* 0.80* 0.76* 0.71* 0.79* 0.71* 0.66* 0.77* 0.78* 0.26 0.17 −0.78* 1.00 NDVI 0.53* 0.65* 0.41* 0.43* 0.41* 0.42* 0.40 0.38 0.43* 0.42* 0.50* 0.42* −0.54* 0.31 1.00 NDRE 0.64* 0.73* 0.64* 0.63* 0.45* 0.54* 0.64* 0.40 0.56* 0.44* 0.92* 0.85* −0.75* 0.33 0.50* 1.00 SIPIm 0.52* 0.50* 0.56* 0.58* 0.47* 0.52* 0.49* 0.43* 0.52* 0.51* 0.33 0.28 −0.58* 0.61* 0.27 0.39 −0.28 1.00 PSRIm −0.92* −0.85* −0.85* −0.85* −0.83* −0.80* −0.77* −0.79* −0.88* −0.77* −0.40 −0.23 0.77* −0.82* −0.41 −0.40 0.32 −0.52* 1.00 PRIm 0.20 −0.03 0.06 −0.01 0.28 0.14 0.11 0.31 0.20 0.18 0.05 0.10 0.01 −0.04 0.00 0.09 0.06 0.09 −0.04 1.00 NDVIm 0.75* 0.74* 0.77* 0.78* 0.67* 0.72* 0.68* 0.62* 0.73* 0.70* 0.43* 0.33 −0.76* 0.81* 0.37 0.47* −0.35 0.93* −0.76* −0.05 1.00 NDREm 0.90* 0.89* 0.89* 0.89* 0.81* 0.83* 0.81* 0.76* 0.88* 0.81* 0.52* 0.41* −0.87* 0.87* 0.45* 0.53* −0.32 0.62* −0.87* −0.04 0.85* 1.00 Details for individual abbreviations of vegetation indices and fluorescence parameters used in this table were previously mentioned in Tables 1 & 3. Some other abbreviations are: RWC, leaf relative water content; and TQ, turfgrass quality. Values followed by * indicate significant correlation at p ≤ 0.05. Correlation analysis was performed using all individual data points (five replications for each control and drought stress treatments). Correlations among different vegetation indices and parameters were also significant in many cases. Hyperspectral indices such as PSRI and PRI were significantly correlated with all multispectral indices except PRIm. Multispectral NDVIm and NDREm were significantly correlated with all hyperspectral indices. When hyperspectral and multispectral indices were correlated with chlorophyll fluorescence parameters, majorities of these indices significantly associated with fluorescence parameters with exceptions of multispectral PRIm which had weak and positive (r ranges 0.06 to 0.31) associations with fluorescence parameters.
Prediction of turf quality and leaf relative water content using integrated indices from hyperspectral imaging, multispectral imaging, and chlorophyll fluorescence
-
Partial least square regression models were developed by integrating all indices from individual imaging technologies which identified the most reliable imaging systems to detect and monitor plant responses to drought stress. The PLSR model developed using hyperspectral imaging indices had improved predictability (root mean PRESS ≤ 0.38 and percent variation explained ≥ 87) compared to such models developed using other imaging systems and associated indices (Table 5). Comparing multispectral imaging with chlorophyll fluorescence imaging, multispectral imaging had slightly better predictability [root mean PRESS = 0.40 (RWC) and 0.44 (TQ) and percent variation explained = 86 (RWC) and 83 (TQ)] considering similar number of predictor variables used for estimating TQ and RWC in all imaging systems.
Table 5. Summary of partial least square model showing predictability of individual models using specific numbers of predictor variables (identified by leave one out cross validation) generated by different sensing technologies. Details of individual abbreviations are mentioned in previous tables. Partial least square was performed using all individual data points (five replications for each control and drought stress treatments).
Sensing technology used for prediction Predicted
variableNo. of predictors used Predictor variables Root mean
PRESSPercent variation explained
for cumulative YCumulative Q2 Hyperspectral TQ 4 PRI, PSRI, NDRE, SIPI 0.36 87 0.99 RWC 4 PRI, PSRI, NDRE, SIPI 0.38 89 0.99 Multispectral TQ 3 PSRIm, NDVIm, NDREm 0.44 85 0.97 RWC 3 PSRIm, NDVIm, NDREm 0.40 86 0.97 Chlorophyll fluorescence TQ 4 Fv/Fm, NPQ, qN, qL 0.46 83 0.95 RWC 3 Fv/Fm, NPQ, qL 0.59 84 0.93 The integrated indices from each of the three imaging systems were highly correlated to TQ, with R2 of 0.90, 0.85, and 0.83 for hyperspectral imaging, multispectral imaging, and chlorophyll fluorescence, respectively (Fig. 6). For RWC, the correlation R2 was 0.88, 0.84, and 0.80, respectively with hyperspectral imaging, multispectral imaging, and chlorophyll fluorescence. The hyperspectral imaging was better be able to predict TQ and RWC compared to other imaging systems (Fig. 6).
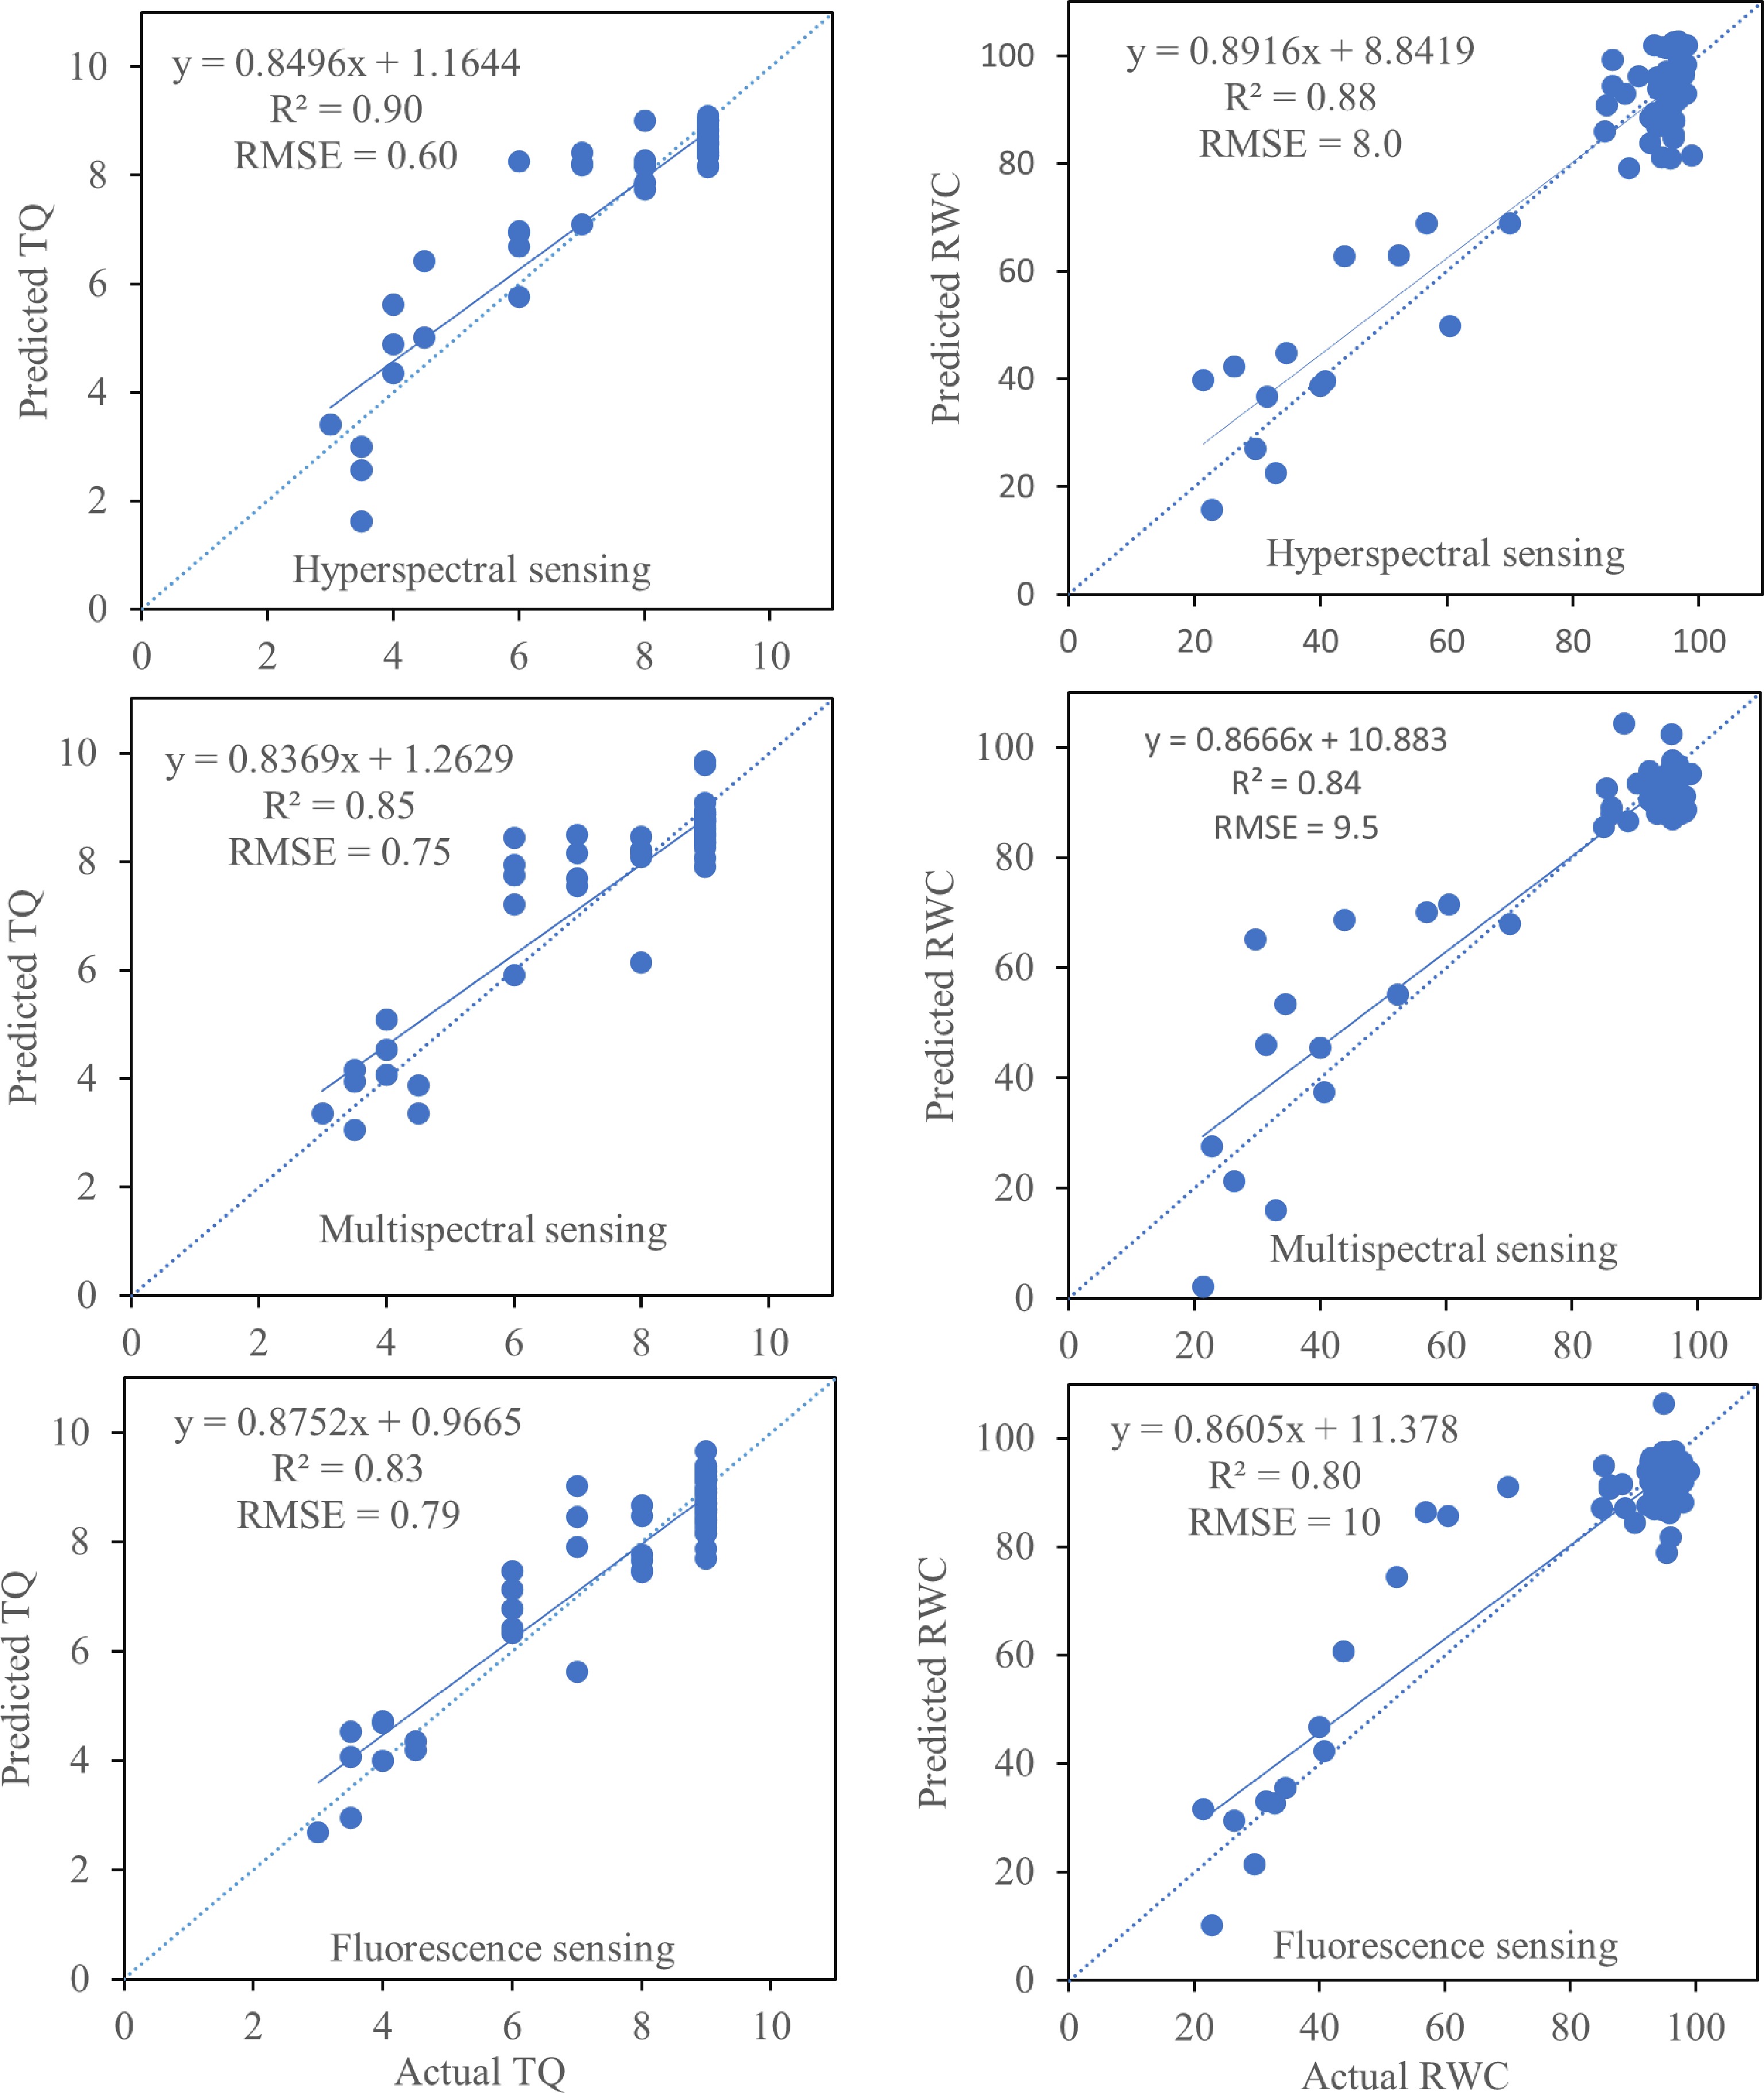
Figure 6.
Comparison of predicted turfgrass quality (TQ) and leaf relative water content (RWC) versus their measured values using partial least square regression model. Turfgrass quality and relative water contents were predicted using various indices generated by hyperspectral, multispectral and chlorophyll fluorescence sensing technologies. The dashed line represents the I:I line. Regression analysis was performed using all individual data points (five replications for each control and drought stress treatments).
-
Leaf RWC and TQ are the two most widely used parameters or traits to evaluate turfgrass responses to drought stress[28,32,33]. In this study, RWC detected water deficit in leaves at 10 d of drought stress when SWC declined to 16% and TQ declined to below the minimal acceptable level of 6.0 at 16 d of drought stress when RWC decreased to 66% and SWC dropped to 8% during drought stress. These results suggested that RWC was a sensitive trait to detect water stress in plants, which is in agreement with previous research[34,35]. However, leaf RWC is a destructive measurement and TQ is a subjective estimate. Nondestructive and quantitative detection of stress symptoms in plants through assessing changes in phenotypic and physiological responses of plants to drought stress is critical for developing water-saving irrigation programs and breeding selection traits to increase water use efficiency and improve plant tolerance to drought stress. In this study, some of the phenotypic traits assessed by hyperspectral and multispectral imaging analysis and photosynthetic parameters measured by chlorophyll fluorescence were highly correlated to leaf RWC or visual TQ, as discussed in detail below, which could be used as non-destructive indicators or predictors for the level of drought stress in Kentucky bluegrass and other cool-season turfgrass species.
The strong correlation of integrated indices from each of the three imaging systems with TQ (R2 of 0.90, 0.85, and 0.83, respectively) and RWC (R2 of 0.88, 0.84, and 0.80, respectively) for hyperspectral imaging, multispectral imaging, and chlorophyll fluorescence suggested that all three non-destructive imaging systems could be used as a non-destructive technique to detect and monitor water stress in Kentucky bluegrass. However, the hyperspectral imaging indices had higher predictability to RWC and visual TQ compared to the indices from multispectral imaging and chlorophyll fluorescence based on the PLSR models. Hyperspectral imaging used in this study captured images in 447 different spectral bands and gathered much more details about individual components of entire vegetation as each component has its own spectral signature. Multispectral imaging captures images with ten spectral bands and chlorophyll fluorescence imaging used only emitted red and far-red lights to snap images. Nevertheless, our results suggested that the PLSR models by integrating all indices from each individual imaging technologies identified the most reliable imaging systems to detect and monitor plant responses to drought stress in this study.
The indices derived from the three imaging systems varied in their correlation to RWC or TQ in Kentucky bluegrass in this study. Among the indices, RWC had the strongest correlations with chlorophyll fluorescence NPQ (r = 0.88) and qL (r = 0.89), hyperspectral PRI (r = 0.94), and multispectral PSRIm (r = −0.92). TQ was most correlated to chlorophyll fluorescence NPQ (r = 0.89), hyperspectral PSRI (r = −0.90), and multispectral PSRIm (r = −0.85). The indices also varied in their sensitivity to drought stress for Kentucky bluegrass, and therefore they detected drought stress in plants at different times of treatment. The hyperspectral SIPI and SRI were the most responsive to drought stress with significant decline at 14 d followed by PRI and PSRI at 16 d while NDVI and NDRE were slowest showing decline (18 d) in response to drought. Multispectral indices exhibited decline later during drought at 16 d of drought stress for NDVIm, NDREm , PRIm , and PSRIm and 18 d for SIPIm and SRIm. Indices SIPI and SRI are related to leaf carotenoid composition and vegetation density and high spectral resolution of hyperspectral system was able to capture subtle changes in pigment concentration and canopy (slight leaf shrinking and rolling) at early phase of drought progression[36,37]. Index PSRI is indicative of the ratio of bulk carotenoids including α- and β-carotenes to chlorophylls and PRI is sensitive to xanthophyll cycle particularly de-epoxidation of zeaxanthin that releases excess energy as heat in order to photoprotection[38−40]. Activation of photoprotective mechanisms including xanthophyl cycle require a certain level of stress severity depending on type of abiotic stress and plant species[41]. The PSRI calculated using both hyperspectral and multispectral imaging systems exhibited similar trends, and PSRI and PRI from either imaging system detected drought stress after 16 days of treatment applications. In agreement with our results, Das & Seshasai[42] found that PSRI showed similar trends when its value > −0.2 regardless of whether measured using hyperspectral or multispectral imaging. Both PSRI and PRI were also highly correlated to leaf RWC or TQ in Kentucky bluegrass exposed to drought stress in this study, suggesting that these two indices could be useful parameters to detect and monitor plant responses to drought stress.
Vegetation index of NDVI has been the most widely used vegetation index in several crops such as wheat (Triticum aestivum L.)[43], cool- and warm-season turfgrass species including perennial ryegrass (Lolium perenne L.), tall fescue (Festuca arundinacea Schreb.), seashore paspalum (Paspalum vaginatum Sw.) and hybrid bermudagrass [Cynodon dactylon (L.) Pers. × C. transvaalensis Burtt-Davy][2, 44, 45]. For example, Bhandari et al.[43] and Badzmierowski et al.[14] found NDVI was correlated to overall turfgrass quality and chlorophyll content under nitrogen and drought stresses in tall fescue and citrus (Citrus spp.) plants. In this study, NDVI and NDRE were also correlated to leaf RWC and TQ, both NDVI and NDRE calculated from hyperspectral or multispectral imaging were least responsive to drought stress or detected drought stress later than other indices. Hong et al.[46] reported that NDVI being a better indicator than NDRE for early drought stress detection in turfgrasses when these indices were measured by handheld multispectral sensor. Eitel et al.[47] utilized broadband satellite images to estimate NDVI and NDRE and identified NDRE being a better option for early detection of stress condition in woodland area. Either NDVI or NDRE could be used as indices for vegetation density, but not sensitive indicators for plant responses to drought stress or for detecting drought damages in plants.
Chlorophyll fluorescence reflects the integrity and functionality of photosystems in the light reactions of photosynthesis and serves as a good indicator for photochemical activity and efficiency[48]. The Y(PSII) is an effective quantum yield of photochemical energy conversion and estimates the actual proportion of absorbed light that is used for electron transport[49]. The ratio of F'v/F'm is maximum proportion of absorbed light that can be used for electron transport when all possible PSII reaction centers are open under light adapted state. Parameters qP and qL estimate the fraction of open PSII centers based on 'puddle' and 'lake or connected unit' models of photosynthetic antenna complex, respectively[50]. Rfd is an indicator for photosynthetic quantum conversion associated with functionality of the photosynthetic core unit. Overall, these parameters revolve around the operation status and functioning of PSII reaction centers or the core unit that possesses chlorophyll a-P680 in a matrix of proteins[51]. Parameter NPQ indicates non-photochemical quenching of fluorescence via heat dissipation involving xanthophyll cycle and state transition of photosystems[52]. This parameter is mostly associated with xanthophylls and other pigments in light harvesting antenna complex of photosystems but not with the PSII core unit[53]. Li et al.[9] reported that chlorophyll fluorescence imaging parameters including F'V/F'm have a limitation of late drought detection in plants. Shin et al.[54] reported F'V/F'm, Y(PSII), qP, and qL detected stress effects under severe drought when leaves were completely wilted and fresh weights declined in lettuce (Lactuca sativa L.) seedings. In this study, NPQ and Fv/Fm exhibited significant decline earlier (12−16 d of stress treatment) when drought was in mild to moderate level (> 60% leaf water content) compared to other chlorophyll fluorescence indices. The NPQ was strongly correlated to leaf RWC (r = 0.88) and TQ (r = 0.89) for Kentucky bluegrass exposed to drought stress. These results suggested that NPQ is a sensitive indicator of photosynthetic responses to drought stress and could be a useful parameter for evaluating plant tolerance to drought stress and monitoring drought responses.
-
The comparative analysis of phenotypic and photosynthetic responses to drought stress using three imaging technologies (hyperspectral, multispectral and chlorophyll fluorescence) using the partial least square modeling demonstrated that the integrated vegetation indices from hyperspectral imaging had higher predictability for detecting turfgrass responses to drought stress relative to those from multispectral imaging and chlorophyll fluorescence. Among individual indices, SIPI and SRI from hyperspectral imaging were able to detect drought stress sooner than others while PSRI and PRI from both hyperspectral and multispectral imaging were also highly correlated to leaf RWC or TQ responses to drought stress, suggesting these indices could be useful parameters to detect and monitor drought stress in cool-season turfgrass. While NDVI or NDRE from both hyperspectral and multispectral imaging could be used as indices for vegetation density, but not sensitive indicators for plant responses to drought stress. Among chlorophyll fluorescence indices, NPQ and Fv/Fm were more closely correlated to RWC or TQ while NPQ was most responsive to drought stress, and therefore NPQ could be a useful indicator for detecting and monitoring cool-season turfgrass response to drought stress. The sensitivity and effectiveness of these indices associated with drought responses in this study could be further testified in other cool-season and warm-season turfgrass species under field conditions. As each imaging technology used in this experiment comes with bulky accessories such as LED panels, mounting tower and support system, capturing images within limited space of controlled environmental chambers are challenging. Future research should be in developing multimodal imaging integrating major features of all three technologies and reducing size and space requirement that would deliver improved decision support for drought monitoring and irrigation management in turfgrasses. Development of advanced algorithms that could incorporate broader spectral details or band reflectance for calculating novel vegetation indices are warranted.
The research presented in this paper was funded by the United State Department of Agriculture - National Institute of Food and Agriculture (2021-51181-35855).
-
The authors declare that they have no conflict of interest. Bingru Huang is the Editorial Board member of Journal Grass Research who was blinded from reviewing or making decisions on the manuscript. The article was subject to the journal's standard procedures, with peer-review handled independently of this Editorial Board member and her research groups.
-
# These authors contributed equally: Krishna B Katuwal, Haoguang Yang
- Copyright: © 2023 by the author(s). Published by Maximum Academic Press, Fayetteville, GA. This article is an open access article distributed under Creative Commons Attribution License (CC BY 4.0), visit https://creativecommons.org/licenses/by/4.0/.
-
About this article
Cite this article
Katuwal KB, Yang H, Huang B. 2023. Evaluation of phenotypic and photosynthetic indices to detect water stress in perennial grass species using hyperspectral, multispectral and chlorophyll fluorescence imaging. Grass Research 3:16 doi: 10.48130/GR-2023-0016 

Evaluation of phenotypic and photosynthetic indices to detect water stress in perennial grass species using hyperspectral, multispectral and chlorophyll fluorescence imaging
- Received: 09 June 2023
- Accepted: 08 August 2023
- Published online: 31 August 2023
Abstract: Knowledge of phenotypic and physiological traits associated with early responses to drought stress and the extent of stress damage is important for developing efficient irrigation programs and the selection of drought-tolerant cultivars. This study was conducted to identify major vegetation and photosynthetic indices from imaging technologies that are correlated to visual turf quality and leaf water status and responsive to drought stress by comparative analysis of different indices from multispectral, hyperspectral, and chlorophyll-fluorescence imaging for Kentucky bluegrass (Poa pratensis L.) exposed to drought stress. The progression of stress symptoms of plants was monitored using the three imaging technologies in controlled-environment chambers. Regression analysis demonstrated that the integrated vegetation indices from hyperspectral-imaging had better predictability for drought responses than those from multispectral or chlorophyll-fluorescence imaging. Among individual vegetation indices, SIPI and SRI from hyperspectral-imaging were more responsive to drought than other indices while PSRI and PRI from hyperspectral- and multispectral-imaging were highly correlated to leaf relative water content (RWC) or visual turf quality (TQ) under drought stress; NDVI or NDRE from hyperspectral and multispectral imaging were significantly correlated to TQ but were not as sensitive to drought stress as other indices. For chlorophyll-fluorescence photosynthetic indices, NPQ and Fv/Fm were significantly correlated to RWC or TQ while NPQ was most responsive to drought. Those vegetation or photosynthetic indices derived from the three imaging technologies that were responsive to drought stress and correlated to the extent of drought damages could be particularly useful traits for detecting and monitoring water stress in cool-season turfgrass.
-
Key words:
- Phenotypic /
- Photosynthetic /
- Indices /
- Drought /
- Turfgrass