


-
The conventional methods for phenotypic analysis require manpower and manual measurement tools, which are time-consuming, laborious and inefficient. Moreover, these methods are expensive, require skilled technical personnel, and are unsuitable for large farmland areas. Therefore, simple and efficient phenotypic analysis is needed to ensure the automation of modern agricultural production[1,2]. With the rapid development in information technology, techniques, such as high-throughput phenotypic analysis, could be used to overcome these challenges[3−5]. Compared with traditional phenotypic analysis, these new techniques are non-destructive, cost-effective, highly efficient, simple, and rapid.
Digital image analysis is one of the methods of high-throughput phenotypic analysis. Recently, digital image analysis has been applied in the nutritional diagnosis of field crops, such as rice (Oryza sativa L.)[6−8], corn (Zea mays L.)[9,10], wheat (Triticum aestivum L.)[11−13], and cotton (Gossypium hirsutum L.)[14−16]. Lee & Lee[6] used the image analysis software Visual Basic Version 6.0 to calculate the canopy coverage (CC) value and estimate 10 color indices. The study found that eight color indices and the CC had a linear relationship with the leaf area index, above-ground dry weight, and nitrogen accumulation in the upper layer. Additionally, Li et al.[11] used digital cameras to obtain the CC of wheat plants in the vegetative growth and early stages of stem elongation and demonstrated that the leaf area index, above-ground biomass (AGB), and nitrogen content highly correlated with the CC. Therefore, digital image analysis has enabled the highly efficient collection of phenotypic data from large areas of crops in a short time period. The technique is cost-effective and involves simple operational and post-processing steps, which ensure convenience, while incorporating the intelligent agricultural aspects.
Most previous studies focused on digital image analysis technology and diagnoses of plant nutrition. Many studies have shown that the AGB of wheat and barley crops positively correlates with their grain yield[17,18]. Plant height (PH) and AGB are key indicators of plant growth dynamics and yield. Therefore, studying the PH and AGB of the Malvacaceae would be valuable in monitoring the growth of cotton plants.
Cotton is an important cash crop that is widely cultivated worldwide. Its production and yield can be enhanced by improving the plant type and photosynthetic capacity of the leaves, optimizing the canopy structure, increasing the total dry matter accumulation of plants, and enhancing the number and quality of bolls per plant[19−21]. Drought is a major and complex abiotic stress that limits the growth, development, and production of cotton[22,23]. Climate changes and irrigation constraints have increased its frequency and severity, leading to significant reductions in yield[24]. Therefore, accurate and efficient monitoring of PH and AGB can help to identify the growth status and prediction of yield of crops under drought stress in a timely manner, thus, augmenting the management of plant abiotic stresses[25]. However, the traditional methods of measuring PH and AGB are time-consuming, laborious, limited to small-scale crops, and often damage plants during the measurement processes.
Canopeo is a cost-free image analytical software that can be used as a mobile application on Android or IOS devices. It was developed in the MATLAB programming language (MathWorks, Inc., Natick, MA, USA) and uses the red, green, and blue (RGB) color values[26,27]. Canopeo-based image analysis is an efficient, simple, accurate, cost-effective, and non-destructive method that enables the reliable and quick large-scale measurement of crop canopies and other phenotypic features. This phenotypic analytical method can directly obtain the percentages of green color (PGC) by maximum inter-class variance morphological threshold methods without the removal of soil, vegetation or deionization. Thus, this technique is very important for the future advancement of agriculture and enhancing the interest of individuals in modern agriculture.
The method involves photographing green crops using smartphones or digital cameras and generating image pixel percentages to compare the correlations between the real-time and estimated PGC of the PH and AGB. If the correlation is very high, the PGC can represent the PH and AGB and serve as a substitute method to evaluate dry crop matter and PH. Notably, high-definition (HD) digital cameras are inexpensive and offer high image resolution and simple data processing steps, making them the cost-effective methods of choice for data acquisition. Chung et al.[28] used Canopeo to analyze the PH and node height (NH) of sorghum (Sorghum bicolor L.) using the PGC data extracted from digital camera pictures. The results showed significant correlations between PGC and PH.
There are also relevant reports on the use of unmanned aerial vehicle (UAV) digital imaging and deep learning in cotton field research. The UAV imaging technology extracts both canopy spectral information and structural features, accurately monitoring the cotton leaf area index and heterosexual fiber[29−32]. Additionally, deep learning techniques using DenseNet can relatively quickly determine the characteristics of cotton crops in approximately 5 h[33]. Although UAV digital imaging and deep learning models can extract crop phenotypic characteristics, UAV technology has a short endurance time (30 min without a load), and high monitoring costs, and its performance is limited by heavy fog, strong winds, and rainy days[34]. Moreover, deep learning requires a large sample size to construct a high-precision prediction model, which limits its application for small-scale work[35]. Canopeo circumvents these challenges since it allows for the use of a mobile smartphone or HD digital for imaging. The method is cost-effective and easily mastered with simple post-processing steps suitable for ordinary farmers or researchers.
However, cotton crops are unique for their indeterminate growth habits, and the feasibility of Canopeo imaging technology in measuring the cotton PH and AGB had not yet been verified. This study aimed to obtain the PGC for different cotton genotypes subjected to levels of different irrigation and develop models to estimate PH and AGB. The assumptions of the study were as follows: (i) PGC is highly correlated with the cotton PH and AGB, (ii) PGC can be used to establish high-precision PH and AGB models for different genotypes of cotton, and (iii) PGC uses the same model to estimate the PH and AGB under different levels of irrigation. Thus, this system provides an efficient and non-destructive method to comprehensively estimate the growth and yield of cotton.
-
The above-ground phenotypic parameters of cotton, including PH, AGB, and PGC, were analyzed under the drought stress and control check treatments (CK) (Fig. 1), and the results showed that the three parameters exhibited a similar trend between the two treatments. The average PGC, PH, and AGB values were 50.08%, 35.13 cm, and 26.85 g/plant, respectively, for the CK-treated cotton, while the drought stress (DS)-treated cotton had average values of 27.18%, 24.24 cm, and 12.77 g/plant for PGC, PH, and AGB respectively (Fig. 1a−c). Moreover, the average values of PGC, PH, and AGB significantly decreased (P < 0.0001) by 46%, 31%, and 52%, respectively, under DS compared with the CK treatment.
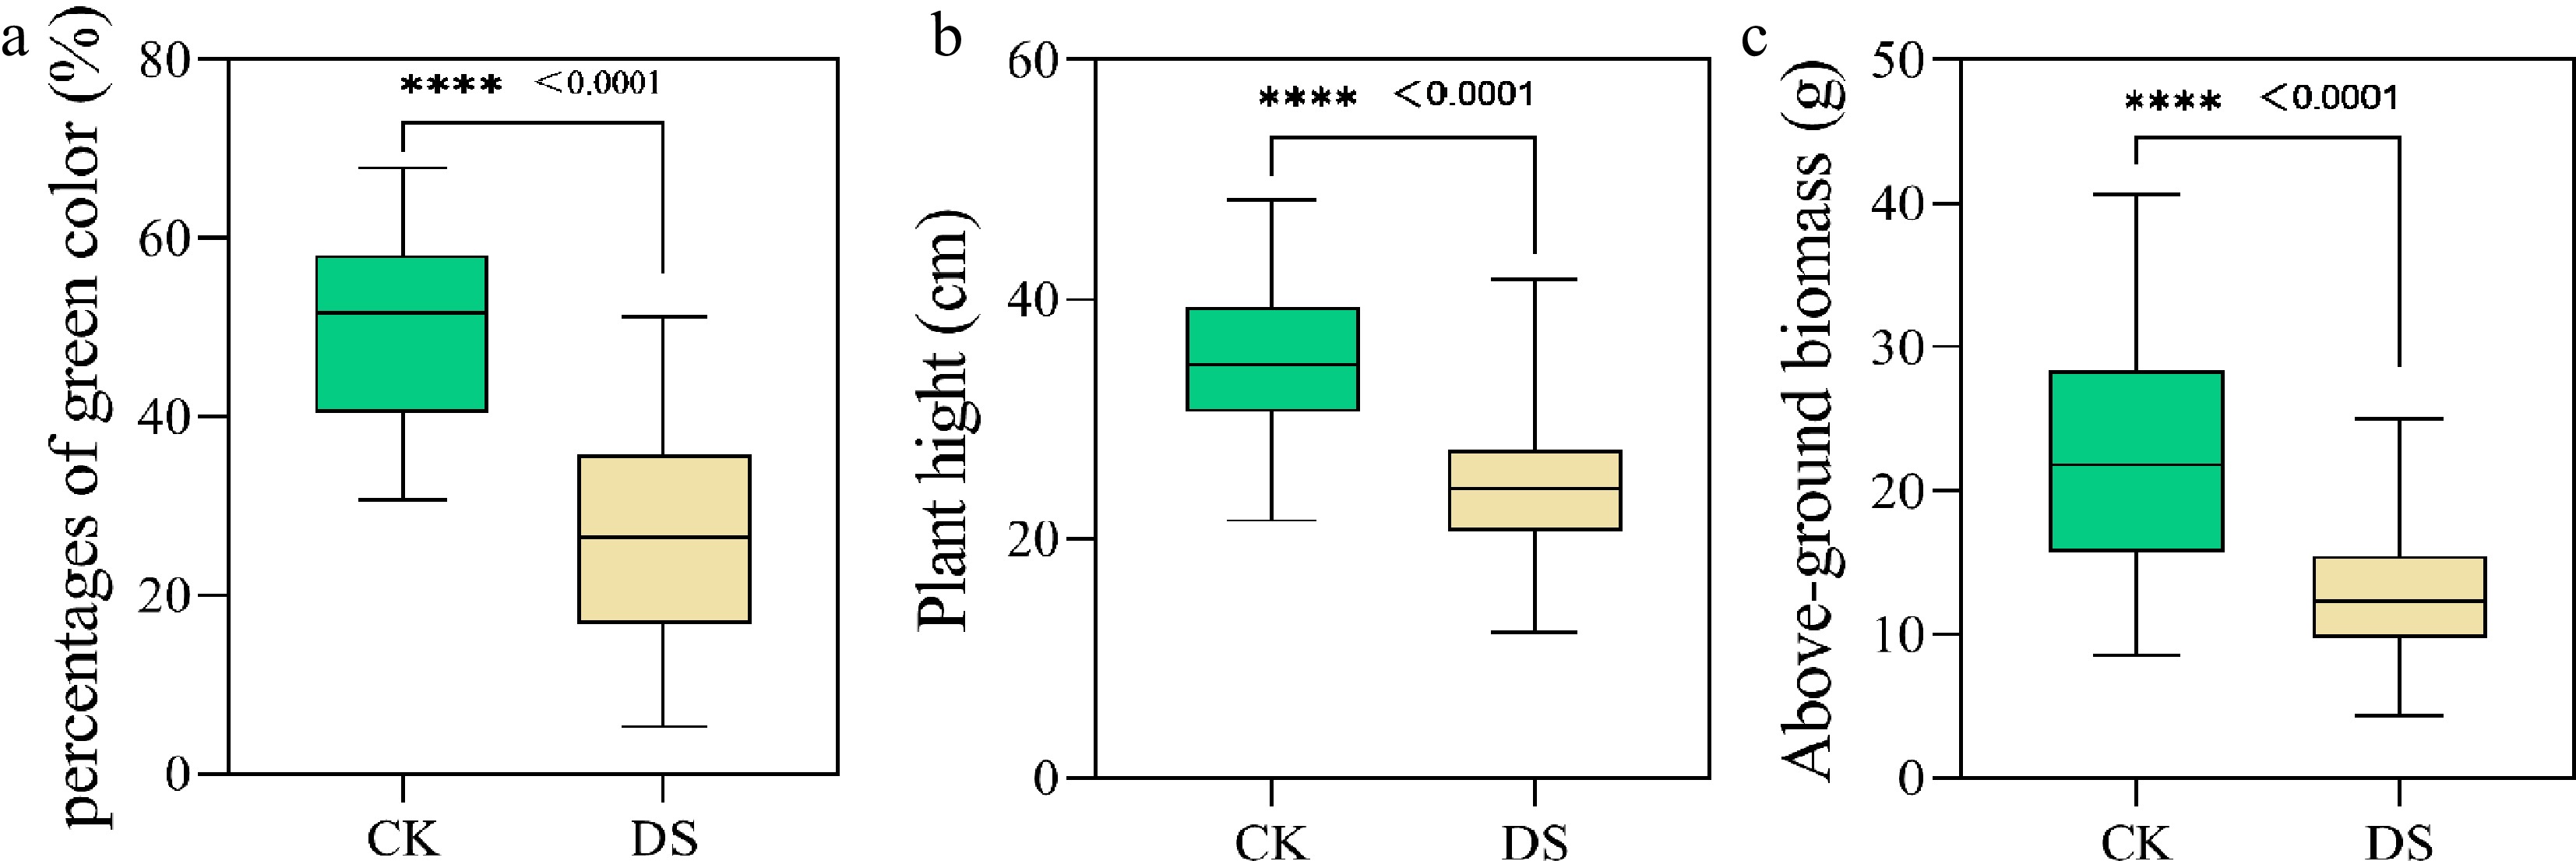
Figure 1.
Phenotypic analysis of the PH, AGB, and PGC of the 80 cotton genotypes at the initial flowering stages. AGB, above-ground biomass; DS, drought stress; CK, control check; PH, plant height; PGC, percentages of green color. **** P < 0.0001.
Correlation between PGC, PH, and AGB
-
The random effect of the Bayesian multivariate mixed model demonstrated that the two combinations of all variables were significant (Table 1). The PGC positively correlated with the PH and AGB of cotton, and the correlation coefficients of the three were all higher than 0.96 (P < 0.01).
Table 1. Correlation matrix of the PGC, PH, and AGB
PGC PH AGB DS PGC 1 PH 0.99** 1 AGB 0.96** 0.96** 1 CK PGC 1 PH 0.98** 1 AGB 0.98** 0.99** 1 AGB, above-ground biomass; PGC, percentage of green color; PH, plant height. ** P < 0.01 Models to evaluate the different cotton genotypes
-
The PH and AGB values of the different genotypes obtained by measurement were compared with the predicted values (Fig. 2), and we found that the linear regression model can accurately estimate the PH and AGB. There was a significant positive correlation between the PGC, PH, and AGB (Fig. 2a, c), and no study has proven that different cotton genotypes could affect this association. The two linear regression models (Fig. 2a, c) were accurate enough to prove their calibration rationale (R2 ≥ 0.9642). However, the predicted PH and AGB values were often lower than the one observed. Compared with the measured values, the means of PH and AGB values observed were reduced by 1.52% and 2.95%, respectively (Fig. 2b, d).
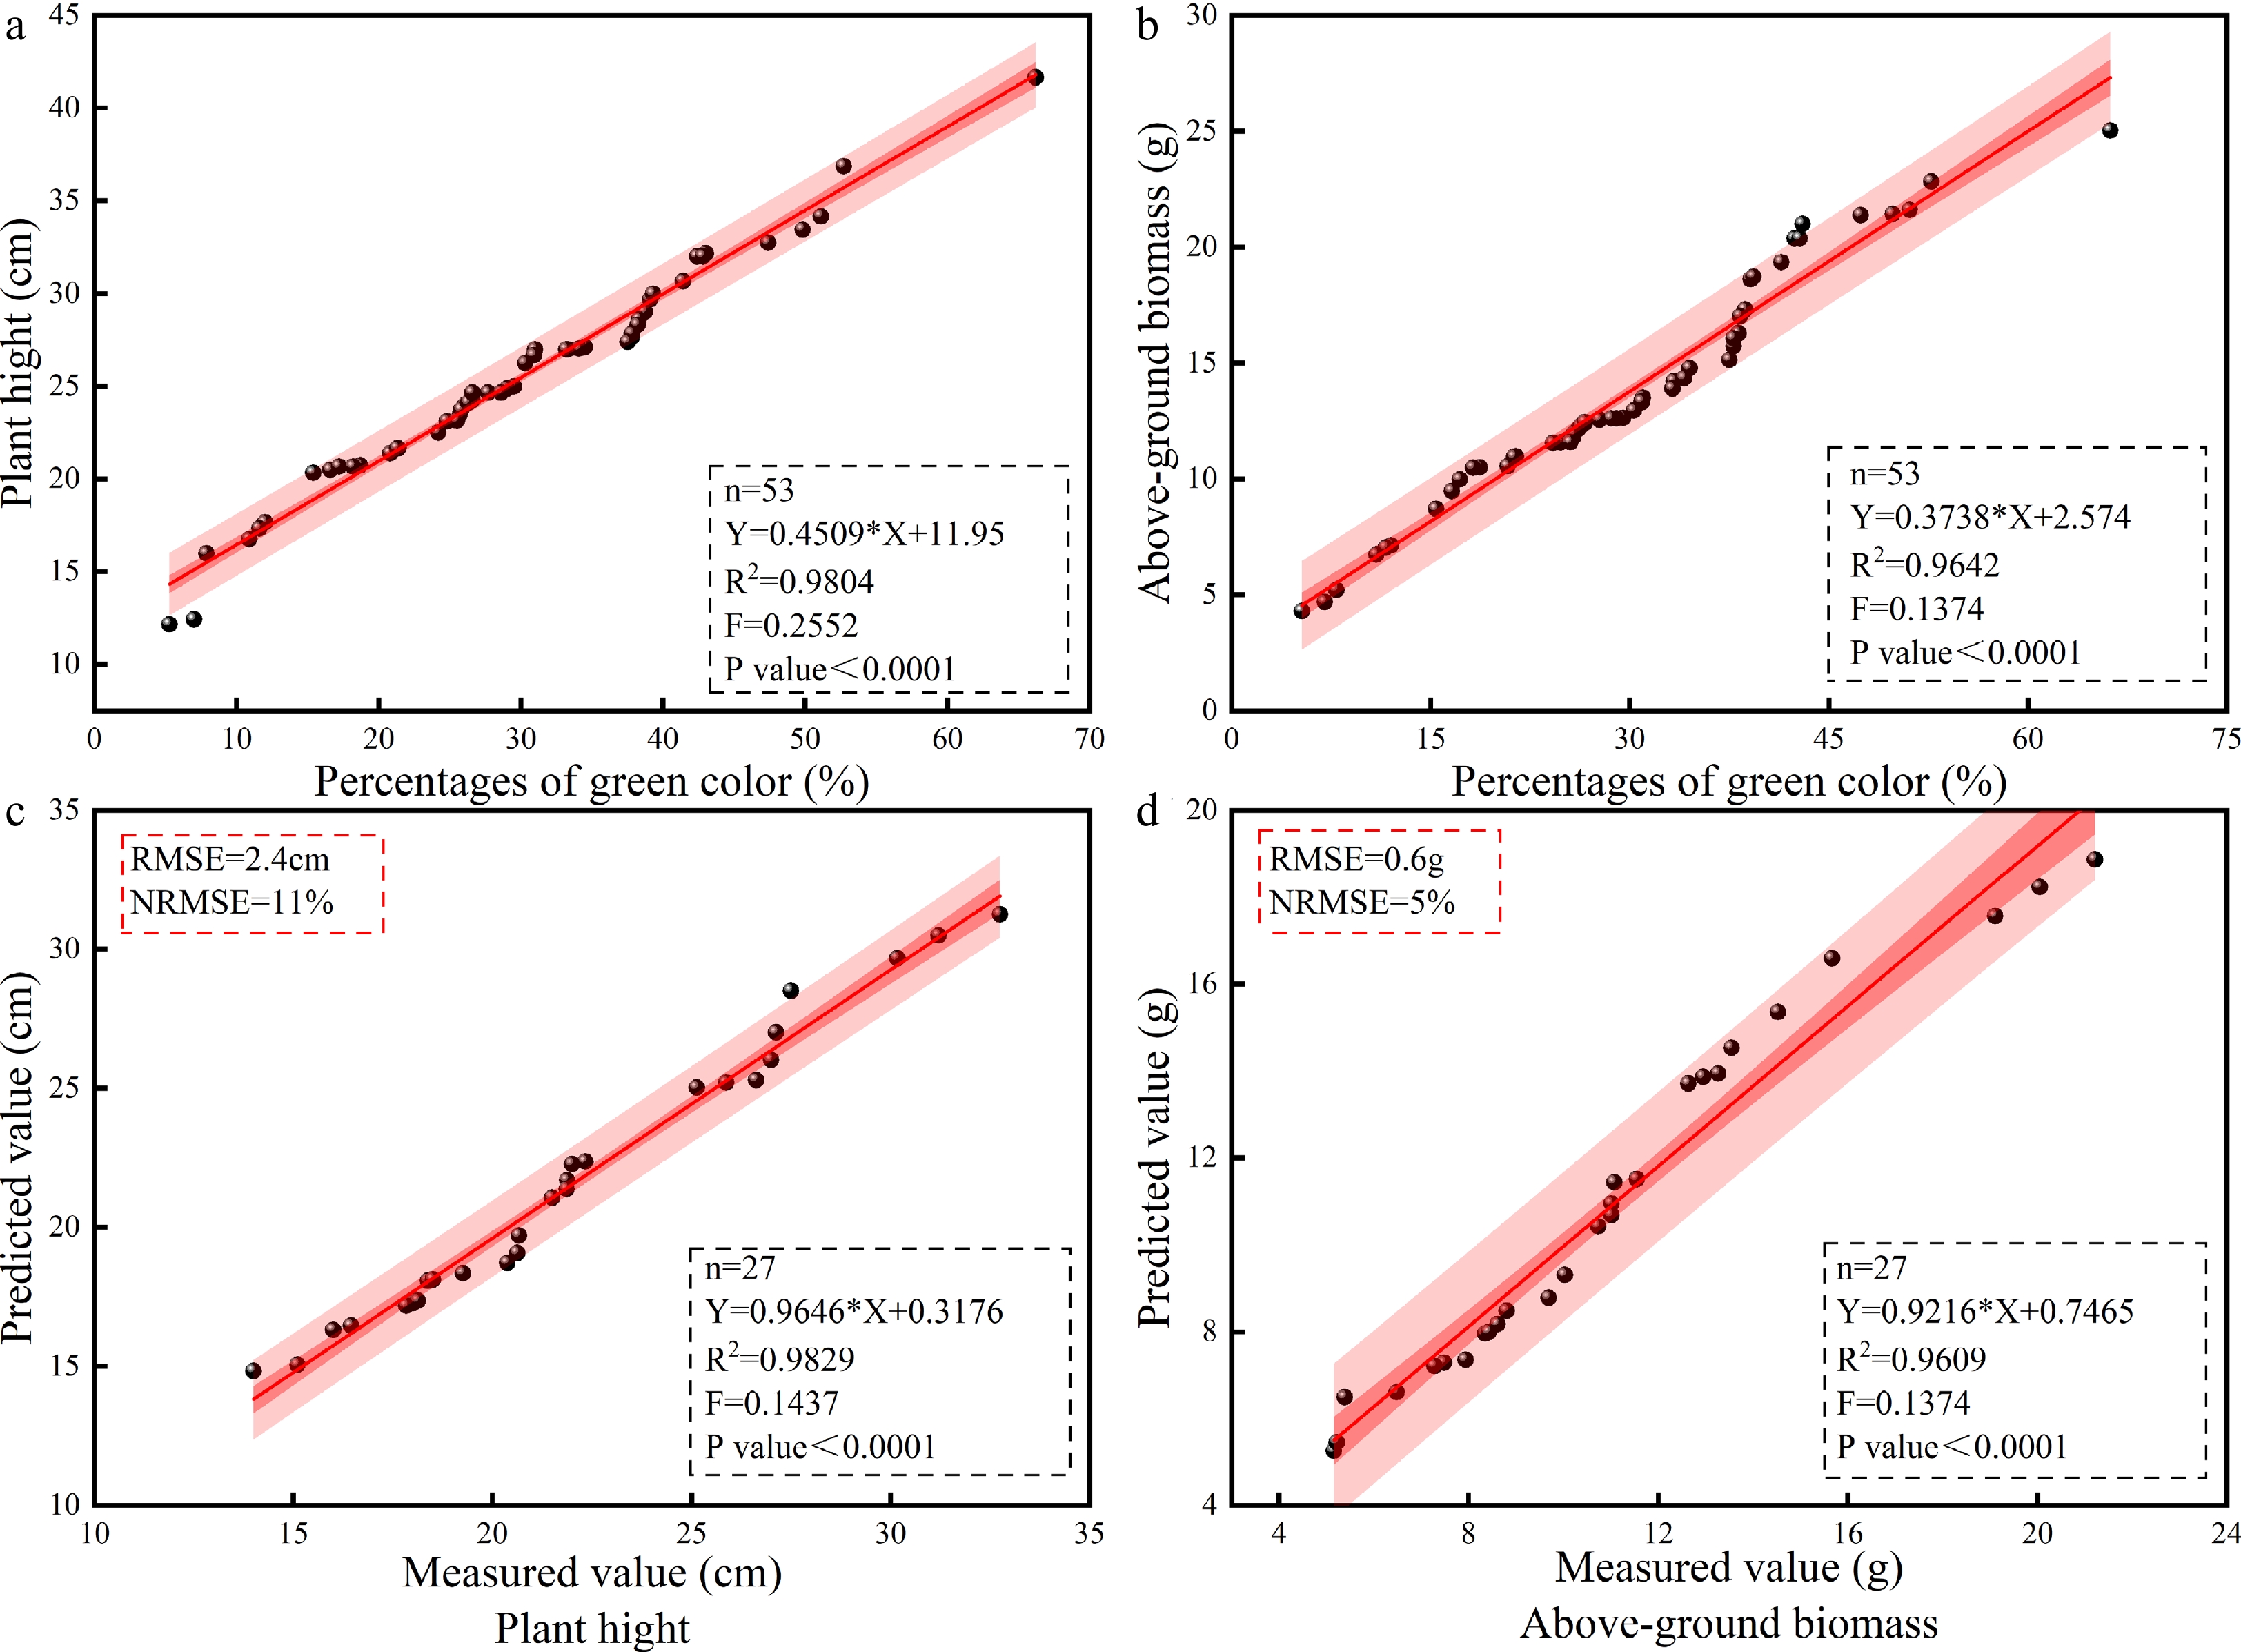
Figure 2.
Validation results of the PH and AGB prediction model for the different cotton genotypes. Model fitting of (a) PGC and PH, (b) measured and predicted PH values, (c) PGC and AGB, (d) measured and predicted AGB values. N, number of samples; R2, coefficient of determination (according to formula [1]); RMSE, root mean square error (according to formula [2]); NRMSE, standard root mean square error (according to formula [3]); AGB, above-ground biomass; PGC, percentages of green color; PH, plant height.
Evaluation of the models of the different levels of cotton irrigation
-
The accurately simulated PH and AGB values for all the irrigation treatments are shown in Fig. 3. The PGC positively correlated with PH and AGB during calibration in all the irrigation treatments, and there was a good fitting effect for the model (R2 ≥ 0.9229) (Fig. 3c). During validation, the R2, RMSE, and NRMSE values of the PH and AGB were 0.9604 and 0.9650, 2.15 cm and 4.51 g/plant, and 6% and 17%, respectively (Fig. 3b, d). However, the predicted PH and AGB values were often lower than those measured, while the mean of the observed PH and AGB values were reduced by 3.45% and 2.95%, respectively, compared with the measured values (Fig. 3a, c and Fig. 3b, d).
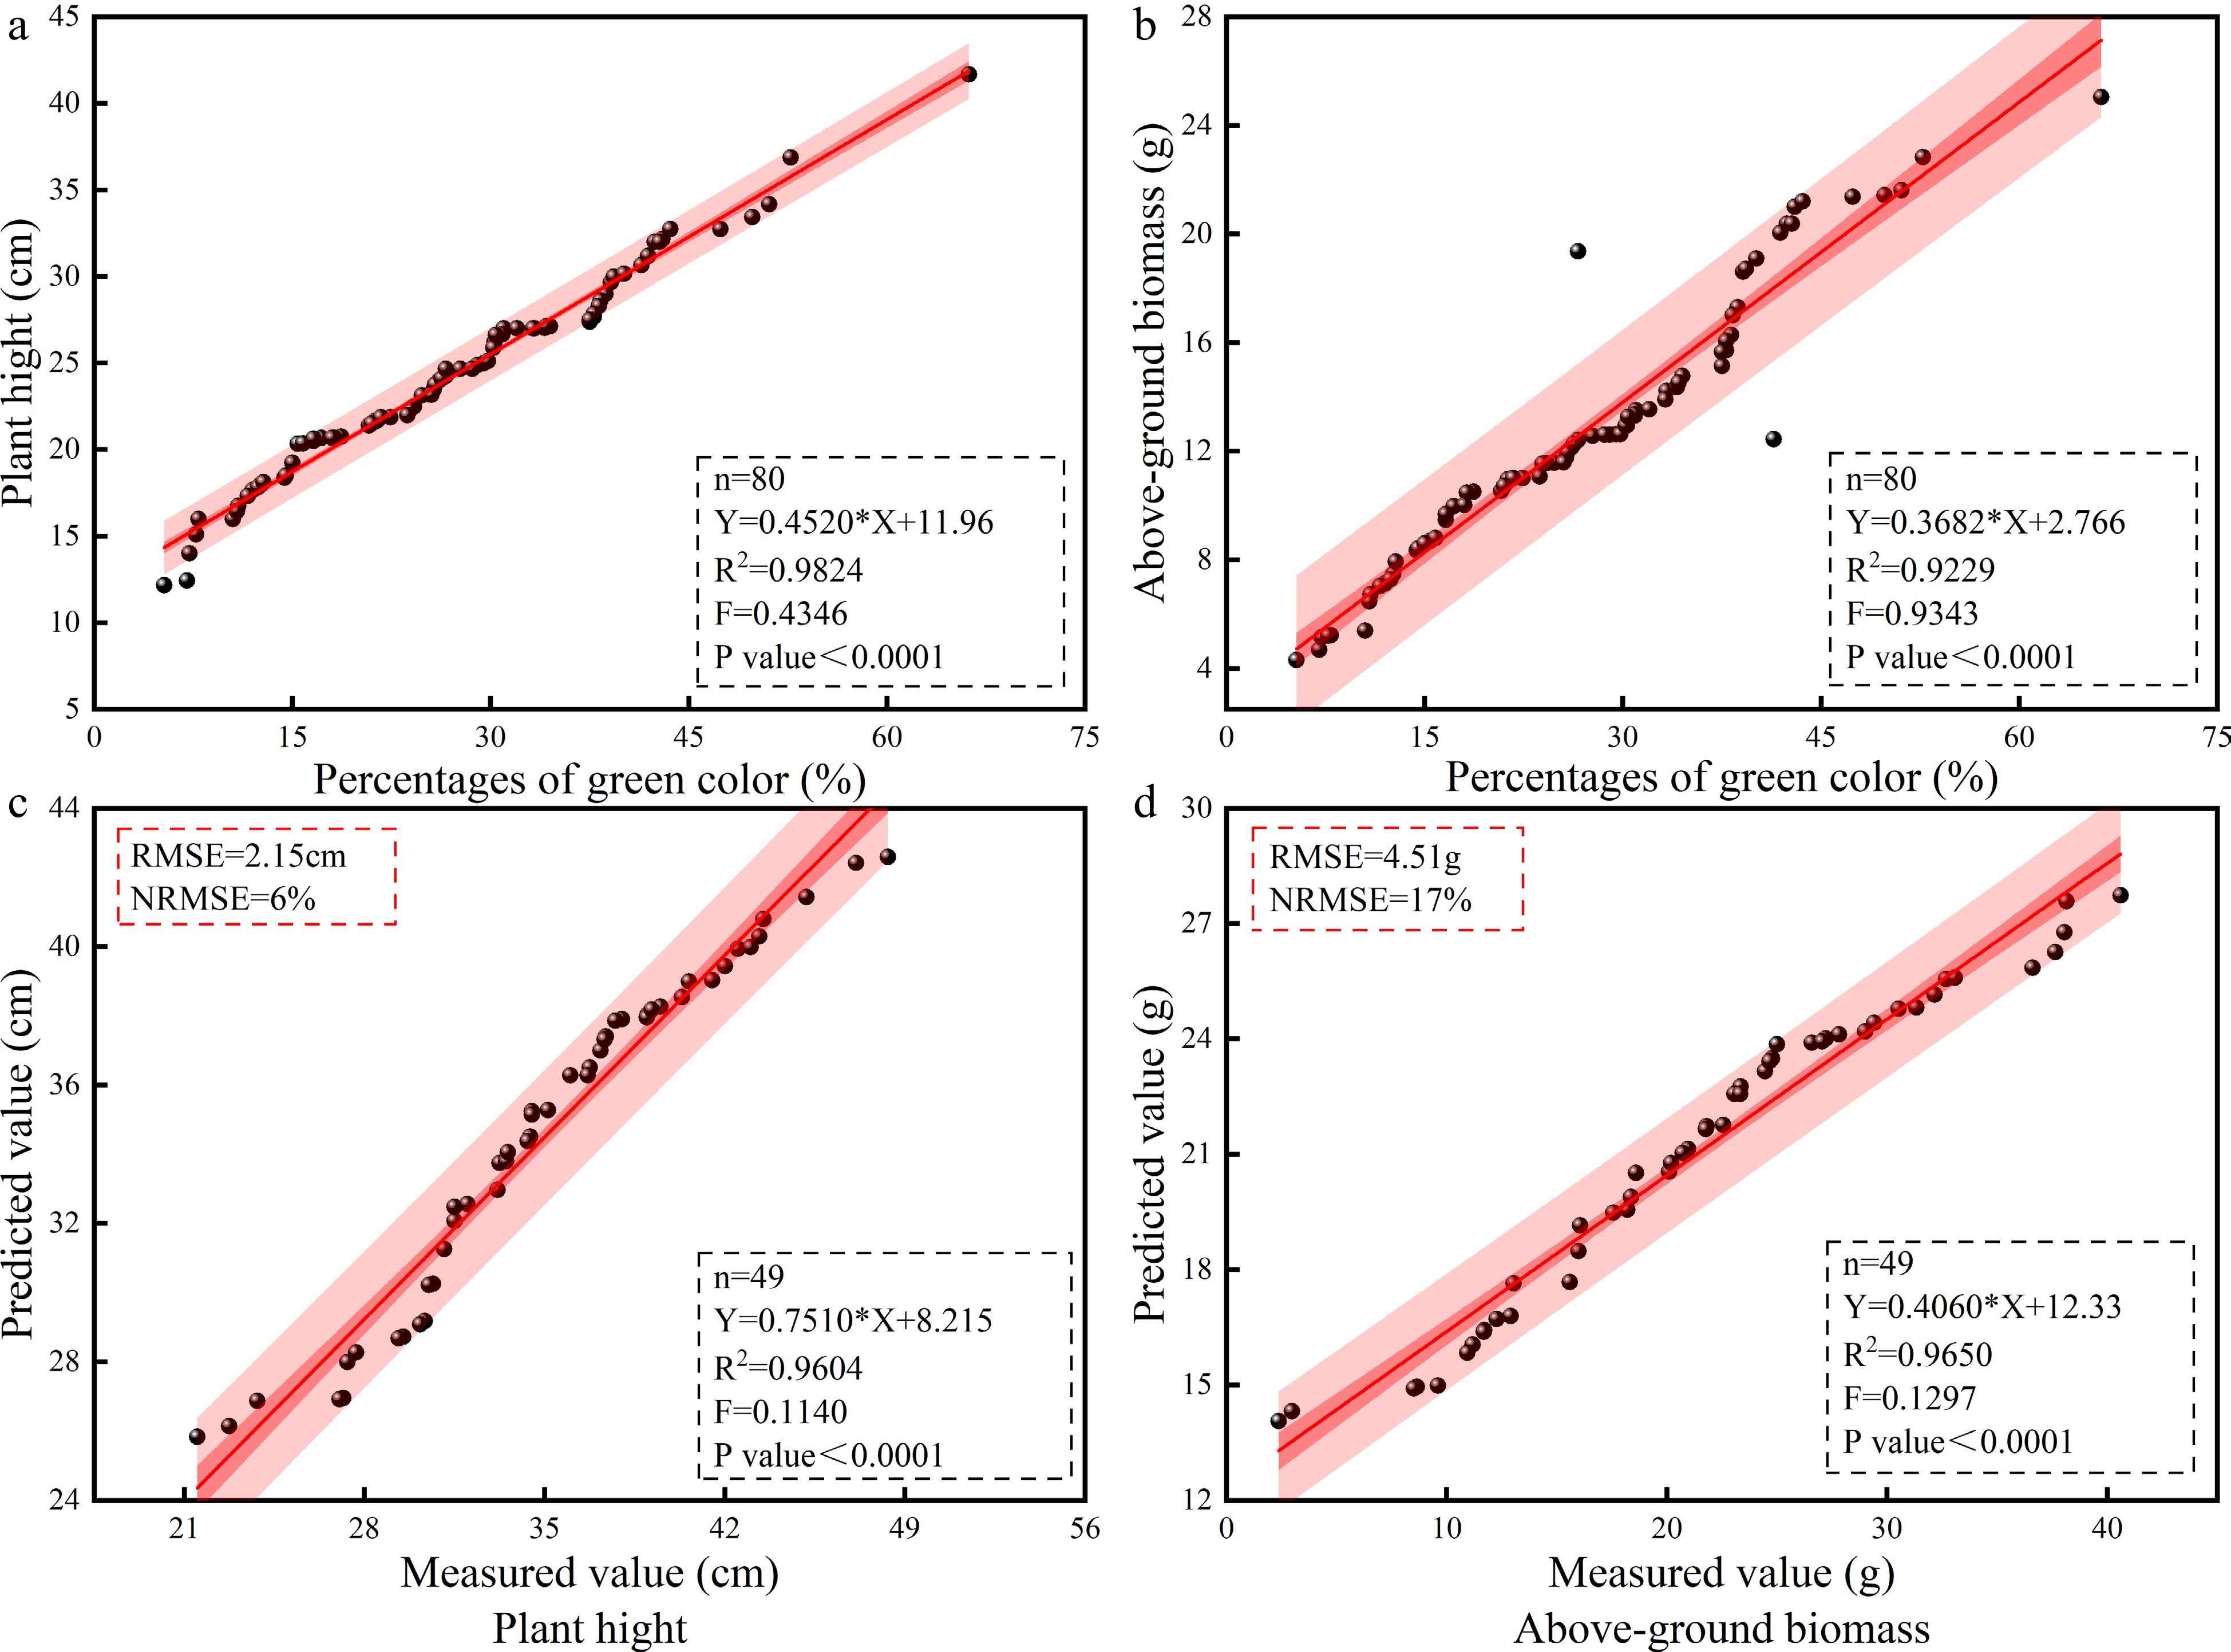
Figure 3.
The fitting effects of the PGC, PH, and AGB models under the DS and CK conditions. (a) The PGC and PH models under DS. (b) The fitting effect of the measured and predicted PH values in the CK, (c) PGC, and AGB model under DS. (d) The fitting effect of the measured and predicted AGB values. N, the number of samples; R2, coefficient of determination (according to formula [1]); RMSE, root mean square error (according to formula [2]); NRMSE, standard root mean square error (according to formula [3]); AGB, above-ground biomass; CK, control check; DS, drought stress; PGC, percentage of green color; PH, plant height.
Determining the most comprehensive model to estimate cotton growth
-
A simple linear regression (SLR) analysis and modeling methods demonstrated that the simulated and observed final PH and AGB values were highly consistent (Fig. 4). The statistically verified indices of the PH and AGB parameters, R2, RMSE, and NRMSE were 0.9776 and 0.8392, 0.0158 cm and 0.0011 g, and 0.06% and 0, respectively (Fig. 4a, c). The average values of the predicted PH and AGB values remained unchanged compared with those measured. Moreover, the simulated PH and AGB values corresponded with the predicted ones (R2 ≥ 0.8392, RMSE ≤ 0.0158, NRMSE ≤ 0.06%) during calibration and verification (Fig. 4b, d). The validation model also showed that the PH and AGB of various cotton genotypes highly correlated under different conditions and that the PGC positively correlated with the PH and AGB. The fitting equations to determine the most comprehensive model to estimate PH and AGB were expressed as follows: Y = 0.4832*X + 11.04 and Y = 0.4621*X – 0.3591, respectively.
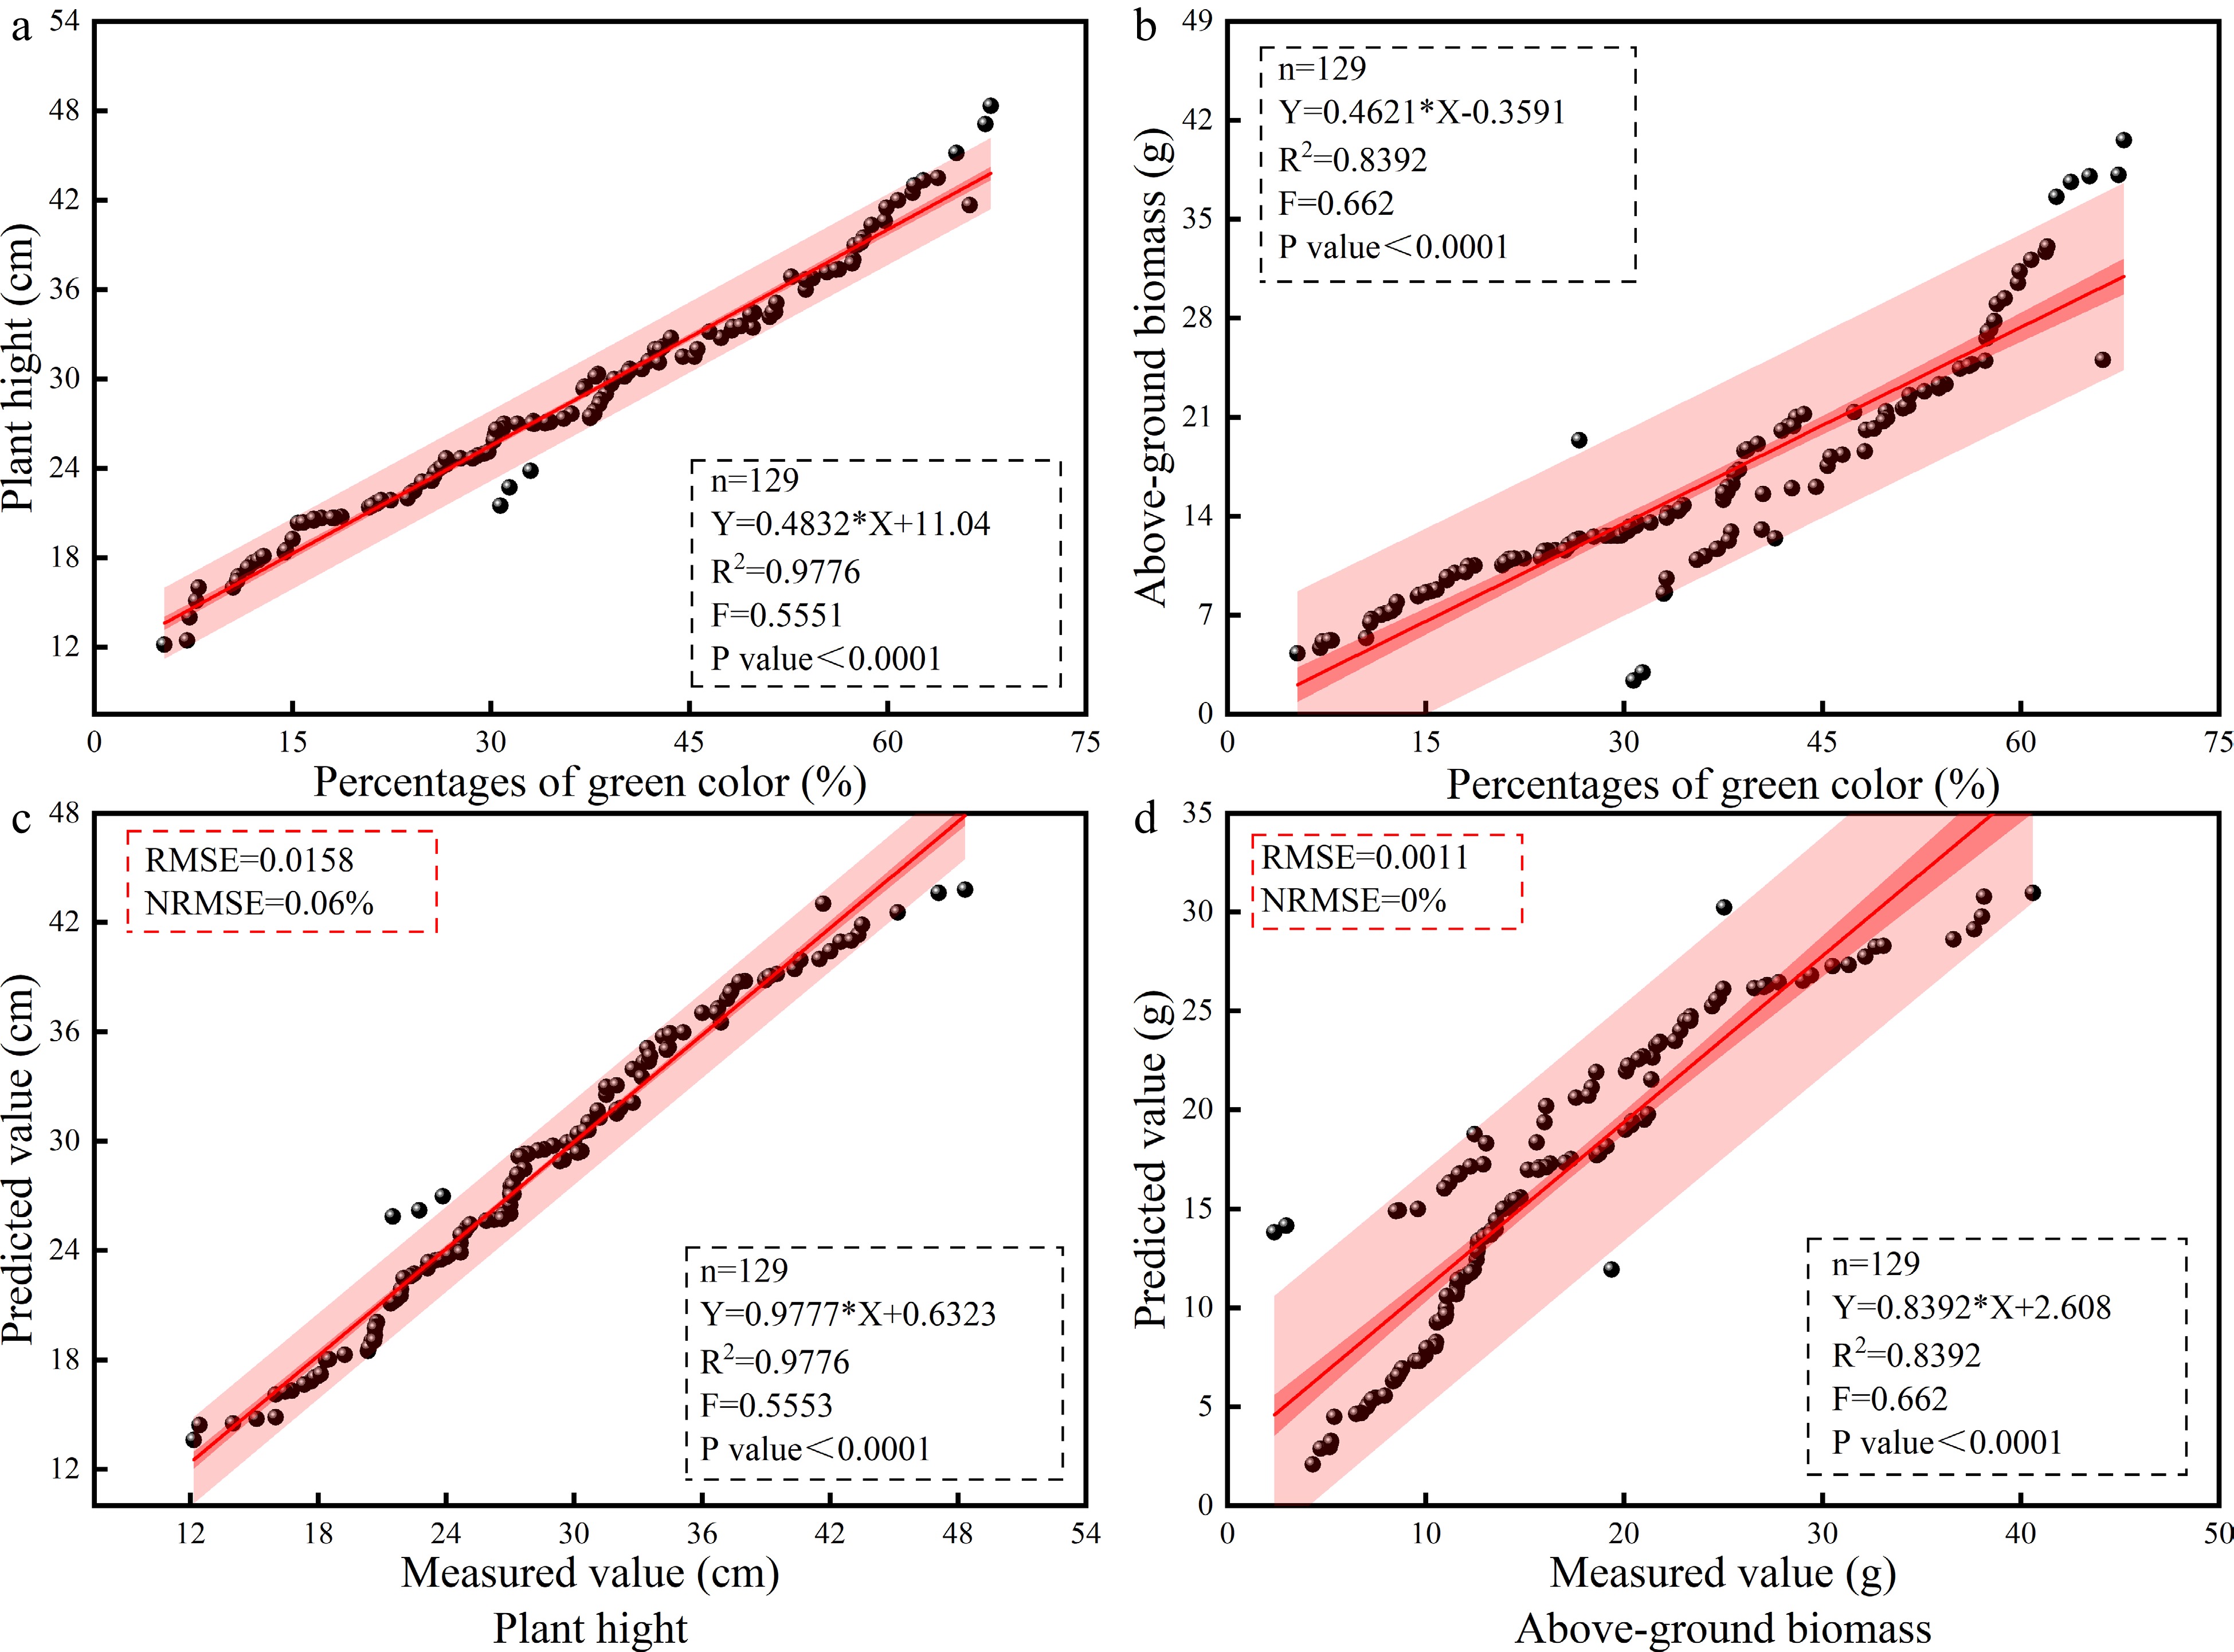
Figure 4.
Verification of the cotton PGC, PH, and AGB prediction models based on the SLR method. (a) PGC and PH model. (b) Fitting effect of the measured and predicted PH values. (c) PGC and AGB model. (d) Fitting effect of the measured and predicted AGB values. N, the number of samples; R2, coefficient of determination (according to formula [1]); RMSE, root mean square error (according to formula [2]); NRMSE, standard root mean square error (according to formula [3]). AGB, above-ground biomass; PGC, percentages of green color; PH, plant height; SLR, simple linear regression.
-
The PH and AGB are the key indicators of cotton growth dynamics and yield. Since the traditional methods of monitoring PH and AGB in the field are destructive, time-consuming, and laborious, this study proposed a high-throughput phenotypic tool for accurate, efficient, and non-destructive prediction of the cotton growth status and yield in the field. It is worth noting that Liu et al.[36], Ma et al.[37], and Zhang et al.[38] took vertical views of the plants, while Chung et al.[28] captured the horizontal views of the plants using cameras. These techniques were slightly different from those used in this study in which images were obtained via Canopeo at an angle of 60° from the ground to maximize capture of the uncovered parts by ensuring a larger R2 in a smaller RMSE.
The images obtained in this study were analyzed using a canoe phenotype analysis to obtain the cotton PH and AGB from the PGC to fit the Bayesian multivariate mixed model. The model fitting revealed that all the variables were highly correlated (P < 0.01) (Table 1), which was similar to the results obtained by Chung et al.[28] following PGC extraction, canopy phenotypic analysis, and Bayesian multivariate mixed model fitting. This shows that the phenotypic analysis of the canopy can be an effective tool to estimate the cotton PH and AGB. Other previous studies have also conducted relevant research on estimating AGB using high-throughput image analyses. Soja et al.[39] estimated the AGB of tropical forest trees using the P-band (435 MHz) synthetic aperture radar (SAR), while Li et al.[21] estimated the AGB of potatoes (Solanum tuberosum L.) using UAV hyperspectral imaging data. As in our study, Zhang et al.[32] estimated the AGB of winter wheat seedlings using Canopeo, which has continued to receive special focus due to the upsurge of high-throughput digital analysis.
PGC can be used as an indirect parameter to estimate crop growth
-
Canopy cover (CC) is the proportion of land area covered by the crop canopy[40]. Accordingly, PGC is a new tool to measure the green CC, which is closely related to the CC. The PGC tool extracts the green and non-green parts of the HD images of the crop canopy, based on the color threshold, and finally calculates the percentage of green in non-green sections. Many canopy-related studies have shown that the CC can estimate the growth status of crops. Lee & Lee[6] photographed and extracted the CC from four rice varieties under different nitrogen treatments. The results showed that the CC had a significant linear relationship with the manually obtained leaf area index, AGB, and above-ground nitrogen accumulation, suggesting that the CC can be used as an indirect parameter to estimate the nitrogen nutrition index of rice. Similarly, Li et al.[11] showed that the CC values obtained using a digital camera during the vegetative growth period and early stem elongation of wheat were closely related to the leaf area index, AGB, and nitrogen content, indicating that it could indirectly estimate the nitrogen content of wheat. Behrens & Diepenbrock[41] also demonstrated that the CC extracted from digital images obtained during the vegetative development stage of rapeseed (Brassica napus subsp. napus L.) was closely associated with soil coverage, leaf area index, and dynamics of plant quantity. These findings are similar to those obtained on cotton crops.
This study manually measured the PH and AGB of 80 DS-treated and 49 CK-treated cotton genotypes and extracted the PGC from the images of all samples (Fig. 3). The PGC highly positively correlated with PH and AGB (Figs 2–4). Therefore, the PGC is an important way to indirectly estimate the PH and AGB of cotton due to its relative measurement stability.
Since some studies have been reported to use various camera brands for the CC analysis, it is important to determine whether different brands of digital cameras could yield similar PGC values in cotton crops. Attention should be paid to the angle, height, width, and photographic time when taking pictures in the field. The PGC values obtained from all the processing shots should also be kept at the same level. However, there could be significant differences in the final PGC values obtained due to the proportional difference of the plants obtained in the image.
PGC can be used to construct highly precise models of cotton PH and AGB
-
A simple linear regression (SLR) analysis was used to fit the PGC, PH, and AGB cotton models. The linear regression analysis and true values of the different cotton genotypes showed that the PH and AGB models exhibited a good fit (R2 = 0.9829, RMSE = 2.4 cm, NRMSE = 11%; R2 = 0.9609, RMSE = 0.6 g/plant, and NRMSE = 5%) (Fig. 2). However, whether the model is widely applicable to different irrigation conditions needed to be determined. A simulation fit of PH and AGB was constructed for both the DS and CK groups, and we found that the two simulations highly positively correlated with high determination coefficients (≥ 0.9604) and a small NRMSE (≤ 17%); thus, showing high accuracy and stability (Fig. 3). The optimal comprehensive cotton PH and AGB model was also generated for all the treatments (Y = 0.4832*X + 11.04; Y = 0.4621*X – 0.3591) (Fig. 4). Studies have shown that UAV digital camera images can also be used to accurately estimate the AGB. Husson et al.[42] accurately estimated the AGB of riparian field plants using UAV vegetation maps, while Adar et al.[43] used high-resolution UAV data and the new multispectral VENμS satellite to accurately monitor AGB in Mediterranean and semi-arid grassland pastures in Israel for two consecutive years. Additionally, Tian et al.[44] accurately estimated the AGB of mangroves (R2 = 0.8319, RMSE = 22.7638 Mg/ha) using an XGBoost regression model based on the canopy height, vegetation index, texture index, and laser point cloud index of low altitude UAV remote sensing. Lu et al.[45] demonstrated that combining UAV light detection and Ranging (UAV LiDAR) with backpack LiDAR (back-lidar) can significantly improve the overall accuracy of a single-tree detection (F = 0.99) and the higher estimation accuracy of a random forest model (P < 0.05). Moreover, Zhang et al.[46] obtained hyperspectral images from UAV and showed that the XGBoost model could accurately estimate maize AGB (R2 = 0.81, RMSE = 0.27 t/ha) at each growth stage. These results are consistent with those of this study and show that a high-throughput analysis can accurately estimate the values of AGB in cotton.
Notably, the predicted PH and AGB values obtained in this study were slightly different from the real ones because the canopy effect could have hindered the camera from capturing the three-dimensional structure information, such as the blade. This results in a predicted value that was slightly smaller than the real one. This was consistent with the results of estimating the PH and AGB of winter wheat based on UAV digital images[47].
Factors that affect model fitting should be noted
-
The crops were photographed, and the PH and AGB were manually measured at the initial cotton flowering stages. The extracted PGC highly correlated with the cotton PH and AGB (Table 1). This is the 'climbing' stage of cotton plants, which is critical for water and fertilizer uptake. Thus, daily measurements during this stage follow strict manual routines to enable the prediction of growth and development of the later period. However, manual measurements are time-consuming and laborious. Therefore, this experiment provides an efficient, non-destructive, accurate, and simple high-precision model[26,27], which reduces the workload associated with manual measurements. Thus, this technique enables the measurement of plant traits on a large scale. Liu et al.[36] used the PGC extracted by Canopeo to construct models of experimental plots, and plots with different management levels poorly correlated (R2 = 0.403). However, the extremely high correlation suggested that a rapid population diagnosis with Canopeo mobile software could be possible in plots with different levels of management but with low accuracy. Ma et al.[37] used Canopeo to segment and eliminate the background noise in canopy images. Thus, the Canopeo phenotypic method is a widely used approach with many advantages and is suitable for ordinary farmers and researchers.
Canopeo is one of the widely used methods for high-throughput phenotypic analysis[26,27]. However, Canopeo is an image segmentation method based on color information, which is easily affected by background noise, such as illumination[48], which reduces its accuracy and robustness in estimating crop growth status. Under the same environmental conditions, standardization of the operational methods should be considered when using Canopeo under similar environmental conditions. Moreover, accurate and reliable reference methods should be incorporated in scientific research and application to reduce the human factors that could affect the performance of the tool[36]. It is also important to determine whether the standardized operational methods are suitable for different growth stages of cotton under the same environmental conditions.
-
This study proposed a high-throughput imaging tool to measure the green and non-green canopy areas. We calibrated and verified the PH and AGB estimation models of different cotton genotypes under varying levels of irrigation with an inexpensive and easily used HD digital camera and Canopeo technology. The PGC that was obtained highly correlated with the cotton PH and AGB. Thus, the digital imaging technology and extracted PGC can serve as effective tools and indirect estimates of cotton growth, respectively. The fitting models of different levels of irrigation and 80 different cotton genotypes corresponded with one another, indicating that there is no need to separately simulate the different levels of irrigation and genotypes. Additionally, a combination of an HD digital camera and Canopeo is a non-destructive and convenient method for measurement. The technique does not require professional knowledge of computer and machine learning and thus, can be utilized by ordinary farmers or researchers.
-
This study utilized eighty cotton varieties from the cotton-growing areas of the Yellow and Yangtze River basins (Supplemental Table S1).
Experimental design
-
This study was conducted in the drought shed in the Qingyuan Experimental Field at Hebei Agricultural University (Baoding City, Hebei Province, China) (38.85° N, 115.30° E) from April to July 2021 (Fig. 5a, b). The drought sheds automatically close and open during the rainy and sunny seasons, respectively. Full-grain and uniform seeds were selected for sowing in soil (see Supplemental Table S2 for the soil properties) and subjected to different treatments (Supplemental Table S1). The relative water contents of the soil for the CK and DS treatments were 75% ± 5% and 40%–45%, respectively. Additionally, the different irrigation treatments were regulated by a soil moisture monitoring system (TDR), watch-dog real-time moisture detector, and intelligent irrigation system (micro nozzle). There were 90,000 plants/hm2 in the field with an equal row spacing of 50 cm. The field management was similar to that applied during the conventional cultivation of high-yielding cotton fields. A water meter was used to measure and record the actual amount of irrigation. The seeds were artificially sown on April 20, 2021, and harvested on November 5, 2021.
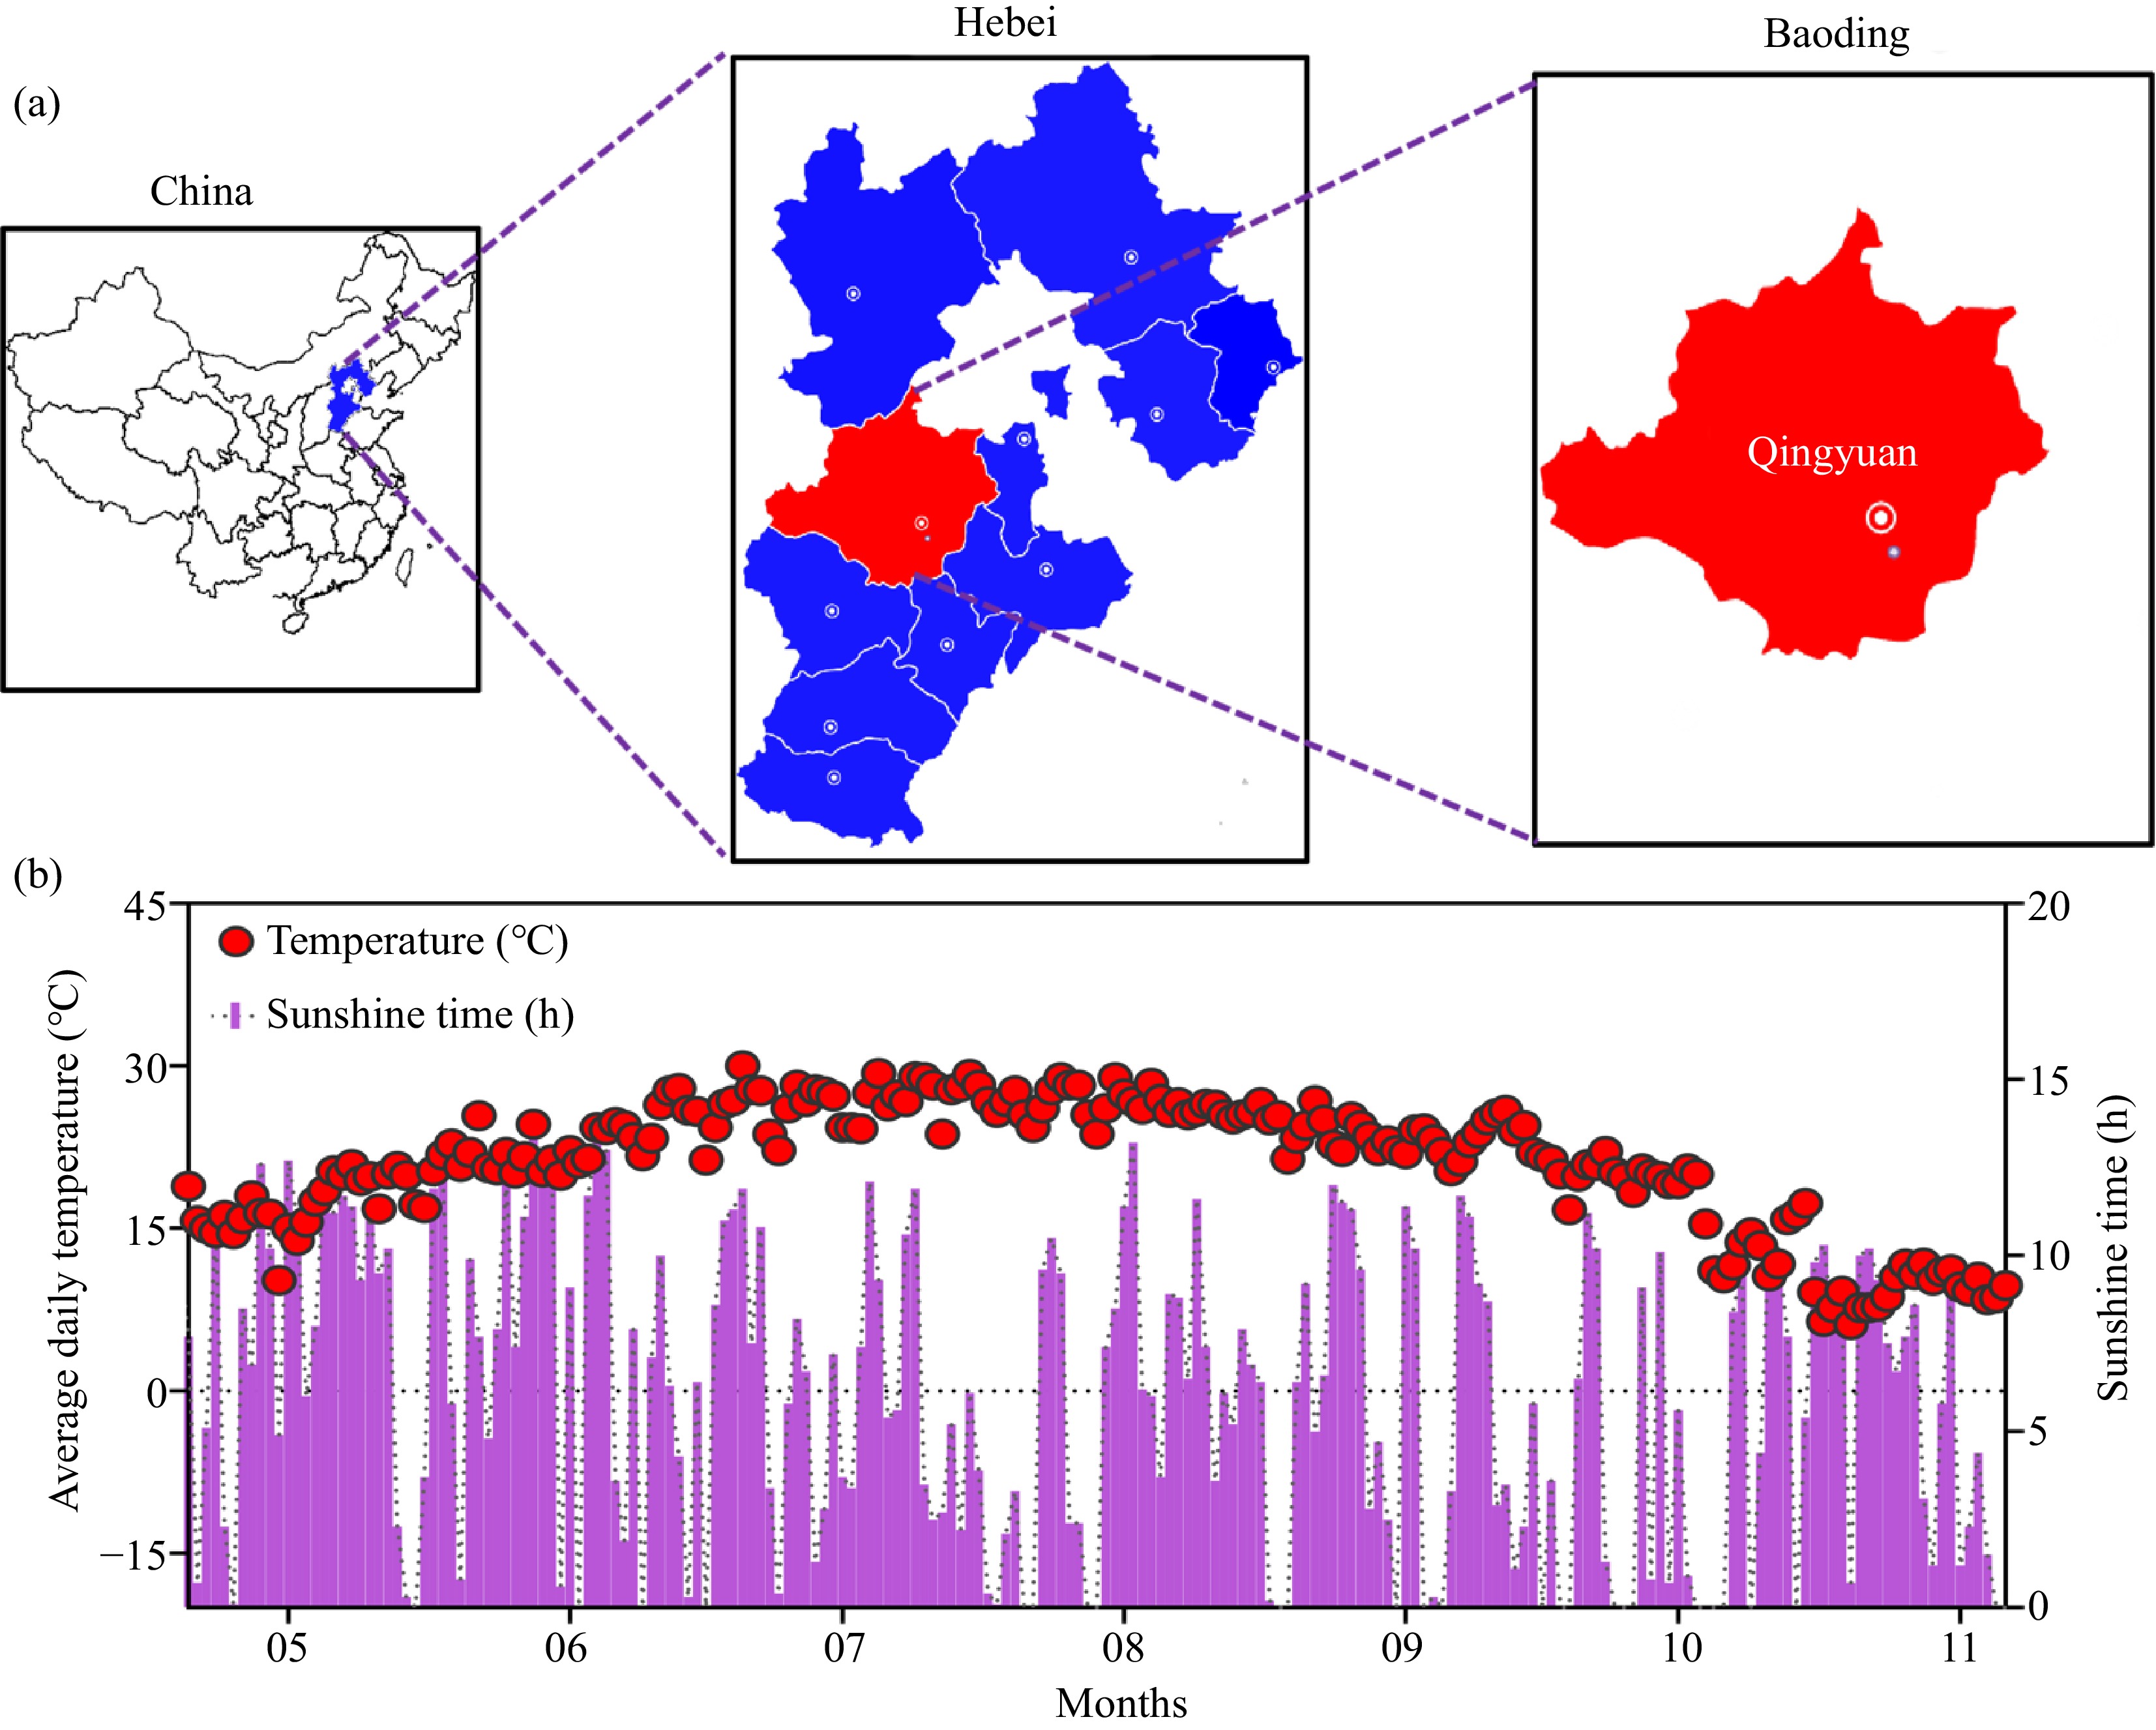
Figure 5.
Daily mean temperature (°C) and hours of sunshine time of the study site during cropping.
Field data acquisition and processing
Collection of data on plant height and above-ground biomass collection
-
The data were collected at the initial flowering stage of cotton, and the plants with consistent growth were selected for index measurement. All the indices were measured at 09:00. Five representative plants were measured from each treatment, and their average values were used as the final results.
The plant height (cm) was obtained by measuring the distance between the cotyledon node and the top of the main stem using a ruler. For the above-ground biomass (g/plant), the plants were separated from their rhizome and stem joints, oven-dried at 105 °C for 30 min and at 75 °C for 72 h and then weighed.
Collection of green color percentages
-
Digital image analysis was utilized to extract the images taken in the field using a single-lens reflex camera (Nikon D5-A; Tokyo, Japan) under natural light conditions. Each image contained only one whole row of plants. The HD digital camera parameter values were as follows: aperture value, exposure time, ISO speed, exposure compensation, contrast, brightness, light source, saturation, white balance, and other settings were consistent in each acquired image. Moreover, the images were recorded and stored in JPG format with a file size of 3.5 MB for each image. Canopeo was utilized to analyze each block center using automatic color threshold (ACT) free image analysis software. The software was developed in the MATLAB programming language (MathWorks, Inc., Hebei, China) and uses the RGB color values[26,27]. Canopeo image analysis software can be used to directly obtain the PGC using a maximum inter-class variance morphological threshold technique without soil and vegetation removal or deionization.
Application of the web version (
www.canopeoapp.com ) and mobile Application (APP) system. We choose the web version due to its simplicity, convenience, and ability to perform batch image processing. The HD digital camera was installed one meter high on a wooden stick marked at a height of 80 cm to ensure that all the HD digital images were taken at the same vertical distance from the plant. Similarly, a straight horizontal line measuring 80 cm was drawn at the base of each processed plant (photographed plant) to ensure that each image maintained the same distance from the plant in width. The camera angle of view was 60 degrees above the ground. This angle was established based on the height and width of the cotton plant to provide the best view and ensure that the height and leaf area were adequately captured. Canopeo is based on the color ratio of red and green, blue and green, and the excess green index[27]. Patrignani & Ochsner[49] provided the pixel standard, and the image was analyzed automatically by the APP. The adjusted value was set to 0.9 (the default). To reduce white pixels in the middle between rows, we adjusted the 'slider' to match the green pixels in the original photograph. The 'slider' refers to the user-adjustable noise reduction value that Canopeo uses to reduce background pixels that may register on the R/G or B/G scale. The same value was used on the ‘slider’ in each test. After taking a photograph, we logged onto the Canopeo website (www.canopeoapp.com ) and uploaded the images, which were automatically converted from green to white coloration to generate the percentages of pixels in the images. Ultimately, the PGC was recorded and downloaded for analysis[28,49−51]. The specific process is shown in Figs 6 & 7.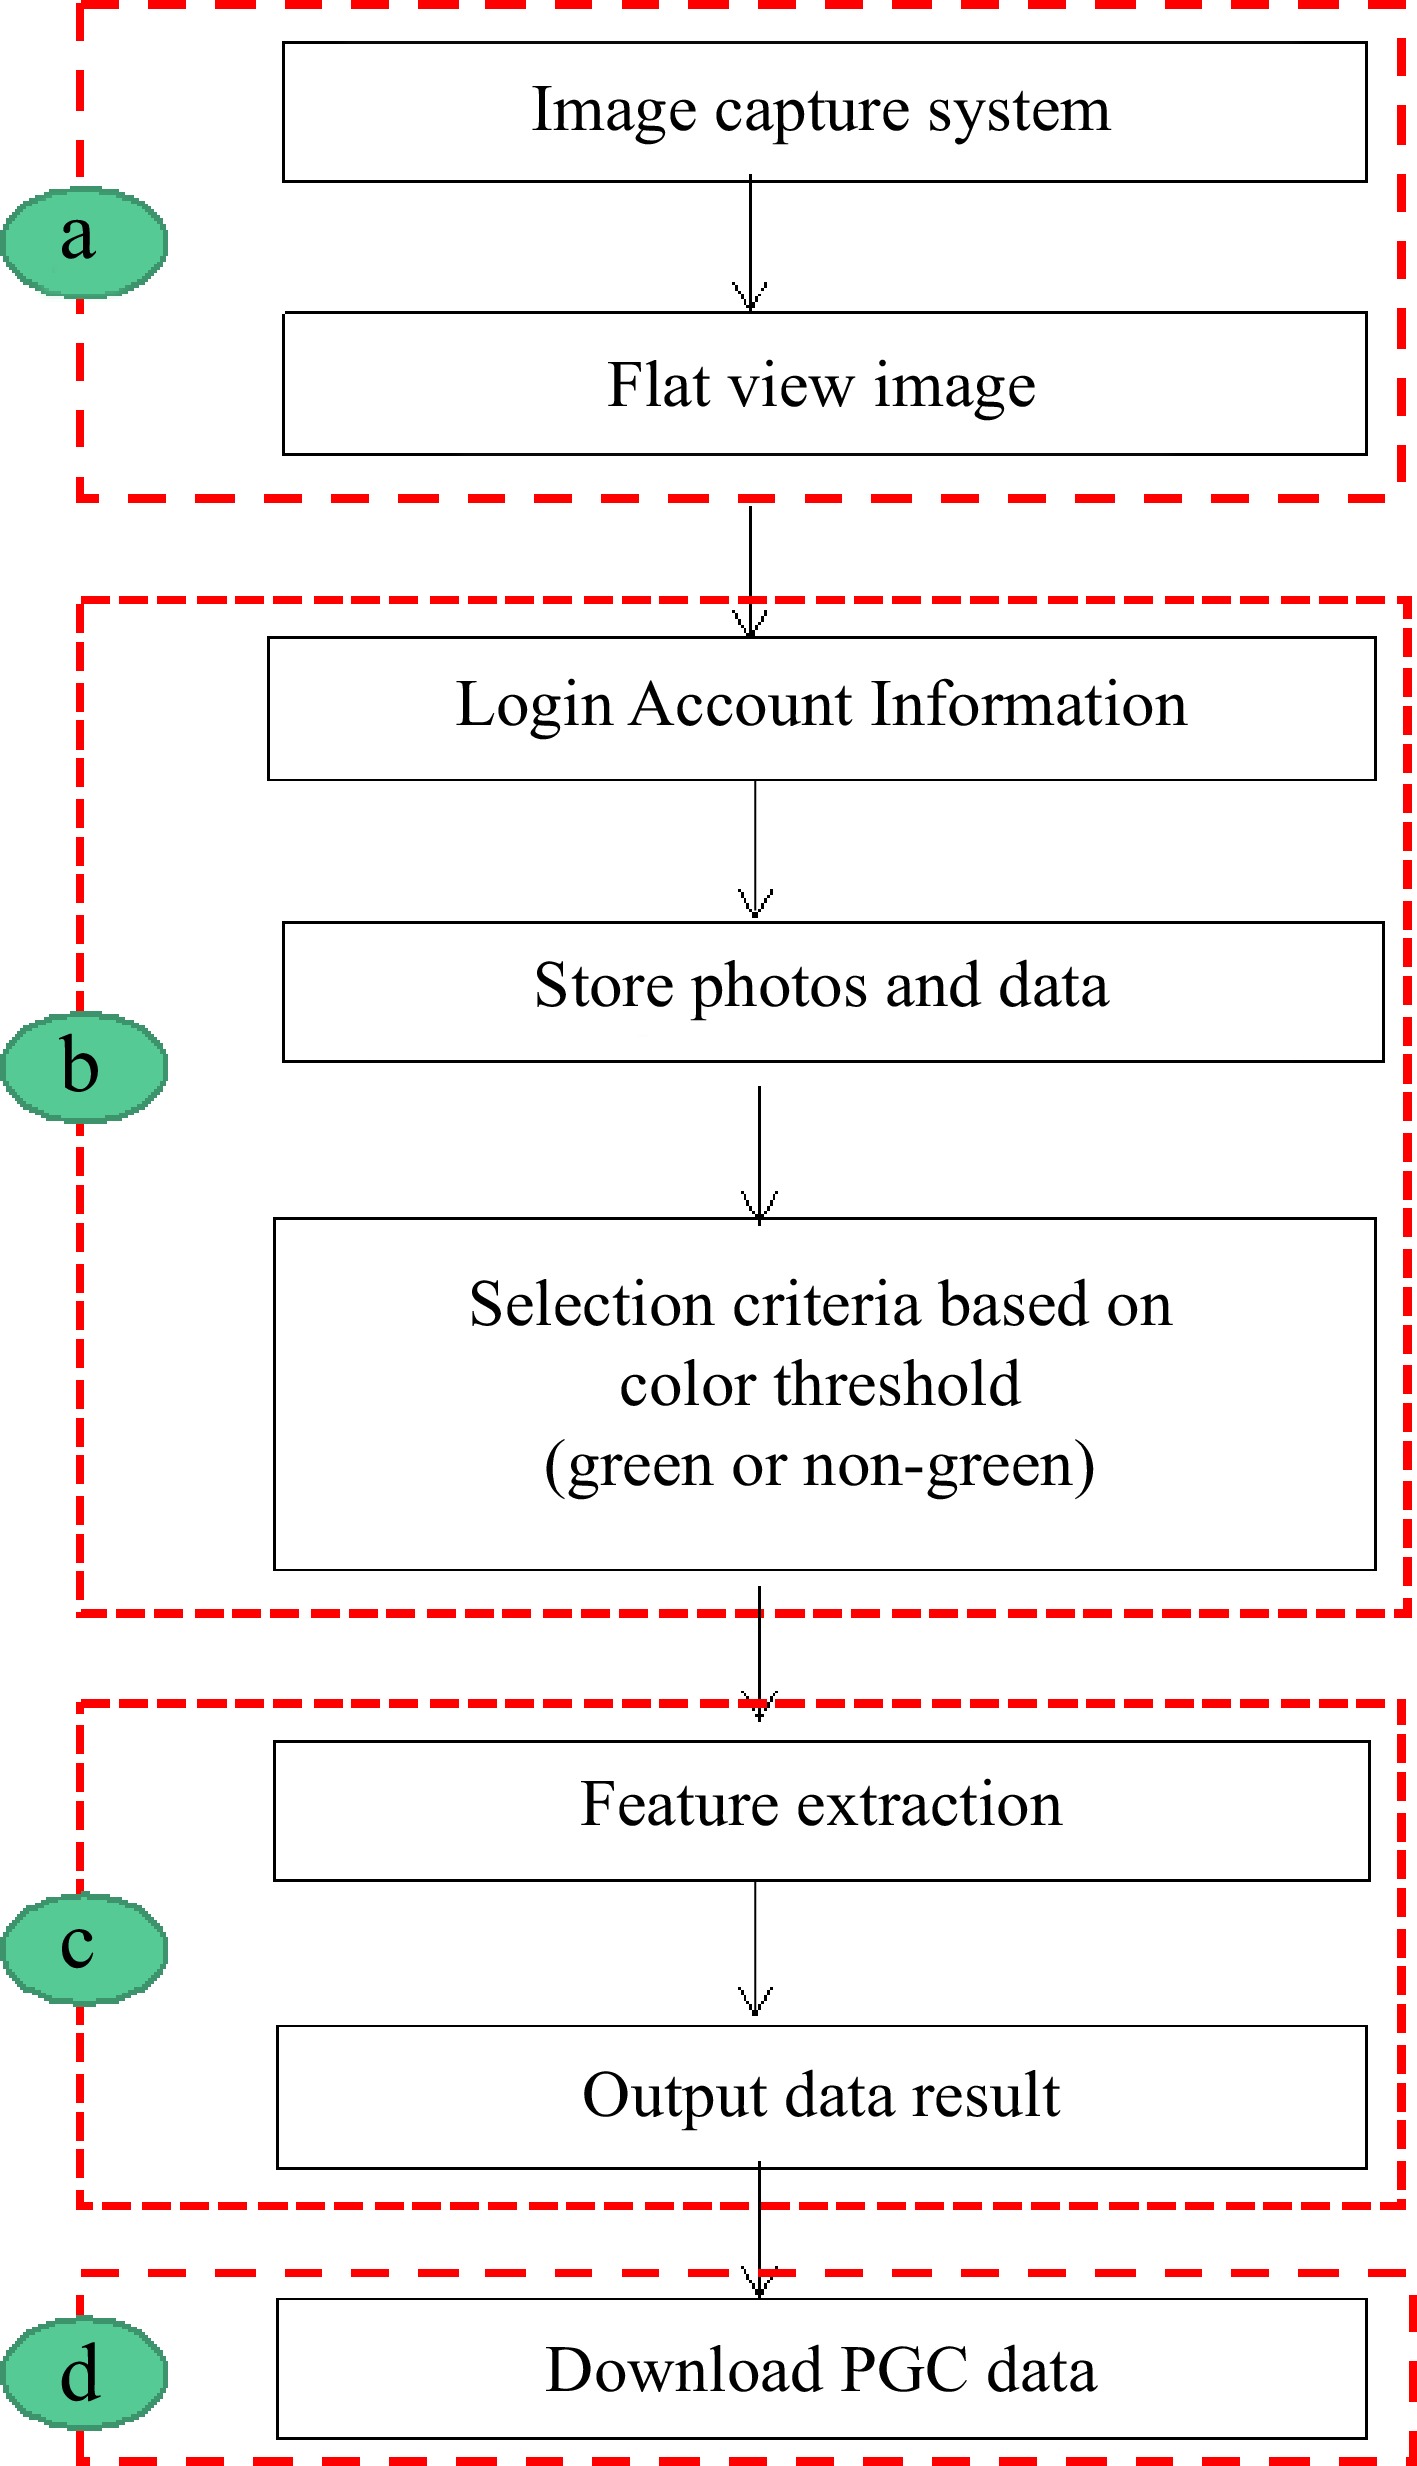
Figure 6.
Image processing steps. (a) The images were obtained with a camera at a certain height and angle. All the images were taken from the same location. (b) The APP website was logged into to obtain the uploaded image. First, the user must log into the Canopeo account, upload and segment the image, extract the contour, and obtain the green and non-green threshold regions. (c) Non-green threshold image feature extraction. (d) The PGC parameters and green or non-green images were downloaded.
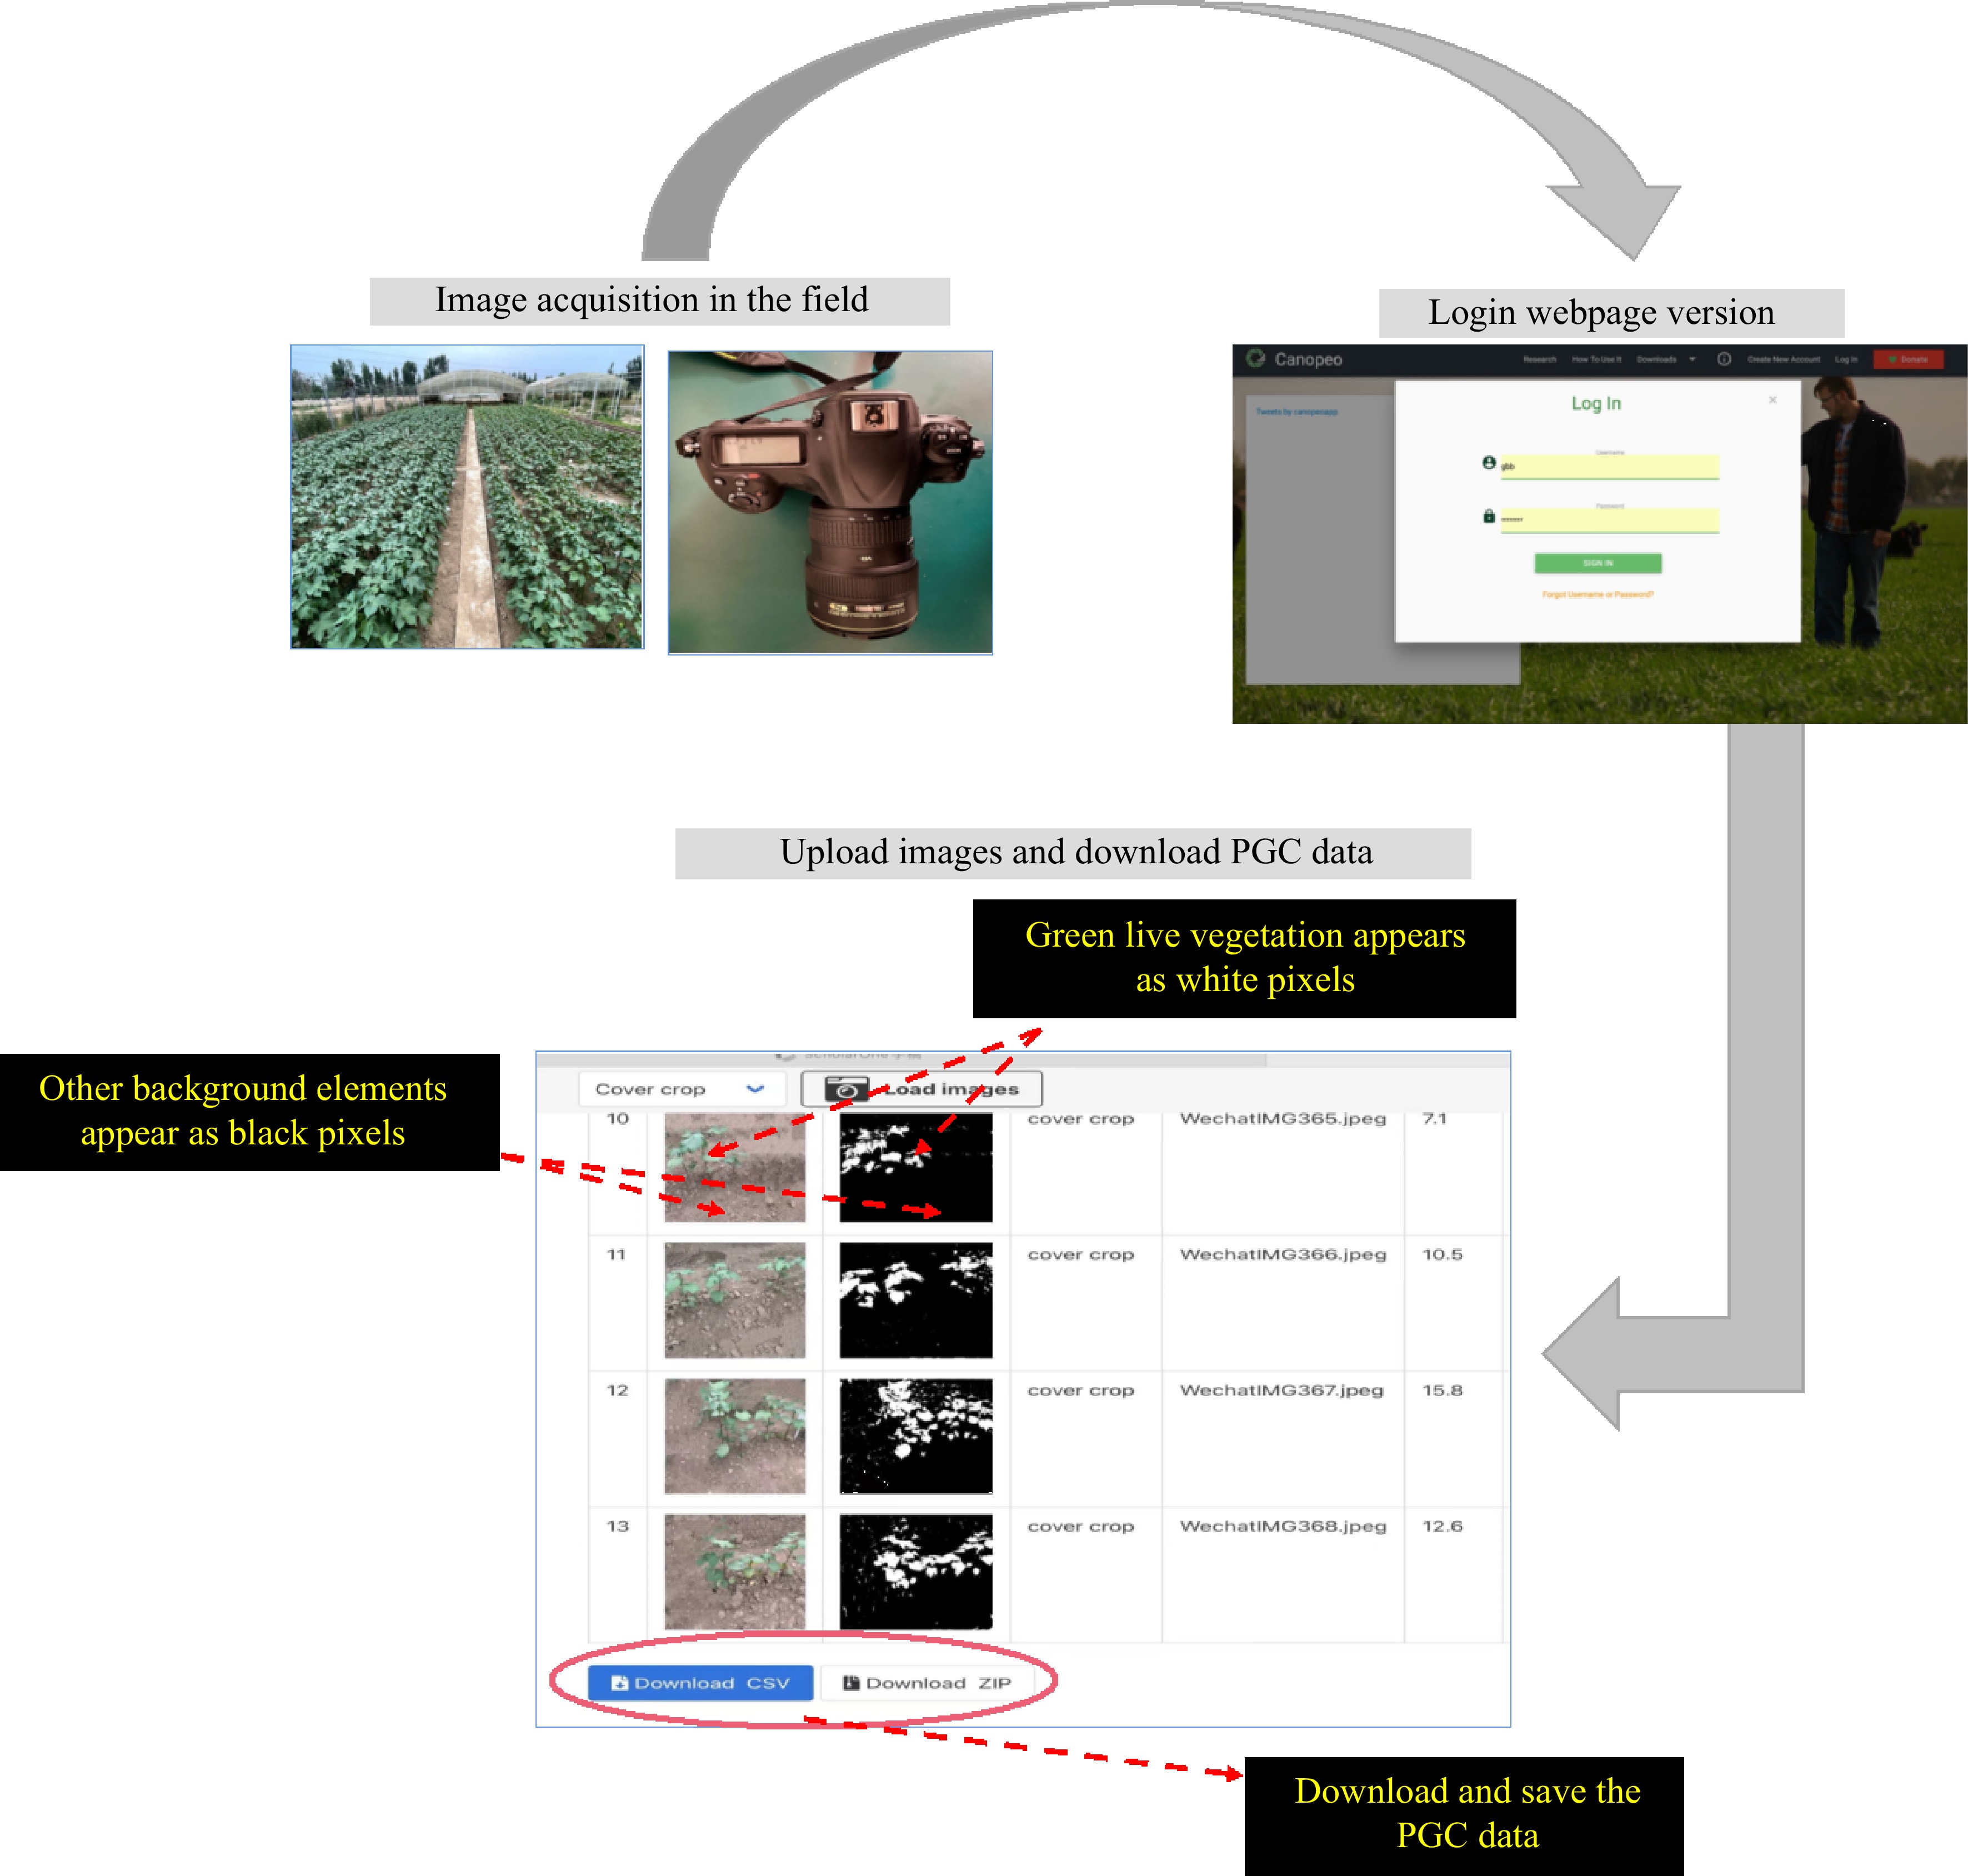
Figure 7.
Workflow hierarchy diagram. The PGC values and images were obtained after uploading to the web page for batch processing. PGC, percentages of green color.
Statistical analysis
-
The data obtained consisted of the structural characteristics of 49 CK and 80 DS varieties and their corresponding HD digital images. To determine whether the models to estimate the PH and AGB exhibited differences among the different cotton genotypes, we used 67% (53) and 33% (27) of the DS samples as the modeling and validation sets, respectively, to construct the models and evaluate their accuracy. Conversely, 80 DS and 49 CK samples were used as the modeling and verification sets, respectively, to construct the models to estimate the PH and AGB and evaluate their correlation with the DS and CK treated cotton plants. Finally, SLR modeling was used to construct the estimation model of cotton PH and AGB.
Evaluation indices
-
The accuracy of cotton PH and AGB prediction models was verified using the validation sets. Briefly, the R2, RMSE, and NRMSE were selected for evaluation of the accuracy of models. A higher R2 value indicates that the model is more accurate and fits better. In contrast, lower RMSE and NRMSE values indicate higher accuracy of the estimation model. When the NRMSE < 10%, the accuracy of the estimation model is considered to be corresponding to the measured value. However, if the values ranged between 10% to 20% and 20% to 30%, the accuracy and consistency of the model is considered and medium, respectively. The accuracy and consistency of the model with an NRMSE that exceeds 30% are considered poor. The specific calculation formula is as follows:
$ {R}^{2}=1-\frac{{\displaystyle\sum }_{\mathrm{i}=1}^{n}{\left(yi-\hat{y}i\right)}^{2}}{{\displaystyle\sum }_{\mathrm{i}=1}^{n}{\left(y\mathrm{i}-\bar{y}\right)}^{2}},\;\;\in \left[\mathrm{0,1}\right] $ (1) $ RMSE=\sqrt{\frac{1}{\mathrm{n}}\displaystyle\mathop\sum\nolimits _{i=1}^{n}{\left(yi-\hat{y}i\right)}^{2}},\;\;\in \left[0\right.,\;\;\left.+\mathrm{\infty }\right) ^{ } $ (2) $ NRMSE=\frac{RMSE}{\bar{y}} ^{ } $ (3) where n is the number of samples; yi is the true values of cotton PH or AGB;
$ \hat{y}i $ $ \bar{y} $ This study was supported by grants from the National Natural Science Foundation of China (No. 31871569 and No. 32172120), Natural Science Foundation of Hebei Province (C2020204066), and the Modern System of Agricultural Technology in Hebei Province (No. HBCT2018040201).
-
The authors declare that they have no conflict of interest.
-
These authors contributed equally: Congcong Guo, Liantao Liu
- Supplemental Table S1 Different cotton genotypes from the Yellow and Yangtze River basins.
- Supplemental Table S2 Soil properties of the experimental field.
- Copyright: © 2022 by the author(s). Published by Maximum Academic Press, Fayetteville, GA. This article is an open access article distributed under Creative Commons Attribution License (CC BY 4.0), visit https://creativecommons.org/licenses/by/4.0/.
-
About this article
Cite this article
Guo C, Liu L, Zhang K, Sun H, Zhang Y, et al. 2022. High-throughput estimation of plant height and above-ground biomass of cotton using digital image analysis and Canopeo. Technology in Agronomy 2:4 doi: 10.48130/TIA-2022-0004 

High-throughput estimation of plant height and above-ground biomass of cotton using digital image analysis and Canopeo
- Received: 01 April 2022
- Accepted: 29 October 2022
- Published online: 20 December 2022
Abstract: Plant height and above-ground biomass are important growth parameters that affect crop yield. Efficient and non-destructive technologies of crop phenotypic monitoring play crucial roles in intelligent farmland management. However, the feasibility of using these technologies to estimate cotton plant height and above-ground biomass has not been determined. This study proposed a low cost and high-throughput imaging method combined with Canopeo to extract the percentages of green color from high-definition digital images and establish a model to estimate the cotton plant height and above-ground biomass. The plant height and above-ground biomass field trials were conducted at two levels of irrigation (soil water content 70% ± 5% and 40%−45%, respectively) using 80 cotton genotypes. The linear fitting performed well across the different cotton genotypes (PH, R2 = 0.9829; RMSE = 2.4 cm; NRMSE = 11% and AGB, R2 = 0.9609; RMSE = 0.6 g / plant; and NRMSE = 5%), and two levels of irrigation (PH, R2 = 0.9604; RMSE = 2.15 cm; NRMSE = 6% and AGB, R2 = 0.9650; RMSE = 4.51 g/plant; and NRMSE = 17%). All reached a higher fitting degree. Additionally, the most comprehensive model to estimate the cotton plant height and above-ground biomass (Y = 0.4832*X + 11.04; Y = 0.4621*X − 0.3591) was determined using a simple linear regression modeling method. The percentages of green color positively correlated with plant height and above-ground biomass, and each model exhibited higher accuracy (R2 ≥ 0.8392, RMSE ≤ 0.0158, NRMSE ≤ 0.06%). Combining a high-definition digital camera with Canopeo enables the prediction of crop growth in the field. The simple linear regression modeling method and the most comprehensive model enable the rapid estimation of the cotton plant height and above-ground biomass. This method can also be used as a baseline to measure other important crop phenotypes.
-
Key words:
- Cotton /
- Canopeo /
- Percentages of green color /
- Plant height /
- Above-ground biomass /
- High-throughput digital analysis