ARTICLE   Open Access    

Comparison of SPAD-based leaf greenness and paralleled petiole sap nitrate concentrations for monitoring potato vine nitrogen status

More Information
  • Nitrogen status in potato vines plays an important role in potato production. Leaf greenness meters (SPAD-502) and portable petiole sap Cardy meters are two types of convenient and affordable handheld meters for nitrate-N testing to monitor nitrogen status. Two years of field trials were conducted to compare the feasibility and reliability of the two methods with either meter. 'Atlantic' Potato was grown at nine nitrogen rates from 0 (control) to 360 kg/ha with a 45 kg/ha increment. The nitrogen status was measured at 40, 54, 68, and 82 d after planting by using a SPAD-502 for leaf greenness and a Cardy meter for petiole sap nitrate nitrogen concentrations. Potato yield increased quadratically with the increasing of N fertilizer rate from 0 to 360 kg/ha. The result of this study shows both SPAD readings and petiole sap nitrate N concentrations had positive relationships with the N rates. The SPAD reading was able to distinguish the N status difference only in later growth stages. Petiole sap nitrate N concentration was more sensitive and started differentiating the plant growth with different N rates in early growth stage. Dynamic N fertilization guidance is imperative for optimizing yields with specific cultivars in different growth stages; more studies are needed to establish a dynamic threshold of SPAD reading for leaf greenness and petiole sap nitrate N concentration.
  • With the development of the world economy, people's lifestyles have changed dramatically, and long-term high-intensity work has put many people's bodies in a sub-healthy state. The increasing incidence of various chronic diseases has not only put enormous pressure on society's healthcare systems but also caused endless suffering to people[1]. Therefore, people's demands on the functionality and safety of food are increasing, and it has become the consensus of people that 'not just eating enough, but more importantly eating well'.

    Rice is the staple food for more than half of the world's population and the main economic source for a large number of rural people[2]. However, due to the rising cost of rice cultivation, farmers are gaining less and less economic benefits from growing rice, which seriously undermines their incentive to grow rice and poses a serious threat to world food security. Increasing the added value of rice not only helps to increase farmers' income but also helps to ensure world food security. The presence of a large number of functional ingredients in rice makes it possible to increase the added value of rice, and functional rice has therefore been widely noticed.

    Functional rice refers to rice containing certain specific components that play a regulatory and balancing role in human physiological functions in addition to the nutrients necessary for human growth and development in the endosperm, embryo, and rice bran. They can increase human physiological defense mechanisms, prevent certain diseases, help recovery, delay aging, and boost physical strength and energy levels[3]. Rice is a staple food for more than half of the world's population[4], and its functional components have a great potential to be exploited for human welfare. Using functional rice as a carrier to address health problems and realize 'medicine-food homology' is an excellent motivation for promoting functional rice. The current typical functional rice is introduced in this paper. It also summarizes the breeding and cultivation technologies of functional rice.

    Rice has a high glycemic index. Its long-term consumption leads to obesity, diabetes, and colon disease in many people[5]. However, the consumption of rice rich in resistant starch (RS) can greatly reduce the risk of these diseases[6]. Therefore, breeding rice varieties with high RS content has attracted considerable attention from breeders in various countries. However, the variability of RS content between different rice varieties is low, and there are few germplasm resources available for selection, thus making it challenging to breed rice varieties with high RS content using traditional breeding methods. Combining traditional and modern molecular breeding techniques can greatly improve the successful production of high RS rice breeds. Nishi et al.[7] selected a high RS rice variety EM10 by treating fertilized egg cells of Kinmaze with N-methyl-N-nitrosourea. However, its yield was very low, and it was not suitable for commercial production. Wada et al.[8] crossed 'Fukei 2032' and 'EM129' as parents and selected Chikushi-kona 85, a high RS rice variety with a higher yield than EM10. Miura et al.[9] bred ultra-high RS BeI-BEIIB double mutant rice by crossing the Abe I and Abe IIB mutant strains, and the content of RS in the endosperm reached 35.1%. Wei et al.[10] found that the simultaneous inhibition of starch branching enzyme (SBE) genes SBEIIb and SBEI in Teqing by antisense RNA could increase the RS content in rice to 14.9%. Zhu et al.[11] used RNAi technology to inhibit the expression of SBEI and SBEII genes in rice, which increased the content of RS in rice endosperm from 0 to 14.6 %. Zhou et al.[6] found that rice RS formation is mainly controlled by soluble starch synthase (SSIIA). However, its regulation is dependent on the granule-bound starch synthase Waxy (Wx), and SSIIA deficiency combined with high expression of Wxa facilitates the substantial accumulation of RS in the rice. The results of Tsuiki et al.[12] showed that BEIB deficiency was the main reason for the increased accumulation of RS in rice. Itoh et al.[13] developed new mutant rice lines with significantly higher levels of RS in rice by introducing genes encoding starch synthase and granule-bound starch synthase in the rice into the BEIB-deficient mutant line be2b.

    The accumulation of anthocyanins/proanthocyanidins in the seed coat of the rice grain gives brown rice a distinct color[14]. Most common rice varieties lack anthocyanins in the seed coat, and so far, no rice variety with colored endosperm in its natural state has been identified. However, Zhu et al.[15] bred rice with purple endosperm using transgenic technology. Red rice contains only proanthocyanidins, while black and purple rice contain anthocyanidins and proanthocyanidins[16]. Red seed coat of rice was found to be controlled by the complementary effects of two central effect genes Rc and Rd. The loss of function of the Rc gene prevented the synthesis of proanthocyanidins, while the Rd gene could enhance the effect of the Rc gene in promoting proanthocyanidins synthesis[17]. Purple seed coat color is controlled by two dominant complementary genes Pb and Pp. Pb determines the presence or absence of seed coat color, and Pp determines the depth of seed coat color[18]. In addition, phycocyanin synthesis is also regulated by transcription factors such as MYB, bHLH, HY5, and WD40[14], but the exact regulatory mechanism is not clear. Colored rice is rich in bioactive components, such as flavonoids, phenolic acids, vitamin E (VE), glutelin, phytosterols, and phytic acid (PA). It also contains large amounts of micronutrients such as Ca, Fe, Zn, and Se[19], and has a much higher nutritional and health value than ordinary white rice. In addition, Zhu et al.[20] successfully developed rice with enriched astaxanthin in the endosperm by introducing the genes sZmPSY1, sPaCrtI, sCrBKT, and sHpBHY. This achievement has laid a solid foundation for the further development of functional rice industry.

    Giant embryo rice refers to rice varieties whose embryo volume is more than twice that of ordinary rice[21]. Rice embryo contains more nutrients than the endosperm; therefore, the nutritional value of giant embryo rice greatly exceeds that of ordinary rice. Studies have found that the levels of γ-aminobutyric acid (GABA), essential amino acids, VE, γ-oryzanol, phenols, and trace elements in giant embryo rice are considerably higher than that in ordinary rice[21]. Satoh & Omura[22] used the chemical mutagen N-methyl-N-nitrosourea to treat the fertilized egg cells of the rice variety Kinmaze to obtain a 'giant embryo' mutant. The mutants’ embryo occupied 1/4–1/3 of the rice grain volume and was 3–4 times larger than normal rice embryo[23]. Its GABA content increased dramatically after the rice was soaked in water. Maeda et al.[24] crossed the giant embryo mutant EM40 of Kinmaze with the high-yielding variety Akenohoshi to produce the giant embryo rice variety 'Haiminori'. The embryo size of 'Haiminori' is 3–4 times that of ordinary rice, and the GABA content of its brown rice is 3–4 times higher than that of 'Nipponbare' and 'Koshihikari' after soaking for four hours in water. A few genes that can regulate the size of rice embryos have been identified, and GE is the first identified rice giant embryo gene[25]. Nagasawa et al.[26] found that the loss of GE gene function resulted in enlarged embryos and smaller endosperm in rice. Lee et al.[27] found that the inhibition of LE gene expression by RNAi technology could lead to embryo enlargement in rice, but the regulatory mechanism remains to be investigated.

    Protein is the second most crucial nutrient in rice, accounting for 7–10% of the grain weight, and glutenin accounts for 60%–80% of the total protein content in rice grains[28]. Compared to other proteins, glutenin is more easily digested and absorbed by the body[29]. Therefore, higher glutenin content in rice can improve its nutritional value. However, people with renal disease (a common complication of diabetes) have impaired protein metabolism, and consumption of rice with lower glutelin content can help reduce their protein intake and metabolic burden[30]. Japanese breeders treated Nihonmasari with the chemical mutagen ethyleneimine and selected the low-glutelin rice mutant NM67[31]. Iida et al.[31] developed a new rice variety LGC-1 (Low glutelin content-1) with a glutelin content of less than 4% by backcrossing the NM67 mutant with the original variety 'Nihonmasari'. According to Miyahara[32], the low glutelin trait in LGC-1 is controlled by a single dominant gene Lgc-1 located on chromosome 2. Subsequently, Nishimura et al.[33] produced two rice varieties, 'LGC Katsu' and 'LGC Jun' with lower glutelin content by crossing LGC1 with a mutant line Koshikari (γ-ray induction) lacking 26 kDa globulin (another easily digestible protein).

    Vitamin A (VA) is one of the essential nutrients for the human body[34]. However, rice, a staple food, lacks VA, leading to a VA deficiency in many people. β-carotene is a precursor for VA synthesis and can be effectively converted into VA in the human body[35]. Therefore, breeding rice varieties rich in β-carotene has attracted the attention of breeders in various countries. Ye et al.[36] simultaneously transferred phytoene synthase (psy), phytoene desaturase (crt I), and lycopene β-cyclase (lcy) genes into rice using the Agrobacterium-mediated method and produced the first generation of golden rice with a β-carotene content of 1.6 µg·g−1 in the endosperm. However, due to the low content of β-carotene in rice, it is difficult to meet the human body's demand for VA. To increase β-carotene content in rice, Paine et al.[37] introduced the phytoene synthase (psy) gene from maize and the phytoene desaturase (crt I) gene from Erwinia into rice. They obtained the second generation of golden rice with 37 µg g−1 of β-carotene in the endosperm, with nearly 23-fold increase in β-carotene content compared to the first generation of golden rice.

    Fe and Zn are essential trace elements for human beings. The contents of Fe and Zn in common rice are about 2 μg·g−1 and 16 μg·g−1, respectively[38], which are far from meeting human needs. In 2004, to alleviate micronutrient deficiencies among underprivileged people in developing countries, the Consultative Group on International Agricultural Research launched the HarvestPlus international collaborative program for improving Fe, Zn, and β-carotene levels in staple crops, with breeding targets of 13 μg·g−1 and 28 μg·g−1 for Fe and Zn in rice, respectively. Masuda et al.[39] found that expression of the nicotianamine synthase (NAS) gene HvNAS in rice resulted in a 3-fold increase in Fe and a 2-fold increase in Zn content in polished rice. Trijatmiko et al.[38] overexpressed rice OsNAS2 gene and soybean ferritin gene SferH-1 in rice, and the Fe and Zn content in polished rice of rice variety NASFer-274 reached 15 μg·g−1 and 45.7 μg·g−1, respectively. In addition, it has been found that increasing Fe intake alone does not eliminate Fe deficiency but also decreases the amount of Fe absorption inhibitors in the diet or increases the amount of Fe absorption enhancers[40]. The negatively charged phosphate in PA strongly binds metal cations, thus reducing the bioavailability of Fe and Zn in rice[41], while the sulfhydryl group in cysteine binds Fe, thereby increasing the absorption of non-heme Fe by the body[42]. To improve the bioavailability of Fe and Zn, Lucca et al.[40] introduced a heat-tolerant phytase (phyA) gene from Aspergillus fumigatus into rice and overexpressed the cysteine-rich protein gene (rgMT), which increased the content of phytase and cysteine residues in rice by 130-fold and 7-fold, respectively[40].

    The functional quality of rice is highly dependent on germplasm resources. Current functional rice breeding mainly adopts transgenic and mutagenic technologies, and the cultivated rice varieties are mainly enriched with only one functional substance and cannot meet the urgent demand by consumers for rice enriched with multiple active components. The diversity of rice active components determines the complexity of multifunctional rice breeding. In order to cultivate multifunctional rice, it is necessary to strengthen the application of different breeding technologies. Gene polymerization breeding is a crop breeding technology that can polymerize multiple superior traits that have emerged in recent years, mainly including traditional polymerization breeding, transgenic polymerization breeding, and molecular marker-assisted selection polymerization breeding.

    The transfer of beneficial genes in different species during traditional polymeric breeding is largely limited by interspecific reproductive isolation, and it is challenging to utilize beneficial genes between different species effectively. Gene transfer through sexual crosses does not allow accurate manipulation and selection of a gene and is susceptible to undesirable gene linkage, and in the process of breed selection, multiple backcrosses are required[43]. Thus, the period of selecting target plants is long, the breeding cost is high, and the human resources and material resources are costly[44]. Besides, it is often difficult to continue the breakthrough after a few generations of backcrossing due to linkage drag. Thus, there are significant limitations in aggregating genes by traditional breeding methods[45].

    Transgenic technology is an effective means of gene polymerization breeding. Multi-gene transformation makes it possible to assemble multiple beneficial genes in transgenic rice breeding rapidly and can greatly reduce the time and workload of breeding[46]. The traditional multi-gene transformation uses a single gene transformation and hybridization polymerization method[47], in which the vector construction and transformation process is relatively simple. However, it is time-consuming, laborious, and requires extensive hybridization and screening efforts. Multi-gene-based vector transformation methods can be divided into two major categories: multi-vector co-transformation and multi-gene single vector transformation[47]. Multi-vector co-transformation is the simultaneous transfer of multiple target genes into the same recipient plant through different vectors. The efficiency of multi-vector co-transformation is uncertain, and the increase in the number of transforming vectors will increase the difficulty of genetic screening, resulting in a reduced probability of obtaining multi-gene co-transformed plants. Multi-gene single vector transformation constructs multiple genes into the T-DNA region of a vector and then transfers them into the same recipient plant as a single event. This method eliminates the tedious hybridization and backcrossing process and solves the challenges of low co-transformation frequency and complex integration patterns. It can also avoid gene loss caused by multi-gene separation and recombination in future generations[47]. The transgenic method can break through the limitations of conventional breeding, disrupt reproductive isolation, transfer beneficial genes from entirely unrelated crops to rice, and shorten the cycle of polymerizing target genes significantly. However, there are concerns that when genes are manipulated, unforeseen side effects may occur, and, therefore, there are ongoing concerns about the safety of transgenic crops[48]. Marker-free transgenic technology through which selective marker genes in transgenic plants can be removed has been developed. This improves the safety of transgenic crops, is beneficial to multiple operations of the same transgenic crop, and improves the acceptance by people[49].

    Molecular marker-assisted selection is one of the most widely used rice breeding techniques at present. It uses the close linkage between molecular markers and target genes to select multiple genes directly and aggregates genes from different sources into one variety. This has multiple advantages, including a focused purpose, high accuracy, short breeding cycle, no interference from environmental conditions, and applicability to complex traits[50]. However, few genes have been targeted for the main effect of important agronomic traits in rice, and they are mainly focused on the regulation of rice plant type and the prevention and control of pests and diseases, and very few genes related to the synthesis of active components, which can be used for molecular marker-assisted selection are very limited. Furthermore, the current technical requirements and costs for analyzing and identifying DNA molecular markers are high, and the identification efficiency is low. This greatly limits the popularization and application of functional rice polymerization breeding. Therefore, to better apply molecular marker-assisted selection technology to breed rice varieties rich in multiple active components, it is necessary to construct a richer molecular marker linkage map to enhance the localization of genes related to functional substance synthesis in rice[51]. Additionally, it is important to explore new molecular marker technologies to improve efficiency while reducing cost.

    It is worth noting that the effects of gene aggregation are not simply additive. There are cumulative additive effects, greater than cumulative epistatic effects, and less than cumulative epistatic effects among the polymerization genes, and the effects are often smaller than the individual effect. Only with a clearer understanding of the interaction between different QTLs or genes can functional rice pyramiding breeding be carried out reasonably and efficiently. Except for RS and Se, other active components of rice mainly exist in the rice bran layer, and the content of active components in the endosperm, the main edible part, is extremely low. Therefore, cultivating rice varieties with endosperm-enriched active components have broad development prospects. In addition, because crops with high quality are more susceptible to pests and diseases[52], the improvement of rice resistance to pests and diseases should be considered during the polymerization breeding of functional rice.

    The biosynthesis of active components in rice is influenced by rice varieties but also depends on cultivation management practices and their growth environment.

    Environmental conditions have a greater effect on protein content than genetic forces[53]. Both light intensity and light duration affect the synthesis and accumulation of active components in rice. Low light intensity in the early stage of rice growth is not conducive to the accumulation of glutelin in rice grains but favors the accumulation of amylose, while the opposite is true in the late stage of rice growth[54]. Low light intensity during the grain-filling period reduces the accumulation of total flavonoids in rice[55] and decreases Fe ions' movement in the transpiration stream and thereby the transport of Fe ions to rice grains[56]. An appropriate increase in light intensity is beneficial to the accumulation of flavonoids, anthocyanins, and Fe in rice, but the photostability of anthocyanins is poor, and too much light will cause oxidative degradation of anthocyanins[57]. Therefore, functional rice is best cultivated as mid-late rice, which would be conducive to accumulating active components in rice.

    The temperature has a great influence on the synthesis of active components in rice. An appropriate increase in the temperature is beneficial to the accumulation of γ-oryzanol[58] and flavonoids[59] in rice. A high temperature during the grain-filling period leads to an increase in glutelin content in rice[60], but an increase in temperature decreases the total phenolic content[61]. The results regarding the effect of temperature on the content of PA in rice were inconsistent. Su et al.[62] showed that high temperatures during the filling period would increase the PA content, while Goufo & Trindade[61] reported that the increase in temperature would reduce the PA content. This may be due to the different growth periods and durations of temperature stress on rice in the two studies. The synthesis of anthocyanins/proanthocyanidins in colored rice requires a suitable temperature. Within a certain range, lower temperatures favor the accumulation of anthocyanins/proanthocyanidins in rice[63]. Higher temperatures will lead to degradation, and the thermal stability of proanthocyanidins being higher than that of anthocyanins[64]. In addition, cold or heat stress facilitates GABA accumulation in rice grains[65]. Therefore, in actual production, colored rice and low-glutelin rice are best planted as late rice, and the planting time of other functional rice should be determined according to the response of its enriched active components to temperature changes.

    Moderate water stress can significantly increase the content of glutelin[66] and GABA[67] in rice grains and promote the rapid transfer of assimilation into the grains, shorten the grain filling period, and reduce the RS content[68]. Drought stress can also induce the expression of the phytoene synthase (psy) gene and increase the carotenoid content in rice[69]. Soil moisture is an important medium in Zn diffusion to plant roots. In soil with low moisture content, rice roots have low available Zn, which is not conducive to enriching rice grains with Zn[70]. Results from studies on the effect of soil water content on Se accumulation in rice grains have been inconsistent. Li et al.[71] concluded that flooded cultivation could significantly increase the Se content in rice grains compared to dry cultivation. However, the results of Zhou et al.[72] showed that the selenium content in rice grains under aerobic and dry-wet alternative irrigation was 2.44 and 1.84 times higher than that under flood irrigation, respectively. This may be due to the forms of selenium contained in the soil and the degree of drought stress to the rice that differed between experiments[73]. In addition, it has been found that too much or too little water impacts the expression of genes related to anthocyanin synthesis in rice, which affects the accumulation of anthocyanins in rice[74]. Therefore, it is recommended to establish different irrigation systems for different functional rice during cultivation.

    Both the amount and method of nitrogen application affect the accumulation of glutelin. Numerous studies have shown that both increased and delayed application of nitrogen fertilizer can increase the accumulation of lysine-rich glutelin to improve the nutritional quality of rice (Table 1). However, this improvement is not beneficial for kidney disease patients who cannot consume high glutelin rice. Nitrogen stress can down-regulate the expression of ANDs genes related to the anthocyanins biosynthesis pathway in grains, resulting in a decrease in anthocyanins synthesis[55]. Increased nitrogen fertilizer application can also increase the Fe, Zn, and Se content in rice[75,76]. However, some studies have found that increased nitrogen fertilizer application has no significant effect on the Fe content of rice[77], while other studies have shown that increased nitrogen fertilizer application will reduce the Fe content of rice[78]. This may be influenced by soil pH and the form of the applied nitrogen fertilizer. The lower the soil pH, the more favorable the reduction of Fe3+ to Fe2+, thus promoting the uptake of Fe by rice. Otherwise, the application of ammonium fertilizer can improve the availability of soil Fe and promote the absorption and utilization of Fe by rice. In contrast, nitrate fertilizer can inhibit the reduction of Fe3+ and reduce the absorption of Fe by rice[79].

    Table 1.  Effect of nitrogen fertilizer application on glutelin content of rice.
    SampleN level
    (kg ha−1)
    Application timeGlutelin content
    (g 100 g−1)
    References
    Rough rice05.67[66]
    270Pre-transplanting : mid tillering : panicle initiation : spikelet differentiation = 2:1:1:16.92
    300Pre-transplanting : mid tillering : panicle initiation : spikelet differentiation = 5:2:2:16.88
    Brown rice05.35[83]
    90Pre-transplanting : after transplanting = 4:16.01
    Pre-transplanting : after transplanting = 1:16.60
    180Pre-transplanting : after transplanting = 4:16.53
    Pre-transplanting : after transplanting = 1:17.29
    270Pre-transplanting : after transplanting = 4:17.00
    Pre-transplanting : after transplanting = 1:17.66
    Rough rice05.59[84]
    187.5Pre-transplanting : after transplanting = 4:16.47
    Pre-transplanting : after transplanting = 1:16.64
    300Pre-transplanting : after transplanting = 4:17.02
    Pre-transplanting : after transplanting = 1:17.14
    Polished rice03.88[85]
    90Pre-transplanting : tillering : booting = 2:2:14.21
    180Pre-transplanting : tillering : booting = 2:2:14.43
    270Pre-transplanting : tillering : booting = 2:2:16.42
    360Pre-transplanting : tillering : booting = 2:2:14.87
    Brown rice09.05[86]
    120Flowering22.14
     | Show Table
    DownLoad: CSV

    Appropriate application of phosphorus fertilizer is beneficial in promoting the translocation of Fe and Zn from leaves to rice grains, thus increasing the content in rice grains[80]. However, the excessive application of phosphate fertilizer will reduce the availability of Fe and Zn in soil, resulting in less uptake by the roots and a lower content in the rice grains[81]. The content of PA in rice increased with a higher phosphorus fertilizer application rate[80]. Increasing the phosphorus fertilizer application rate would increase the values of [PA]/[Fe] and [PA]/[Zn] and reduce the effectiveness of Fe and Zn in rice[80]. Currently, there are few studies on the effect of potassium fertilization on the synthesis of active components in rice. Available studies report that increased application of nitrogen fertilizer can increase the Zn content in rice[82]. Therefore, the research in this area needs to be strengthened.

    Because the iron in soil mainly exists in the insoluble form Fe3+, the application of iron fertilizer has little effect on rice biofortification[87]. There are different opinions about the effect of Zn fertilizer application methods. Phattarakul et al.[88] believed that foliar spraying of Zn fertilizer could significantly improve the Zn content in rice grains. Jiang et al.[89] concluded that most of the Zn accumulated in rice grains were absorbed by the roots rather than from the reactivation of Zn in leaves. In contrast, Yuan et al.[90] suggested that soil application of Zn fertilizer had no significant effect on Zn content in rice grains. The different results may be affected by the form of zinc fertilizer applied and the soil conditions in the experimental sites. Studies have found that compared with the application of ZnEDTA and ZnO, zinc fertilizer in the form of ZnSO4 is most effective for increasing rice's Zn[70]. In addition, the application of zinc fertilizer reduces the concentration of PA in rice grains[70].

    The form of selenium fertilizer and the method and time of application will affect the accumulation of Se in rice grains. Regarding selenium, rice is a non-hyperaccumulative plant. A moderate application of selenium fertilizer can improve rice yield. However, the excessive application can be toxic to rice, and the difference between beneficial and harmful supply levels is slight[91]. Selenite is readily adsorbed by iron oxide or hydroxide in soil, and its effectiveness in the soil is much lower than selenite[92]. In addition, selenate can migrate to the roots and transfer to rice shoots through high-affinity sulfate transporters. In contrast, selenite is mainly assimilated into organic selenium in the roots and transferred to the shoots in smaller amounts[93]. Therefore, the biological effectiveness of Se is higher in selenate-applied soil than in selenite application[94] (Table 2). Zhang et al.[95] found that the concentration of Se in rice with soil application of 100 g Se ha-1 was only 76.8 μg·kg-1, while the concentration of Se in rice with foliar spray of 75 g Se ha-1 was as high as 410 μg·kg-1[73]. However, the level of organic selenium was lower in rough rice with foliar application of selenium fertilizer compared to soil application[96], while the bioavailability of organic selenium in humans was higher than inorganic selenium[97]. Deng et al.[73] found that the concentrations of total selenium and organic selenium in brown rice with selenium fertilizer applied at the full heading stage were 2-fold higher than those in brown rice with selenium fertilizer applied at the late tillering stage (Table 2). Although the application of exogenous selenium fertilizer can rapidly and effectively increase the Se content of rice (Table 2), it can easily lead to excessive Se content in rice and soil, which can have adverse effects on humans and the environment. Therefore, breeding Se-rich rice varieties is a safer and more reliable way to produce Se-rich rice. In summary, functional rice production should include the moderate application of nitrogen and phosphorus fertilizer and higher levels of potassium fertilizer, with consideration to the use of trace element fertilizers.

    Table 2.  Effect of selenium fertilizer application on the selenium content of rice.
    SampleSe level (g Se ha−1)Selenium fertilizer formsApplication methodSe content (μg·g−1)References
    Rough rice00.002[98]
    18SeleniteFoliar spray at full heading0.411
    Polished rice00.071[99]
    20SeleniteFoliar spray at full heading0.471
    20SelenateFoliar spray at full heading0.640
    Rough rice75SeleniteFoliar spray at late tillering0.440[73]
    75SeleniteFoliar spray at full heading1.290
    75SelenateFoliar spray at late tillering0.780
    75SelenateFoliar spray at full heading2.710
    Polished rice00.027[100]
    15SeleniteFoliar spray at full heading0.435
    45SeleniteFoliar spray at full heading0.890
    60SeleniteFoliar spray at full heading1.275
     | Show Table
    DownLoad: CSV

    The content of many active components in rough rice is constantly changing during the development of rice. It was found that the content of total flavonoids in brown rice increased continuously from flowering stage to dough stage and then decreased gradually[101]. The γ-oryzanol content in rice decreased by 13% from milk stage to dough stage, and then gradually increased to 60% higher than milk stage at full maturity[101]. The results of Shao et al.[102] showed that the anthocyanin content in rice reached its highest level at two weeks after flowering and then gradually decreased. At full ripeness, and the anthocyanins content in brown rice was only about 50% of the maximum level. The content of total phenolics in rice decreased with maturity from one week after flowering to the fully ripe stage, and the loss of total phenolics reached more than 47% by the fully ripe stage. In contrast, the content of total phenolics in black rice increased with maturity[102]. Moreover, RS content in rough rice decreases during rice maturation[68]. Therefore, the production process of functional rice should be timely and early harvested to obtain higher economic value.

    Pests and diseases seriously impact the yield and quality of rice[103]. At present, the two most effective methods to control pests and diseases are the use of chemical pesticides and the planting of pest and disease-resistant rice varieties. The use of chemical pesticides has greatly reduced the yield loss of rice. However, excessive use of chemical pesticides decreases soil quality, pollutes the environment, reduces soil biodiversity[104], increases pest resistance, and aggravates the adverse effects of pests and diseases on rice production[105]. It also increases residual pesticide levels in rice, reduces rice quality, and poses a severe threat to human health[106].

    Breeding pest and disease-resistant rice varieties are among the safest and effective ways to control rice pests and diseases[107]. In recent years, many pest and disease resistance genes from rice and microorganisms have been cloned[47]. Researchers have used these genes to breed rice varieties resistant to multiple pests and diseases through gene polymerization breeding techniques. Application in production practices delivered good ecological and economic benefits[108].

    Green pest and disease control technologies must consider the synergies between rice and water, fertilizer, and pest and disease management. In this regard, the rice-frog, rice-duck, and other comprehensive rice production models that have been widely used in recent years are the most representative. These rice production models significantly reduced chemical pesticide usage and effectively controlled rice pests and diseases[109]. The nutritional imbalance will reduce the resistance of rice to pests and diseases[110]. Excessive application of nitrogen fertilizer stimulates rice overgrowth, protein synthesis, and the release of hormones, increasing its attractiveness to pests[111]. Increased soluble protein content in rice leaves is more conducive to virus replication and increases the risk of viral infection[112]. Increasing the available phosphorus content in the soil will increase crop damage by pests[113], while insufficient potassium supply will reduce crop resistance to pests and diseases[114]. The application of silica fertilizer can boost the defense against pests and diseases by increasing silicon deposition in rice tissue, inducing the expression of genes associated with rice defense mechanisms[115] and the accumulation of antifungal compounds in rice tissue[116]. The application of silica fertilizer increases the release of rice volatiles, thereby attracting natural enemies of pests and reducing pest damage[117]. Organic farming increases the resistance of rice to pests and diseases[118]. In addition, rice intercropping with different genotypes can reduce pests and diseases through dilution and allelopathy and changing field microclimate[119].

    In conclusion, the prevention and control of rice pests and diseases should be based on chemical and biological control and supplemented by fertilizer management methods such as low nitrogen, less phosphorus, high potassium and more silicon, as well as agronomic measures such as rice-aquaculture integrated cultivation, organic cultivation and intercropping of different rice varieties, etc. The combined use of multiple prevention and control measures can improve the yield and quality of functional rice.

    Functional rice contains many active components which are beneficial to maintaining human health and have high economic and social value with broad market prospects. However, the current development level of the functional rice industry is low. The development of the functional rice requires extensive use of traditional and modern polymerization breeding techniques to cultivate new functional rice varieties with endosperm that can be enriched with multiple active components and have broad-spectrum resistance to pests and diseases. It is also important to select suitable planting locations and times according to the response characteristics of different functional rice active components to environmental conditions.

    This work is supported by the National Natural Science Foundation of China (Project No. 32060430 and 31971840), and Research Initiation Fund of Hainan University (Project No. KYQD(ZR)19104).

  • The authors declare that they have no conflict of interest.

  • [1]

    Rens LR, Zotarelli L, Cantliffe DJ, Stoffella PJ, Gergela D, et al. 2015. Biomass accumulation, marketable yield, and quality of Atlantic potato in response to nitrogen. Agronomy Journal 107:931−42

    doi: 10.2134/agronj14.0408

    CrossRef   Google Scholar

    [2]

    Van Zeghbroeck J, Liu G, Mylavarapu RS, Li YC. 2021. Phosphorus management strategies for potato production in Florida: a review. American Journal of Potato Research 98:347−60

    doi: 10.1007/s12230-021-09851-2

    CrossRef   Google Scholar

    [3]

    Nurmanov YT, Chernenok VG, Kuzdanova RS. 2019. Potato in response to nitrogen nutrition regime and nitrogen fertilization. Field Crops Research 213:115−21

    doi: 10.1016/J.FCR.2018.11.014

    CrossRef   Google Scholar

    [4]

    Rens LR, Zotarelli L, Cantliffe DJ, Stoffella PJ, Gergela D, et al. 2016. Commercial evaluation of seasonal distribution of nitrogen fertilizer for potato. Potato Research 59:1−20

    doi: 10.1007/s11540-015-9304-6

    CrossRef   Google Scholar

    [5]

    Rens L, Zotarelli L, Alva A, Rowland D, Liu G, et al. 2016. Fertilizer nitrogen uptake efficiencies for potato as influenced by application timing. Nutrient Cycling in Agroecosystems 104:175−85

    doi: 10.1007/s10705-016-9765-2

    CrossRef   Google Scholar

    [6]

    Goffart JP, Olivier M, Frankinet M. 2008. Potato crop nitrogen status assessment to improve n fertilization management and efficiency: past-present-future. Potato Research 51:355−83

    doi: 10.1007/s11540-008-9118-x

    CrossRef   Google Scholar

    [7]

    Fernandes FM, Soratto RP, Fernandes AM, Souza EFC. 2021. Chlorophyll meter-based leaf nitrogen status to manage nitrogen in tropical potato production. Agronomy Journal 113:1733−46

    doi: 10.1002/agj2.20589

    CrossRef   Google Scholar

    [8]

    Wu J, Wang D, Rosen CJ, Bauer ME. 2007. Comparison of petiole nitrate concentrations, SPAD chlorophyll readings, and QuickBird satellite imagery in detecting nitrogen status of potato canopies. Field Crops Research 101:96−103

    doi: 10.1016/J.FCR.2006.09.014

    CrossRef   Google Scholar

    [9]

    Busato C, Fontes PCR, Braun H, Cecon PR. 2010. Seasonal variation and threshold values for chlorophyll meter readings on leaves of potato cultivars. Journal of Plant Nutrtion 33:2148−56

    doi: 10.1080/01904167.2010.519087

    CrossRef   Google Scholar

    [10]

    Zheng H, Liu Y, Qin Y, Chen Y, Fan M. 2015. Establishing dynamic thresholds for potato nitrogen status diagnosis with the SPAD chlorophyll meter. Journal of Integretive Agriculture 14:190−95

    doi: 10.1016/S2095-3119(14)60925-4

    CrossRef   Google Scholar

    [11]

    Aguilera J, Motavalli P, Gonzales M, Valdivia C. 2014. Evaluation of a rapid field test method for assessing nitrogen status in potato plant tissue in rural communities in the Bolivian Andean Highlands. Communications in Soil Science and Plant Analysis 45:347−61

    doi: 10.1080/00103624.2013.857680

    CrossRef   Google Scholar

    [12]

    Mackerron DKL, Young MW, Davies HV. 1995. A critical assessment of the value of petiole sap analysis in optimizing the nitrogen nutrition of the potato crop. Plant and Soil 172:247−60

    doi: 10.1007/BF00011327

    CrossRef   Google Scholar

    [13]

    Goffart JP, Olivier M, Frankinet M. 2011. Crop nitrogen status assessment tools in a decision support system for nitrogen fertilization management of potato crops. HortTechnology 21:282−86

    doi: 10.21273/HORTTECH.21.3.282

    CrossRef   Google Scholar

    [14]

    Fontes PCR, Braun H, Busato C, Cecon PR. 2010. Economic optimum nitrogen fertilization rates and nitrogen fertilization rate effects on tuber characteristics of potato cultivars. Potato Research 53:167−79

    doi: 10.1007/s11540-010-9160-3

    CrossRef   Google Scholar

    [15]

    Minotti PL, Halseth DE, Sieczka JB. 1994. Field chlorophyll measurements to assess the nitrogen status of potato varieties. HortScience 29:1497−500

    doi: 10.21273/HORTSCI.29.12.1497

    CrossRef   Google Scholar

    [16]

    Rodrigues MÂ. 2004. Establishment of continuous critical levels for indices of plant and presidedress soil nitrogen status in the potato crop. Communications in Soil Science and Plant Analysis 35:2067−85

    Google Scholar

    [17]

    Vos J, Bom M. 1993. Hand-held chlorophyll meter: a promising tool to assess the nitrogen status of potato foliage. Potato Research 36:301−8

    doi: 10.1007/BF02361796

    CrossRef   Google Scholar

    [18]

    Li L, Qin Y, Liu Y, Hu Y, Fan M. 2012. Leaf positions of potato suitable for determination of nitrogen content with a SPAD meter. Plant Production Science 15:317−22

    doi: 10.1626/PPS.15.317

    CrossRef   Google Scholar

  • Cite this article

    Li Q, Denison J, Gluck M, Liu G. 2023. Comparison of SPAD-based leaf greenness and paralleled petiole sap nitrate concentrations for monitoring potato vine nitrogen status. Vegetable Research 3:30 doi: 10.48130/VR-2023-0030
    Li Q, Denison J, Gluck M, Liu G. 2023. Comparison of SPAD-based leaf greenness and paralleled petiole sap nitrate concentrations for monitoring potato vine nitrogen status. Vegetable Research 3:30 doi: 10.48130/VR-2023-0030

Figures(7)  /  Tables(2)

Article Metrics

Article views(2763) PDF downloads(404)

ARTICLE   Open Access    

Comparison of SPAD-based leaf greenness and paralleled petiole sap nitrate concentrations for monitoring potato vine nitrogen status

Vegetable Research  3 Article number: 30  (2023)  |  Cite this article

Abstract: Nitrogen status in potato vines plays an important role in potato production. Leaf greenness meters (SPAD-502) and portable petiole sap Cardy meters are two types of convenient and affordable handheld meters for nitrate-N testing to monitor nitrogen status. Two years of field trials were conducted to compare the feasibility and reliability of the two methods with either meter. 'Atlantic' Potato was grown at nine nitrogen rates from 0 (control) to 360 kg/ha with a 45 kg/ha increment. The nitrogen status was measured at 40, 54, 68, and 82 d after planting by using a SPAD-502 for leaf greenness and a Cardy meter for petiole sap nitrate nitrogen concentrations. Potato yield increased quadratically with the increasing of N fertilizer rate from 0 to 360 kg/ha. The result of this study shows both SPAD readings and petiole sap nitrate N concentrations had positive relationships with the N rates. The SPAD reading was able to distinguish the N status difference only in later growth stages. Petiole sap nitrate N concentration was more sensitive and started differentiating the plant growth with different N rates in early growth stage. Dynamic N fertilization guidance is imperative for optimizing yields with specific cultivars in different growth stages; more studies are needed to establish a dynamic threshold of SPAD reading for leaf greenness and petiole sap nitrate N concentration.

    • Florida produces spring potatoes mainly in the tri-county (St. Johns, Putnam, and Flagler Counties, FL, USA) agricultural area (TCAA), where the soil is mostly sandy[1,2]. Supplementing initial soil nitrates with nitrogen (N) fertilization remarkedly affect potato growth and tuber yield[3]. N-fertilizer application rate and timing influence uptake efficiency and tuber yield in this area[4,5]. However, accurate site-specific N recommendations have never been established for potato production due to variable weather, soil, and cultural practices[6]. It is critical to detect nitrogen deficiency as early as possible to estimate supplemental N requirements during the rest of the growing season. Leaf greenness meters (SPAD-502) and portable quick petiole sap nitrate-N meters are two convenient methods to monitor the nitrogen status for potato and other crops[6].

      SPAD meters can be used to estimate leaf greenness content and detect N status under conducive environmental conditions and have optimized N management by reducing application rates for potato production[7]. SPAD readings were able to detect nitrogen deficiency one month after its emergence; petiole sap nitrate-N concentrations were able to be measured two weeks earlier[8] than SPAD readings. This can be explained by the time from nitrate nitrogen assimilation to chlorophyll biosynthesis. The threshold SPAD reading decreased within days after emergence but varied with cultivar and plant site[9,10]. It seems difficult to standardize SPAD threshold values for diagnosing the N status of a specific cultivar[9].

      Petiole sap nitrate concentration is well correlated to potato N status between 20 to 60 d after N deficiency occurrence and has been widely investigated for potato production[6]. Low-cost, portable petiole sap nitrate meters such as Horiba Cardy meter have been used as a rapid field test method to improve nitrogen management[11]. However, the influences of cultivar and field condition on the petiole sap nitrate concentration make it difficult to propose standard sap concentration thresholds[6]. Solar radiation and wind may also affect field measurement accuracy[11]. Twenty petioles are required to increase the accuracy due to this variation, which is time- and labor-consuming for sampling and handling procedures[6]. These causations should be considered when using these measurements as guidance for N fertilization[12].

      Though ground-based, airborne, and space-based remote sensing technologies are developing[13], hand-held greenness meters and portable petiole sap nitrate N meters are still two feasible methods to measure potato N status, particularly for small farms. However, the accuracy of both types of portable meters is influenced by the meter's hardware, as well as cultivar, growth stage, growing season, cultivation practices, and weather. Both methods have demonstrated merits and limitations. The objective of this study is to compare the suitability of the pocketable SPAD meter and portable Horiba Cardy nitrate meter to monitor the nitrogen status of potato grown in the tri-county agricultural area in Northeast Florida.

    • The experiments were carried out in 2021 and 2022 at the University of Florida/IFAS Hastings Agriculture Extension Center, Hastings, FL (USA), in the Northeast Florida potato production area. The soil properties of the trial field are shown in Table 1. The trials were completed with hilled rows. The hilled rows (0.35 m in height) were formed with 1-m distance between row centers. At planting, granular fertilizer was banded on the soil surface of each row and subsequently incorporated. The potassium and phosphorus fertilizer were applied two days before planting according to IFAS potato production guidelines. Nine nitrogen fertilizer levels were prepared and supplied as granular calcium nitrate (15-0-0) from 0 (control) to 360 kg/ha with a 45 kg/ha increment. Nitrogen fertilizer was distributed in three applications: 30% two days before planting, 30% at emergence, 40% 41 d after planting (DAP). The experiments were arranged in a randomized complete block design with four blocks each with nine plots, four rows in each block, and 12.2 m in length for each plot. There was a 1.5-m skip between plots, and the total area of each block was 198.1 m2. Commercial chipping potato (Solanum tuberosum 'Atlantic') seed pieces were planted on Feb 5, 2021, and Jan 26, 2022, respectively.

      Table 1.  Soil properties of the trial field. All the essential elements (PPM) listed were extracted with Mehlich-III.

      pHCECPKMgCaMnFe
      5.25.937.537.575.5475.5826

      Soil samples from each plot were collected 23, 44, and 82 DAP in 2022 and nitrate-N concentration was analyzed by Waters Agricultural Laboratories, Inc. (Camilla, GA, USA) SPAD readings were measured by the SPAD 502 C (Konica Minolta, Inc., Osaka, Japan) on the 4th leaf with 30 measurements on different plants, on Mar 10, Mar 23, Apr 6, and Apr 21 in 2021; and on Mar 7, Mar 21, Apr 4, and Apr 18 (40, 54, 68, and 82 DAP). Petiole sap nitrate-N concentrations were measured with a Horiba LAQUAT Cardy nitrate meter on the same day. At least, 10 petioles were sampled for each measurement, depending on sap availability per petiole.

      Potato tubers were harvested on May 10, 2021, and May 6, 2022. The tubers from the middle 6.1 m of the two central rows in each plot were weighed and calculated for total and marketable yields. Specific gravity was measured with a specific gravity scale. Twenty marketable tubers were randomly picked from each plot and weighed in air and in water. The specific gravity was calculated as shown below:

      Specific Gravity = weight in air ÷ (weight in air − weight in water)

      Ten tubers from each plot were cut into quarters and the incidence of tuber hollow heart, corky ring spot, internal heat, and brown center were counted.

      Differences in data between N-rates or growth stages were analyzed with one way ANOVA. Means were separated by Tukey HSD at 0.05 level for significant differences. Regression analyses between N-rate on yield, SPAD readings, petiole sap nitrate-N concentrations; SPAD readings and petiole sap nitrate-N concentrations on yield; Both of SPAD and petiole sap nitrate-N readings were conducted by using JMP pro 16.1 (SAS Institute, 2020). Figures were plotted in Excel.

    • Both the total yield and marketable yield were increased with nitrogen fertilizer application, and the relationship between yield and N-rate significantly fitted with quadratic regressions (Fig. 1). The tuber yields of 2022 at different N-rates were generally greater than that of 2021. The respective maximum total and marketable yields of 2021 reached 33,306 kg/ha with 326 kg/ha N and 23,659 kg/ha with 360 kg/ha N based on the calculation vertex of the quadratic regressions. The corresponding maximum total yield and marketable yields of 2022 achieved 38,885 kg/ha with 332 kg/ha and 33,286 kg/ha with 333 kg/ha, respectively. The maximum total and marketable yields were more consistent in 2022 than in 2021. Basically, nitrogen applications did not significantly affect the tuber quality indices such as incidence of hollow heart, corky ring spot, and internal heat, except that the brown center rate was significantly decreased with nitrogen fertilization (Table 2).
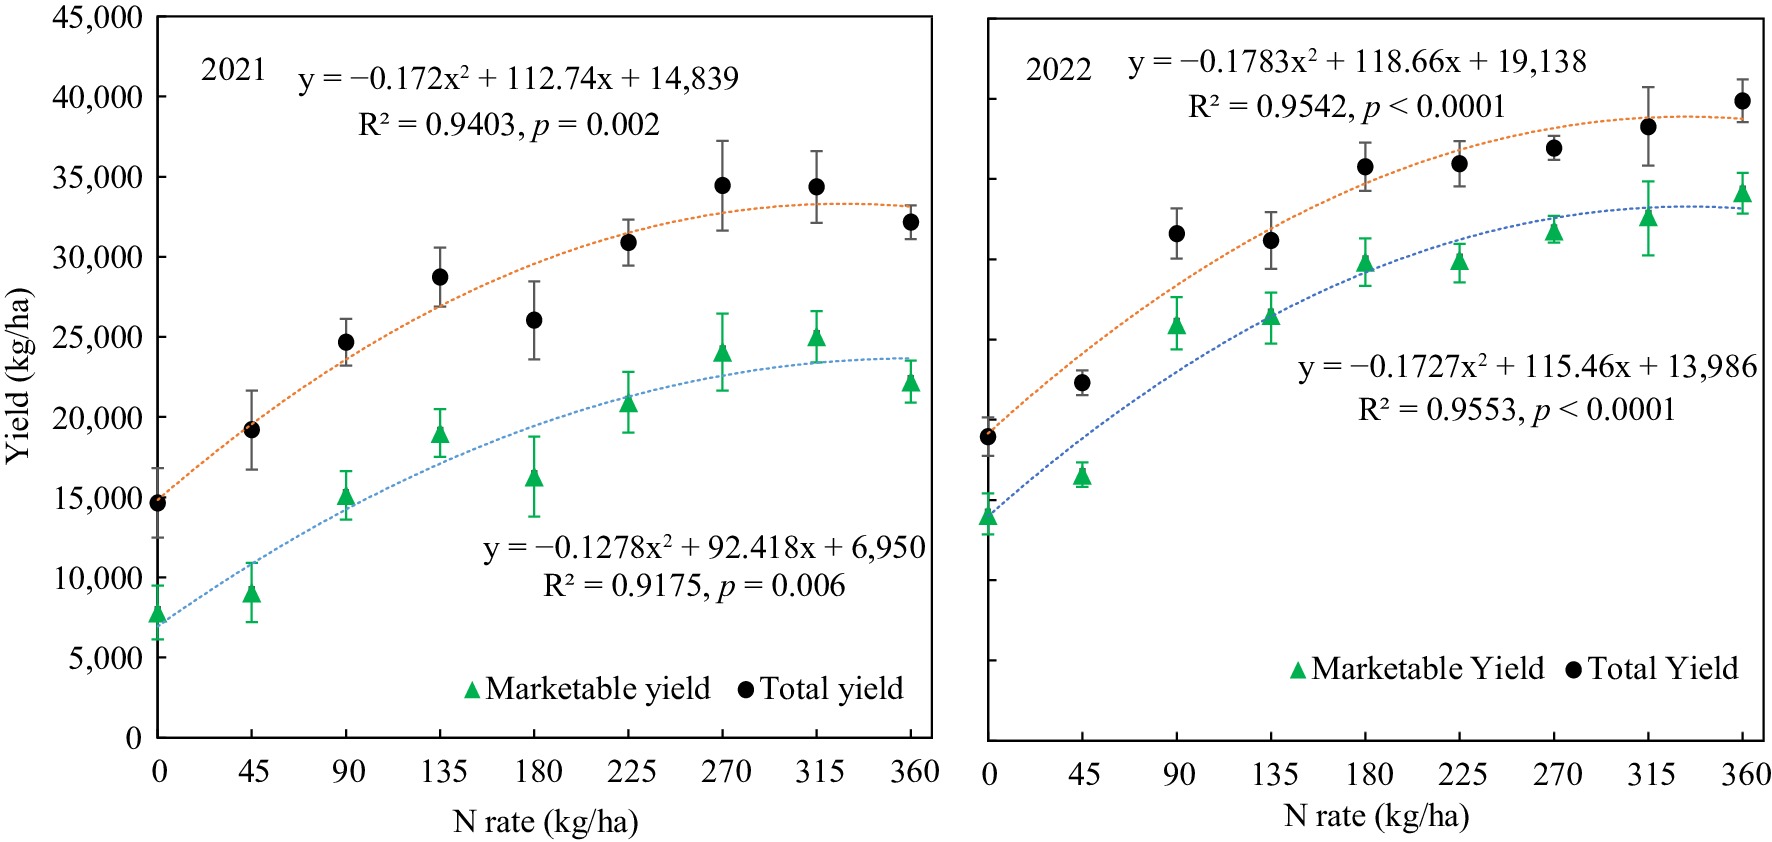
      Figure 1. 

      Potato marketable tuber yield and total tuber yield response to nitrogen fertilizer application rate.

      Table 2.  The tuber yield and quality of potato grown under different nitrogen fertilizer rates.

      N rate
      (kg/ha)
      Marketable yield
      (kg/ha)
      Total yield
      (kg/ha)
      Specific gravity
      (g/cm3)
      Tuber hollow heart
      (%)
      Corky ring spot
      (%)
      Internal heat
      (%)
      Brown center
      (%)
      0 14,061 ± 1,363d18,949 ± 1,204d1.08 ± 0.00a2.50 ± 1.64a0.00 ± 0.00a0.00 ± 0.00a3.75 ± 1.83a
      45 16,586 ± 755d22,302 ± 776d1.08 ± 0.00a1.25 ± 1.25a0.00 ± 0.00a0.00 ± 0.00a1.25 ± 1.25ab
      90 25,957 ± 1,684c31,594 ± 1,569bc1.08 ± 0.00a1.25 ± 1.25a0.00 ± 0.00a1.25 ± 1.25a0.00 ± 0.00b
      13526,521 ± 1,404bc31,168 ± 1,769c1.08 ± 0.00a2.50 ± 2.50a0.00 ± 0.00a0.00 ± 0.00a0.00 ± 0.00b
      18029,841 ± 1,471abc35,773 ± 1,499abc1.09 ± 0.00a2.50 ± 1.64a0.00 ± 0.00a1.25 ± 1.25a0.00 ± 0.00b
      22529,956 ± 1,016abc35,951 ± 1,401abc1.09 ± 0.00a0.00 ± 0.00a0.00 ± 0.00a0.00 ± 0.00a0.00 ± 0.00b
      27031,784 ± 919abc36,934 ± 751abc1.08 ± 0.00a5.00 ± 1.89a1.25 ± 1.25a0.00 ± 0.00a0.00 ± 0.00b
      31532,680 ± 2,171ab38,270 ± 2,440ab1.08 ± 0.00a6.25 ± 3.75a0.00 ± 0.00a0.00 ± 0.00a0.00 ± 0.00b
      36034,181 ± 1,209a39,875 ± 1,336a1.08 ± 0.00a3.75 ± 2.63a0.00 ± 0.00a0.00 ± 0.00a0.00 ± 0.00b
      Data (mean ± SE, n = 4) followed with same letter in the same column were not significant different according to Tukey HSD at 0.05 level.
    • In general, soil nitrate-N concentrations decreased within the growth stage, especially before harvest. However, due to the great variances within group, there was no statistical significance between the N-rates, or between soil sampling dates (Fig. 2).
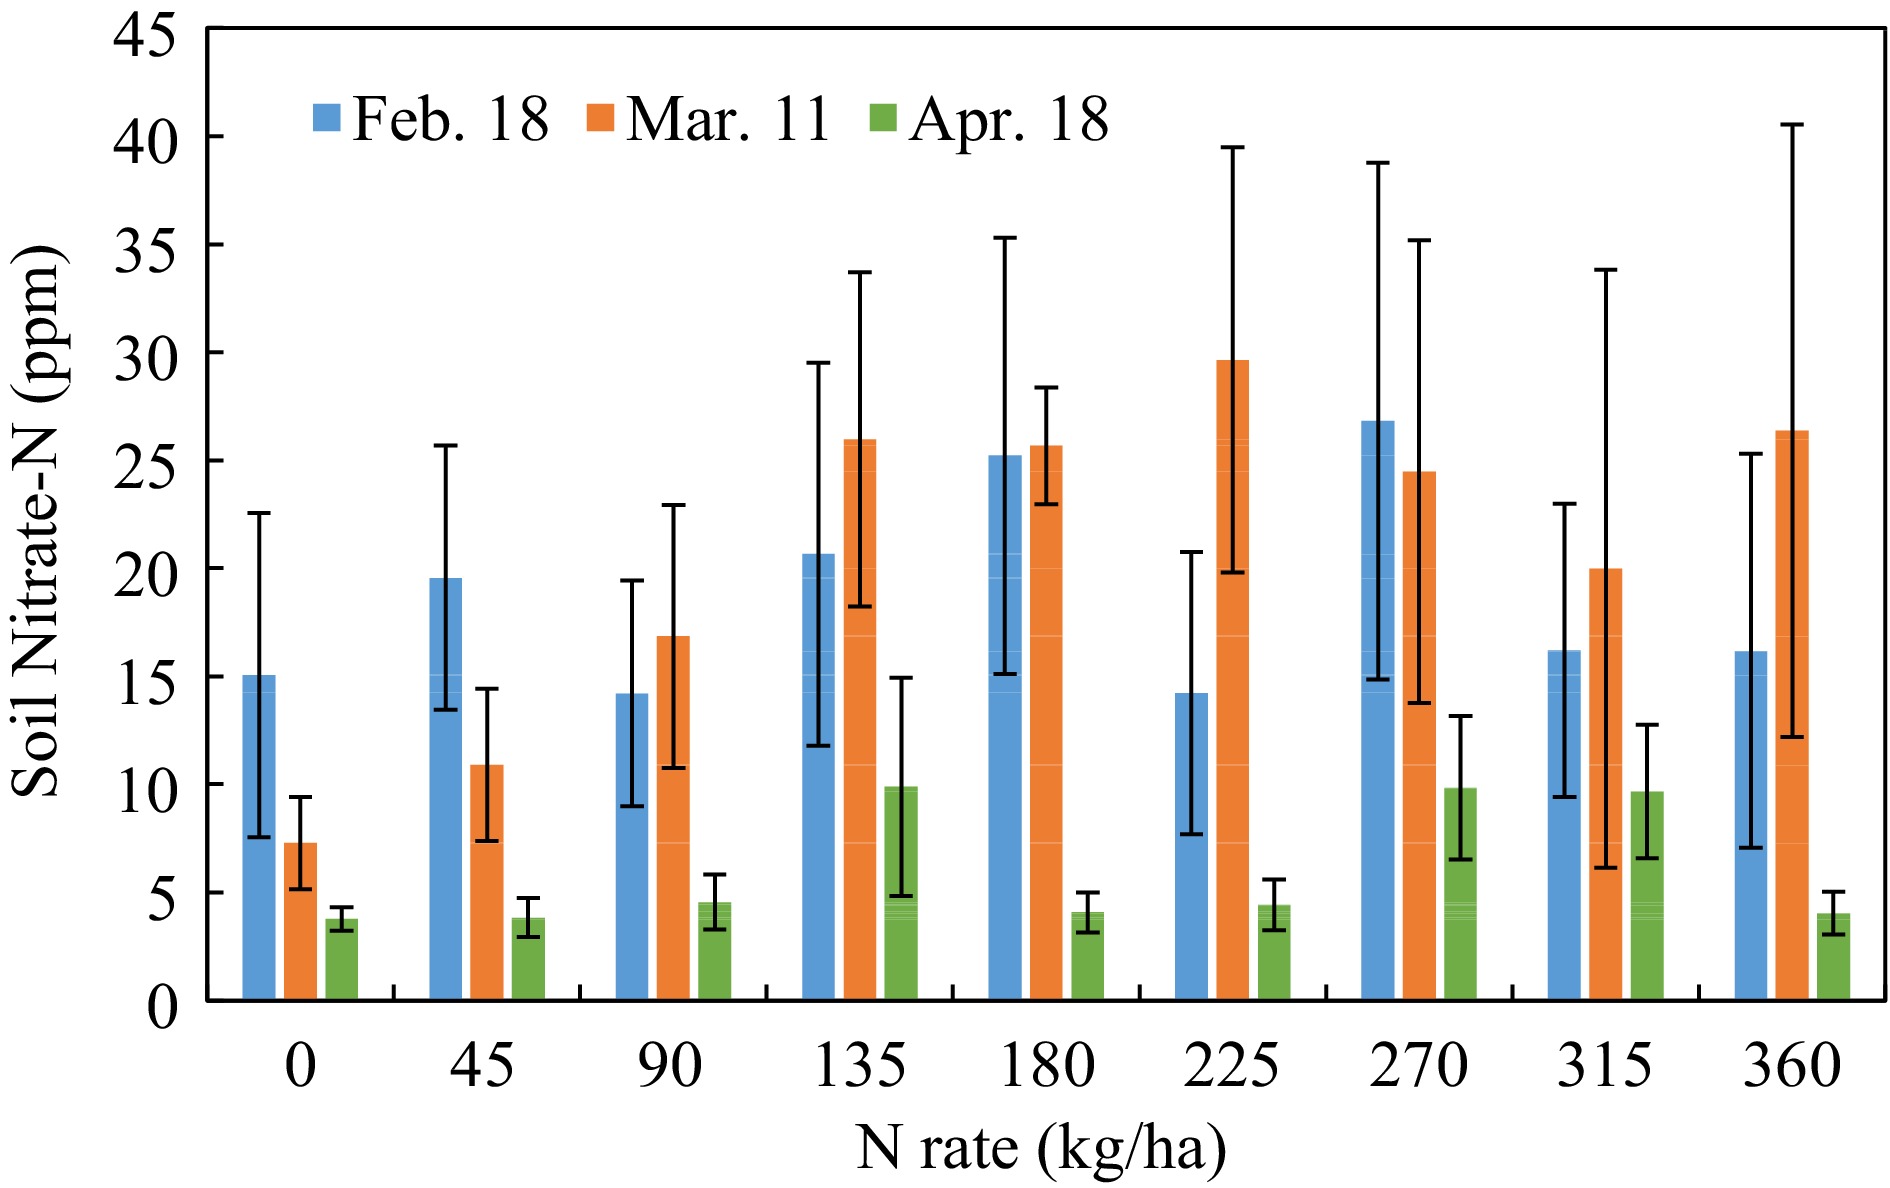
      Figure 2. 

      Soil nitrate-N concentration response to N-rate in different growth stages. (Feb 18, Mar 11, Apr 18, 2022, that were 23, 44, and 82 d after planting).

    • SPAD value and petiole sap nitrate-N concentration increased with the N-rate in all growth stages in both years (Figs 3 & 4); all the data fitted well with quadratic or linear regression.
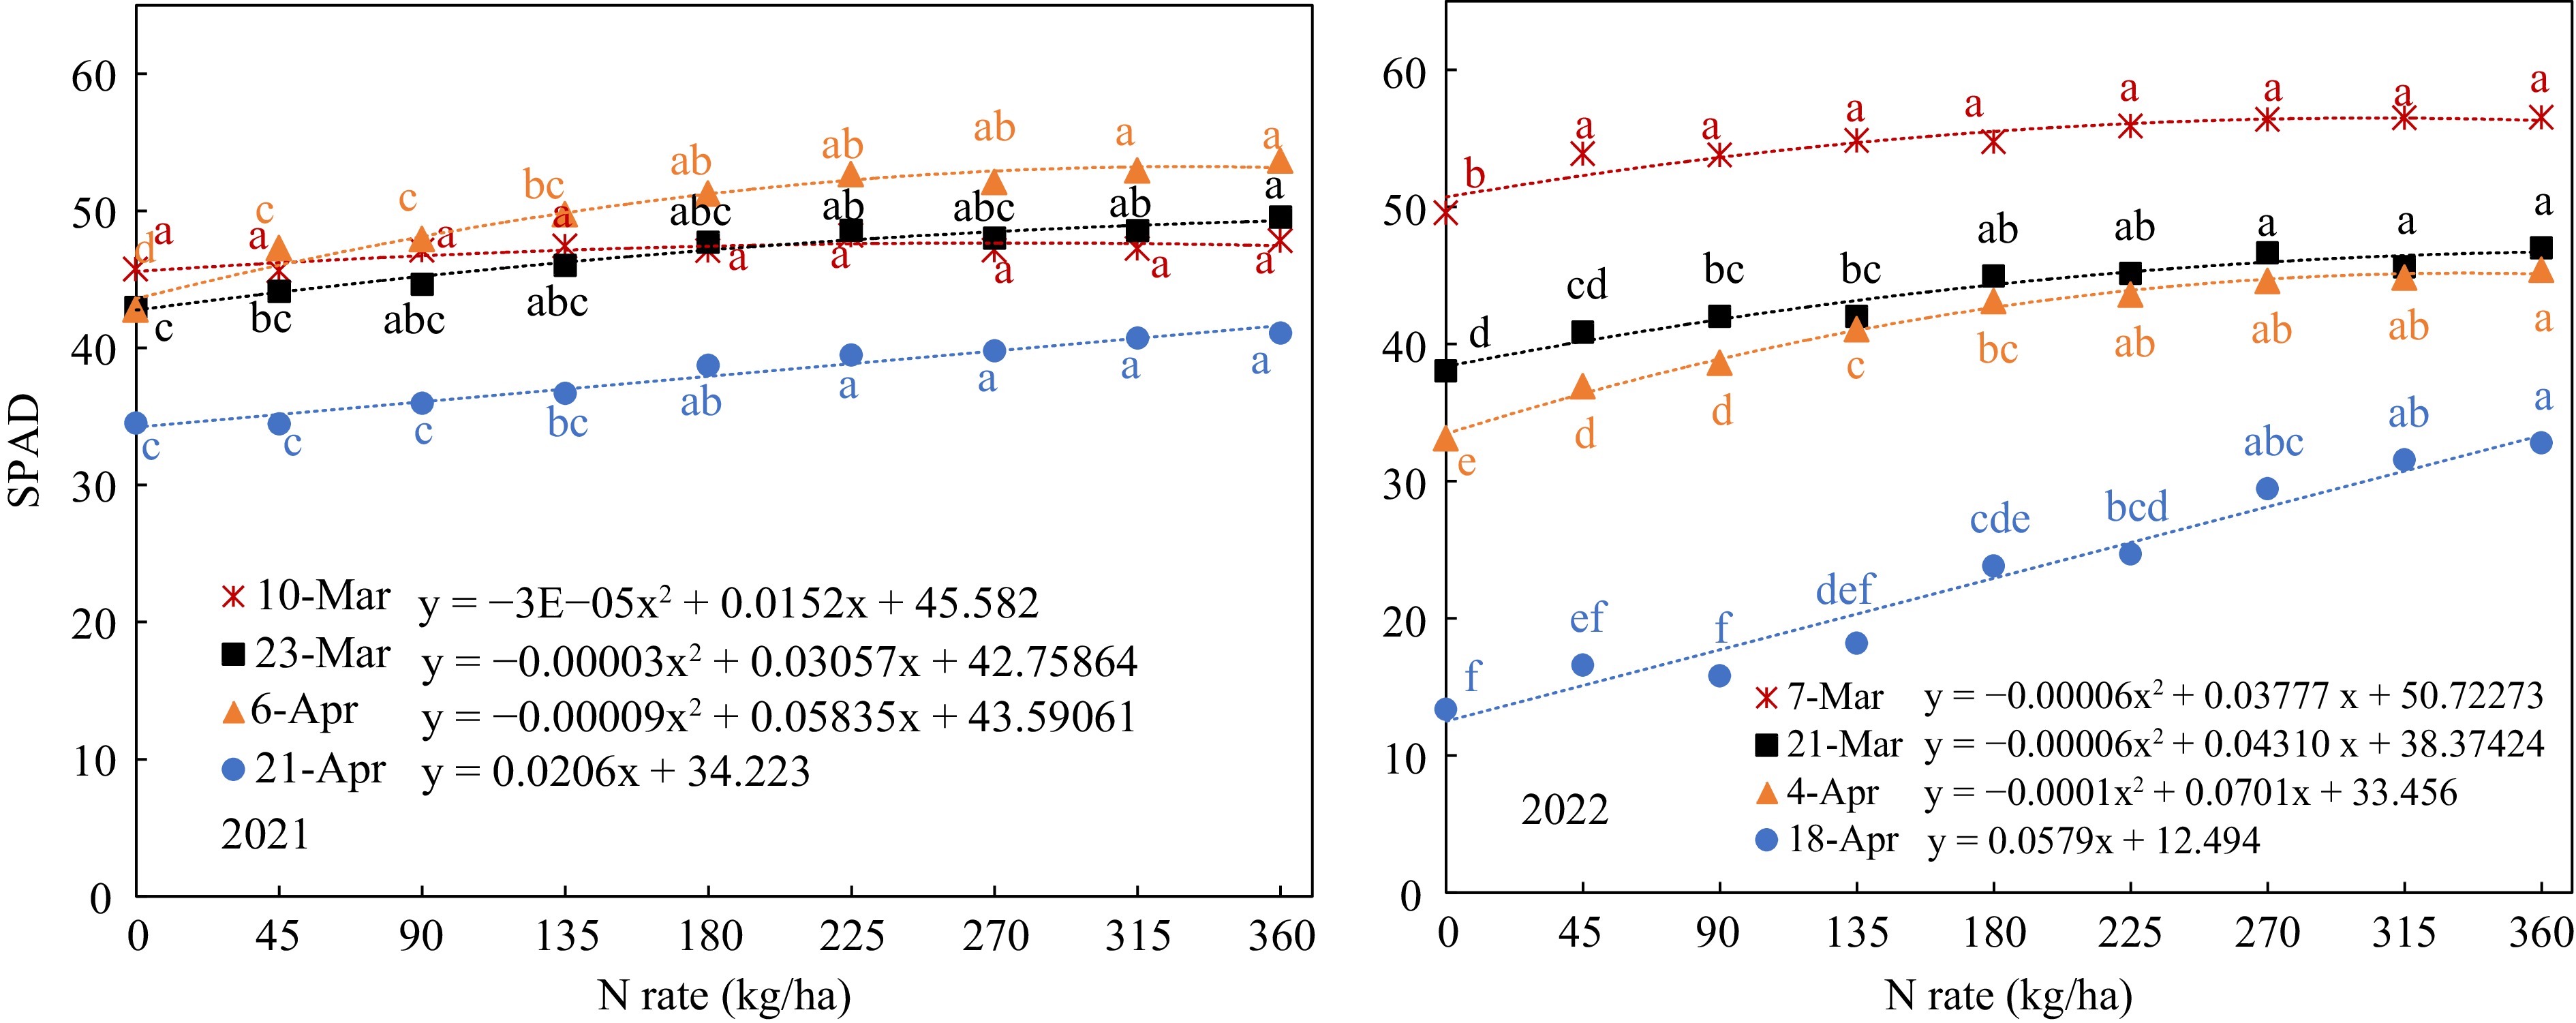
      Figure 3. 

      SPAD value response to N-rate in different growth stages (Mar 7, Mar 21, Apr 4, and Apr 18, that were 40, 54, 68, and 82 d after planting).
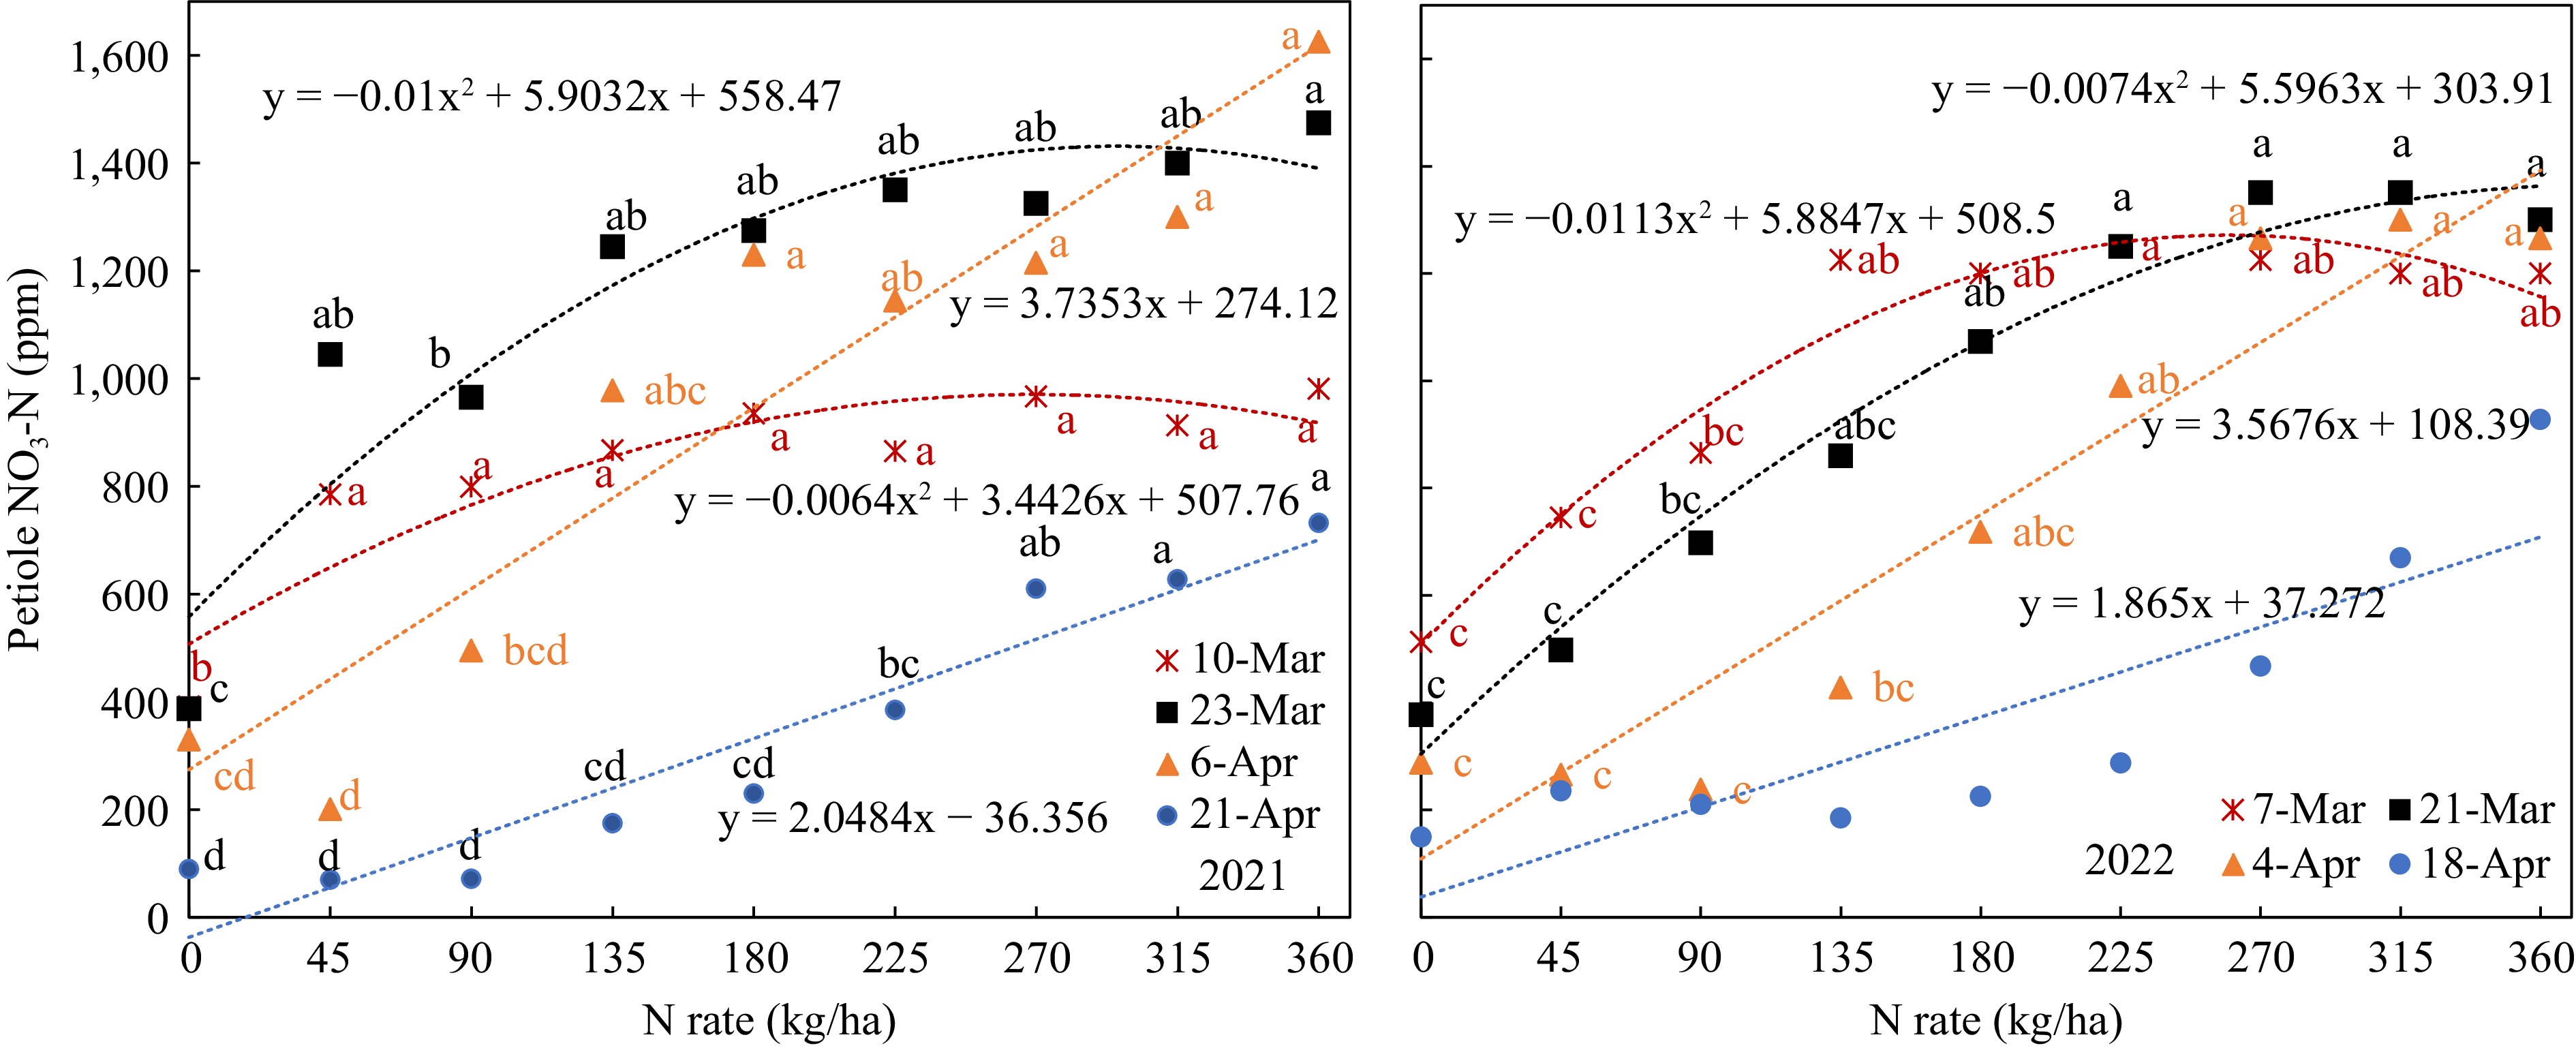
      Figure 4. 

      Petiole sap nitrate-N response to N-rate in different growth stages. (Mar 7, Mar 21, Apr 4 that were 40, 54, 68 d after planting).

      However, petiole sap Nitrate-N concentration showed more range of variation with a greater slope (Fig. 4). The SPAD values at early growth stage showed a smaller range of variation. On Mar 10, 2021, SPAD did not indicate any significant difference between all the N-rates except for the zero-N control. On Mar 7, 2022, only the SPAD reading was significantly lower with the control (0 kg/ha) than with all the other nitrogen levels, but all the SPAD readings at the N-rates from 45 to 360 kg/ha ranged narrowly from 53.8 to 56.5 without significant difference (Fig. 3). Thus, the SPAD value on the 40 DAP was not able to distinguish the difference in leaf nitrogen status according to the N-rate in this stage. For the second measurement in 2021, the SPAD readings ranged from 43 to 50, but there was no significant difference between N-rates from 45 kg/ha to 315 kg/ha. In 2022, the SPAD readings of the second measurements on Mar 21 ranged from 38 to 47 and showed significant differences between N-rates below 135 kg/ha and above 270 kg/ha. On Apr 6, the third measurements showed significant difference between the N-rate below 90 kg/ha and above 180 kg/ha and ranged from 43 to 54. In 2022, the SPAD values were lower with the range from 33 to 45 and showed significant differences between N-rates below 135 kg/ha and above 225 kg/ha. The regression between SPAD and N-rate in this growth stage also showed best fitting with a greater R2. It indicated that SPAD on the 68th DAP was more sensitive to distinguishing the differences of leaf N status caused by different N-rates. The SPAD values of last measurement near harvest also increased linearly with N-rate, but with much smaller values, it indicated that the soil N were used up and leaf N were transferred to the tubers.

      In contrast, petiole sap nitrate-N concentration in all growth stages had a wider range and showed clear quadratic or linear relations to N-rate (Fig. 5). The wider range made it easier to separate the N status from different N-rates. However, there were still no significant differences between the N-rates. For example, the petiole sap nitrate-N of Mar 10, 2021, at N-rates from 45 kg/ha to 360 kg/ha had no significant difference. In the 2021 trial, only the petiole sap nitrate-N concentrations at N-rates of 360, 90, and 0 kg/ha had significant differences on 54 DAP. In 2022, when the N-rates were 135 kg/ha, 180 kg/ha, and 225 kg/ha, the petiole sap nitrate-N of 68 DAP were 427, 717, and 990 ppm respectively (Fig. 5). There was also no significant difference between the petiole sap nitrate-N concentrations from 180 kg/ha to 360 kg/ha, though the petiole sap nitrate-N concentrations ranged from 717 to 1,300 ppm.

      Figure 5. 

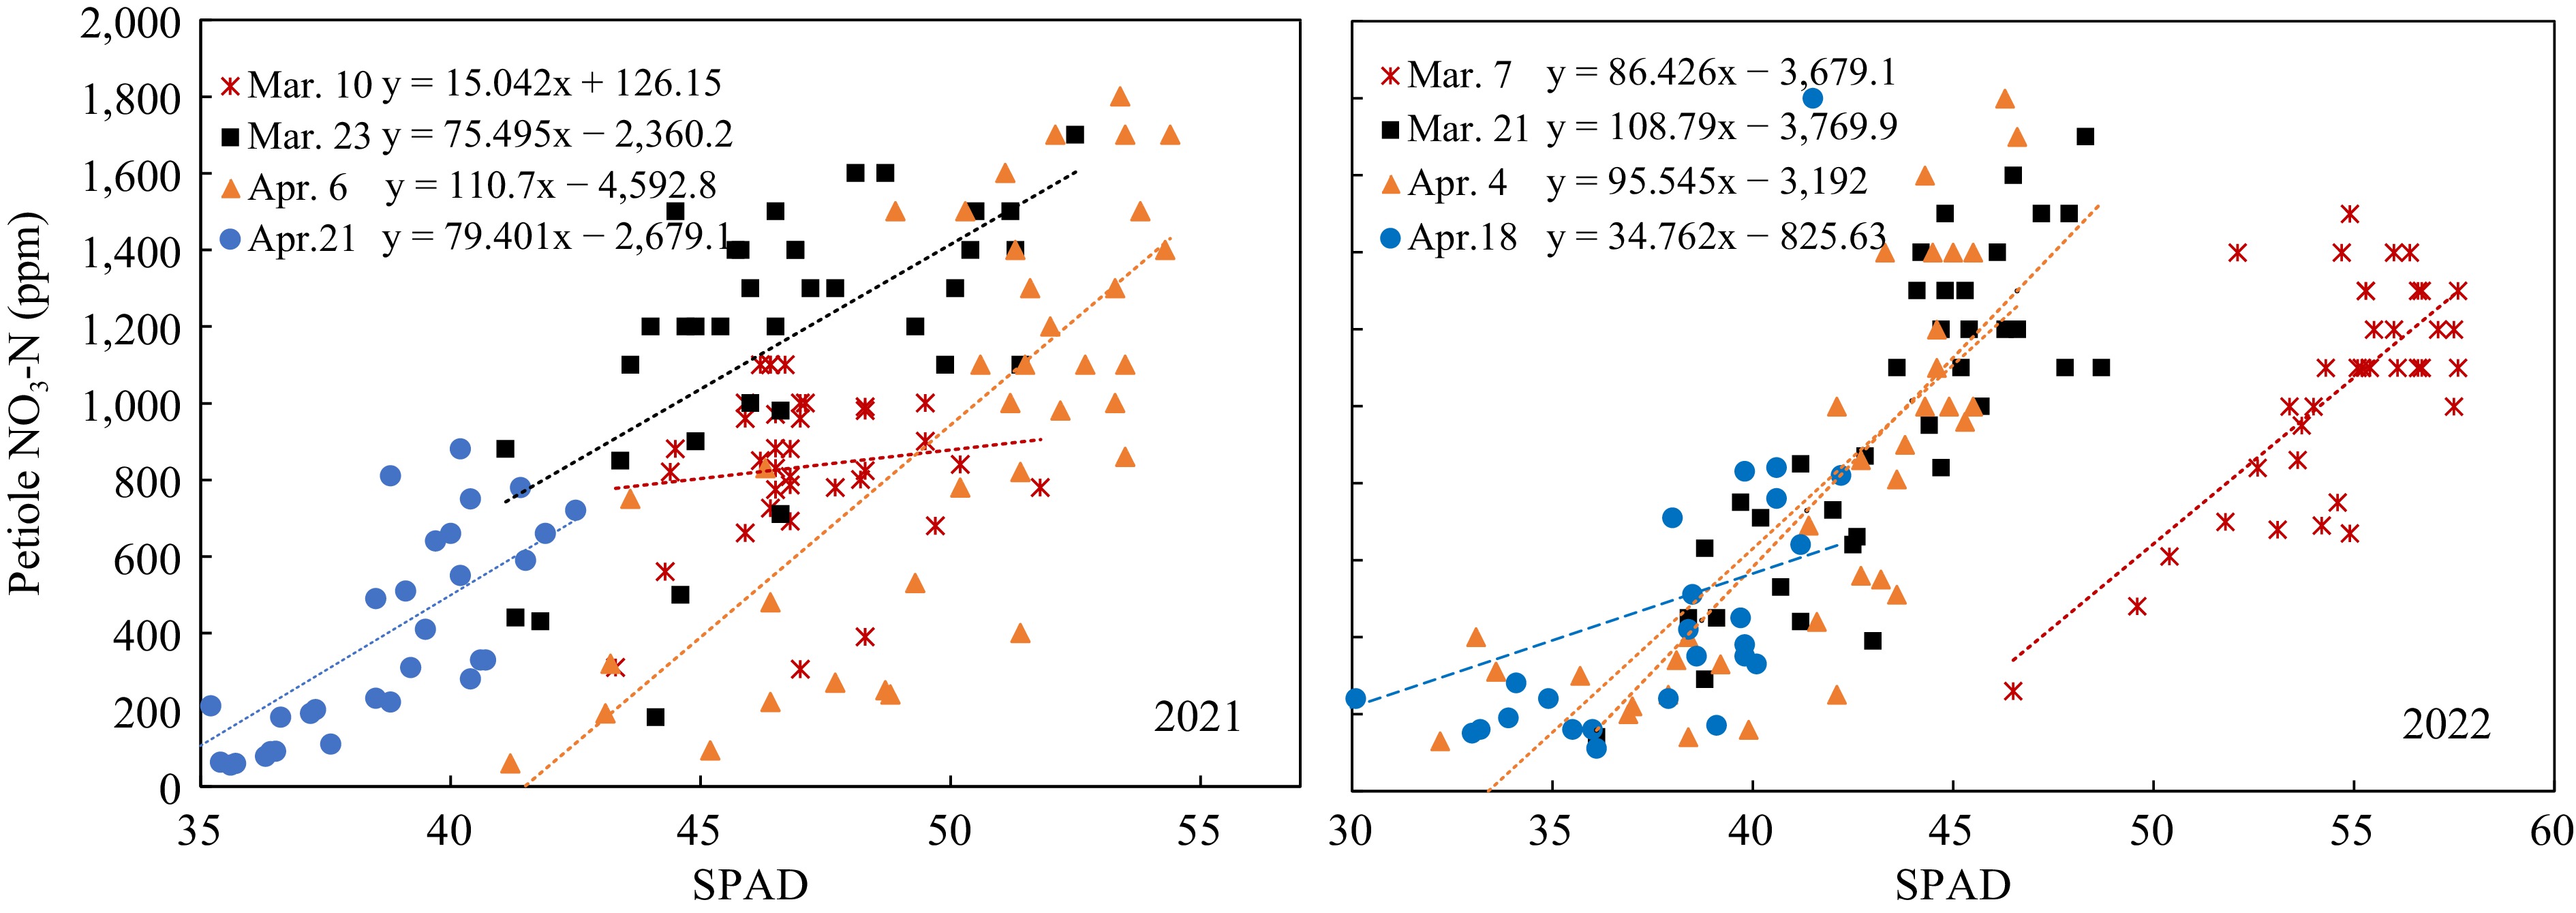
      Relation of petiole sap nitrate concentration to SPAD value.

    • In 2021, petiole sap nitrate-N and SPAD values of Mar 10 did not have any significant relationship. The data of 40 DAP and 68 DAP showed significant relations, but the linear regressions were not well-fitted and had low R2 (Fig. 5, left). Data of 2022 showed better linear relationships between petiole sap nitrate-N concentrations and SPAD value at 40, 54, 68 DAP, with R2 of 0.5084, 0.6246, and 0.7155, respectively (Fig. 5, right). The low R2 values indicated that it was not sufficient to predict petiole sap nitrate-N concentrations from the SPAD values.

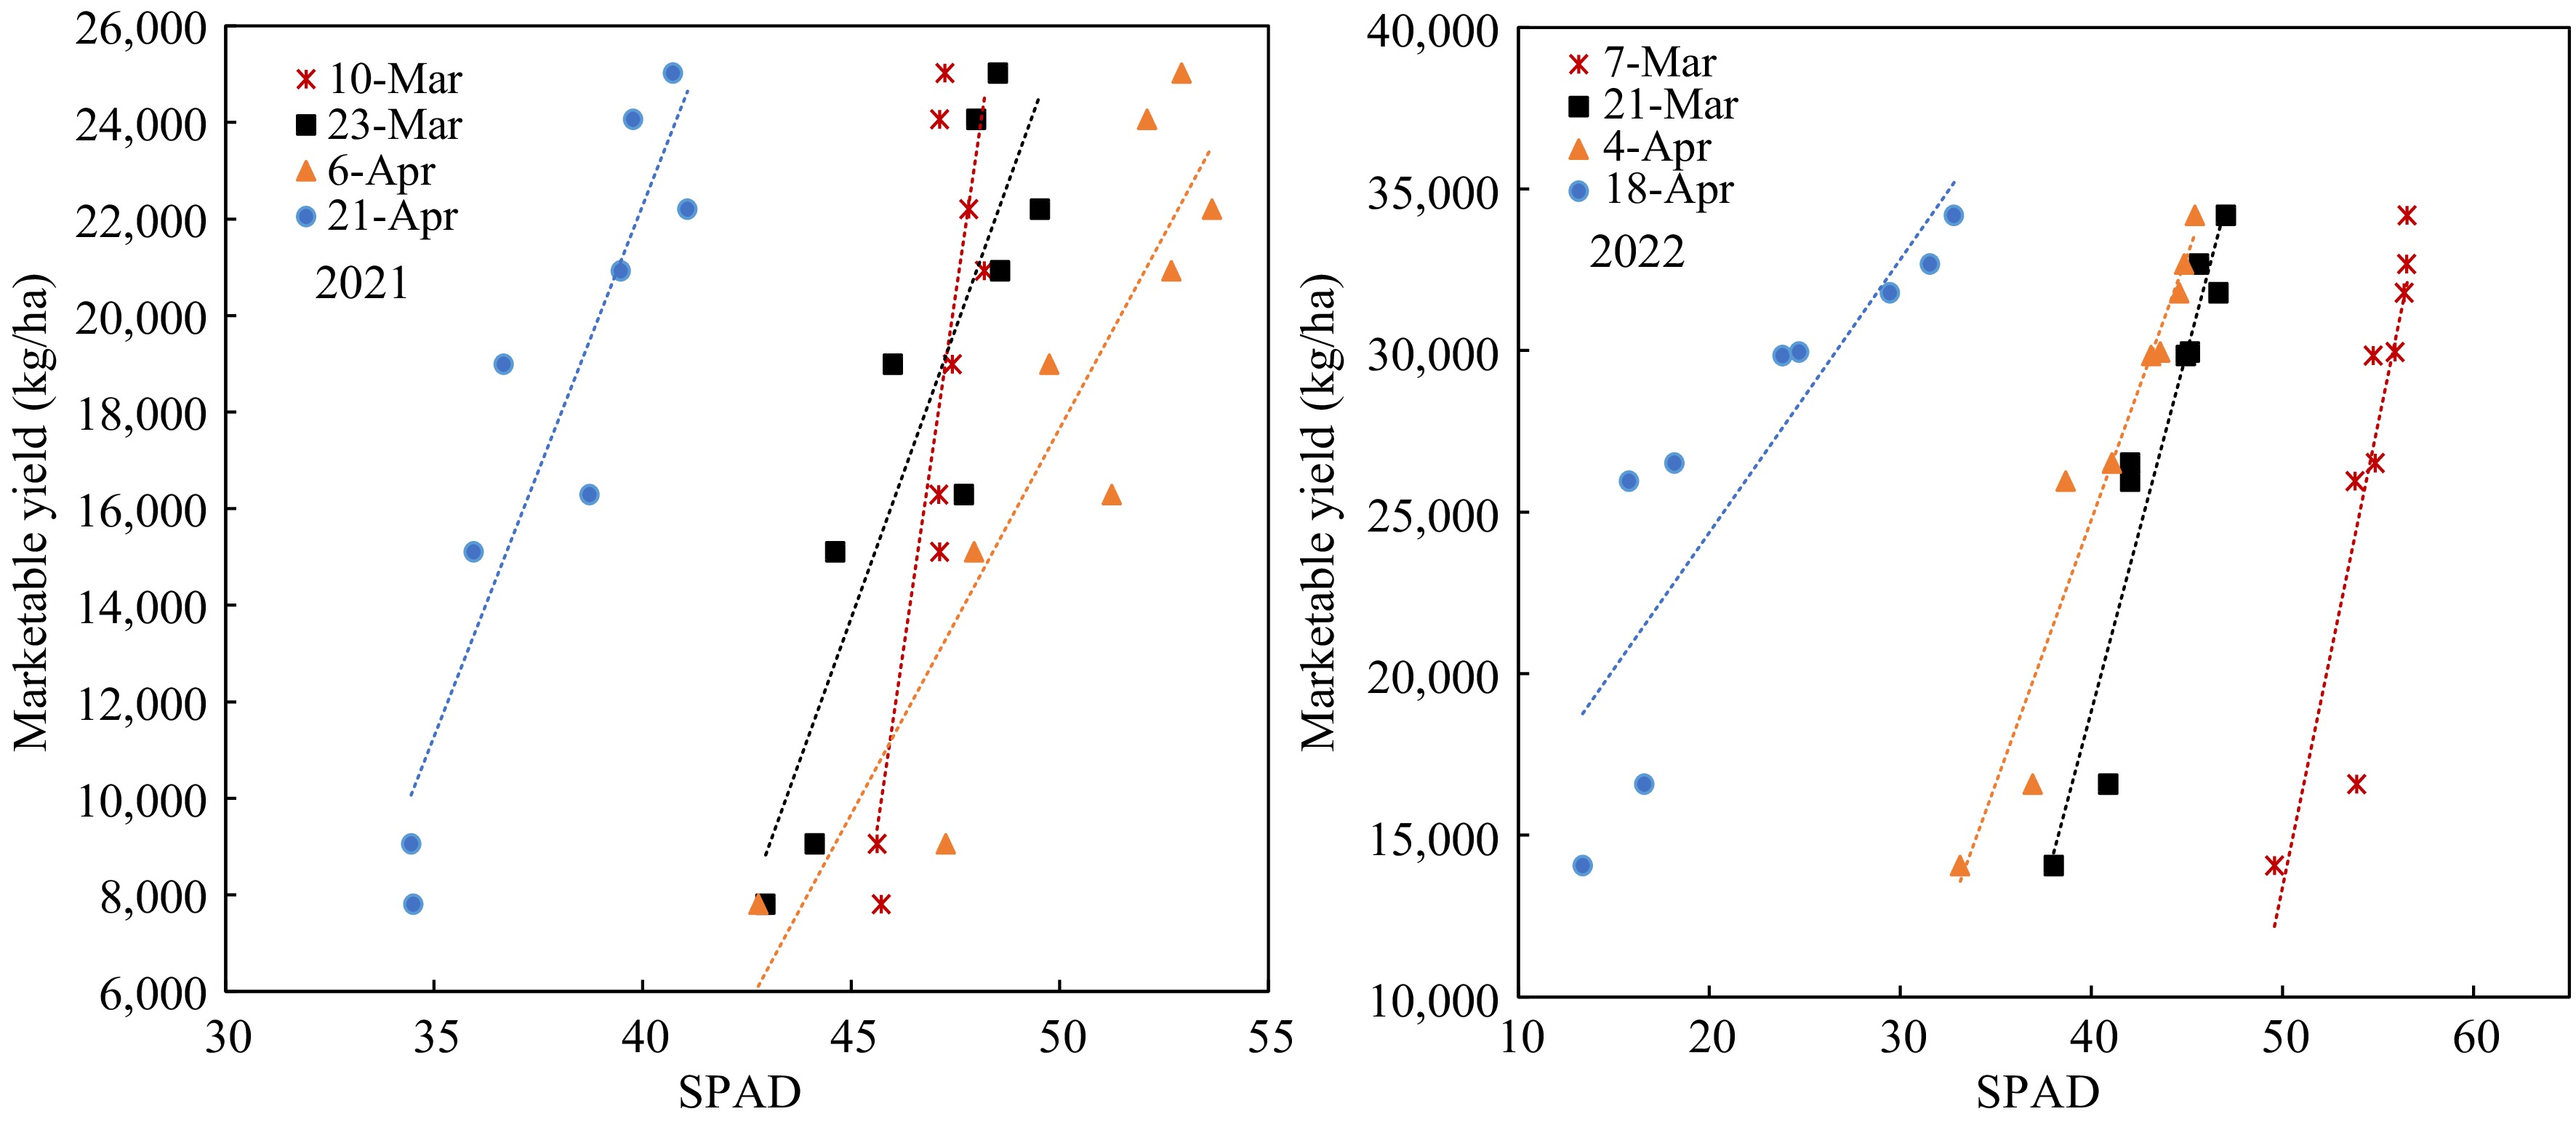
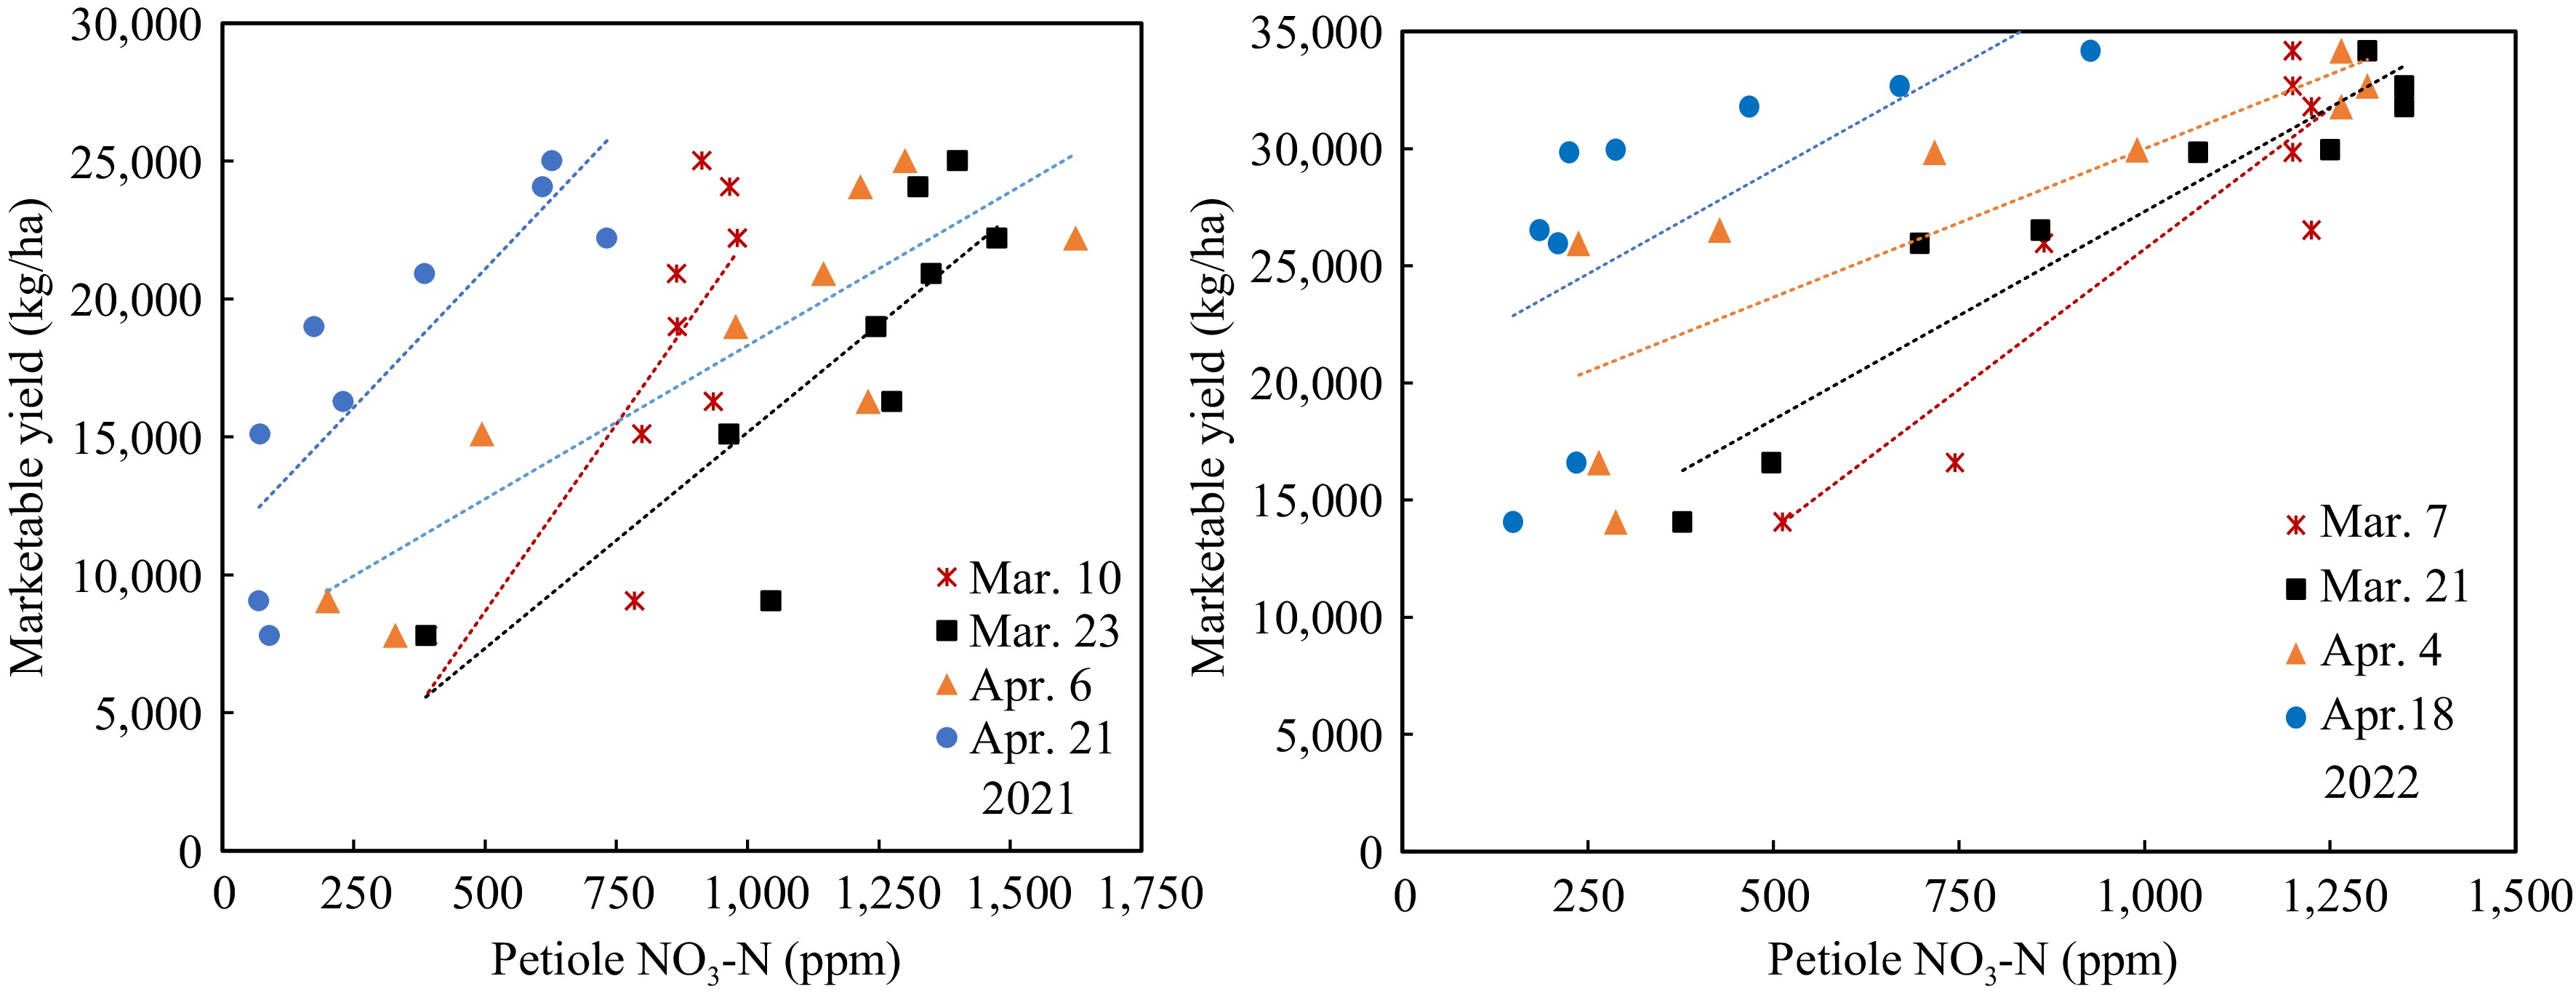
    • The marketable yield had significant linearity relative to both the SPAD value and petiole sap nitrate-N in different growth stages of both years. However, the regressions of the two years were vastly different. The regressions between yields and SPAD readings on 68 DAP in 2022 were best fitting (Fig. 6). All the linear equations had large slopes, which means the yield changed significantly with a slight change of SPAD value. The SPAD value did not change significantly when the N-rate increased from 45 to 360 kg/ha in the early growth stage, consistent with the data of Fig. 3. On the other hand, the linear equations between yield and petiole sap nitrate-N showed smaller slopes (Fig. 7), meaning that yield increased gradually with the increase of petiole sap nitrate-N. The R2 were greater on 40 and 54 DAP. The petiole sap nitrate-N was more sensitive in distinguishing the yield difference at different N-rates than SPAD reading.

      Figure 6. 

      Yield responses to SPAD value at different growth stages.

      Figure 7. 

      Marketable yield response to petiole sap nitrate-N in 2021 and 2022 trials.

      Potato tuber yield increased by increasing the N fertilization rate. In Brazil, the N fertilization rate was 175 kg/ha to achieve maximum marketable yield of potato 'Atlantic'[14]. In our two years trials, the N fertilization rates for maximum yield were 360 kg/ha and 333 kg/ha, which was approximately doubled as compared with the N rate in Brazil. This difference could be caused by differing soil types, weather, soil N, or cultivation practices. However, considering the potato tuber price and fertilizer price, the economic optimum N fertilization rates were 92%−95% of estimated N rates for maximum yield at low N fertilizer price and high potato price, or 86%−92% of the estimated N rates at high N fertilizer price and low potato price[14].

      In the two years of trials, both SPAD readings and petiole sap nitrate-N concentrations had clear relations to N-rates. However, petiole sap nitrate-N concentration showed wider ranges and was therefore more sensitive for determining the plant N status difference between different N-rates. The SPAD readings were within narrower ranges regardless of N-rates, and besides the control values were not significantly different, especially in the early growth stage. SPAD readings could detect more separation between different N-rates in later growth stage, but that may be too late to side-dress the N fertilizer. It is difficult to define the threshold of SPAD values for N deficiency of specific potato cultivars due to differences in soil, weather, growth stage, growing season, and management practices[9]. Especially, when temperature, solar radiation, and intensive rainfall were less favorable for potato production, following N application by SPAD values did not guide proper N fertilization and resulted in reduced yield[7]. Minotti et al. reported that SPAD readings could identify severe N deficiency in potatoes but had limited value for identifying situations of marginal N deficiency[15]. Wu et al. also reported that petiole sap NO3-N concentrations were more sensitive than SPAD readings to N fertilization throughout the growing season[8]. Rodrigues in Portugal found that it was possible to know the N requirement by potato plants in the early growth stages[16]. The Portugal scientist emphasized that pre-side dress soil NO3-N and inorganic N were the best N indicators of the need of N application. Petiole sap nitrate-N concentration was more closely related to plant N-status between 20 to 60 d after emergence[6].

      Our results showed that SPAD reading, and petiole sap nitrate-N concentration had weak linear relations, and there were great variations in different growth stages and between the two years. It was consistent with the report that SPAD values correlated well with the chlorophyll content and the nitrogen concentration in leaves but did not closely correlate with petiole sap nitrate concentration[17]. The error rates of N indicator by SPAD reading and petiole sap nitrate reading were greater than that of soil N and petiole nitrate by laboratory analysis[16]. The accuracy of the handheld meters also affected the results. For SPAD reading, leaf position on the plant stem affected the reliability of measurements. The 4th compound leaf is reportedly more suitable for estimating N by SPAD meter[18]. For petiole sap nitrate N concentration monitoring, 20 petioles are required for increased measurement accuracy[6].

      Yields linearly increased with the increasing of the SPAD reading and petiole sap nitrate-N concentration, so it was unlike the quadratic regression of yield to N-rate, which can calculate the maximum yield according to the vertex point. As the equations changed much in different growth stages and growing seasons in Florida, it is hard to define the threshold of SPAD reading or petiole sap nitrate-N concentration. But SPAD meter is still considered as a good tool for diagnosis of nitrogen status as it is easier to use[17]. Individual dynamic threshold SPAD values in different growth stages should be established to using the SPAD readings as potato production guidance for N fertilization[10].

    • Potato yield increased quadratically with N-fertilizer rate from 0 to 360 kg/ha, without affecting the tuber quality except for the greater brown center incidence at 0 kg/ha. Both SPAD and petiole sap nitrate N readings had close relations with the N rate. However, SPAD could only distinguish the difference in plant N status in later growth stages, which can be too late to supplement the fertilizer as the shoots were too tall for a tractor to drive into the field and side-dress the rows. Petiole sap nitrate N concentration was more responsive and was able to start differentiating the plant N status between different N rates in early growth stages. It is important for sustainable N management for potato production by (1) improving the representativeness and accuracy of petiole sap nitrate nitrogen readings by testing more varieties of both chipping and table-stock potatoes and (2) establishing a dynamic threshold of petiole sap nitrate N reading for optimizing N application rates in individual growth stages for different potato cultivars.

    • The authors confirm contribution to the paper as follows: funding, study conception, experimental design, manuscript finalization: Liu G; performed the experiments, data collection, analysis and interpretation of results, and draft manuscript preparation: Li Q; performed the experiments, data collection, analysis and interpretation of results, and manuscript preparation: Denison J; data collection, and manuscript preparation: Gluck M. All authors reviewed the final version of this manuscript and granted approval for its publication.

    • The datasets generated during and/or analyzed during the current study are available from the corresponding author on reasonable request.

      • This work was financially supported by UF/IFA Extension Horticultural Sciences Department (Project Number: 60230065-103-3300-CRRNT). The UF/IFAS Hastings Agricultural Extension Center Crew supported and helped with the field trials conducted at HAEC, Hastings, Florida.

      • The authors declare that they have no conflict of interest.

      • Copyright: © 2023 by the author(s). Published by Maximum Academic Press, Fayetteville, GA. This article is an open access article distributed under Creative Commons Attribution License (CC BY 4.0), visit https://creativecommons.org/licenses/by/4.0/.
    Figure (7)  Table (2) References (18)
  • About this article
    Cite this article
    Li Q, Denison J, Gluck M, Liu G. 2023. Comparison of SPAD-based leaf greenness and paralleled petiole sap nitrate concentrations for monitoring potato vine nitrogen status. Vegetable Research 3:30 doi: 10.48130/VR-2023-0030
    Li Q, Denison J, Gluck M, Liu G. 2023. Comparison of SPAD-based leaf greenness and paralleled petiole sap nitrate concentrations for monitoring potato vine nitrogen status. Vegetable Research 3:30 doi: 10.48130/VR-2023-0030

Catalog

  • About this article

/

DownLoad:  Full-Size Img  PowerPoint
Return
Return