












-
Tea plant (Camellia sinensis [L.] O. Kuntze) is a globally significant cash crop, with substantial economic importance. Rational fertilization is crucial for enhancing yield, and ensuring the sustainability of tea cultivation. As a core region of tea germplasm origin in China, Sichuan has developed into a key intensive production area, underscoring its dual strategic value in genetic resource conservation, and agricultural economy[1,2]. However, the long-term pursuit of high yield has led to widespread mismanagement of fertilization, resulting in severe soil degradation in some tea-growing areas of Sichuan. Recent studies indicate concerning levels of soil acidification; for instance, surface soils in 16 tea gardens in western Sichuan averaged pH 4.3, while 22 gardens in southern Sichuan recorded a minimum pH of 3.4, values substantially below the optimal range of 4.5−6.0 for tea growth[3]. Additionally, over 60% of tea plantation soils exhibit available potassium levels below 120 mg/kg[3] further challenging sustainable production. These issues collectively hinder the transition toward an environmentally sustainable tea industry, highlighting the urgent need for effective soil remediation strategies.
Biochar is a carbon-rich material produced from the pyrolysis of agricultural and forestry biomass such as crop straw, rice husks, and wood residues[4,5]. It is increasingly regarded as a multifunctional amendment with a high specific surface area, high content of surface functional groups, pH, and porosity[6]. Unlike traditional lime (which primarily neutralizes acidity) or organic fertilizers (which focus on rapid nutrient supply), biochar possesses a stable aromatic carbon structure, enabling it to persist in soil for extended periods, and deliver long-lasting improvement effects[7]. Thies & Rillig[8] reported that the extensive pore structure, and large surface area of biochar allow it to buffer soil pH. It also functions as a 'micro-reservoir' for nutrient and water retention and slow release, while concurrently providing shelter for soil microorganisms. Therefore, biochar is regarded as a promising material capable of the comprehensive amelioration of soil.
Recently, biochar has been reported to be of potential value in agriculture for improving soil properties and in reducing the hazards caused by soil acidification, and in naturally acidic soils[9]. Oo et al.[10] reported that bamboo-derived biochar slightly increased the pH of acidic tea soil by 0.07−0.09 units after a 64-d incubation. Zou et al.[11] observed more pronounced enhancements in soil fertility, with substantial increases in the contents of total nitrogen, phosphorus, and potassium, following biochar application in a 'Longjing 43' tea plantation. In addition to providing direct nutrients, biochar improves nitrogen use efficiency in tea soils by reducing nitrogen leaching while also enhancing the activity of key enzymes involved in nitrogen transformations[12].
At the microbial level, biochar amendments promote a healthier and more functional soil environment. This is achieved through a multi-tiered regulation: it directly suppresses denitrification gene abundance[13], which contributes to shifts in overall microbial community structure, and enhances fungal diversity[14]. Furthermore, it drives a compositional change in the fungal community, notably increasing the abundance of beneficial genera like Mortierella and Trichoderma while reducing pathogenic ones such as Melanconiella[15]. Yang et al.[16] reported that biochar-based fertilizer (BF) in a tea orchard significantly increased the relative abundance of key bacterial genera, including beneficial genera such as Rhodanobacter, Sphingomonas, and Devosia, which were positively correlated with enhanced tea yield and quality. Combined application of organic and inorganic fertilizers has also been shown to suppress soil pathogenic fungi, thereby improving soil health[17]. The application of biochar has been demonstrated to effect modifications to soil properties; however, the precise regulatory mechanisms of different plant-derived biochars, and their dosage on tea plantation soils, remain to be elucidated. In this study, a systematic evaluation was conducted of the effects of different plant-derived biochars and dosages on soil physicochemical properties, key enzyme activities, and microbial community in tea plantations. The study is useful for guiding agricultural management in tea plantations.
-
Soil samples were obtained from a tea plantation in Ya'an, Sichuan Province, China, which had been cultivated with Camellia sinensis 'Fuding Dabaicha' for over seven years. The soil was classified as yellow-brown earth (Luvisols), and exhibited the following initial characteristics: pH 5.0; Soil organic matter (SOM) 33.01 g/kg; total nitrogen (TN) 1.66 g/kg, available nitrogen (AN) 118.32 mg/kg; total phosphorus (TP) 0.81 g/kg, available phosphorus (AP) 82.74 mg/kg; total potassium (TK) 9.92 g/kg, and available potassium (AK) 280.58 mg/kg.
Biochar materials
-
Three biochar types derived from distinct feedstocks, corn stover, reeds, and coconut shell, were selected for this study, sourced from Henan Lize Environmental Protection Technology Co., China (Supplementary Table S1).
Soil samples (0−20 cm depth) were collected using a multipoint sampling technique. Following the removal of surface plant debris, soils from the same profile were combined, homogenized, and reduced by the diagonal quartering method. A total of 21 air-dried soil samples (200 g each, sieved to < 2 mm) were randomly assigned to seven treatment groups: CK (no biochar), YM1, YM2, LW1, LW2, YK1, and YK2 (Supplementary Table S2). Biochar (sieved to < 1 mm) was incorporated at rates of 0.5% or 1.0%[18] (w/w), with three biological replicates per treatment. Soil moisture was adjusted to 60% of the water-holding capacity and maintained throughout the 45-d incubation at 25 °C by daily weighing and replenishing water as needed[13]. All jars were covered with perforated tinfoil to allow gas exchange while minimizing moisture loss. After incubation, soils from each treatment were subdivided. One sub-sample was stored in a freezer at −80 °C for DNA extraction and subsequent microbial analysis (sampled at 45 d). Other portion samples were collected randomly on 1, 15, 30, and 45 d. After collection, the samples were air-dried, finely ground, and sieved through a 40-mesh screen for analyzing soil physicochemical properties and enzyme activities.
Soil enzyme activity assay
-
Urease (UE) activity was quantified using a commercial assay kit (Nanjing Jiancheng Bioengineering Institute, China) according to the manufacturer's protocol. Activity was determined using the indophenol blue colorimetric method at 578 nm. One unit of urease activity was defined as the amount of enzyme that produced 1 μg of ammonia per gram of dry soil per day. Catalase (CAT) activity was measured with a commercial kit (G0303W96, Geruisi-bio, China) by tracking the decomposition of hydrogen peroxide at 510 nm. A unit of CAT activity was defined as the quantity of enzyme needed to decompose 1 μmol of H2O2 per gram of soil per hour[19].
Analysis of soil chemical properties
-
Soil pH was measured using a pH meter (3310 SET22AA312, Germany). TN was determined using the Kjeldahl method[20]. TP and TK were analyzed according to the agricultural standards of soils (NY/T 88-1988 named 'Soil total phosphorus determination method', NY/T 87-1988 named 'Soil total potassium determination method'). SOM was quantified by the potassium dichromate oxidation method with external heating. AN was determined using the alkaline hydrolysis reduction method described by Chen et al.[21]. AP and AK were extracted using the Mehlich-3 method, at a soil-to-solution ratio of 1:10[22]. The filtrate was then diluted and measured by inductively coupled plasma-atomic emission spectroscopy (ICP-AES, Thermo, USA).
Sequencing and analysis of fungal and bacterial amplicons
-
Soil microbial DNA was extracted using the E.Z.N.A.® Soil DNA Kit (Omega Bio-tek, Norcross, GA, USA) following the manufacturer's protocol. The integrity of the extracted DNA was assessed via 1.0% agarose gel electrophoresis, while its concentration and purity were quantified using a Nano-Drop 2000 spectrophotometer (Thermo Fisher Scientific, USA). For fungal analysis, the ITS region was amplified using universal fungal primers ITS1f (5′-CTTGGTCATTTAGAGGAAGTAA-3′), and ITS2 (5′-GCTGCGTTCTTCATCGATGC-3′). The bacterial 16S V4 region was amplified by PCR using specific primers 515F:5′-GTGCCAGCMGCCGCG GTA A-3′ and 806R:5′-GGACTACHVGGGTWTCTAAT-3′. PCR products were recovered by using a gel recovery kit (Qiagen). PCR products were purified and recovered using standard protocols. A sequencing library was constructed using a commercial library preparation kit, and its quality was assessed using the QuantiFluor™-ST system (Promega, Madison, WI, USA). Qualified libraries were subjected to high-throughput sequencing on the Illumina NextSeq 2000 platform (Shanghai Meiji Biomedical Technology Co., Ltd, China) to generate paired-end reads for downstream analysis.
For microbial community analysis, raw sequencing data were processed on the Majorbio Cloud Platform (
https://cloud.majorbio.com ). Sequence quality control, filtering, and splicing were performed with fastp (v 0.19.6) and FLASH (v1.2.11). High-quality sequences were clustered into operational taxonomic units (OTUs), at a 97% similarity threshold using UPARSE (v7.1), with chimeric sequences removed during the process. Sequences assigned to chloroplasts and mitochondria were excluded from all samples. To minimize the impact of uneven sequencing depth, the dataset was rarefied to an equal number of sequences per sample, resulting in a Good's coverage of > 99% for all communities. Taxonomic classification of OTUs was based on the Silva (bacteria, v138.0), and UNITE (fungi, v8.0) databases with a 70% confidence threshold using the RDP classifier (v2.11)[23]. Functional profiling was carried out using PICRUSt2 (v2.2.0)[24] for bacterial communities and FUNGuild (v1.0) for fungal guild prediction.Statistical analysis
-
Data organization was performed using Microsoft Excel 2021. Statistical analysis was performed using SPSS 27.0 software. Data normality and homogeneity of variances were confirmed using Shapiro-Wilk and Levene's tests, respectively. Significance among treatments was evaluated by one-way analysis of variance (ANOVA) followed by Duncan's test at a significance level of p < 0.05. Graphical representations were generated with TBtools[25]. All experiments were performed with three independent biological replicates.
-
The application of three distinct types of biochar exhibited a variable impact on the soil pH of tea plantations (Fig. 1a). Following a 15-d incubation period, with the exception of the YM1 treatment, the pH of the soil in the tea plantation exhibited a significant increase (p < 0.05) for each treatment. Among these, the YK2 treatment demonstrated the most effective outcome, with an increase in pH of 0.29 units in comparison with CK. At the 30-d mark, the pH of the YK2 treatment remained significantly higher (p < 0.05) compared to the other treatments, with an increase of about 7.6% compared to CK. While the 1.0% corn stover biochar (YM2) showed no significant difference from CK, it maintained elevated pH levels, whereas all other treatments induced significant pH increases (p < 0.05). After 45 d of incubation, both reed biochar and coconut shell biochar treatments significantly enhanced soil pH (p < 0.05), with the LW2 treatment displaying the greatest improvement (0.12-unit increase). Conversely, corn biochar reduced soil pH, particularly the 0.5% application, which decreased pH by 0.07 units.
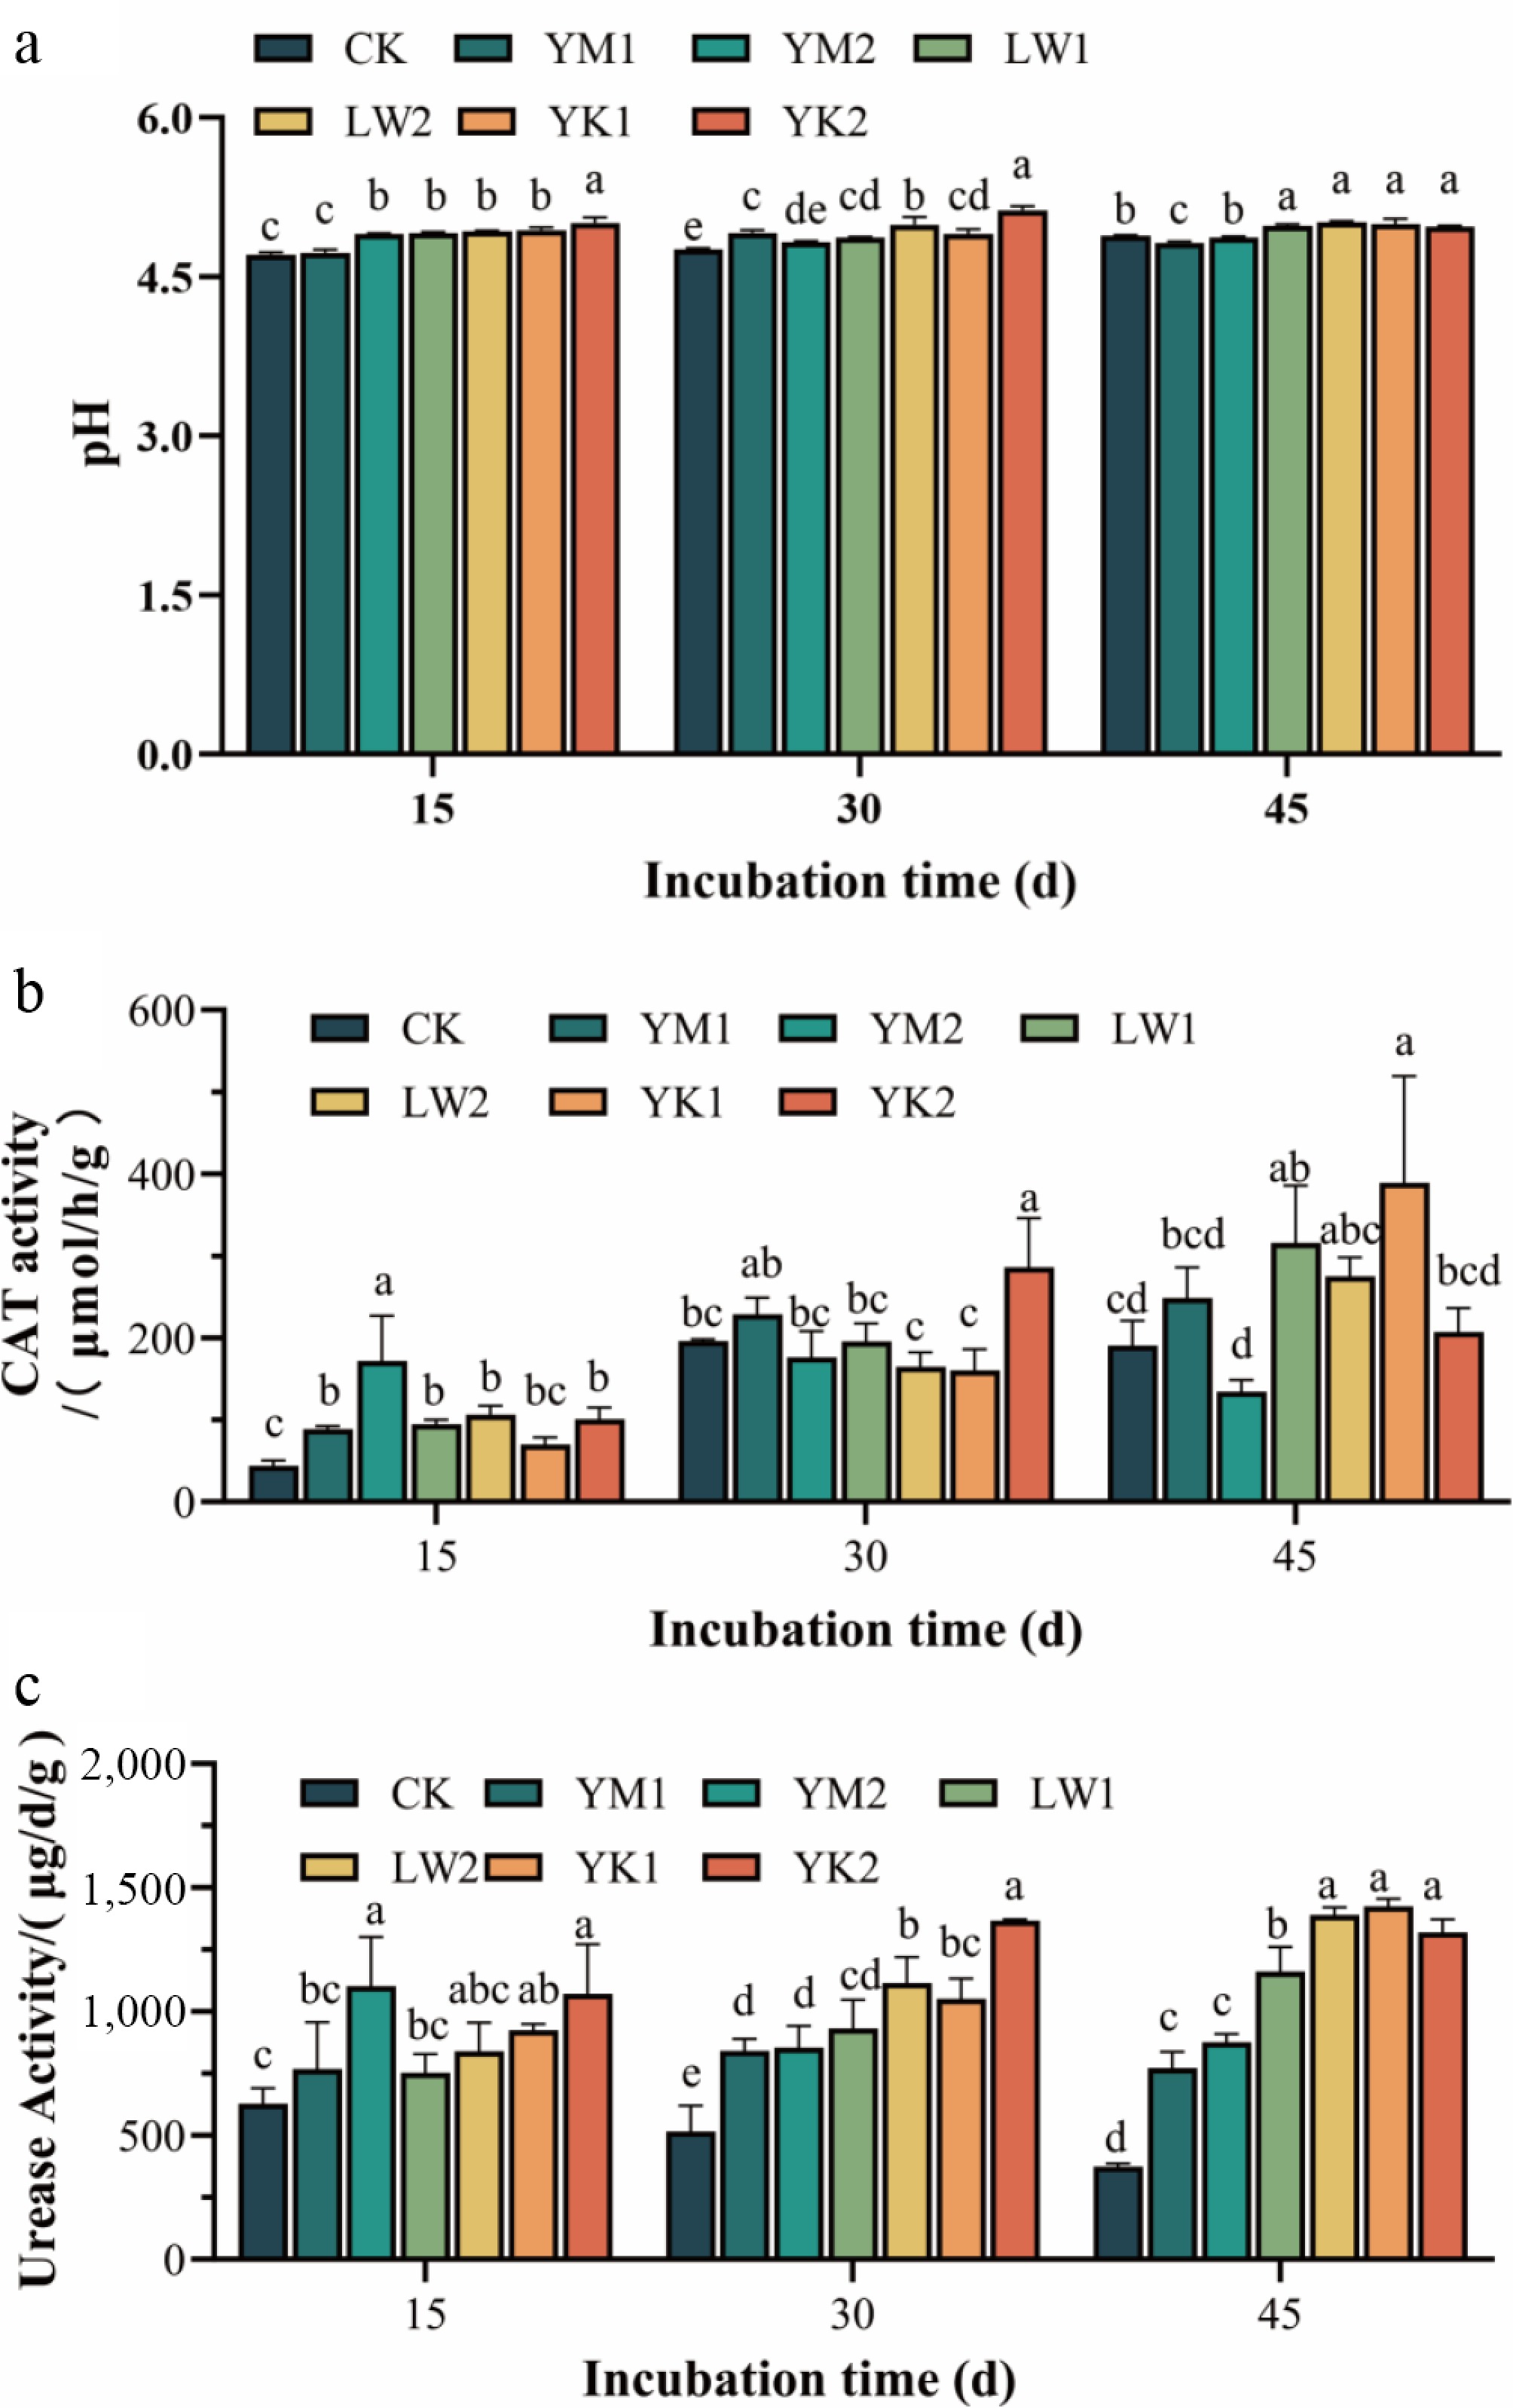
Figure 1.
Effect of application of different biochar treatments on soil pH and enzyme activity variations in tea plantations during 45 d of incubation. (a) pH. (b) CAT activity. (c) Urease activity. CK (no biochar), YM1 (0.5% corn stover biochar), YM2 (1.0% corn stover biochar), LW1 (0.5% reed biochar), LW2 (1.0% reed biochar), YK1 (0.5% coconut shell biochar), YK2 (1.0% coconut shell biochar). Different lowercase letters indicate significant differences between treatments after the same treatment time (p < 0.05).
Catalase plays a crucial role in mitigating oxidative stress by decomposing hydrogen peroxide, protecting cells from peroxidative damage[26,27]. Its activity in tea plantation soil was significantly influenced by biochar application (Fig. 1b). At day 15, all treatments enhanced CAT activity except for YK1 treatment, with YM2 treatment inducing a 3.94-fold increase over the control. By day 30, the YK2 treatment showed the highest activity, being 46.05% greater than the control, whereas neither corn stover nor reed biochar caused significant changes. At the end of the incubation (45 d), significant enhancements were observed in the LW1 and YK1 treatments, with YK1 increasing CAT activity by 104.12% compared to CK (p < 0.05).
Urease catalyzes the hydrolysis of urea and reflects soil nitrogen transformation capacity[28]. Biochar amendments consistently stimulated urease activity throughout the incubation (Fig. 1c). At day 15, significant increases were induced by the YM2, YK1, and YK2 treatments, with YM2 showing a 1.76-fold increase over the CK. This stimulatory effect was maintained at days 30 and 45 across all biochar treatments. On day 30, the highest urease activity was observed under YK2, which increased by 164.83% relative to the control. By day 45, YK1 resulted in the most pronounced enhancement, elevating urease activity to 3.81 times that of the CK. Coconut shell biochar maintained stable efficacy across concentrations at 45 d, while other biochar types exhibited concentration-dependent effects, with higher application rates generally leading to greater urease activity.
Biochar application effects on soil nutrient contents
-
Based on the comprehensive performance in pH stability and enzyme activity enhancement observed in the preceding experiments, the LW1 (0.5% reed biochar), YM1 (0.5% corn stover biochar), YK1 (0.5% coconut shell biochar), and YK2 (1.0% coconut shell biochar) treatments were selected for detailed analysis of soil nutrients.
After 45 d of incubation, none of the biochar treatments significantly altered the contents of TN, TP, and TK compared to CK (p > 0.05, Table 1). However, the YK2 treatment showed a modest increasing trend, with TN, TP, and TK rising by approximately 5.0%, 3.8%, and 8.9%, respectively. In terms of available nutrients, both YK2 and YM1 significantly increased the AP content relative to CK (p < 0.05). In contrast, LW1 significantly reduced AP levels (p < 0.05). No significant differences were observed in AK and AN among the treatments (p > 0.05). Furthermore, SOM content was most effectively enhanced by the YK2 treatment, which increased it to 1.45 times that of the CK, a significant improvement over the other biochar amendments. Collectively, these results indicate that the YK2 treatment possesses a superior capacity for improving soil nutrient availability and organic matter content, highlighting its potential as a promising soil amendment for enhancing fertility in tea plantation ecosystems.
Table 1. Effect of different biochar types on soil nutrient content.
TN/(g/kg) TP/(g/kg) TK/(g/kg) AP/(mg/kg) AK/(mg/kg) AN/(mg/kg) SOM/(g/kg) CK 1.53 ± 0.13a 0.79 ± 0.05a 10.56 ± 1.23a 61.12 ± 4.10b 333.28 ± 20.21ab 139.90 ± 18.53ab 32.68 ± 0.51d LW1 1.53 ± 0.15a 0.76 ± 0.00a 10.92 ± 0.35a 52.87 ± 3.14c 327.28 ± 10.13b 124.91 ± 16.16ab 35.28 ± 0.76c YM1 1.69 ± 0.01a 0.78 ± 0.02a 10.28 ± 0.84a 73.28 ± 3.10a 356.30 ± 0.44a 144.33 ± 9.82ab 36.72 ± 0.73c YK1 1.67 ± 0.02a 0.80 ± 0.05a 10.55 ± 1.00a 68.17 ± 6.26ab 327.22 ± 10.22b 151.79 ± 7.55a 39.47 ± 1.81b YK2 1.66 ± 0.03a 0.82 ± 0.08a 11.50 ± 1.52a 70.09 ± 1.54a 350.42 ± 20.04ab 121.59 ± 14.87b 47.26 ± 1.12a CK (no biochar), LW1 (0.5% reed biochar), YM1 (0.5% corn stover biochar), YK1 (0.5% coconut shell biochar), YK2 (1.0% coconut shell biochar). Different lowercase letters indicate significant differences between different biochar treatments (p < 0.05). Microbial community richness and diversity
-
Given the preliminary analyses (Fig. 1), the YM1 treatment exhibited relatively weaker effects on improving soil pH and enzyme activities compared to the LW1, YK1, and YK2 treatments. Moreover, no significant difference was observed between the YM1 treatment and the other biochar treatments in terms of key fertility indicators. (Table 1). Based on these observations, the subsequent microbial analysis was therefore focused on the LW1, YK1, and YK2 treatments to elucidate their divergent effects on community structure, richness, and diversity.
A total of 12 soil samples were subjected to high-throughput sequencing, yielding 748,955 fungal ITS sequences and 735,956 high-quality bacterial 16S rRNA gene sequences. Rarefaction curves reached saturation, indicating sufficient sequencing depth for reliable analysis of operational taxonomic units (OTUs). Alpha diversity analysis revealed that biochar application significantly influenced fungal community diversity (Table 2). Specifically, the YK2 treatment increased the Shannon index, and decreased the Simpson index, indicating enhanced fungal diversity. In contrast, the LW1 treatment showed an opposite trend, suggesting a suppression of diversity. Although not statistically significant, high-concentration biochar treatments markedly increased richness indices (ACE and Chao1). OTU analysis further elucidated these shifts (Fig. 2a). The YK2 treatment yielded the highest total OTU count (775), while the YK1 treatment resulted in the lowest (481). A core microbiome of 206 OTUs was shared across all treatments. The YK2 treatment also contained the highest number of unique OTUs (235, 16.98% of total), and shared the greatest number of OTUs (90) with CK.
Table 2. Effect of different biochar types on alpha diversity of fungi and bacteria.
Microbial community Biochars ACE Chao Shannon Simpson Sobs Fungi CK 397.44 ± 16.70a 402.48 ± 15.66a 3.67 ± 0.13a 0.0709 ± 0.01a 387 ± 16.83a LW1 323.44 ± 74.39a 326.67 ± 75.79a 3.57 ± 0.27a 0.0917 ± 0.02a 312 ± 72.26a YK1 249.59 ± 19.34a 248.63 ± 19.12a 3.78 ± 0.03a 0.0564 ± 0.00a 243 ± 17.36a YK2 402.00 ± 91.46a 407.63 ± 93.11a 3.9 ± 0.07a 0.0643 ± 0.00a 390 ± 88.40a Bacteria CK 2,952.24 ± 61.13a 2,852.2 ± 49.90a 5.91 ± 0.03a 0.0126 ± 0.00a 2,391 ± 43.24a LW1 3,106.68 ± 77.37a 3,008.16 ± 67.79a 6.15 ± 0.13a 0.0102 ± 0.00a 2,560 ± 54.48a YK1 3,117.77 ± 30.74a 3,018.05 ± 28.17a 5.99 ± 0.16a 0.0111 ± 0.00a 2,476 ± 75.45a YK2 2,805.04 ± 195.27a 2,749.48 ± 170.77a 6.22 ± 0.05a 0.0064 ± 0.00b 2,304 ± 133.23a CK (no biochar), LW1 (0.5% reed biochar), YK1 (0.5% coconut shell biochar), YK2 (1.0% coconut shell biochar). Different lowercase letters indicate significant differences between different biochars (p < 0.05). 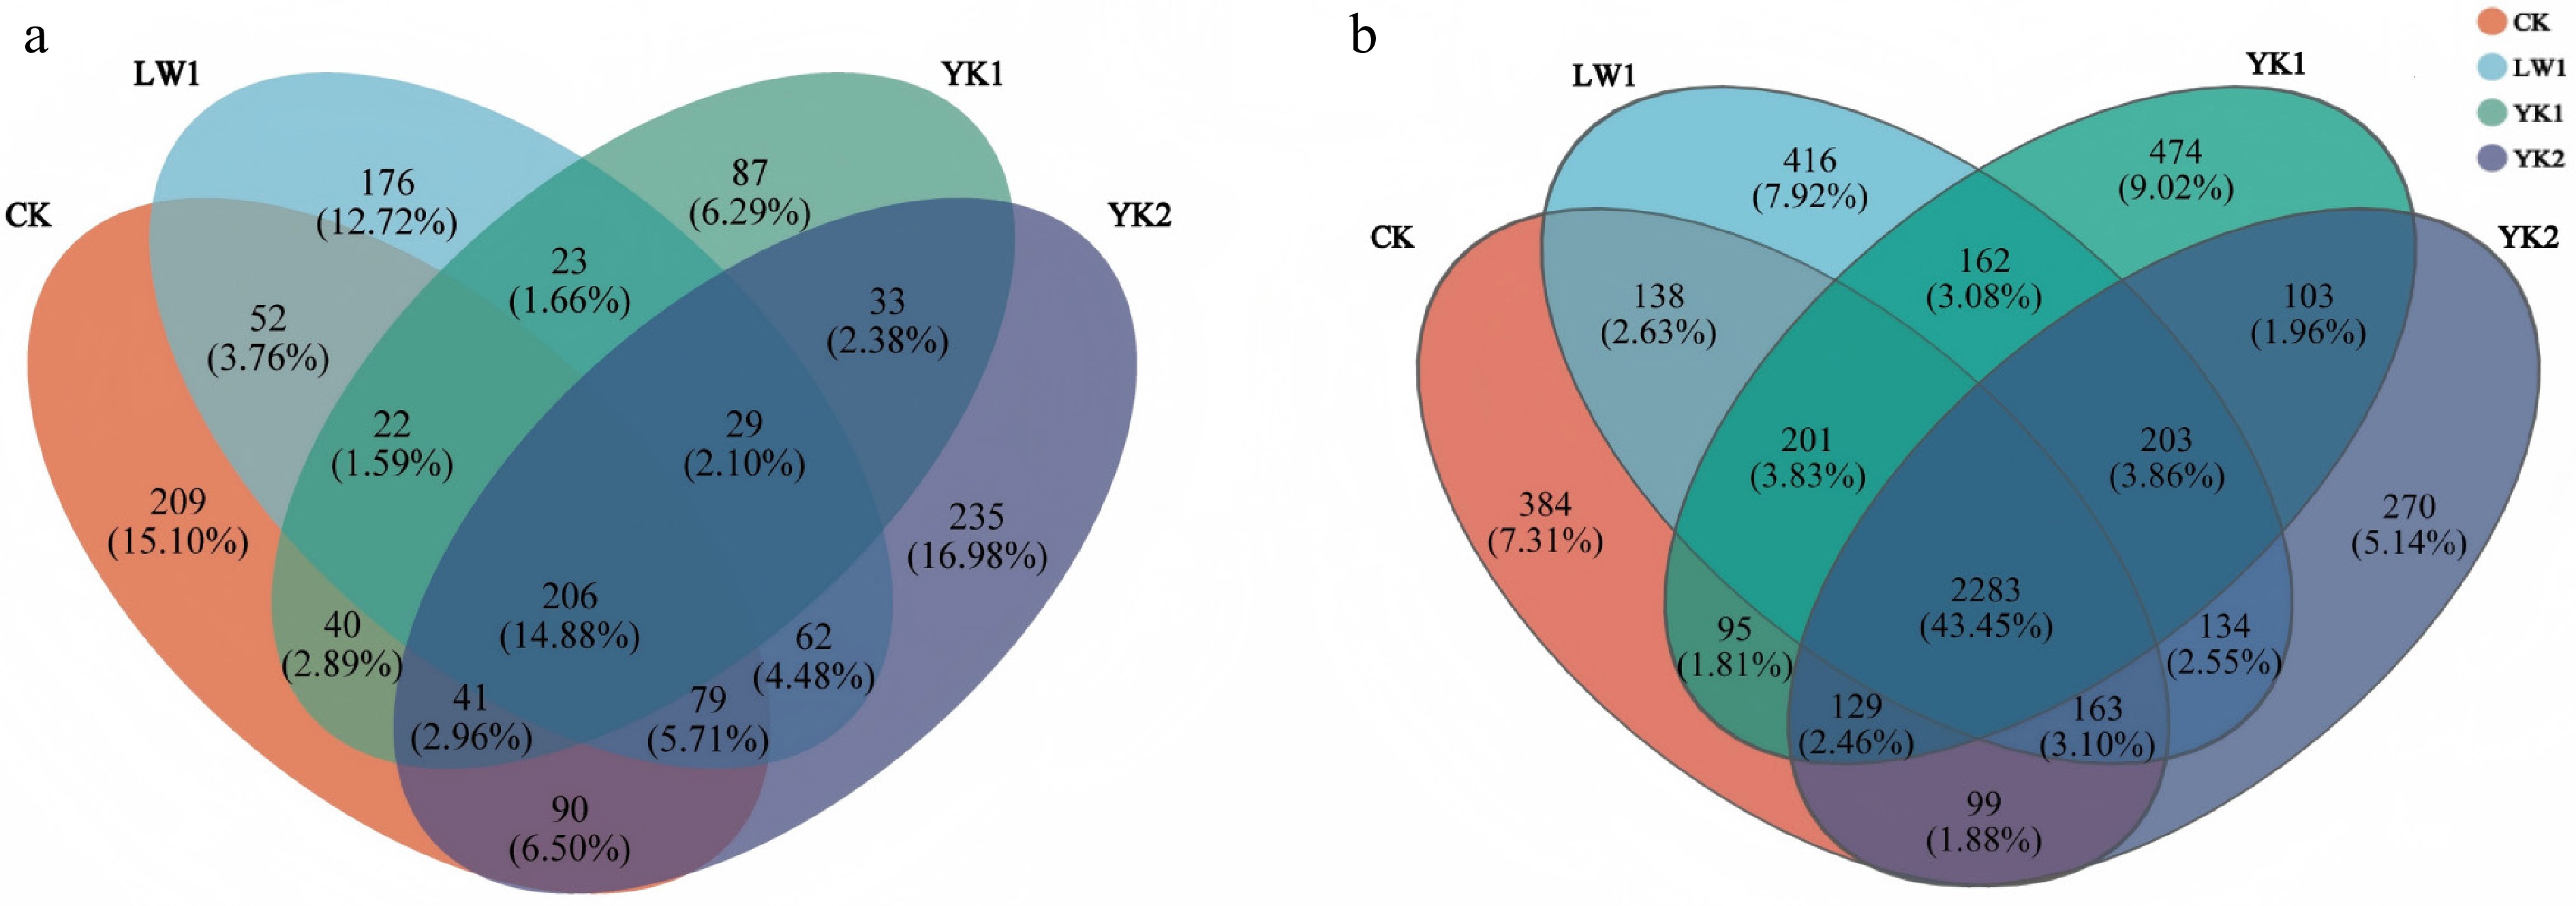
Figure 2.
Venn diagram illustrating Operational Taxonomic Unit (OTU) of (a) soil fungal, and (b) bacterial communities under different biochar application. CK (no biochar), LW1 (0.5% reed biochar), YK1 (0.5% coconut shell biochar), YK2 (1.0% coconut shell biochar).
As shown in Table 2, the Shannon index of the soil bacterial community in the tea plantation increased, and the Simpson index decreased after the application of biochar. The diversity of the bacterial community increased with the application of biochar. However, the application of biochar at high concentrations led to a decline in the ACE index and Chao index of the bacterial community, though these reductions did not attain statistical significance. The YK1 and LW1 treatments exhibited no significant difference in bacterial alpha diversity. As illustrated in Fig. 2b, for soil bacteria, the number of OTUs present in the samples from the CK, LW1, YK1, and YK2 treatments at the OTU level was 3,492, 3,700, 3,650, and 3,384, respectively, with the LW1 treatment exhibiting the highest number of OTUs. The four treatments shared 43.45% of the OTUs (2,283 OTUs). The number of OTUs unique to CK, LW1, YK1, and YK2 was 384, 416, 474, and 270, respectively, with YK1 having the most OTUs unique to YK1 (9.02%) with more unique bacteria. The remaining OTUs were shared by both samples, and CK and YK1 alone shared the most OTUs (138), higher than YK1 (95), and YK2 (99).
Composition and predicted function of soil microbial communities
-
Principal coordinates analysis (PCoA) based on Bray–Curtis distance revealed that biochar amendments, particularly coconut shell-derived biochar, significantly altered soil bacterial community structure, with the first two axes explaining 41.5% and 18.8% of the total variance, respectively (Supplementary Fig. S1). In contrast, the fungal community composition exhibited limited separation among treatments, which was partly attributable to high dispersion within the control group.
The fungal OTUs were identified, spanning 15 phyla to 494 species. At the phylum level (Fig. 3a), the community was predominantly composed of Ascomycota, Basidiomycota, Mortierellomycota, and unclassified fungi (97.87%−98.85% in total). Compared to the CK, the LW1 treatment increased the relative abundance of Mortierellomycota, while Ascomycota was enriched under the YK1 treatment. At the class level (Fig. 3b), Sordariomycetes, Tremellomycetes, Mortierellomycetes, Leotiomycetes, and Eurotiomycetes were the most abundant taxa. Compared to CK, the relative abundance of Sordariomycetes was decreased by both LW1 and YK2 treatments but increased by YK1. This reduction was significant under the LW1 treatment (p < 0.05). Furthermore, LW1 increased the relative abundance of Mortierellomycetes by 44.83% compared to CK. In addition, the YK2 treatment significantly enhanced the relative abundance of Pezizomycetes (p < 0.05). At the fungal genus level (Fig. 3c), 88.56% of sequences were classified. Biochar amendment generally increased the proportion of unclassified fungi (up to 15.43%). The dominant genera (> 1% relative abundance) included Saitozyma (18.14%), Trichoderma (10.52%), and Mortierella (15.32%). Biochar treatments significantly reduced the relative abundance of Trichoderma compared to CK (p < 0.05), and both LW1 and YK1 also reduced the abundances of Saitozyma and Oidiodendron. FUNGuild functional prediction classified the fungi into 12 trophic modes (Supplementary Fig. S2). 'Undefined saprotrophs' dominated in the CK and YK1 treatments (20.93%–28.27%), whereas 'endophytic–multifunctional' fungi were most abundant in the LW1 treatment (23.22%). Biochar amendments generally increased the proportion of 'unknown' fungi.
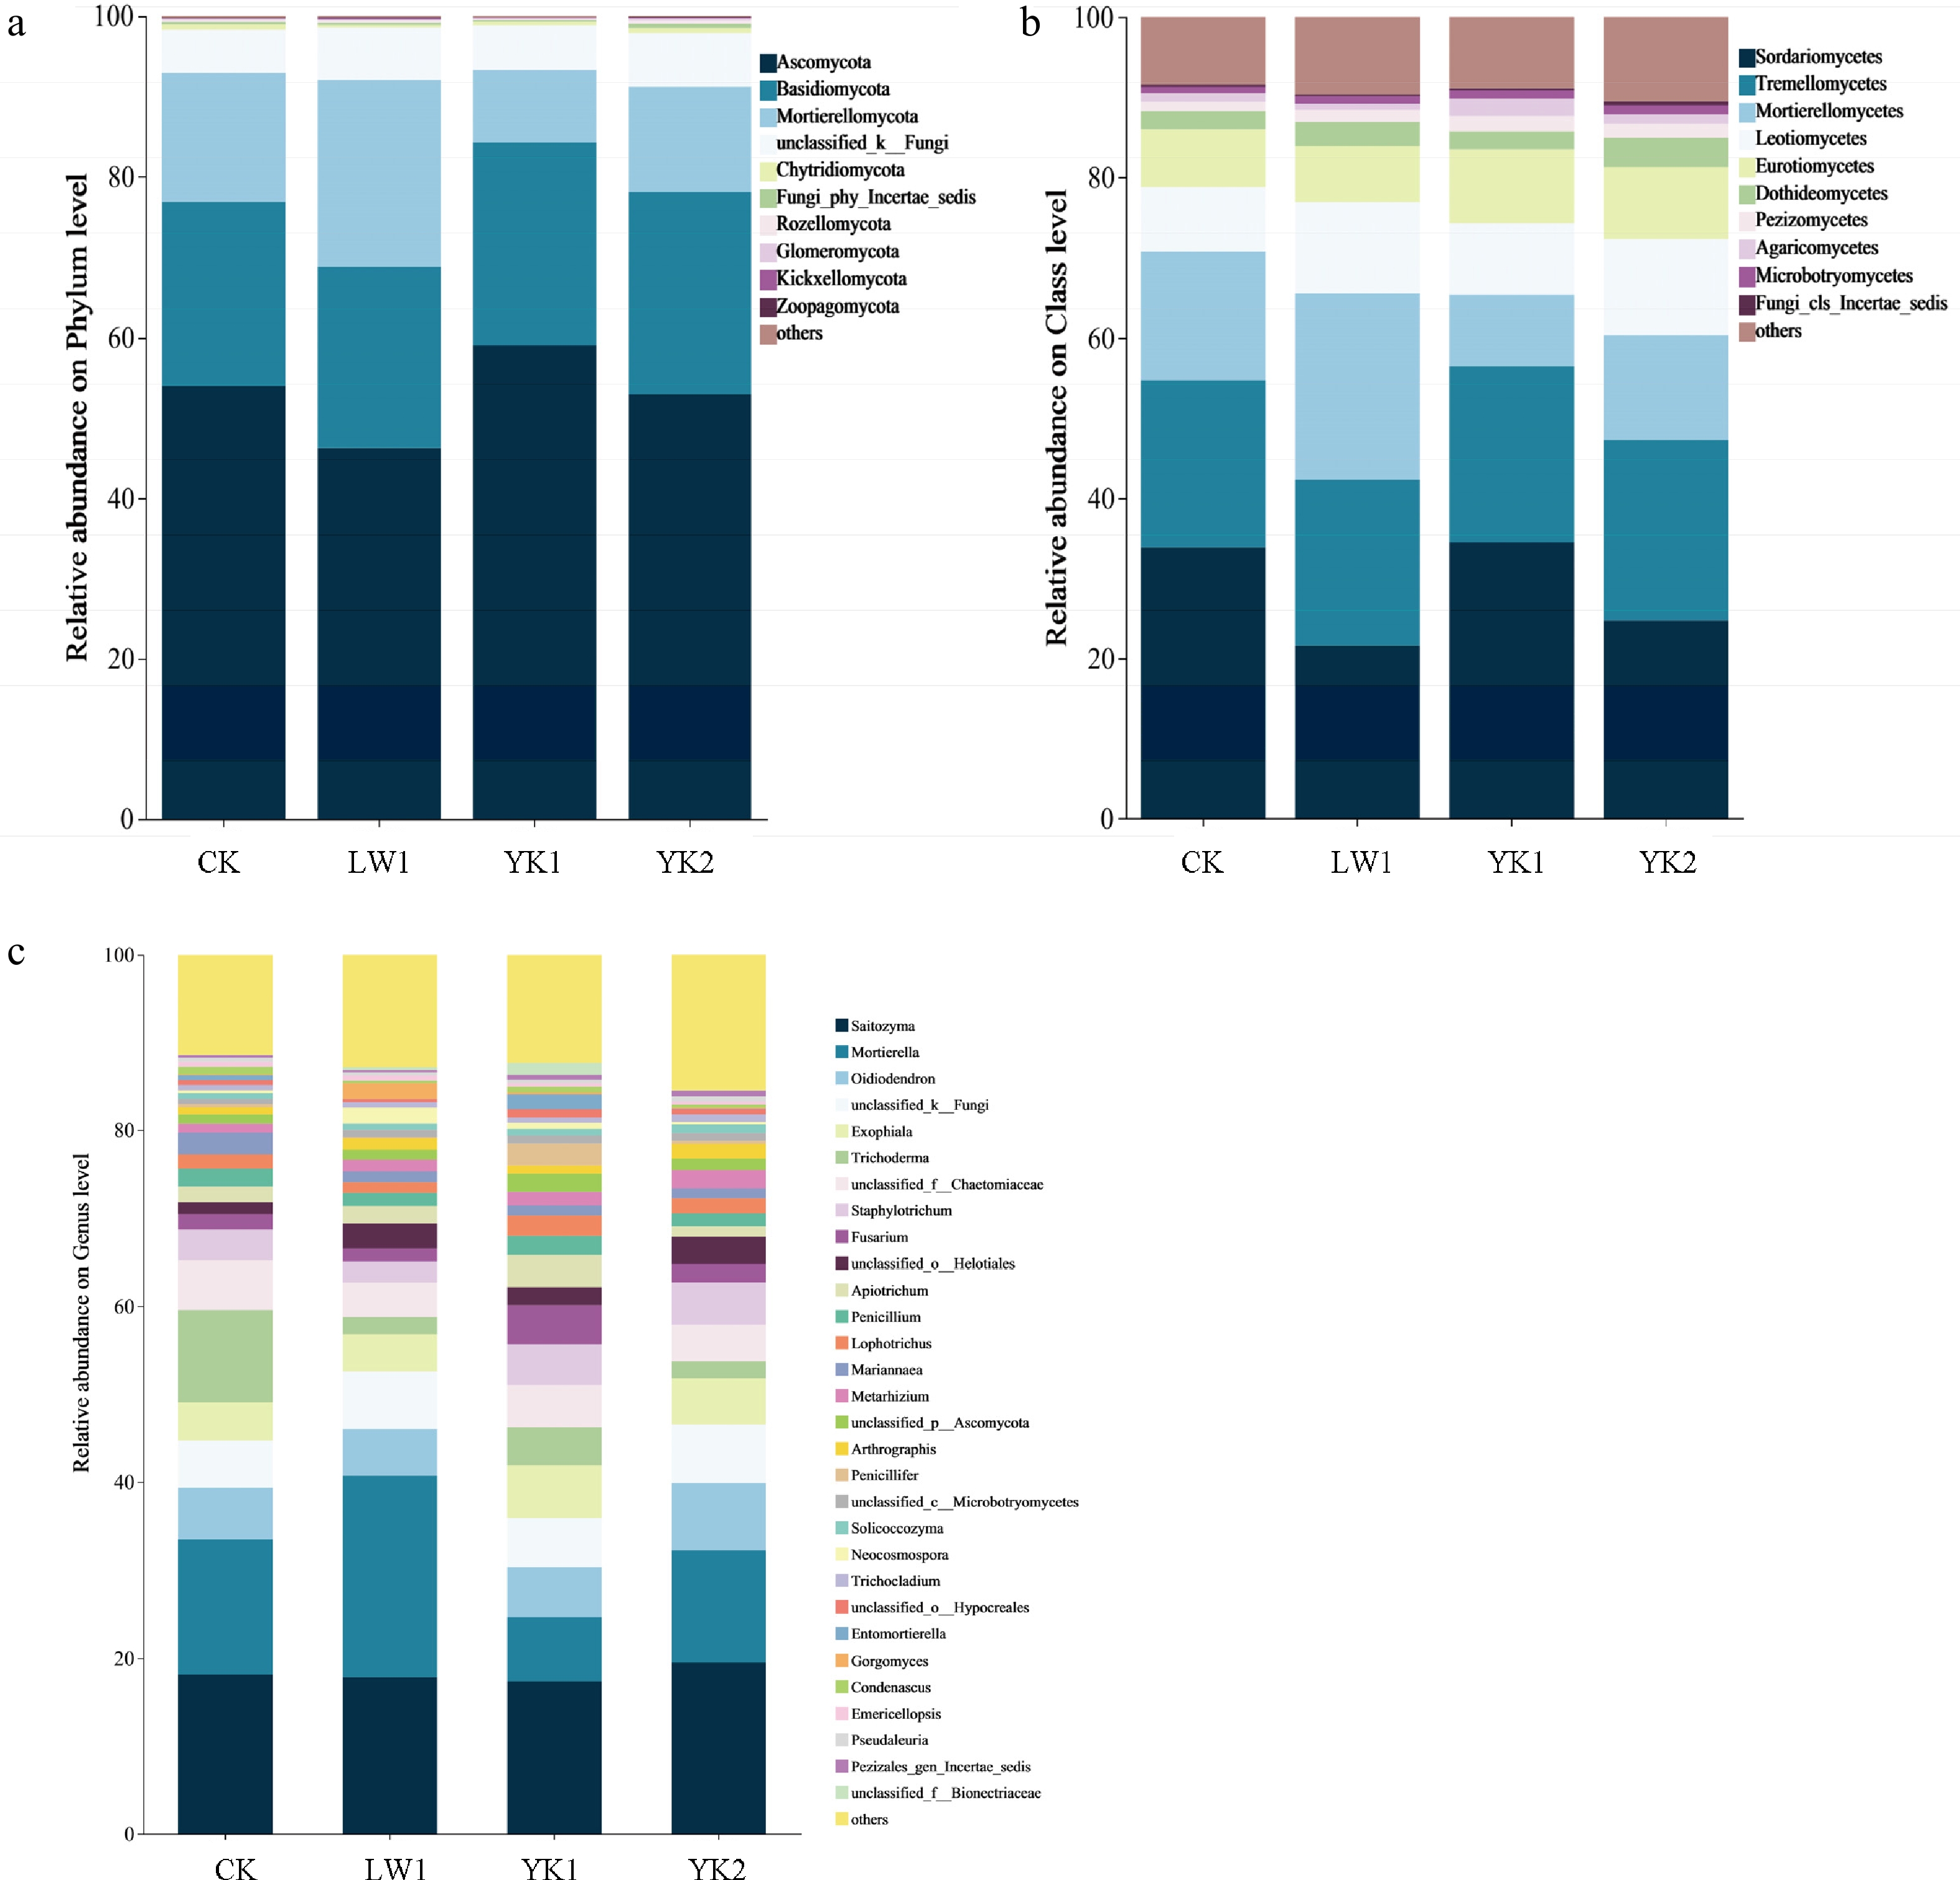
Figure 3.
Changes in (a) phylum, (b) class, and (c) genus level fungal community diversity in tea plantation soil under different biochar treatments. CK (no biochar), LW1 (0.5% reed biochar), YK1 (0.5% coconut shell biochar), YK2 (1.0% coconut shell biochar).
The composition of the bacterial community is shown in Fig. 4. At the phylum level (Fig. 4a), Proteobacteria, Firmicutes, Chloroflexi, Acidobacteriota, and Actinobacteriota dominated, collectively representing 80.73%−83.50% of the total relative abundance. The YK2 treatment significantly increased the relative abundances of Actinobacteriota and Gemmatimonadota compared to CK, while markedly reducing Firmicutes. At the class level (Fig. 4b), the most abundant taxa were Bacilli, Alphaproteobacteria, Acidobacteriae, and Ktedonobacteria (46.79%–64.66%). Biochar application generally increased the proportion of unclassified bacteria. All biochar treatments reduced the relative abundance of Bacilli, with a significant decrease under YK2 (p < 0.05). Conversely, Alphaproteobacteria increased across all treatments, and YK2 significantly enhanced the abundance of Gemmatimonadetes (p < 0.05). Genus-level analysis (Fig. 4c) showed that 64.68% of sequences were classified. Dominant genera included Bacillus, unclassified Acidobacteria, and Sphingomonas. Biochar amendments generally significantly reduced the relative abundances of Bacillus, unclassified Acidobacteria, Tumebacillus, and unclassified WPS-2. YK2 significantly decreased Bacillus, unclassified Acidobacteria, and unclassified WPS-2 compared to CK (p < 0.05). The LW1 treatment increased the abundance of Ktedonobacteraceae by 4.54-fold relative to CK, while significantly reducing unclassified Acidobacteria (p < 0.05). Functional prediction via PICRUSt2 revealed 46 stable metabolic subfunctions (Supplementary Fig. S3). Primary functions included global overview maps (~51.7%), carbohydrate metabolism (~11.8%), and amino acid metabolism (~10.2%), the relative abundances of which remained largely consistent across treatments.
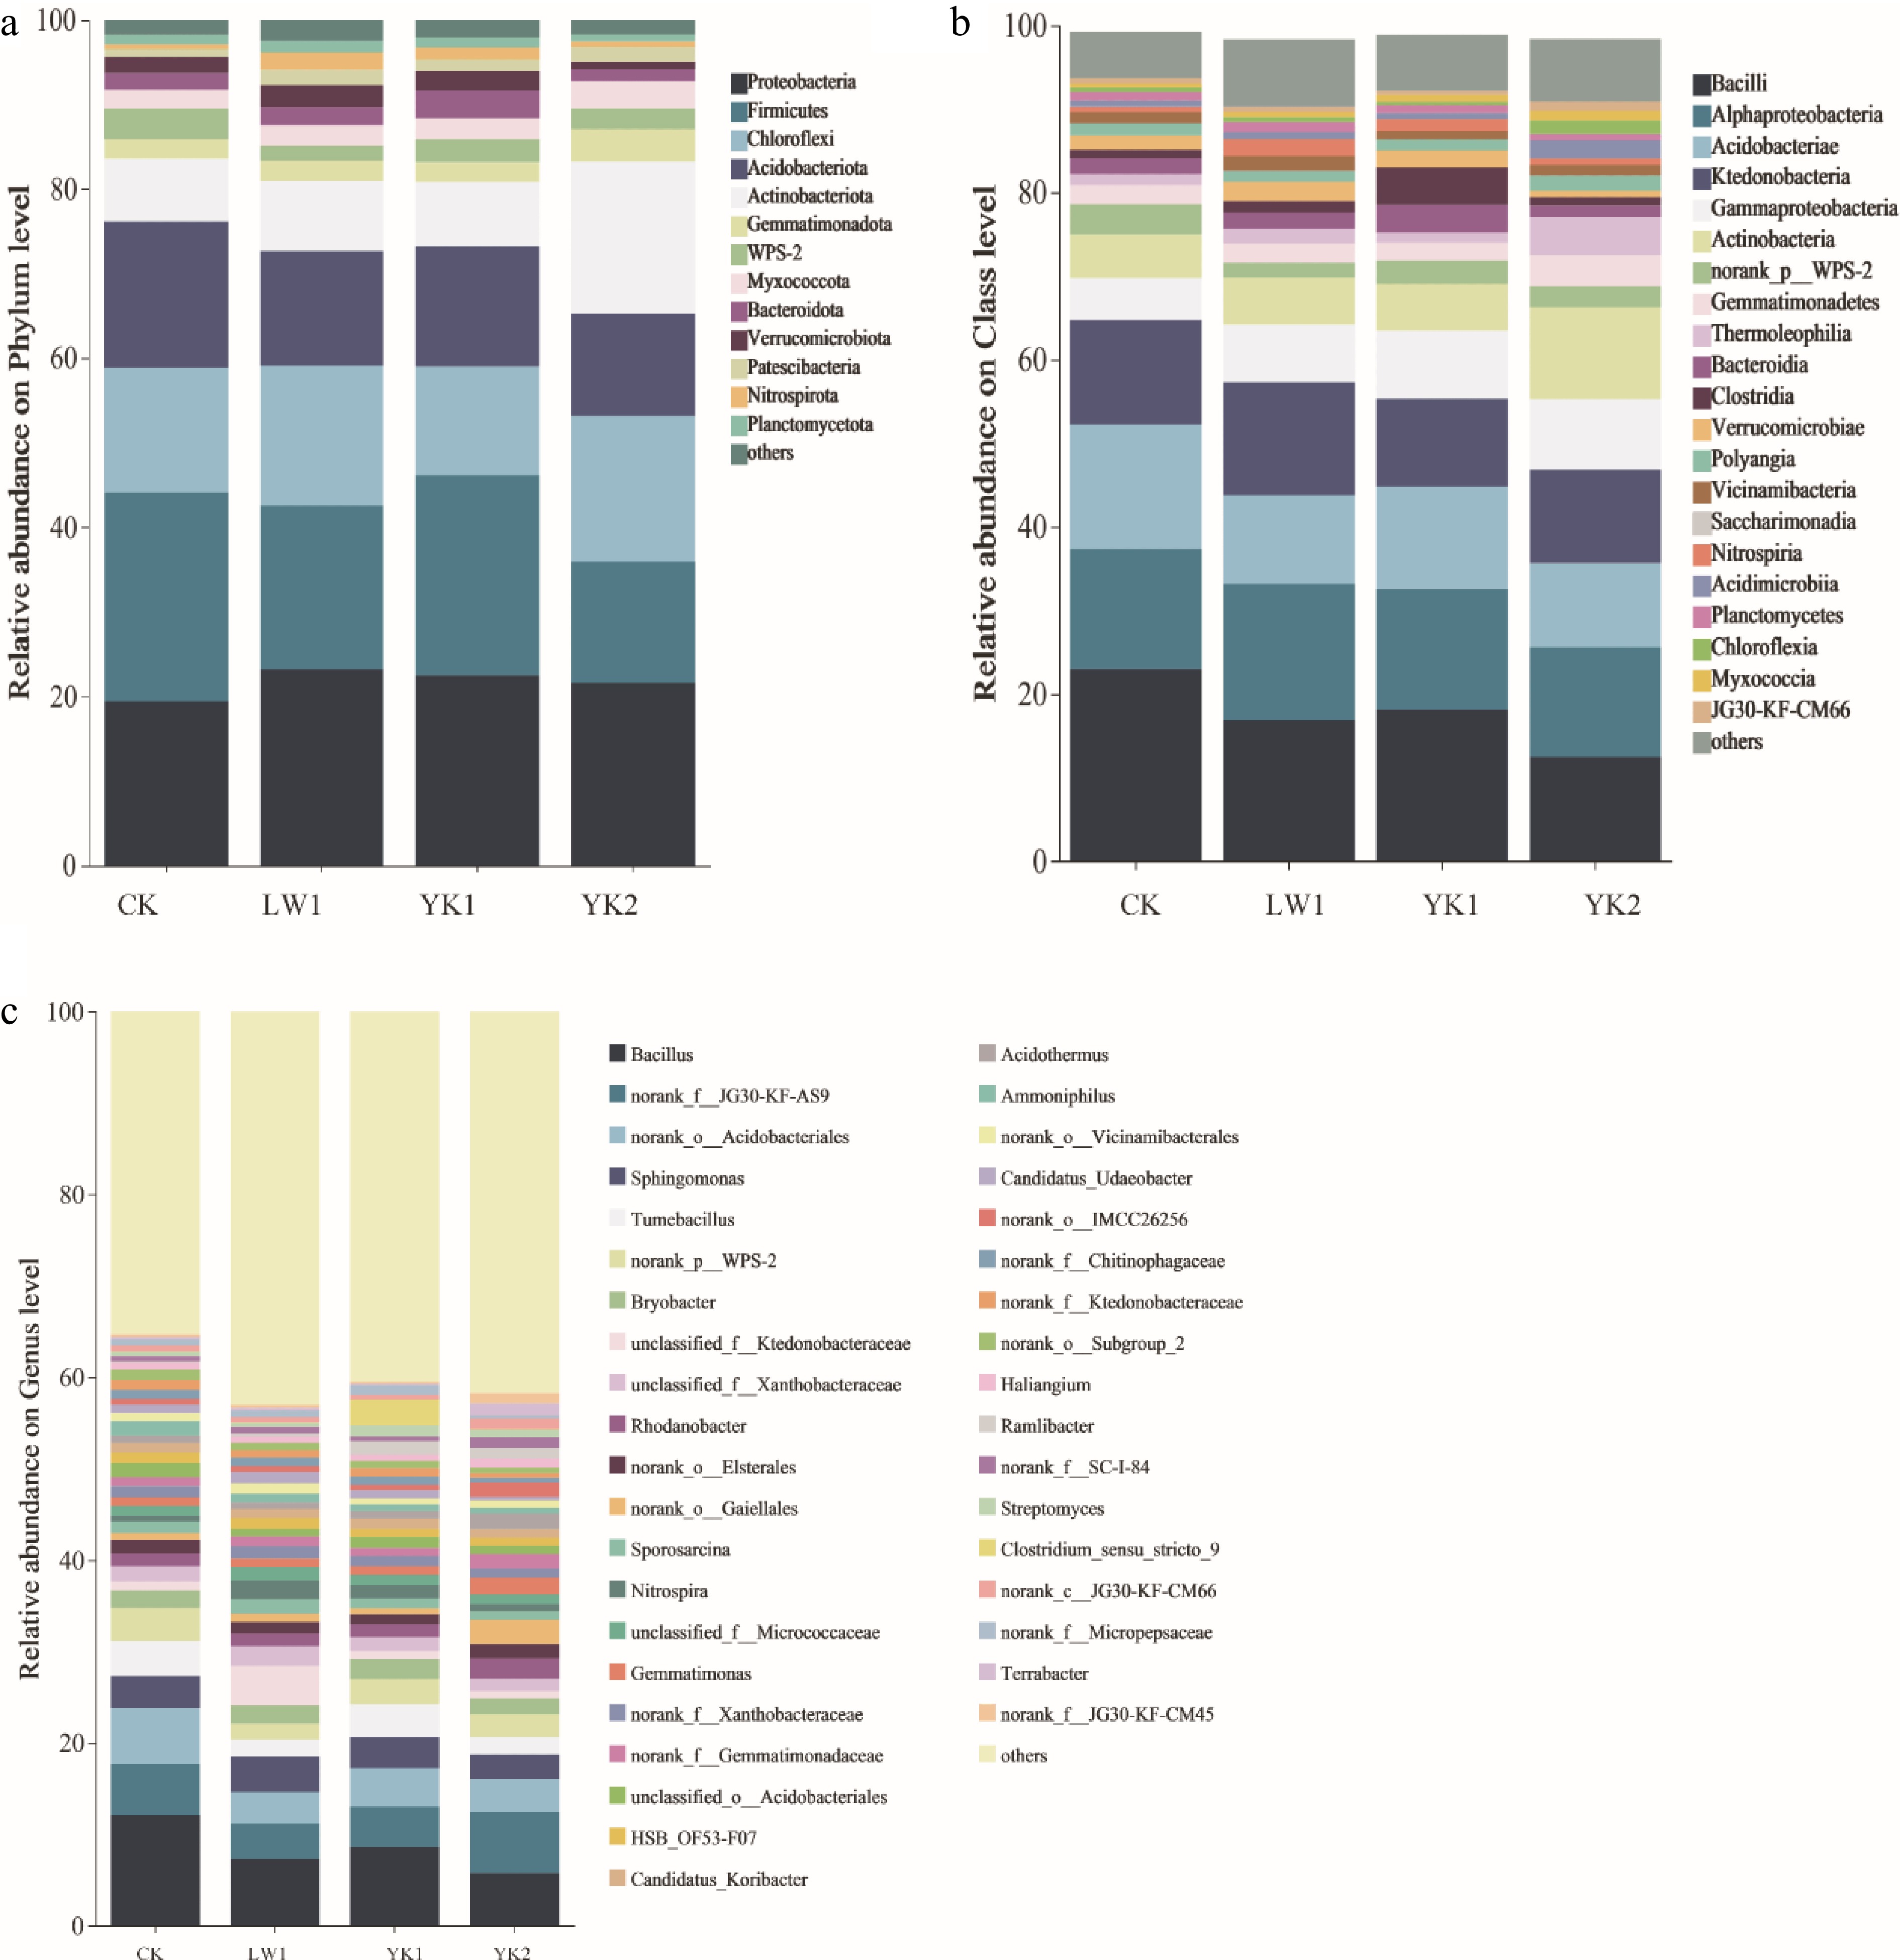
Figure 4.
Changes in (a) phylum, (b) class, and (c) genus level bacterial community diversity in tea plantation soil. CK (no biochar), LW1 (0.5% reed biochar), YK1 (0.5% coconut shell biochar), YK2 (1.0% coconut shell biochar).
Differences in microbial community populations in tea plantations
-
Differential abundance analysis (LEfSe)[29] revealed distinct microbial biomarkers across treatments (Fig. 5). Bacterial community analysis (LDA > 2.0; Fig. 5a) identified 2, 5, 10, and 10 discriminative taxa in the CK, LW1, YK1, and YK2 treatments, respectively. In the CK treatment, Irregularibacter and Virgibacillus were identified as the key discriminating bacterial species. The LW1 treatment was primarily characterized by RCP2-54. Key discriminators in the YK1 treatment included unclassified Gammaproteobacteria, Clostridium sensu stricto 13, Nonomuraea, unclassified Clostridia, and unclassified Ktedonobacterales. In contrast, the YK2 treatment featured unclassified Elsterales, Pedomicrobium, TM7, S32, Lysobacter, Xanthomonadaceae, Oscillospiraceae, Labraceae, and Labrys as key species. These results indicate that biochar application increased the abundance of dominant bacterial groups in tea plantation soil, with coconut shell biochar outperforming reed biochar. Fungal community analysis (LDA > 3.5; Fig. 5b) showed a more limited response, with 2, 1, 4, and 2 discriminative taxa in the CK, LW1, YK1, and YK2 treatments, respectively. Two key differential fungi, Trichoderma and Hypocreaceae, were identified in the CK treatment; Piptocephalidaceae was the key differential fungus in the LW treatment. The key differential fungi in the YK1 treatment were Sordariomycetes, Trichosporonales, and Apiotrichum. In the YK2 treatment, the key differential fungi were Metarhizium and Clavicipitaceae. The results indicate a moderate stimulatory effect of biochar on fungal abundance, with coconut shell biochar exhibiting a superior capacity to shape the fungal community compared to reed biochar.
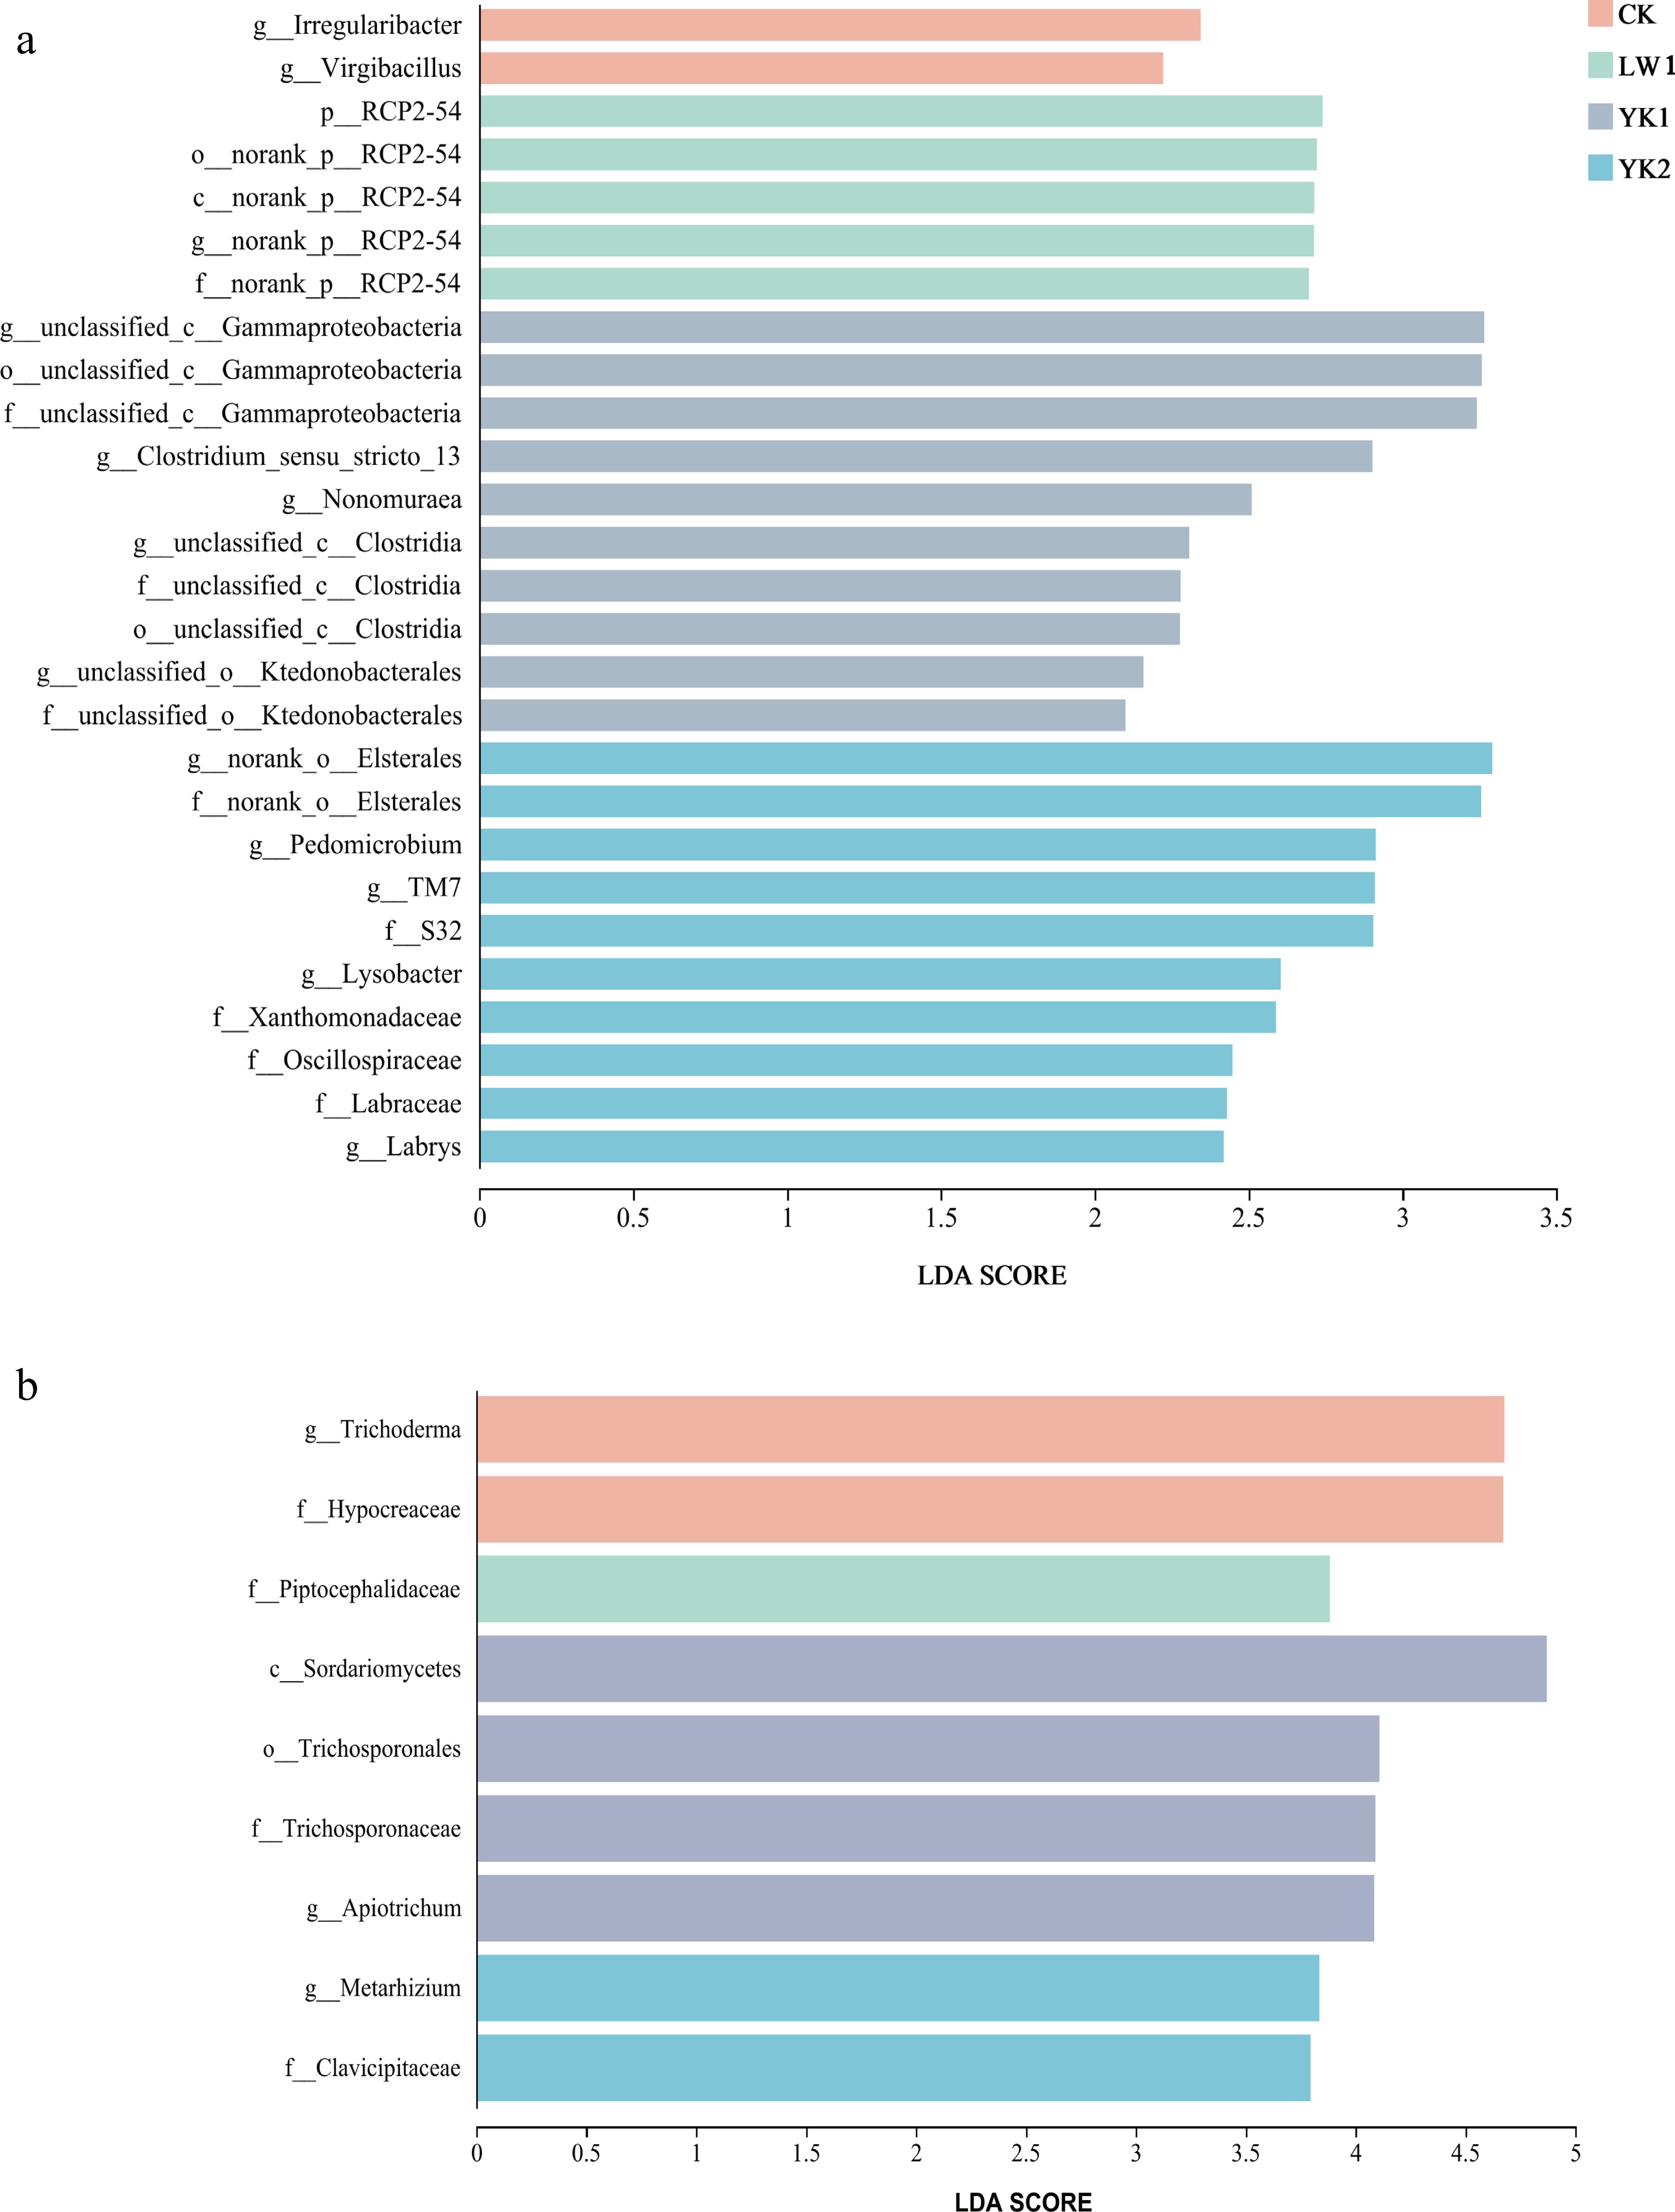
Figure 5.
Histogram of the Linear Discriminant Analysis (LDA) score computed for differentially abundant taxa (genus level) in (a) bacteria, and (b) fungi. CK (no biochar), LW1 (0.5% reed biochar), YK1 (0.5% coconut shell biochar), YK2 (1.0% coconut shell biochar).
Soil microbiome-environment interactions
-
Associations between soil microbial communities and environmental variables were evaluated using Spearman's rank correlation analysis (Fig. 6). At the phylum level of the bacterial community (Fig. 6a), key bacterial taxa in the tea plantation soils were significantly correlated with several soil nutrient properties. Specifically, Acidobacteriota abundance was negatively correlated with SOM content, while Myxococcota and Firmicutes showed positive correlations with TP and AN, respectively (p < 0.05). At the phylum level of the Fungal community (Fig. 6b), TP and TK were positively correlated with the Chytridiomycota (p < 0.05). AN content showed a significant negative correlation with the Zoopagomycota, while AP content was positively correlated with Fungi_phy_Incertae_sedis (p < 0.05). At the genus level of the bacterial community (Fig. 6c), a broader range of significant correlations was observed. Soil properties including pH, catalase, and multiple nutrient measures (total and available N, P, K), were significantly correlated with the abundance of 1 to 9 bacterial genera. Soil pH exhibited a highly significant positive correlation with Nitrospira (p < 0.01). SOM showed a highly significant positive correlation with Ramlibacter (p < 0.01), and AN was significantly positively correlated with Bryobacter (p < 0.05). A distinct finding was that urease activity demonstrated a significant positive correlation exclusively with the genus Ramlibacter. At the fungal genus level (Fig. 6d), multiple soil properties showed significant correlations with the relative abundance of specific fungal genera. Notably, soil pH was positively correlated with Galerina and Coniochaeta (p < 0.05), but negatively correlated with Schizothecium and Trichoderma (p < 0.05). The genus Metarhizium exhibited significant positive correlations with urease activity, SOM, and TN (p < 0.05).
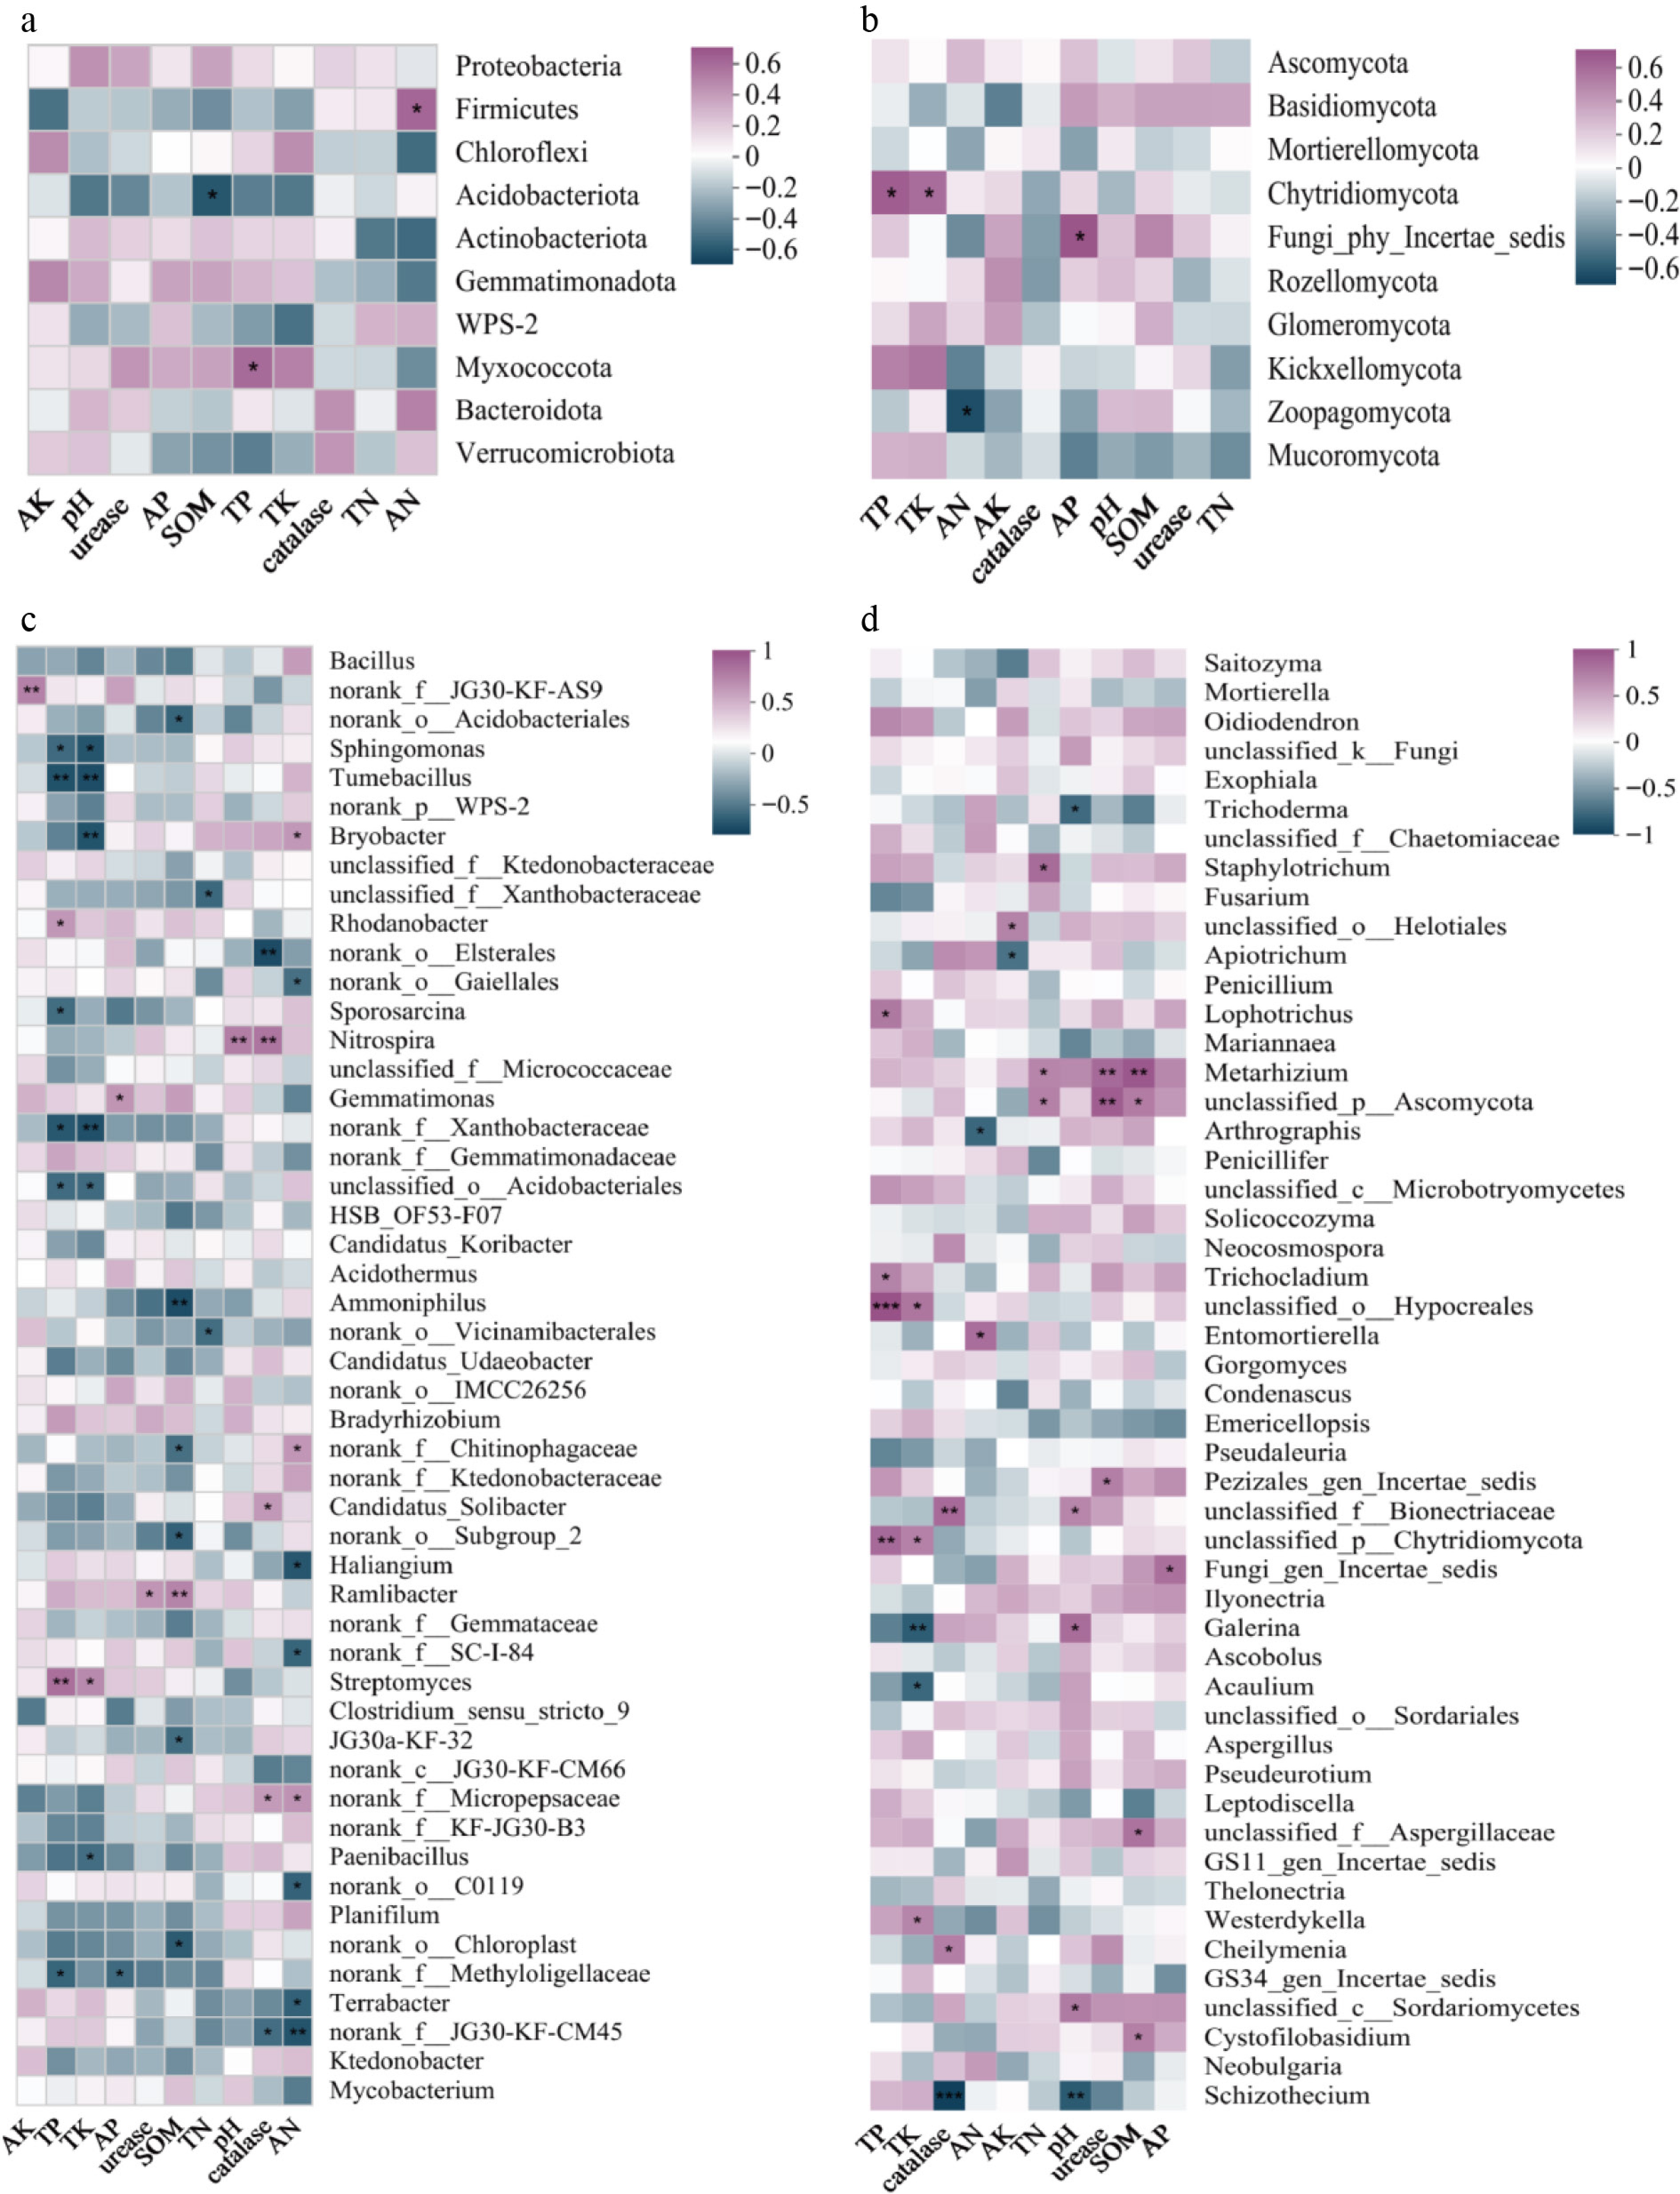
Figure 6.
Correlation analysis between bacterial/fungal communities and soil physicochemical properties in tea plantation soils. (a), (b) Correlations at the phylum level for bacterial and fungal communities. (c), (d) Correlations at the genus level for bacterial and fungal communities. *, **, and *** indicate significance at p < 0.05, p < 0.01, and p < 0.001, respectively.
-
Biochar application has been recognized as an effective strategy for resource utilization and soil amelioration. Biochar possesses a well-developed porous structure, a large specific surface area, and abundant oxygen-containing functional groups. Due to these properties, it can significantly improve soil physicochemical properties, and enhance the soil microbiological environment. Furthermore, it serves as an effective buffer for soil acidity and alkalinity[30,31]. In this study, the application of biochar generally increased soil pH during the 45-d incubation, which aligns with previous findings[32−34]. Notably, coconut shell biochar consistently and significantly elevated soil pH, with increases ranging from 0.08 to 0.29 units, compared to CK. In contrast, the effect of corn stover biochar was less consistent; for instance, the 1.0% application (YM2) did not significantly alter pH at day 30. Corn stover biochar induced a transient increase in pH, which was followed by a decrease. The overall increase in soil pH following biochar application is primarily attributable to its inherent alkalinity, and the presence of basic cations (e.g., Ca2+, Mg2+, K+), which help neutralize H+ and reduce exchangeable Al3+, thereby mitigating soil acidification[35,36]. The differential effectiveness among biochar types is influenced by their physicochemical properties, which depend on the feedstock and production conditions. Coconut shell biochar, typically produced at higher pyrolysis temperatures, generally possesses a higher pH, larger specific surface area, and more developed microporosity than biochars derived from agricultural wastes like reed or corn stover[37,38]. This microporous structure may retard the release of alkaline components, potentially contributing to a more sustained pH effect. The transient acidification observed after corn stover biochar application may be due to the accumulation of acidic metabolites from enhanced microbial activity, which could eventually surpass the buffering capacity of the biochar. However, the precise mechanisms driving this dynamic require further experimental investigation in long-term field trials.
Effects of biochar on soil enzyme activity and chemical properties in tea plantation soil
-
Soil enzymes are widely recognized as critical indicators of soil quality, playing essential roles in catalyzing decomposition, nutrient cycling, and sustaining microbial function in agroecosystems[39,40]. Consistent with the findings of Chen et al.[41], who reported that biochar enhances biochemical reactions and increases enzyme activities, the present study demonstrated that biochar application generally promoted urease (UE) and catalase (CAT) activities. This stimulation may be attributed to the supplemental organic matter and nitrogen provided by biochar (Table 1), which can support microbial growth and enzyme production. Specifically, a 0.5% biochar application rate enhanced CAT activity, while both 0.5% and 1.0% rates augmented UE activity. Notably, the 1.0% corn stover biochar (YM2) treatment induced a transient 3.94-fold increase in CAT activity at day 15, which subsequently declined by day 45 (Fig. 2a). This pattern mirrored the initial rise and subsequent fall in soil pH following YM application (Fig. 1), consistent with the known positive correlation between pH and CAT activity[42]. Similarly, for UE activity, the advantage of the 1.0% coconut shell biochar (YK2) over YK1 observed at day 30 had reversed by day 45, likely due to the lower pH and available nitrogen content at that stage[43]. The decline in enzyme activities under higher biochar application rates may be linked to an elevated soil C/N ratio, which can stimulate microbial nitrogen immobilization[44]. This suggests that while moderate biochar application could enhance enzyme activities, excessive amounts may yield suppressive effects. Some studies have reported that biochar could improve soil nutrition by increasing the uptake of P by wheat[45], and Mg by sugarcane[46]. In tea plantation soil, Yan et al.[32] have reported that biochar application could enhance tea garden soil health by increasing the availability of key nutrients such as phosphorus, potassium, and magnesium, while reducing the content of heavy metals like manganese and copper. In this study, the significant increase in available phosphorus and soil organic matter under YK2 treatment was observed. The increase is consistent with the reported role of biochar in enhancing soil health through improved nutrient availability, indicating its potential for ameliorating tea garden soils. The present findings provide insights into the early-stage responses of soil-related indicators to biochar application in acidic tea gardens under controlled conditions, highlighting the promise of targeted biochar use for soil management. Nevertheless, translating these mechanistic insights into practical outcomes requires essential validation. Long-term field trials are critical to verify the enduring efficacy and overall sustainability of biochar amendments in tea plantation environments.
Effects of biochar on microbial communities in tea plantation soil
-
It has been documented that prolonged tea cultivation tends to intensify soil acidification, and reduce the abundance and diversity of soil microorganisms[47]. In this study, biochar application increased the Shannon index, and enhanced microbial community diversity, likely attributable to elevated levels of soil organic matter, available phosphorus, and pH. These improved soil conditions create a more favorable habitat for microbial growth and reproduction, thereby influencing microbial community structure, function, and associated enzyme activities[48,49]. Previous research has shown that biochar application significantly altered soil microbial community composition, with implications for functional groups involved in nitrification, denitrification, and nitrogen fixation[49]. In this study, compared to CK, the 1.0% coconut shell biochar significantly increased the relative abundances of Actinobacteriota and Gemmatimonadota, while reducing that of Firmicutes. This shift could be explained by the high carbon content of biochar, which supports the growth of Actinobacteriota—a phylum enriched with nitrogen-fixing taxa dependent on small-molecule substrates[50]. The rise in soil pH also favored Gemmatimonadota, a phylum linked to efficient nutrient cycling and stress resilience under neutral conditions[51]. Although available nitrogen was positively correlated with Firmicutes abundance, the 1.0% coconut shell biochar reduced both available nitrogen (by 13.09%) and Firmicutes levels. Moreover, both the YK2 and LW1 treatments significantly reduced the abundance of unclassified Acidobacteriota genera. This result aligns with the findings of Xu et al.[52]. Acidobacteriota, an acidophilic phylum involved in carbon metabolism and iron cycling[53], likely declined in response to elevated soil organic matter and pH, indicating a biochar-driven niche modification that selected for other microbial groups. Furthermore, the 0.5% coconut shell biochar significantly increased the abundance of Clostridium_sensu_stricto_13 (p < 0.05), a genus known for non-symbiotic nitrogen fixation that enhances soil nitrogen availability and supports plant growth[54]. The enrichment of this genus underscores the potential of biochar to enhance microbial functions relevant to soil fertility and tea plant health.
Biochar amendment also significantly influenced the composition of soil fungal communities. Specifically, the LW1 treatment was observed to increase the relative abundance of Mortierellomycota, while the YK1 treatment enriched Ascomycota. The results are concordant with the findings of Zhang et al.[55]. Mortierellomycota are primarily saprophytic fungi capable of solubilizing mineral phosphorus via oxalic acid secretion, thereby increasing soil nutrient availability[56]. Their increase may explain the observed rise in AP, although the lack of a statistically significant correlation warrants further investigation. Jia et al.[57] reported that the abundance of specific Ascomycota fungi (e.g., Saitozyma and Archaeorhizomyces) in tea rhizospheres was positively correlated with soil nutrient content and tea quality. This suggests that biochar may optimize the rhizosphere fungal community and strengthen beneficial tea tree–fungi interactions, potentially improving nutrient availability and tea quality. Moreover, the YK2 treatment significantly increased the abundance of Metarhizium, which showed strongly positive correlations with urease activity, soil organic matter, and total nitrogen. Metarhizium species are entomopathogenic fungi with broad host ranges and high pathogenicity to insects, yet they remain non-toxic to humans and plants[58]. Their enrichment may be closely linked to biochar-mediated improvements in the soil microenvironment. However, the precise mechanisms governing these dynamics remain to be determined and require robust validation in future field trials.
-
The present study demonstrated that biochar application, particularly coconut shell biochar, can effectively improve the physicochemical properties and microbial communities of acidified tea garden soil. During the 45-d incubation period, coconut shell biochar demonstrated the best soil improvement effect, increasing soil pH, and significantly enhancing soil organic matter and available phosphorus content. Appropriate biochar application promoted catalase and urease activities, while excessive application (e.g., 1.0% corn stover biochar) led to a decline in catalase activity in the later stage. Different biochar types also enhanced bacterial community diversity, with 1.0% coconut shell biochar significantly increasing the abundance of beneficial bacterial phyla such as Actinobacteriota and Gemmatimonadota, while reducing acidophilic groups like Acidobacteria. In the fungal community, coconut shell biochar enriched Ascomycota and Metarhizium, the latter showing positive correlations with urease activity and soil nitrogen content. In conclusion, the present controlled incubation study demonstrates the distinct potential of 0.5 and 1.0% coconut shell biochar to ameliorate acidity and modulate key microbial communities in tea plantation soils. This study provides certain theoretical references for the rational utilization of biochar in tea gardens and the maintenance of soil health in tea gardens in the future. However, future research is needed to investigate long-term field trials integrated with economic assessments to confirm the efficacy and cost-effectiveness of biochar for the tea plantation management.
-
The authors confirm their contributions to the paper as follows: conceptualization: Tang D, Li M; investigation: Li M, Pan L; data curation, visualization, and writing − original draft preparation: Xue J, Li M; data acquisition, analysis, and validation: Li M, Chen W, Zhang C; writing − review and editing: Xue J, Tang D; supervision: Chen W, Tan L; project administration and funding acquisition: Tang D, Tang Q, Tan L. All authors have reviewed the results and approved the final version of the manuscript.
-
All data generated or analyzed during this study are included in this published article. The data generated and/or analyzed during this study are available from the corresponding author upon reasonable request.
-
This research was funded by the National Natural Science Foundation of China (32202538, 32402633), the Department of Science and Technology of Sichuan Province (2024YFHZ0179, 2024NSFSC0402), and the Sichuan Innovation Team of National Modern Agricultural Industry System (sccxtd-2024-10).
-
The authors declare that they have no conflict of interest.
-
# Authors contributed equally: Jing Xue, Mao Li
- Supplementary Table S1 Basic physical and chemical properties of three biochar types.
- Supplementary Table S2 The treatments adopted in the experiment.
- Supplementary Fig. S1 Multivariate ordination analysis of bacterial and fungal community structures in tea plantation soils.
- Supplementary Fig. S2 Histogram of FUNGuild functional guild prediction for fungal communities.
- Supplementary Fig. S3 Prediction of bacterial KEGG secondary pathway function.
- Copyright: © 2026 by the author(s). Published by Maximum Academic Press, Fayetteville, GA. This article is an open access article distributed under Creative Commons Attribution License (CC BY 4.0), visit https://creativecommons.org/licenses/by/4.0/.
-
About this article
Cite this article
Xue J, Li M, Chen W, Pan L, Zhang C, et al. 2026. Effects of different plant-derived biochars on physicochemical properties and microbial communities in tea plantation soil. Beverage Plant Research 5: e015 doi: 10.48130/bpr-0025-0046 

Effects of different plant-derived biochars on physicochemical properties and microbial communities in tea plantation soil
- Received: 14 November 2025
- Revised: 17 December 2025
- Accepted: 22 December 2025
- Published online: 23 April 2026
Abstract: Long-term over-fertilization has caused increased soil acidification and nutrient loss in tea plantations. The benefits of biochar in alleviating soil acidification have been established, yet little is known specifically about the performance of different plant-derived biochar types in tea plantation soils. An incubation experiment was conducted to investigate the effects of three biochar types (corn stover, reed, and coconut shell), and three application levels (0%, 0.5%, and 1.0%) on soil pH, nutrient content, and microbial community in tea plantation soils. The findings demonstrated that the application of coconut shell biochar resulted in a significant increase in soil pH and an enhancement of catalase and urease activities, particularly at higher application rates. Furthermore, the application of biochar enhanced the soil organic matter and available phosphorus content, with coconut shell biochar showing the most pronounced effects. Microbial community analysis revealed that biochars increased bacterial diversity and altered the composition of the fungal community. The application of biochars reduced the relative abundance of the unclassified genus within the Acidobacteria phylum, and 1.0% coconut shell biochar significantly increased the abundance of the bacterial phyla Actinobacteriota and Gemmatimonadota. These findings suggest that biochar, especially coconut shell-derived biochar, could effectively ameliorate soil acidity, enhance nutrient availability, and improve microbial diversity in tea plantations. The study provides a theoretical basis for the informed application of biochars in tea plantations in the future.
-
Key words:
- Biochar /
- Tea plantation /
- Soil pH /
- Soil nutrient /
- Microbial community