


-
Agriculture, the main economic activity in many developing nations, is predicted to be required to feed the estimated nine billion one hundred million people by 2050[1]. Considering the environmental concerns, soil preservation, and the increasing water shortage, especially in dry and semi-dry areas like Iran, it's essential to use water and fertilizer wisely to reduce harm and increase profit[2]. Maize, a member of the grass family, is a major cereal crop grown in both tropical and temperate areas around the globe[3]. The total area planted with grain maize in Iran is approximately 159,106 ha, while the area planted with fodder maize is around 385,881 ha. The average yield for grain maize is about 7,139 kg·ha−1. In Kerman province, the area cultivated for grain maize is 35,846 ha, of which 23,865 ha are in the southern part and 11,981 ha are in the province itself. The province also has about 14,254 ha of fodder maize cultivation area, with 9,223 ha in the south and 5,031 ha in Kerman province. The average maize yield in Kerman province is 7,283 kg·ha−1. Overall, Kerman province ranks third in maize production in Iran, following Khuzestan and Fars provinces[4]. Irrigation can be categorized based on the plant type, soil, and weather conditions. There are two main types: full irrigation and deficit irrigation. Full irrigation has been shown to increase maize yield, leading to both higher production and more consistent yields[5]. The amount of water needed by maize plants changes throughout their growth. To avoid water stress during important growth phases, it is suggested to use extra irrigation and plant early. These methods can improve both production and the efficient use of water[6]. Additionally, a study in northeast China examined how irrigation and planting timing affected maize yield. The results showed that irrigating between late June and early July increased grain yield by 35% compared to relying solely on rainfall and planting later[7].
There are several ways to investigate different farming practices. Field experiments are useful for studying how various factors affect plant growth. However, these experiments can take a long time and be expensive. Moreover, field experiments have limitations, such as being only relevant to specific locations, being relatively short, and being unable to examine many different treatments and situations. Crop simulation models are highly valuable and impactful in this field, offering numerous practical applications. They play a crucial role, particularly in situations where resource constraints pose challenges to agricultural research[1]. These models are the only method to combine research findings from studies conducted in different locations[8]. The Agricultural Production Systems Simulator (APSIM) is a process-oriented simulation model for agricultural plants and systems[9]. It effectively simulates the economic output of various crops, pastures, and trees by considering factors such as climate, soil conditions, and management practices. Additionally, APSIM can simulate different rotation systems[10]. The APSIM model, which was developed by Australian researchers, is highly effective in simulating crop growth and yield. It specifically focuses on the daily growth and development of maize, taking into account various influential factors such as weather conditions (temperature, rainfall, and radiation), soil properties (soil water and soil nitrogen), genetic parameters, and crop management inputs[11]. MacCarthy et al.[9] examined the impact of plant residue management on sorghum yield over 30 years using the APSIM model. Their findings indicated that as soil organic matter decreases, sorghum grain yield gradually declines. The APSIM model effectively simulated the influence of both organic and chemical fertilizers on plant growth in their experiment. Additionally, the results demonstrated that returning plant residues back to the soil could potentially reduce the required amount of nitrogen fertilizer by 50%. In a study conducted in Ghana, the APSIM model was utilized to predict the response of sorghum's total dry matter to nitrogen and phosphorus fertilizers under two distinct management systems. The model successfully evaluated the total dry matter with a coefficient of determination R2 = 0.86[12]. Similarly, researchers in Kenya employed the APSIM model to evaluate maize and bean production in various phosphorus and chemical fertilizers treatments. The comparison between the observed and simulated values showed R2 = 0.79 and 0.69 for grain yield and total dry matter produced by common bean, respectively. For maize, the corresponding values were 0.82 and 0.74[13]. The purpose of this study was to evaluate the APSIM model's ability to accurately simulate the growth and yield of grain maize in Kerman province, considering the importance of grain maize production and the need to improve crop efficiency given Iran's limited resources. By utilizing a modeling approach, the study aimed to assess management scenarios like planting windows and irrigation management for maize production.
-
This study was conducted in three different regions: Bardsir, which has a temperate to cold climate; Jiroft and Orzueeyeh, both of which have hot and dry climates. The purpose of this research was to simulate crop management, specifically focusing on planting windows and irrigation, to evaluate their impact on grain yield. The ultimate goal was to identify the optimal management scenario using a simulation-based approach. Details regarding the climate and soil characteristics of the study areas can be found in Tables 1 & 2.
Table 1. Climatic and geomorphological attributes of the regions.
Region Longitude Latitude Elevation (m) Mean annual temperature (°C) Mean cumulative precipitation (mm) Bardsir 56.57 29.93 2044 14.5 165 Orzueeyeh 56.36 28.45 1053 23.3 122.3 Jiroft 57.73 28.67 720 25.1 176.2 Table 2. Pedological attributes of the regions.
Attributes Region Bardsir Orzueeyeh Jiroft Soil type Loam sand Loam Loam sand Available soil water (mm) 126 113 115 Bulk density (g·cm−3) 1.4 1.62 1.52 pH 7.9 7.9 8 Electrical conductivity (dS·m−1) 2 1.9 1.2 Organic matter (%) 0.2 0.2 0.2 Nitrate (mg·L−1) 8.2 79.4 73.1 Ammonium (mg·L−1) 2.13 2.26 2.76 Phosphorous (ppm) 4 4 10 Potassium (ppm) 120 180 200 APSIM model and inputs
-
The APSIM model was employed in this study to simulate grain yield. This model consists of 11 growth stages and 10 phases, representing the time intervals between these stages. The initiation of each phase is determined by cumulative temperature time, except the period from planting to germination, which varies based on soil moisture. The duration of the phase between emergence and the onset of flowering remains constant for each cultivar, often referred to as the vegetative or juvenile phase. However, the rate of development during the transition from the juvenile phase to flowering is influenced by day length, particularly if the cultivar is sensitive to photoperiod[14,15].
The model incorporates separate modules to simulate soil, water, and nitrogen relationships. In the water sub-model, the daily water demand of the plant (transpiration demand) is simulated using the method provided by Sinclair[12] and Monteith[16]. According to this method, the plant's water demand is determined by its daily growth rate, vapor pressure deficiency, and transpiration efficiency coefficient. Additionally, the APSIM model's nitrogen simulation encompasses various processes such as nitrogen absorption, transport, accumulation in plants, nitrogen leaching, nitrification, denitrification, and other nitrogen-related processes in the soil. These processes are simulated daily for each soil layer. Similar to water absorption, the estimation of nitrogen absorption by plants is based on supply and demand.
To simulate, the required data are plant, management, soil, and climate data. The weather data for the model spans from 2000 to 2019 and includes temperature, sunny hours, and rainfall. This data was collected from the synoptic weather stations in three regions: Bardsir, Jiroft, and Orzueeyeh. However, since daily radiation intensity is not regularly recorded at these synoptic stations, the length of sunny hours was used as an estimate for this variable. To calculate radiation, sunshine hours, and Angstrom's linear relationship[17] were employed.
$ {R}_{s}=\left(a+b\dfrac{n}{N}\right){R}_{a} $ (1) Where, Rs represents the daily radiation (MJ·m−2). The variable n denotes the number of hours with sunny weather, while N represents the day length. Additionally, Ra refers to the extraterrestrial radiation. It is important to note that the variables a and b correspond to the locally calibrated Angstrom coefficients specific to different regions within Kerman province[18]. The soil data were collected from various sources, including agricultural research stations, the water and soil department, and soil science laboratories. These data encompassed several physical and chemical characteristics of the experimental field soil. Some of these characteristics include the percentage of clay, silt, and sand in the soil texture, available soil water, bulk density, pH level, cation exchange capacity (CEC), organic carbon content, electrical conductivity (EC), nitrate (mg·L−1), ammonium (mg·L−1), phosphorous (ppm), and potassium (ppm). These collected data were utilized to determine the soil coefficients of the model, such as field capacity and permanent wilting point. Additionally, they were used to estimate the available soil water (mm) (Table 2). The SPAW model, developed by Saxton & Willey[19] was employed to estimate these soil parameters.
The management data for the study regions included various parameters. These parameters encompassed the planting window, plant density (7 plants m−2), number of irrigations, amount of nitrogen fertilizer, planting row distance (75 cm), type of plowing (common plowing), and seed planting depth (5 cm). To gather this information, a questionnaire was designed and field research was conducted by experts in the studied locations. To obtain the best sowing window and irrigation management, various treatments were evaluated. The planting windows were the common planting date in the study regions, an early planting window that was 20 d before the common planting window, and a late planting window that was 20 d after the common window. The primary purpose of the late planting date was to evaluate the impact of heat stress on yield. For the irrigation treatments, the common irrigation in each area (13 times), deficit irrigation (11 times), and over-irrigation (15 times) were evaluated. Table 3 shows detailed information on the planting windows, irrigation, and nitrogen fertilizer used in each region.
Table 3. Common sowing window, number of irrigations, and the quantity of nitrogen fertilizer.
Location Sowing window Number of
irrigationsNitrogen fertilizer
(kg N ha−1)Bardsir 21-Apr 16 276 Orzueeyeh 01-Jul 16 260 Jiroft 21-Jul 16 253 Model calibration
-
The calibration of the model was carried out using an experiment conducted in 2020. The field experiment took place at the Research and Education Center for Agriculture and Natural Resources (30.17° N, 57.04° E) in Kerman province (Iran). The experiment was based on a randomized complete block design with four replications. The SC 704 maize hybrid was evaluated under four nitrogen levels (0, 92, and 368 kg·ha−1). Each plot comprised seven rows, six meters in length, spaced 75 cm apart. The plant density was 7 plants m−2. In the context of model calibration through a systematic trial and error approach, the objective was to minimize the discrepancy between the observed and projected values. Key parameters that significantly affected dry matter accumulation and the duration from sowing to flowering and maturation were adjusted. This iterative process continued until the model's simulated values were closely aligned with the observed data across all experimental treatments. The genetic coefficients for the SC 704 cultivar are presented in Table 4.
Table 4. Parameters determined by adjusting the model calibration for SC704 cultivar.
Parameter Value Unit Maximum number of seeds per head 850 − Thermal time from emergence to juvenile stage 270 °Cd Seed growth rate 8 mg kernel–1 d–1 Thermal time from juvenile phase to floral stage 20 °Cd Critical photoperiod 1 12.5 h Critical photoperiod 2 20 h Model validation
-
To enhance the model evaluation, in addition to the 2021 experiment in Kerman, two other experiments were included, which had similar climatic conditions to the experimental area[14,15].
The 2nd experiment[14] was used to validate the crop in Kerman county (30.17° N, 57.04° E) in Iran. The experiment was a factorial arrangement based on a randomized complete block design (RCBD) with three replications. Four nitrogen rates (0 (control), 92, 220, and 368 kg·ha–1) and two maize hybrids (KSC 704 and Maxima) were included in the study. The mean temperature and cumulative rainfall were 23 °C during the maize growing season. The sowing date was 2 May. Each plot consisted of seven rows of six meters in length and with a spacing of 75 cm. Plant density was 7 plants m–2. The soil texture was loam clay. Cultivars were harvested at their physiological maturity stages.
The 3rd experiment was also considered to validate the crop model under different irrigation levels. The field experiment was laid out as a split plot-factorial arrangement based on RCBD with three replications in the research field of Shahid Chamran University of Ahvaz, Iran (31.18° N, 48.40° E) during the 2009−2010 growing season. Irrigation was assigned to main plots in three levels 100%, 80%, and 60% of field capacity. Nitrogen fertilizer at three levels 0, 100, and 150 kg N ha–1 and KSC 704 and Maxima was considered as factorial in subplots. The soil texture was clay. The sowing date was 12 May. Each plot included seven rows of six meters in length with a spacing of 75 cm. Plant density was 7 plants m–2.
Different indices were employed to assess model accuracy. R2, nRMSE[16], and CRM were used[17]. The coefficient of residual mass (CRM) was used to check whether model predictions provided overestimation or underestimation. A negative CRM shows a tendency to overestimate[16]. The nRMSE represents the model's simulation error by giving too much weight to high errors. The model precision is higher when nRMSE approaches zero[17]. R2 ranges between 0 and 1 and the R2 to 1, the more accurate the model.
$ nRMSE=\sqrt{\dfrac{\sum _{i=1}^{n}{\left({P}_{i}-{O}_{i}\right)}^{2}}{n}}\times \dfrac{100}{\overline{O}} $ (2) $ CRM=1-\dfrac{\sum _{i=1}^{n}Pi}{\sum _{i=1}^{n}Oi} $ (3) where, Oi and Pi are measured and simulated values, respectively, and O equals the average measured value.
-
The APSIM model was not able to accurately represent how different amounts of nitrogen fertilizer affected the timing of maize development (Table 5). Changing the amount of nitrogen fertilizer did not impact the model's predictions for how long it took for the maize plants to start flowering and to mature. Moreover, the output of the model under all nitrogen fertilizer (0, 92, and 368 kg·ha–1) was the same for each year (69 and 66, respectively for flowering in 2020, and 129 and 123 in 2021). However, the field experiment showed a significant effect of nitrogen fertilizer on phenological stages, especially the flowering stage (Table 5). Despite some partial underestimation of the model, especially in the validation stage (2021), the model captured phenology, especially days to maturity, with high accuracy, at different fertilizer levels (0, 92, and 368 kg·ha–1). On average, nRMSE for simulating days to flowering was 10%, and the nRMSE for simulating days to maturity was 5% (Table 5).
Table 5. Evaluation indices of the APSIM model in simulating days from sowing to flowering and maturity under different nitrogen fertilizer (0, 92, and 368 kg·ha−1) in calibration (2020), and validation (2021) years.
Treatment Calibration (2020) Validation (2021) Observed Simulated Observed Simulated Days from sowing to flowering 0 kg N ha−1 74 69 87 66 92 kg N ha−1 68 69 80 66 368 kg N ha−1 69 69 76 66 nRMSE (%) 2.41 10.17 CRM (−) 0.018 0.185 Days from sowing to maturity 0 kg N ha−1 131 129 135 123 92 kg N ha−1 128 129 134 123 368 kg N ha−1 132 129 136 123 nRMSE (%) 0.95 5.14 CRM (−) 0.01 0.08 Gungula et al.[18] using the CERES model evaluated the effect of nitrogen management on the phenology of seven late maize hybrids in Nigeria. Their results showed nitrogen level and days to physiological maturity (R2 = 0.7) in most hybrids. The model predicted silking windows well under high nitrogen levels (90 and 120 kg·ha–1), with a difference of less than two days. Similarly, days to maturity were also simulated accurately for most hybrids under high nitrogen levels, with a difference of less than two days. However, under low nitrogen levels, there were larger differences between the observed and simulated data. They concluded that the CERES-maize model is reliable for predicting maize phenology only under non-limiting nitrogen conditions. To improve the accuracy of phenology prediction in nitrogen-limited soils, they suggested incorporating a nitrogen stress factor into the model. Soler et al.[19] also reported the successful use of the CERES-maize model to simulate the phenology of four grain maize hybrids with different maturity groups in a semi-tropical region in Brazil under irrigated and rainfed cropping systems.
The simulation of total dry matter for hybrid SC 704 was carried out with high accuracy. The nRMSE for simulating the total dry matter of hybrid SC 704 was 13.8% in the calibration stage and 12.7% in the validation stage (Table 6). There was underestimation (CRM = 0.19) in the prediction of total dry matter in the calibration stage, and overestimation (CRM = 0.18) was observed in the validation stage. The R2 the total dry matter for the calibration and validation stages was 0.98 and 0.89, respectively (Fig. 1a & b).
Table 6. Evaluation parameters of model in simulating total dry matter and grain yield of maize SC704 hybrid under the different quantity of nitrogen (0, 92, and 368 kg·ha−1) for calibration (2020), and validation (2021) years.
Total Calibration (2020) Validation (2021) nRMSE (%) CRM (−) nRMSE (%) CRM (−) Dry matter 13.77 0.19 12.75 −0.18 Grain yield 11.23 0.12 13.21 −0.15 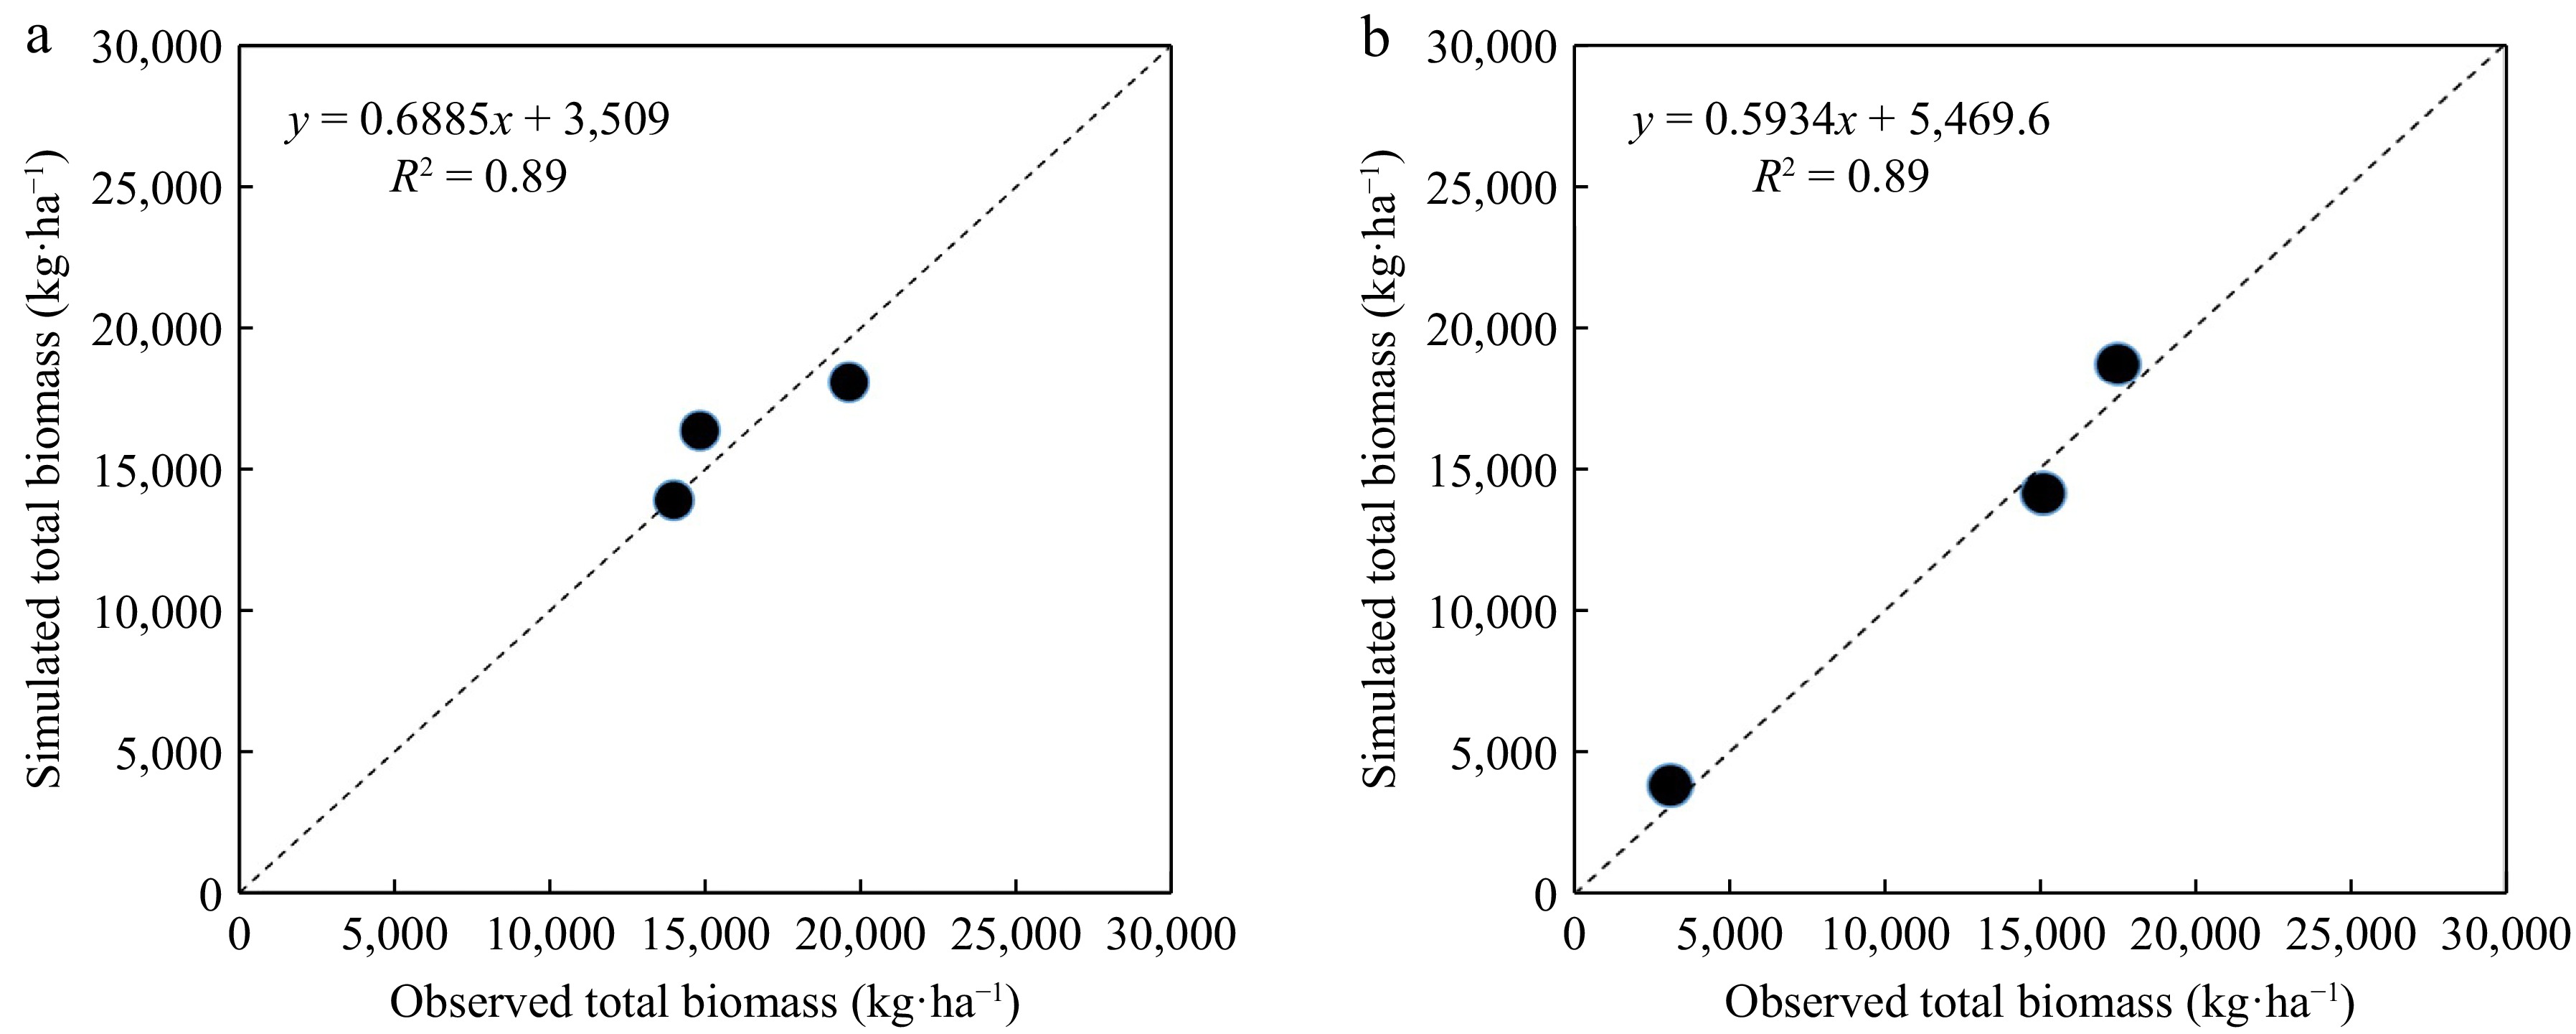
Figure 1.
Comparison of the empirically observed and model-simulated dry matter employing the APSIM framework for the SC704 hybrid cultivar, subjected to varying nitrogen levels (0, 92, and 368 kg·ha−1), was conducted in the years 2020 (a) calibration and 2021 (b) validation.
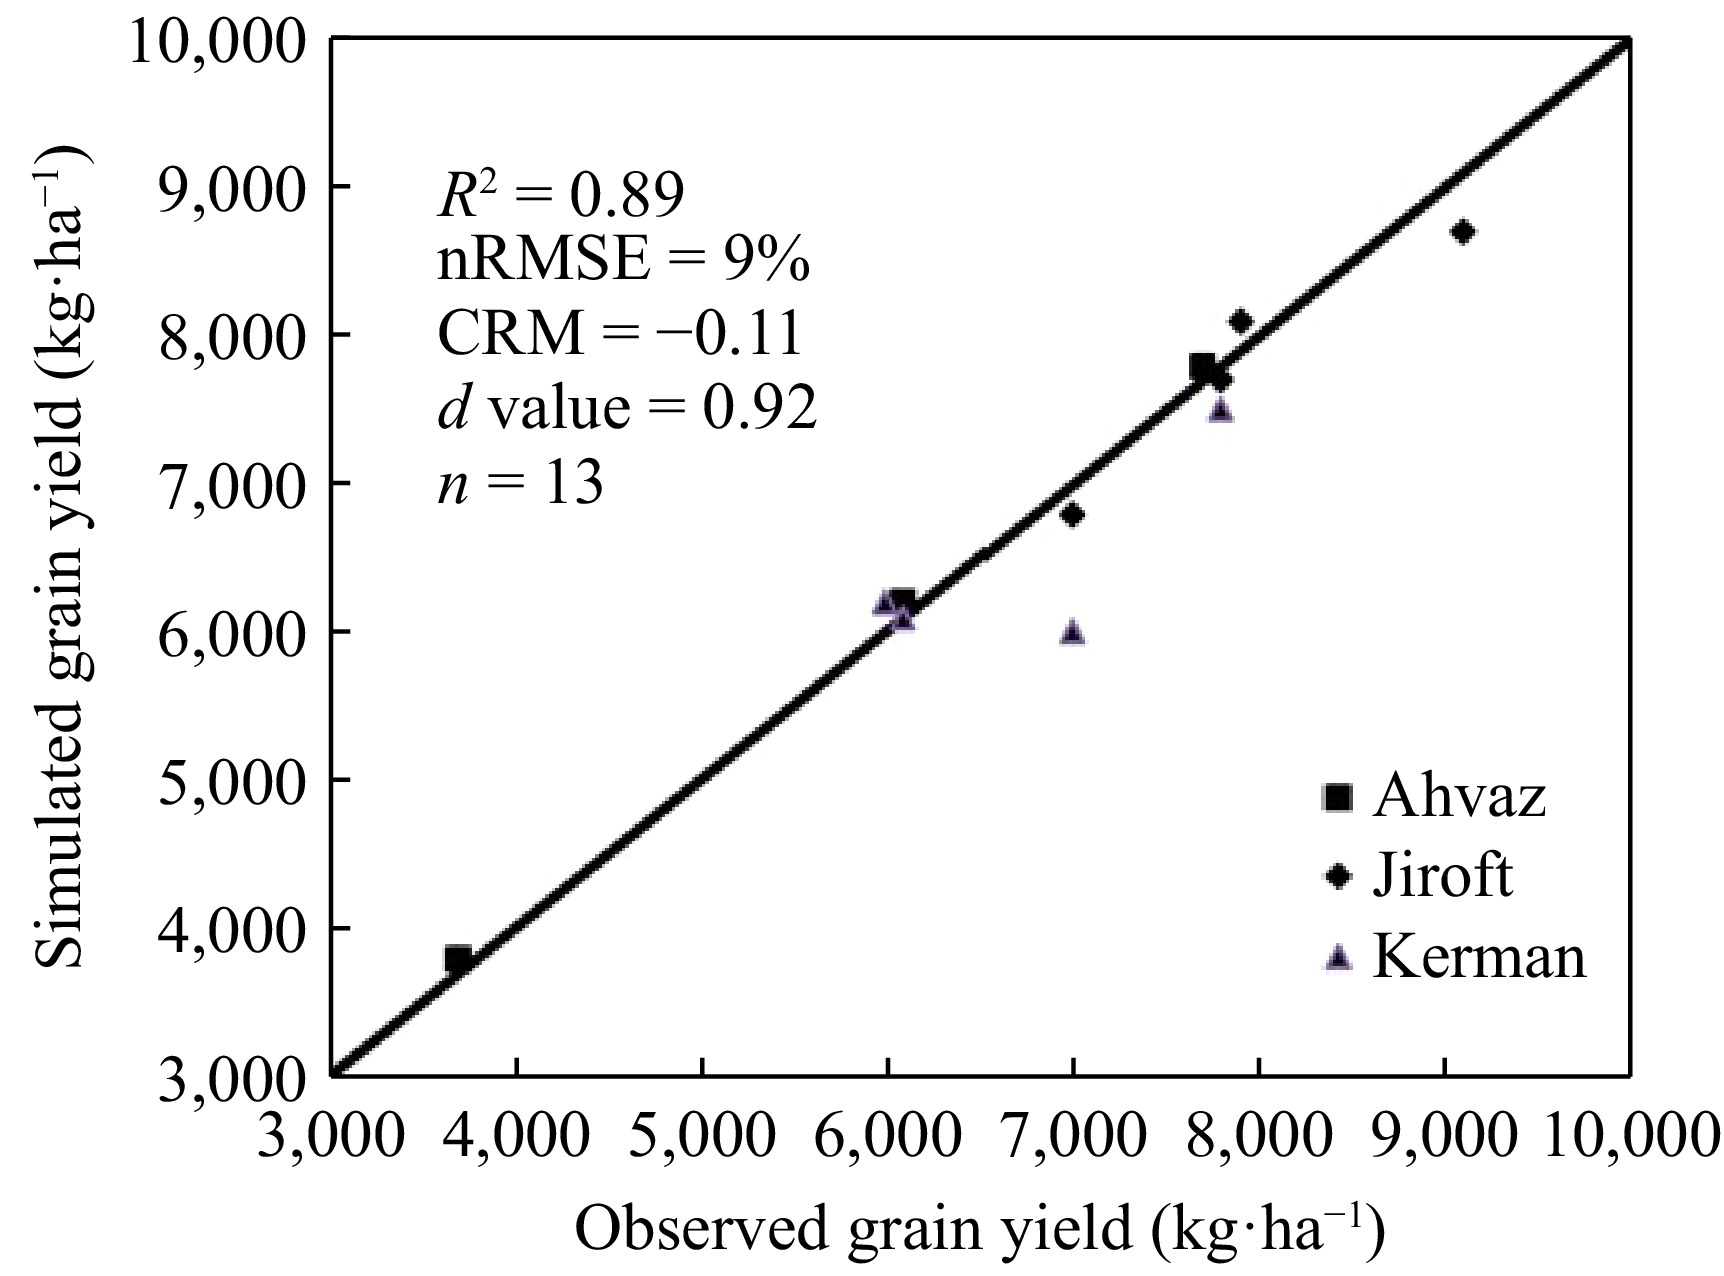
The APSIM model simulated yield under different nitrogen treatments with high accuracy in both the calibration and validation stages (Figs 2 & 3). The nRMSE of yield was 11.23% and 13.21% in the calibration and validation stages, respectively (Table 6). Furthermore, the model predicted yield with R2 values of 0.96 and 0.89 in the calibration and validation stages, respectively (Figs 2 & 3). Kpongor[10] stated that the model could predict sorghum production in various nitrogen and phosphorus fertilizers under two different management systems in Ghana (R2 = 0.81).
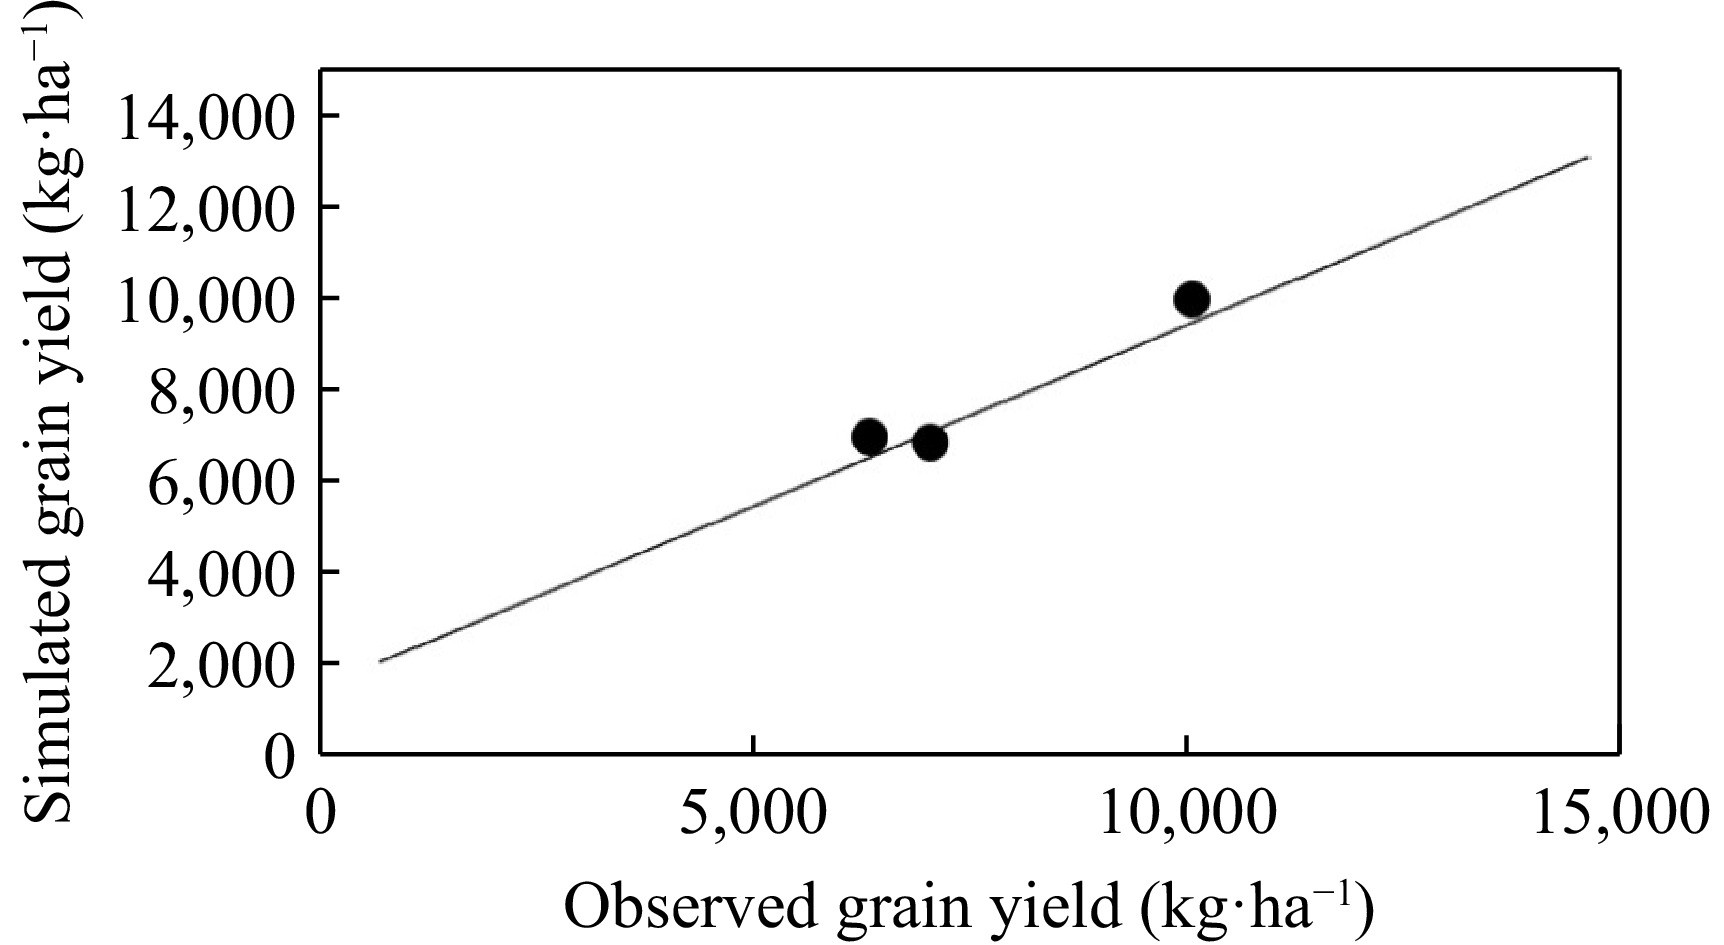
Figure 2.
A comparative analysis of the actual and predicted grain yield utilizing the APSIM model for the SC704 hybrid was conducted under varying nitrogen applications (0, 92, and 368 kg·ha−1) during the year 2020, designated as the calibration year.
Optimization of maize production: simulation experiments
-
The average simulated yield was 6,678 kg·ha−1 (Fig. 4). Across planting windows and irrigation treatments, the maximum and minimum grain yields were observed in Bardsir and Jiroft, respectively, with 8,317 and 4,735 kg·ha−1 (Fig. 4). The results approved that there is high potential to increase maize production in the studied regions. For example, in Bardsir, maize had a longer growth period (145.6 d) and a lower average temperature during the growth period (21.8 °C) (Table 7), which resulted in a higher yield in this region compared to other regions. Generally, with the reduction in growth period, especially the duration of the vegetative growth, maize grain yield decreased.
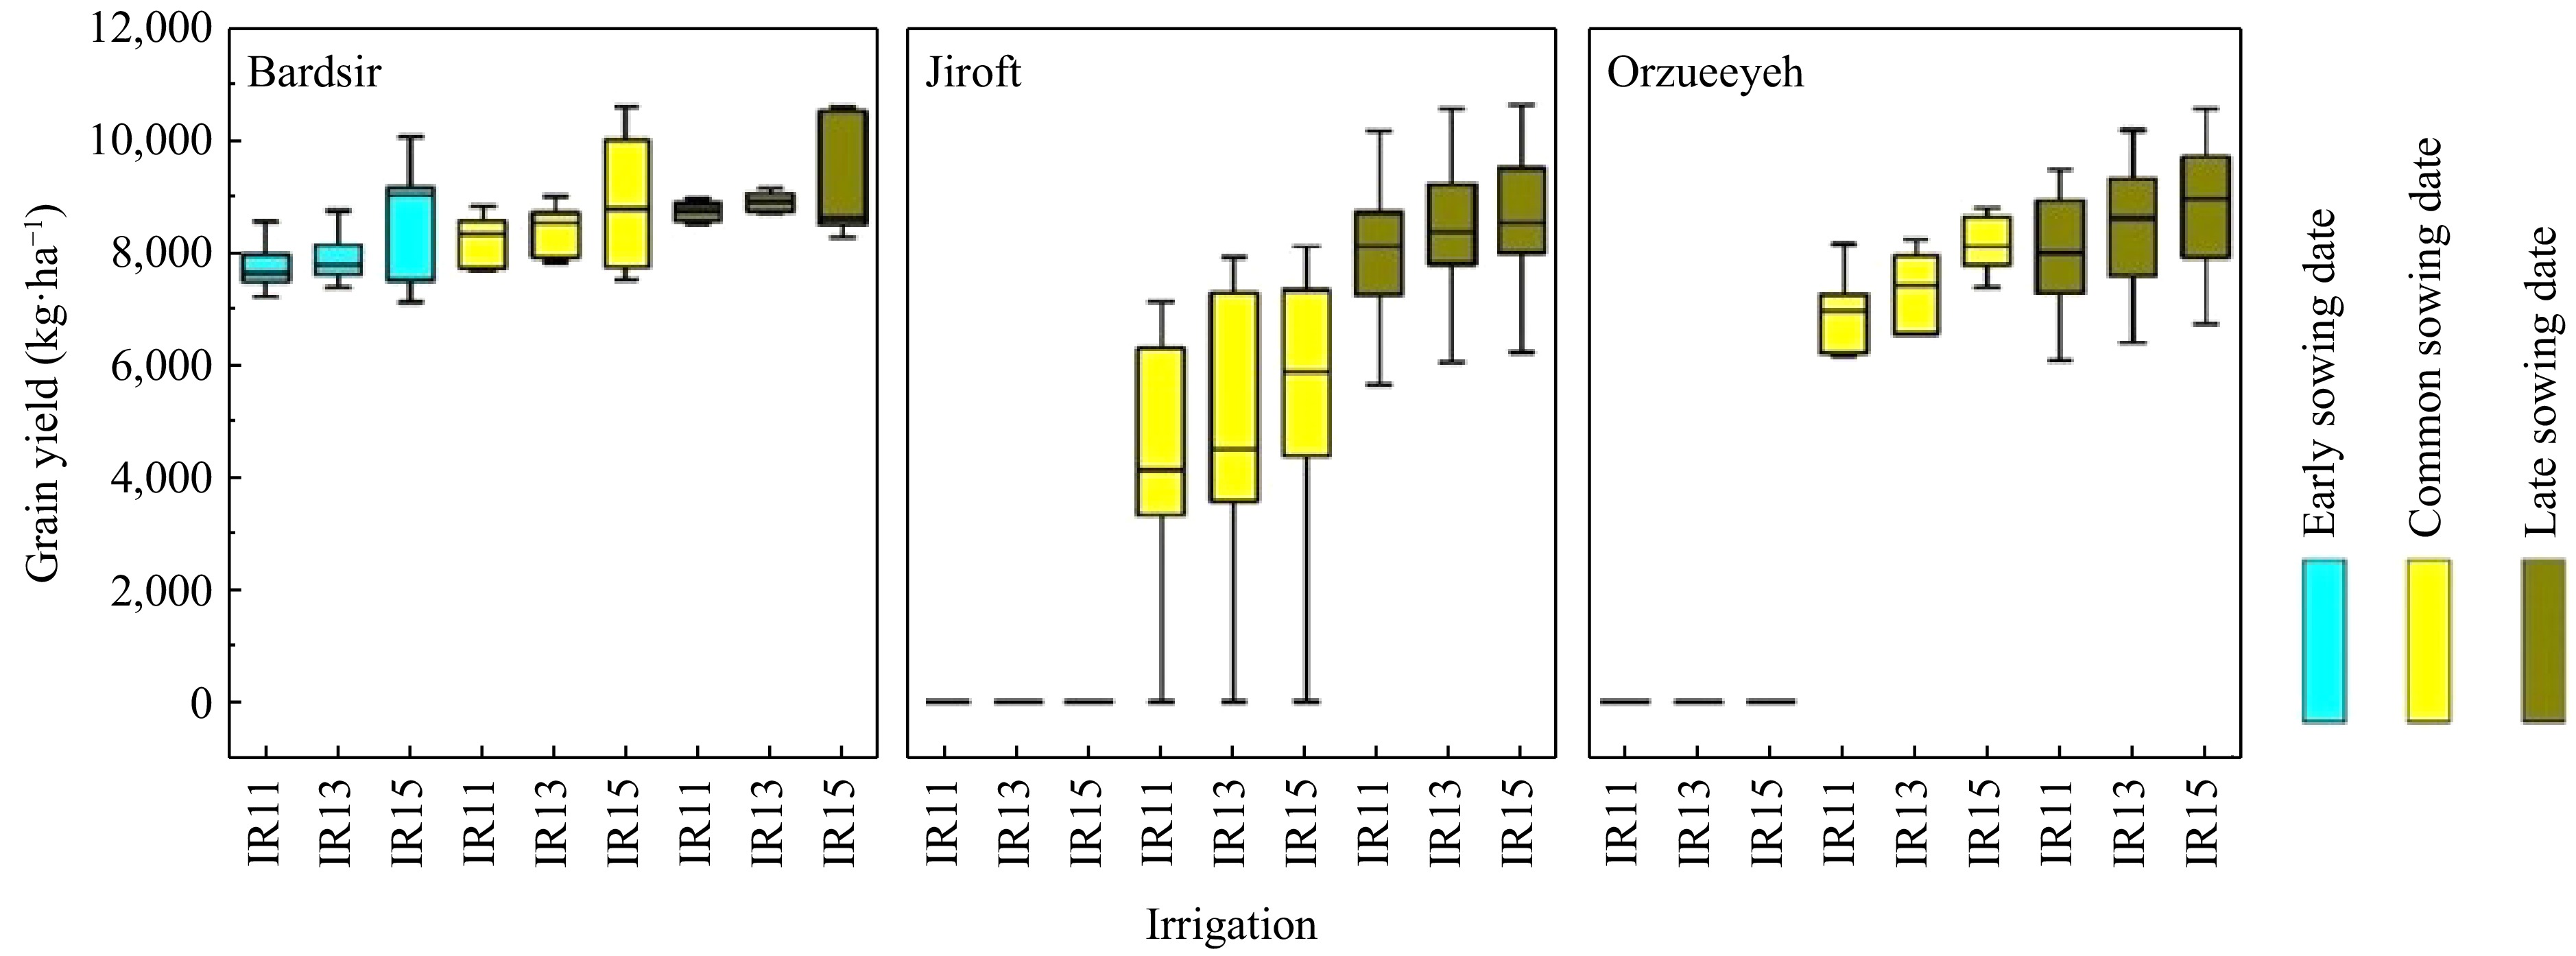
Figure 4.
Grain productivity in relation to various irrigation regimens (IR11: 11 irrigation instances; IR13: 13 irrigation instances; IR15: 15 irrigation instances), planting periods (early, common, and late), as well as the geographical sites examined (Bardsir, Jiroft, and Orzueeyeh). The dimensions of the box plots illustrate the variations in the projected grain yield across different years (2000−2019).
Table 7. Average temperature for growing season, days to maturity, and average maximum temperature for flowering period under different planting windows (common, early, and late) and regions (2000−2019).
Region Planting window Average temperature during the growing season (°C) Days to maturity Average maximum temperature for flowering period (°C) Bardsir Common 22.3 142 34.5 Early 22.5 154 33.9 Late 20.7 141 33.9 Orzueeyeh Common 28.7 133 38.9 Early 32.6 129 42.3 Late 22.5 154 34.4 Jiroft Common 28.2 130 38.7 Early 31.8 124 41.3 Late 21.4 154 33.9 Across different planting windows, the late planting window outperformed the common and early planting windows in all regions and irrigation treatments. The yield of the late planting window was 8,529 kg·ha−1, which was 26% higher than the common planting window and 200% higher than the early planting window, respectively (Fig. 4). The late planting window causes flowering at lower temperatures, which reduces the mean maximum temperature during the flowering phase of maize up to 8% and 13% compared to the common and early planting windows, respectively (Table 7). Many studies have shown that maize is sensitive to very high temperatures, and increasing the temperature can greatly reduce its yield[13]. This yield reduction can be caused by increased respiration, reduced photosynthesis, a shortened crop growth period, and especially reduced pollen grain fertility and sterility.
In maize, the maximum temperature above 36 °C causes pollen grains to become sterile, preventing seed formation. This effect can be seen in Fig. 4 and in the early planting windows in the Jiroft and Orzueeyeh regions, where the maximum high temperatures caused no seed formation in maize (Fig. 4 & Table 7). Overall, increasing temperature led to a reduction in the number of maize pollen grains by reducing their fertility. Therefore, the increase in temperature had the greatest effect on the flowering stage of maize and ultimately caused a decrease in the number of seeds and maize yield by reducing the percentage and period of flower fertilization.
Across the regions and planting window treatments, the highest grain yields were obtained with 6,317, 5,919, and 5,671 kg·ha−1 in treatments of 15, 13, and 11 times of irrigation, respectively (Fig. 4). Among the different interactions in Kerman province, the late planting window with 15 times irrigation had the highest yield, at 8,872 kg·ha−1. Furthermore, considering the region, the greatest yield was recorded in the Bardsir region on the late planting window with 15 times irrigation, at 9,300 kg·ha−1 (Fig. 4). Grain yield depends on the average temperature during the maize growing season. In hot regions, high temperatures can negatively affect yield by shortening the growing season. In cool regions, an increase in temperature can improve the temperature conditions for crop growth[7]. The average temperature during the growing season in Bardsir and on the late planting window was lower than in other regions and on other planting windows (Table 7), which led to higher grain yield. A shorter growing season can shorten the grain filling period and decrease yield[6]. Conversely, a decrease in temperature can increase the growing season period and provide better conditions for crop growth. On average throughout Kerman, the 15 times irrigation treatment and late planting had the highest effect on production (8,872.8 kg·ha−1). Increasing the frequency of irrigation (15 times during the growing season) reduces water stress on the crop and increases grain yield compared to irrigating 11 or 13 times. This level of irrigation, along with late planting, can create optimal conditions for better performance.
-
The present findings showed that the APSIM model was fairly accurate in predicting maize growth and yield in Kerman province. However, the model's main drawback was its inability to accurately reflect how nitrogen deficiency affects plant development. This makes it a valuable tool for estimating crop yields before conducting field experiments, which can save research costs. The present findings suggest that the usual planting times chosen by farmers can reduce their yields. Additionally, many farmers plant maize during a period when extreme temperatures are more likely. To increase their yields, farmers should plant 20 d later than usual and irrigate their crops 15 times during the growing season. To improve maize production, it's recommended to use computer simulations to assess how different types of maize respond to changes in various farming practices like planting density, planting time, watering, and nitrogen fertilizer. These simulations can help farmers make better decisions about how to manage their crops.
-
This research followed all necessary rules and regulations for studying potentially endangered plants. Tehran University reviewed and approved the experiments to make sure they complied with international guidelines on protecting endangered species.
-
The authors confirm contribution to the paper as follows: methodology, evaluation, writing – original draft preparation: Amiri S; writing – review & editing: Zakeri N, Yousefi T. All authors reviewed the results and approved the final version of the manuscript.
-
The datasets generated during and/or analyzed during the current study are available from the corresponding author on reasonable request.
-
The authors thank the ANRCC of Kerman.
-
The authors declare that they have no conflict of interest.
- Copyright: © 2024 by the author(s). Published by Maximum Academic Press, Fayetteville, GA. This article is an open access article distributed under Creative Commons Attribution License (CC BY 4.0), visit https://creativecommons.org/licenses/by/4.0/.
-
About this article
Cite this article
Amiri S, Zakeri N, Yousefi T. 2024. Optimizing crop management to boost maize production using modeling approach. Circular Agricultural Systems 4: e017 doi: 10.48130/cas-0024-0017 

Optimizing crop management to boost maize production using modeling approach
- Received: 29 August 2024
- Revised: 17 November 2024
- Accepted: 09 December 2024
- Published online: 30 December 2024
Abstract: Creating models can help improve agricultural production by finding the best ways to use resources. This research assessed maize production in three areas (Bardsir, Jiroft, and Erzuye) within Kerman province in the southeast of Iran with an arid and semi-arid climate by conducting long-term simulation experiments (2000−2019) for three sowing windows (early, common, and late) and three irrigation treatments (11, 13, and 15 times) using the APSIM model. The APSIM model was adjusted and tested to simulate the biological, grain yield, and phenological characteristics of the SC 704 maize hybrid under various nitrogen amounts (0, 92, and 368 kg·ha−1) for 2020 and 2021. The model's accuracy in predicting grain yield was 11.23% during calibration and 13.21% during validation. For total dry matter, the model's accuracy was 14.8% during calibration and 13.9% during validation. Additionally, the model accurately predicted the timing of plant development, particularly the number of days until maturity. The model's accuracy in simulating days to flowering and days to maturity was consistently less than 10% and 5%, respectively. The present findings revealed that Bardsir produced the most maize (8,317 kg·ha−1), while Jiroft yielded the least (4,735 kg·ha−1). Among the different planting times, late planting resulted in the highest yield (8,529 kg·ha−1). In terms of irrigation, applying water 15 times produced the most maize (6,317 kg·ha−1), followed by 13 times (5,919 kg·ha−1), and 11 times (5,671 kg·ha−1). In all the regions studied, the best maize production (8,872.8 kg·ha−1) was achieved by planting late and irrigating 15 times. Overall, farmers can increase maize yield by delaying planting by 20 d to avoid high temperatures during the flowering stage and by irrigating their crops 15 times throughout the growing season.
-
Key words:
- Fertilizer /
- Grain yield /
- Sowing window /
- Total dry matter