


-
Natural rubber is an essential industrial raw material that supports a wide range of sectors, including manufacturing, transportation, consumer goods, medical supplies, and public health[1]. Approximately 90% of global natural rubber production is concentrated in Asia, forming a continuous cultivation belt from Indonesia to Xishuangbanna in Yunnan Province, China[2]. Rubber tapping practices are strongly regulated by phenological processes, particularly leaf shedding, and regional rainfall patterns[3]. Across most of the Asian rubber belt, the peak latex production coincides with the rainy season, when tapping is during the periods of active vegetative growth[4]. However, excessive rainfall during the wet season often disrupt tapping operations by impairing latex coagulation and collection, increasing latex loss, and reducing tapping efficiency[3]. Intensive wet-season tapping also increases labor and production costs, accelerates bark consumption, and shortens the economic lifespan of rubber trees[5]. Xishuangbanna features a distinct dry season characterized by high temperatures and limited precipitation, during which rubber trees undergo substantial leaf shedding[6]. In this context, the reuse of wastewater has attracted increasing attention as a potential irrigation resource during the dry season. Wastewater irrigation has been widely applied in agricultural systems, providing substantial amounts of N, P, K, and other nutrients, and improving soil fertility and crop productivity[7−10]. Although the effects of wastewater irrigation on soil physicochemical properties have been widely documented in cropland and orchard systems[11−13], their integrated impacts in perennial plantation ecosystems remain poorly understood.
Long-term wastewater irrigation affects soil fertility through interconnected physicochemical and biogeochemical processes, rather than isolated changes in individual soil properties[12,14]. Among these, soil pH plays a central role in regulating nutrient availability, as it both responds to and mediates key biogeochemical transformations[15,16]. Microbial nitrogen transformations, especially nitrification, release hydrogen ions that acidify the soil and alter pH, which in turn influences microbial community composition, activity, and the rates of nitrogen mineralization and broader nutrient cycling[11,17]. Wastewater irrigation can introduce labile organic carbon and additional nitrogen, thereby stimulating microbial activity and accelerating C, N, and P transformations[17,18]. In this context, disproportionate nitrogen inputs may further affect soil C : N : P stoichiometry, decoupling carbon turnover from nutrient availability, and influencing plant nutrient limitation[19−21]. Together, these processes suggest that dry-season wastewater irrigation may modify soil pH via enhanced nitrogen transformation, thereby influencing overall soil fertility in rubber plantation soils. However, despite its recognized effects in annual cropping systems, the impact of dry-season wastewater irrigation on soil pH regulation and fertility in perennial rubber plantations remains poorly understood, representing a critical knowledge gap addressed in this study. In rubber plantations, long-lived trees, deep root systems, and strong soil buffering capacity may fundamentally alter the pathways through which wastewater inputs influence soil nutrient dynamics and pH regulation[22,23].
To address this knowledge gap, a field experiment in mature rubber plantations located at the northern margin of the rubber-growing belt in Xishuangbanna was conducted. We propose the following research hypotheses: (1) dry-season wastewater irrigation can alter soil fertility status and nutrient balance in rubber plantations relative to non-irrigated soils; (2) dry-season wastewater irrigation modifies soil pH through nitrogen transformation processes, thereby influencing soil fertility in rubber plantation soils. The overarching objective of this study is to advance the mechanistic understanding of soil fertility dynamics under wastewater irrigation in perennial rubber systems. The findings are expected to inform dry-season water and nutrient management in rubber plantations and support sustainable wastewater reuse strategies in Xishuangbanna.
-
This study was conducted at the Mengla Tianye Rubber Sales Co. Ltd. in Menglun town, Mengla County, Xishuangbanna Dai Autonomous Prefecture, Yunnan Province, China (21°26′ N, 101°16′ E), at an elevation of 579–589 m. The mean annual temperature is 21.8 °C, with monthly averages of 24.6 °C in the warmest month, and 15.2 °C in the coldest month. Mean annual precipitation is 1,490 mm, approximately 84% of which occurs during the rainy season (May–October)[24]. The annual sunshine duration is 1,858.7 h. The climate is characterized by a small annual, but large diurnal, temperature range, and clearly defined wet and dry seasons, typical of a tropical monsoon climate. The dominant soil type in the study area is brick-red soil[25].
The rubber plantation was managed under a terraced wide–narrow row cultivation system, with individual trees spaced 3.0 m apart, wide row spacing of 19.0 m, and narrow row spacing of 4.0 m. Trees reached canopy heights of approximately 20–30 m, with an average planting density of 370 trees ha−1. Routine management included annual weeding. Experimental plots were located on an upper-slope position with effective natural drainage, and had no prior history of irrigation.
Beginning in January 2020, organic wastewater generated from natural rubber processing was used for irrigation. Rubber trees were tapped during the dry season, while outside of this period, tapping followed the same schedule as CK treatment. A total of 220 trees within the wastewater irrigation zone received irrigation. Furrow irrigation was applied, with furrows constructed along the terrace edge at 1 m from each tree (furrow depth: 50 cm; width: 30 cm) (Fig. 1). From January 2020 through September 2022, irrigation was conducted annually from December to the following March. Wastewater was applied at three-day intervals in March, with 5 L per tree per application. Based on a planting density of 200 trees per acre, the corresponding nutrient inputs were calculated and summarized in Supplementary Table S1.
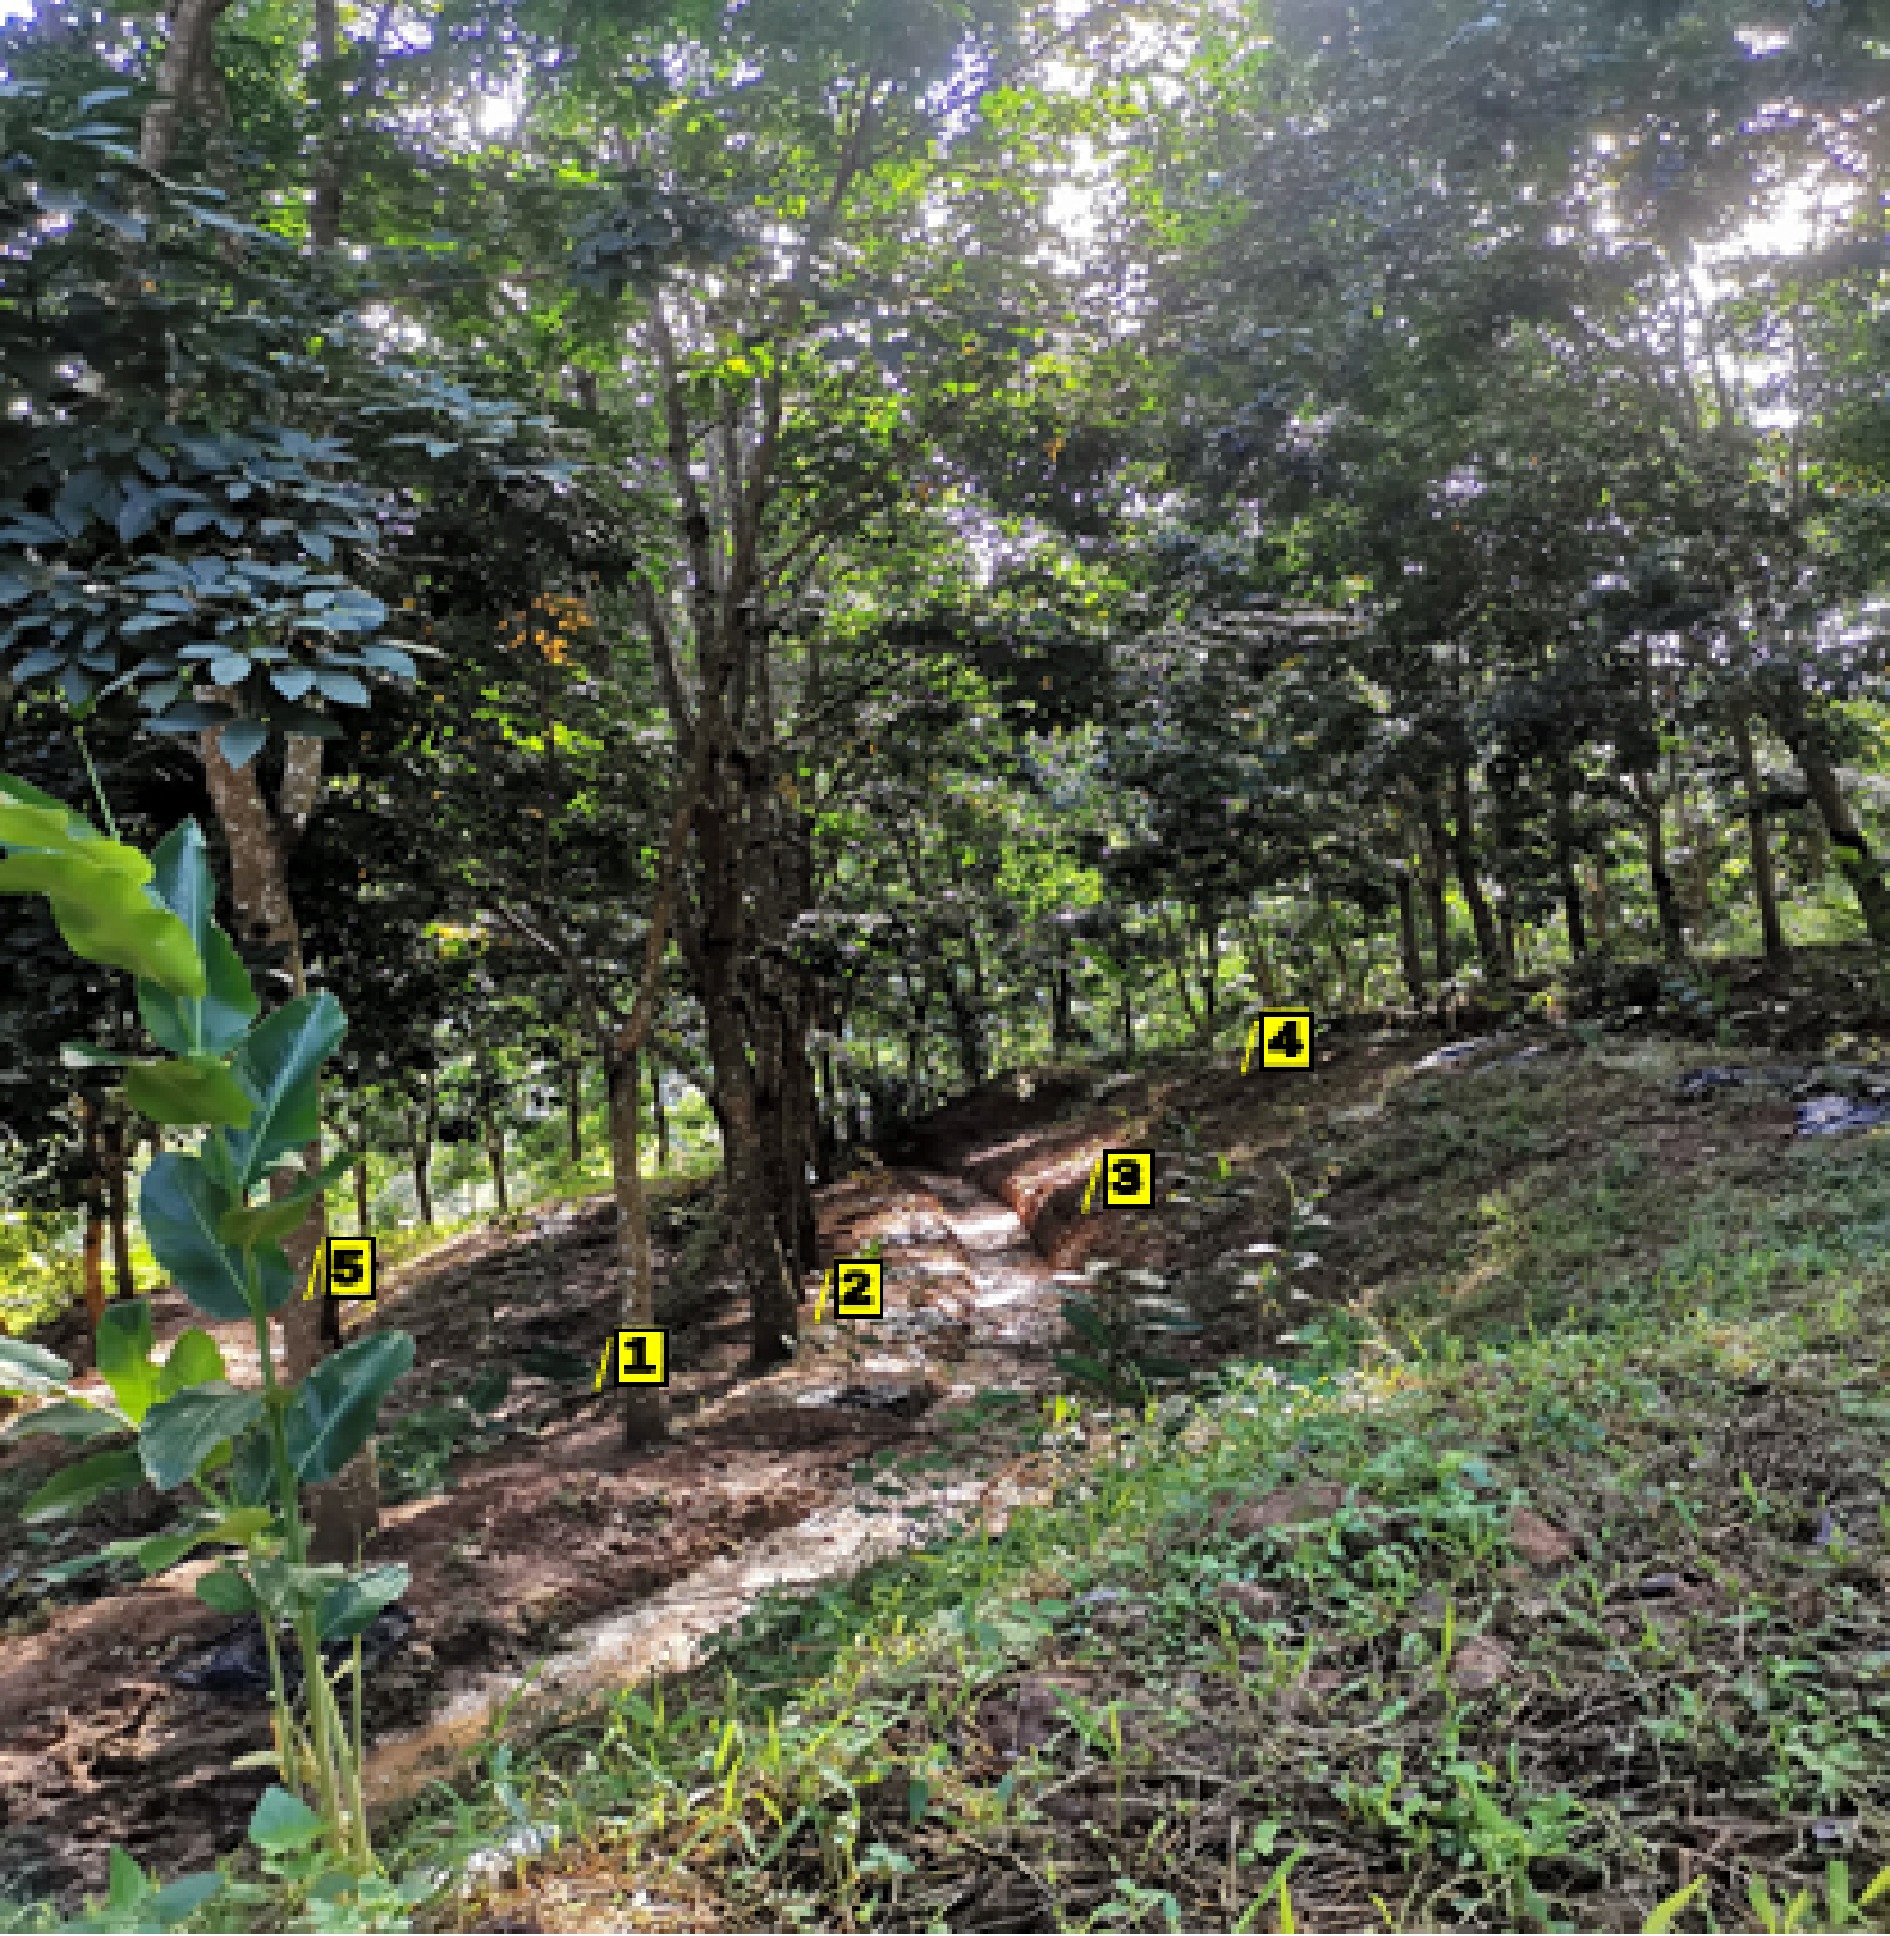
Figure 1.
Soil sampling diagram in an irrigated rubber forest in the dry season. 1, Platform between plants; 2, irrigation ditch edge; 3, wide slope bottom; 4, wide slope middle; 5, narrow slope middle.
Sample collection
-
In September 2022, soil sampling was conducted on the rubber tree terrace. Five plots were established for WW treatment, and five for CK treatment, with each plot spaced 30–50 m apart. Each sampling plot comprised three sub-plots (5 m × 20 m), separated by at least 10 m. Each sub-plot included one set of wide rows, narrow rows, planting bands, and irrigation ditches (Fig. 1). Soil profile sampling was performed at multiple locations within each plot, including the base and middle of the wide slope, the middle of the narrow slope, between two rubber trees on the terrace, and 0.3 m from the edge of the irrigation ditch. In CK treatment, sampling locations mirrored those in the WW plots, excluding the irrigation ditch. Soil samples were collected at depths of 0–10 cm, 10–20 cm, and 20–40 cm at each point. For each depth, three samples from the three sub-plots were combined to form a composite sample. The samples were brought back to the laboratory, where stones, roots, and other debris were removed. The samples were air-dried and then passed through 10-mesh and 80-mesh sieves prior to the determination of SOC, TN, TP, total sulfur (TS), and total potassium (TK), but also ammonium nitrogen (NH4+–N), nitrate nitrogen (NO3––N), available phosphorus (AP), sulfur (AS), potassium (AK), and soil pH.
Methods for determining soil physicochemical properties
-
All methods for determining soil chemical properties follow national standard general methods, specifically as referenced in the supplementary materials[26]. Key analyses included: pH (measured by potentiometric method); SOC using the K2Cr2O7 volumetric method; TN via elemental analysis; TP assessed by the HClO4−H2SO4 colorimetric method; TK determined by inductively coupled plasma atomic emission spectroscopy (ICP-AES); NO3−−N and NH4+−N measured using the KCl extraction-colorimetric method; AP extracted with NaHCO3 and analyzed colorimetrically; and AK determined by ammonium acetate extraction and flame photometry. For further details, please refer to the Supplementary File 1.
Soil fertility assessment
Soil fertility classification
-
According to the soil fertility classification standards from the Second National Soil Survey of China[27], SOC, pH, and nutrient elements are categorized such that higher levels correspond to increased content of the respective elements. The classification standards for soil fertility indicators, including pH, carbon, nitrogen, phosphorus, and potassium, are presented in Supplementary Table S2.
Soil heterogeneity calculation method
-
First, major soil nutrient indicators measured in samples from WW and CK treatments were quantitatively classified according to the Soil Nutrient Classification Standard (Supplementary Table S2). Measured values were matched to the corresponding grading criteria and categorized into levels such as 'deficient', 'low', 'adequate', and 'abundant', thereby providing an initial assessment of soil fertility status.
Second, to further compare the influence of irrigation practices on the spatial consistency of soil nutrient distribution, the coefficient of variation (CV) was calculated for each nutrient indicator. The CV represents the relative degree of dispersion within the dataset and was calculated using the following equation:
$ \rm CV \;({\text{%}}) = (Standard\; Deviation \div Mean) \times 100{\text{%}} $ Based on the magnitude of the coefficient of variation (CV), the spatial variability of soil nutrients was classified into three categories: (1) CV < 15%: weak variation; (2) 15% ≤ CV < 35%: moderate variation; and (3) CV ≥ 35%: strong variation.
This classification was used to quantitatively describe the uniformity of nutrient distribution in soils and to assess the effects of different irrigation practices on the stability of soil properties.
Principal component analysis
-
This study employed factor analysis to extract principal components using Principal Component Analysis (PCA) for a comprehensive evaluation of soil nutrients. The PCA of soil nutrient data from CK and WW treatments was conducted using the 'prcomp' function in R version 4.4.2. The 'predict' function was utilized to calculate soil scores for each sample across the principal components. Based on the variance percentages of the eigenvalues obtained from the 'summary' function, weighted scores for the top four principal components (which accounted for a cumulative variance of 83.378%) were calculated.
PCA was also applied to integrate multiple soil physicochemical properties into a comprehensive soil quality index. The comprehensive score for each soil layer was calculated as the weighted sum of principal component scores, with weights corresponding to the variance contribution rates of the retained principal components. The average comprehensive score across soil depths was then used to represent the overall soil quality under each treatment.
Data analysis
-
Statistical analyses and data visualization were performed using R (version 4.4.2). The effects of irrigation treatment and soil layer on soil nutrient indicators were evaluated using two-way analysis of variance (ANOVA). Before analysis, data were tested for normality and homogeneity of variances, and treatment effects were considered statistically significant at p < 0.05. When significant effects were detected, post-hoc comparisons were conducted using Tukey's HSD test.
Principal component analysis (PCA) was applied to explore multivariate patterns in soil nutrient status, and to derive a comprehensive soil fertility index. All variables were standardized prior to PCA. The first two principal components were used to visualize treatment separation and assess the proportion of explained variance. Pearson correlation analysis was performed to examine relationships among soil nutrient indicators, and correlation matrices were visualized using heatmaps.
-
Except for TP, dry-season WW treatment did not significantly alter the overall decreasing trends of soil pH, SOC, TN, TK, and TS from surface to deeper layers, but it markedly reduced the vertical amplitude of these gradients (Fig. 2a–f). Compared with CK treatment, soil pH, SOC, TN, and TP declined across all soil layers under WW treatment, with the magnitude of reduction decreasing with depth. The greatest declines were consistently observed in the 0–10 cm layer, where SOC showed the largest reduction (24.8%), followed by TP (16.0%), TN (13.8%), and pH (5.22%) (Fig. 2a–d). WW treatment altered the vertical distribution of TP, which slightly decreased from 0–10 to 10–20 cm but increased in the 20–40 cm (Fig. 2d). In contrast, TK showed a weak response to WW treatment, increasing by only 2.54% in the 0–10 cm relative to the control (p > 0.05) (Fig. 2e). In addition, WW treatment significantly decreased soil pH (p < 0.05), and increased TS content in 10–40 cm (p < 0.05) (Fig. 2a, f).
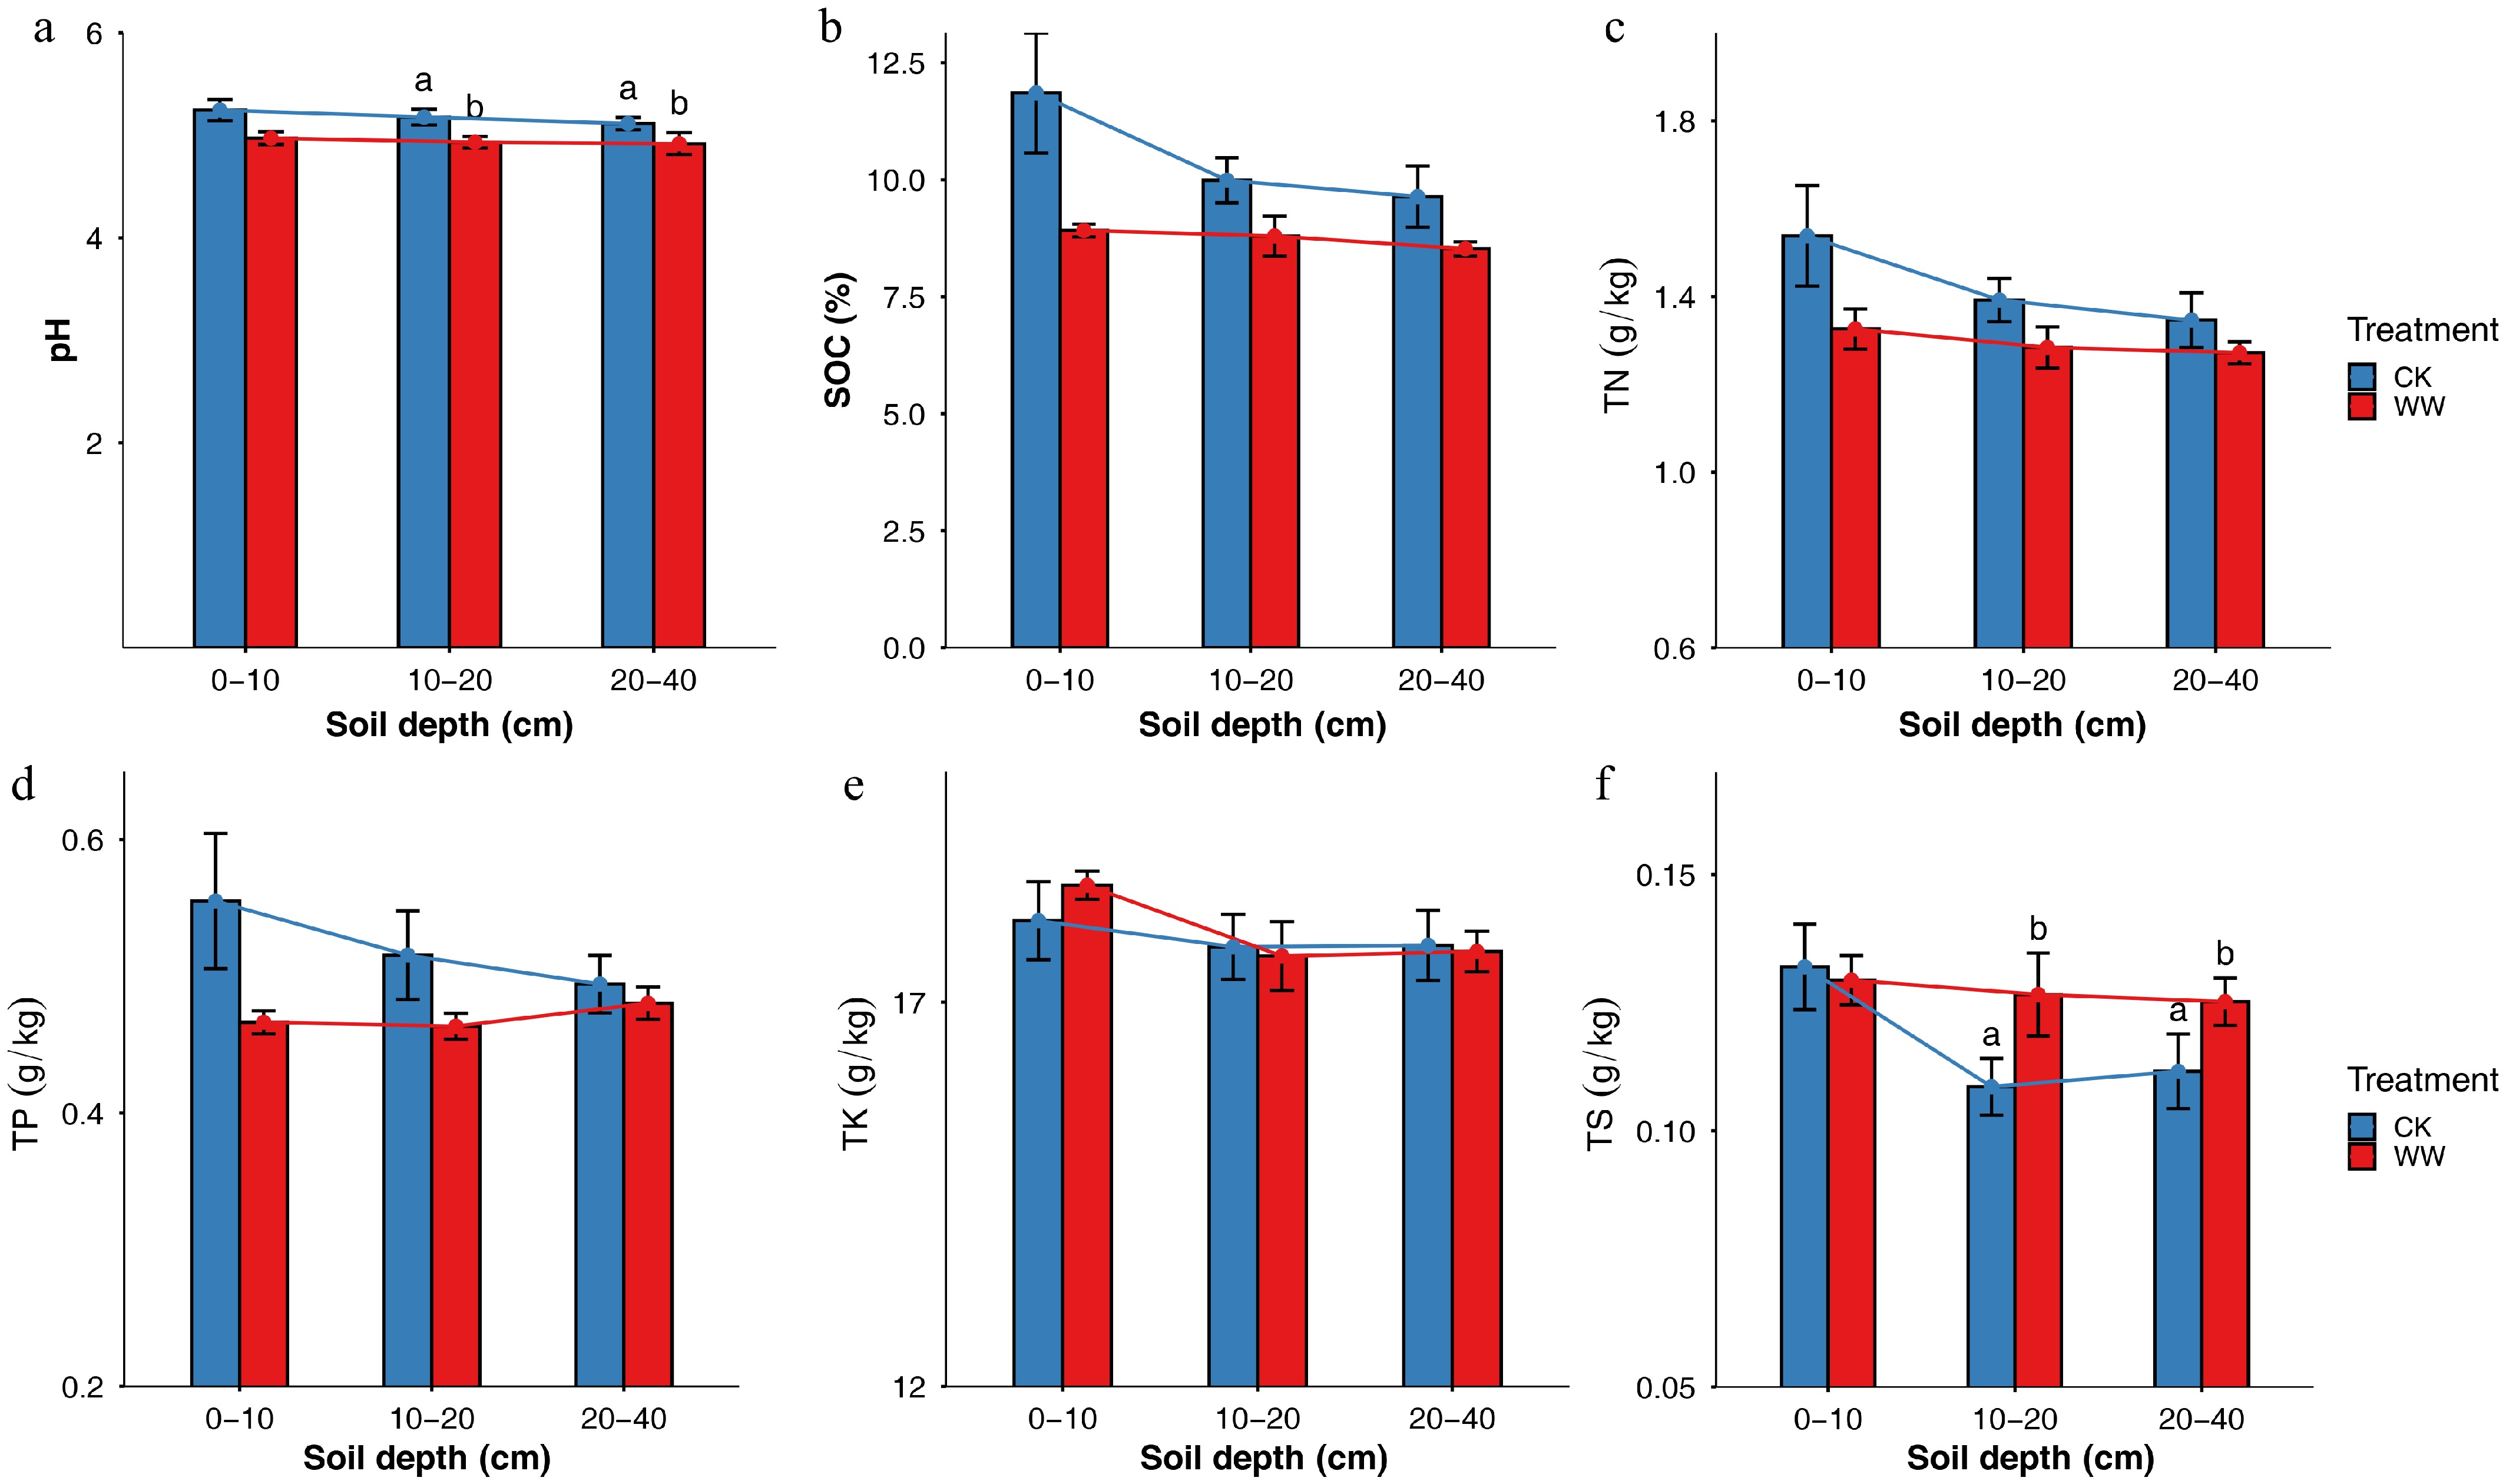
Figure 2.
Changes of total soil nutrients in dry season wastewater irrigation and control treatment: (a) pH, (b) soil organic carbon, (c) total nitrogen, (d) total phosphorus, (e) total potassium, (f) total sulfur. Note: WW is wastewater irrigation treatment; CK is control treatment. Data is presented as mean ± standard error (SE, n = 5). Statistical differences between treatments were assessed using two-way analysis of variance (ANOVA) followed by Tukey's HSD test. Different letters above bars indicate significant differences at p < 0.05; no letters indicate no significant difference.
Effects on soil available nutrients
-
Except for NH4+−N, WW treatment during the dry season altered the vertical distribution of soil nutrients, resulting in increasing concentrations of NO3−−N, AS, AP, and AK from the surface to deeper soil layers, a pattern opposite to that observed under CK treatment (Fig. 3a–e). Overall, differences between WW and CK treatments across soil depth were slight (p > 0.05). Under WW treatment, NH4+−N content in the 0–10 cm layer, increased by 10.2% relative to CK, although this increase was slightly increased compared to CK treatment (p > 0.05) (Fig. 3a). In the deeper soil (10–20 and 20–40 cm), NO3−–N and AS concentrations were higher under WW treatment, with the greatest increases occurring in the 20–40 cm, where NO3−–N and AS increased by 79.8% and 76.4%, respectively (Fig. 3b, d). Conversely, AP content was consistently lower under WW treatment across all soil layers, with the largest reduction of 76.6% observed in the 0–10 cm (p > 0.05) (Fig. 3c). AK showed an increase only in the 20–40 cm, rising by 23.5% compared with CK treatment (p > 0.05; Fig. 3e).
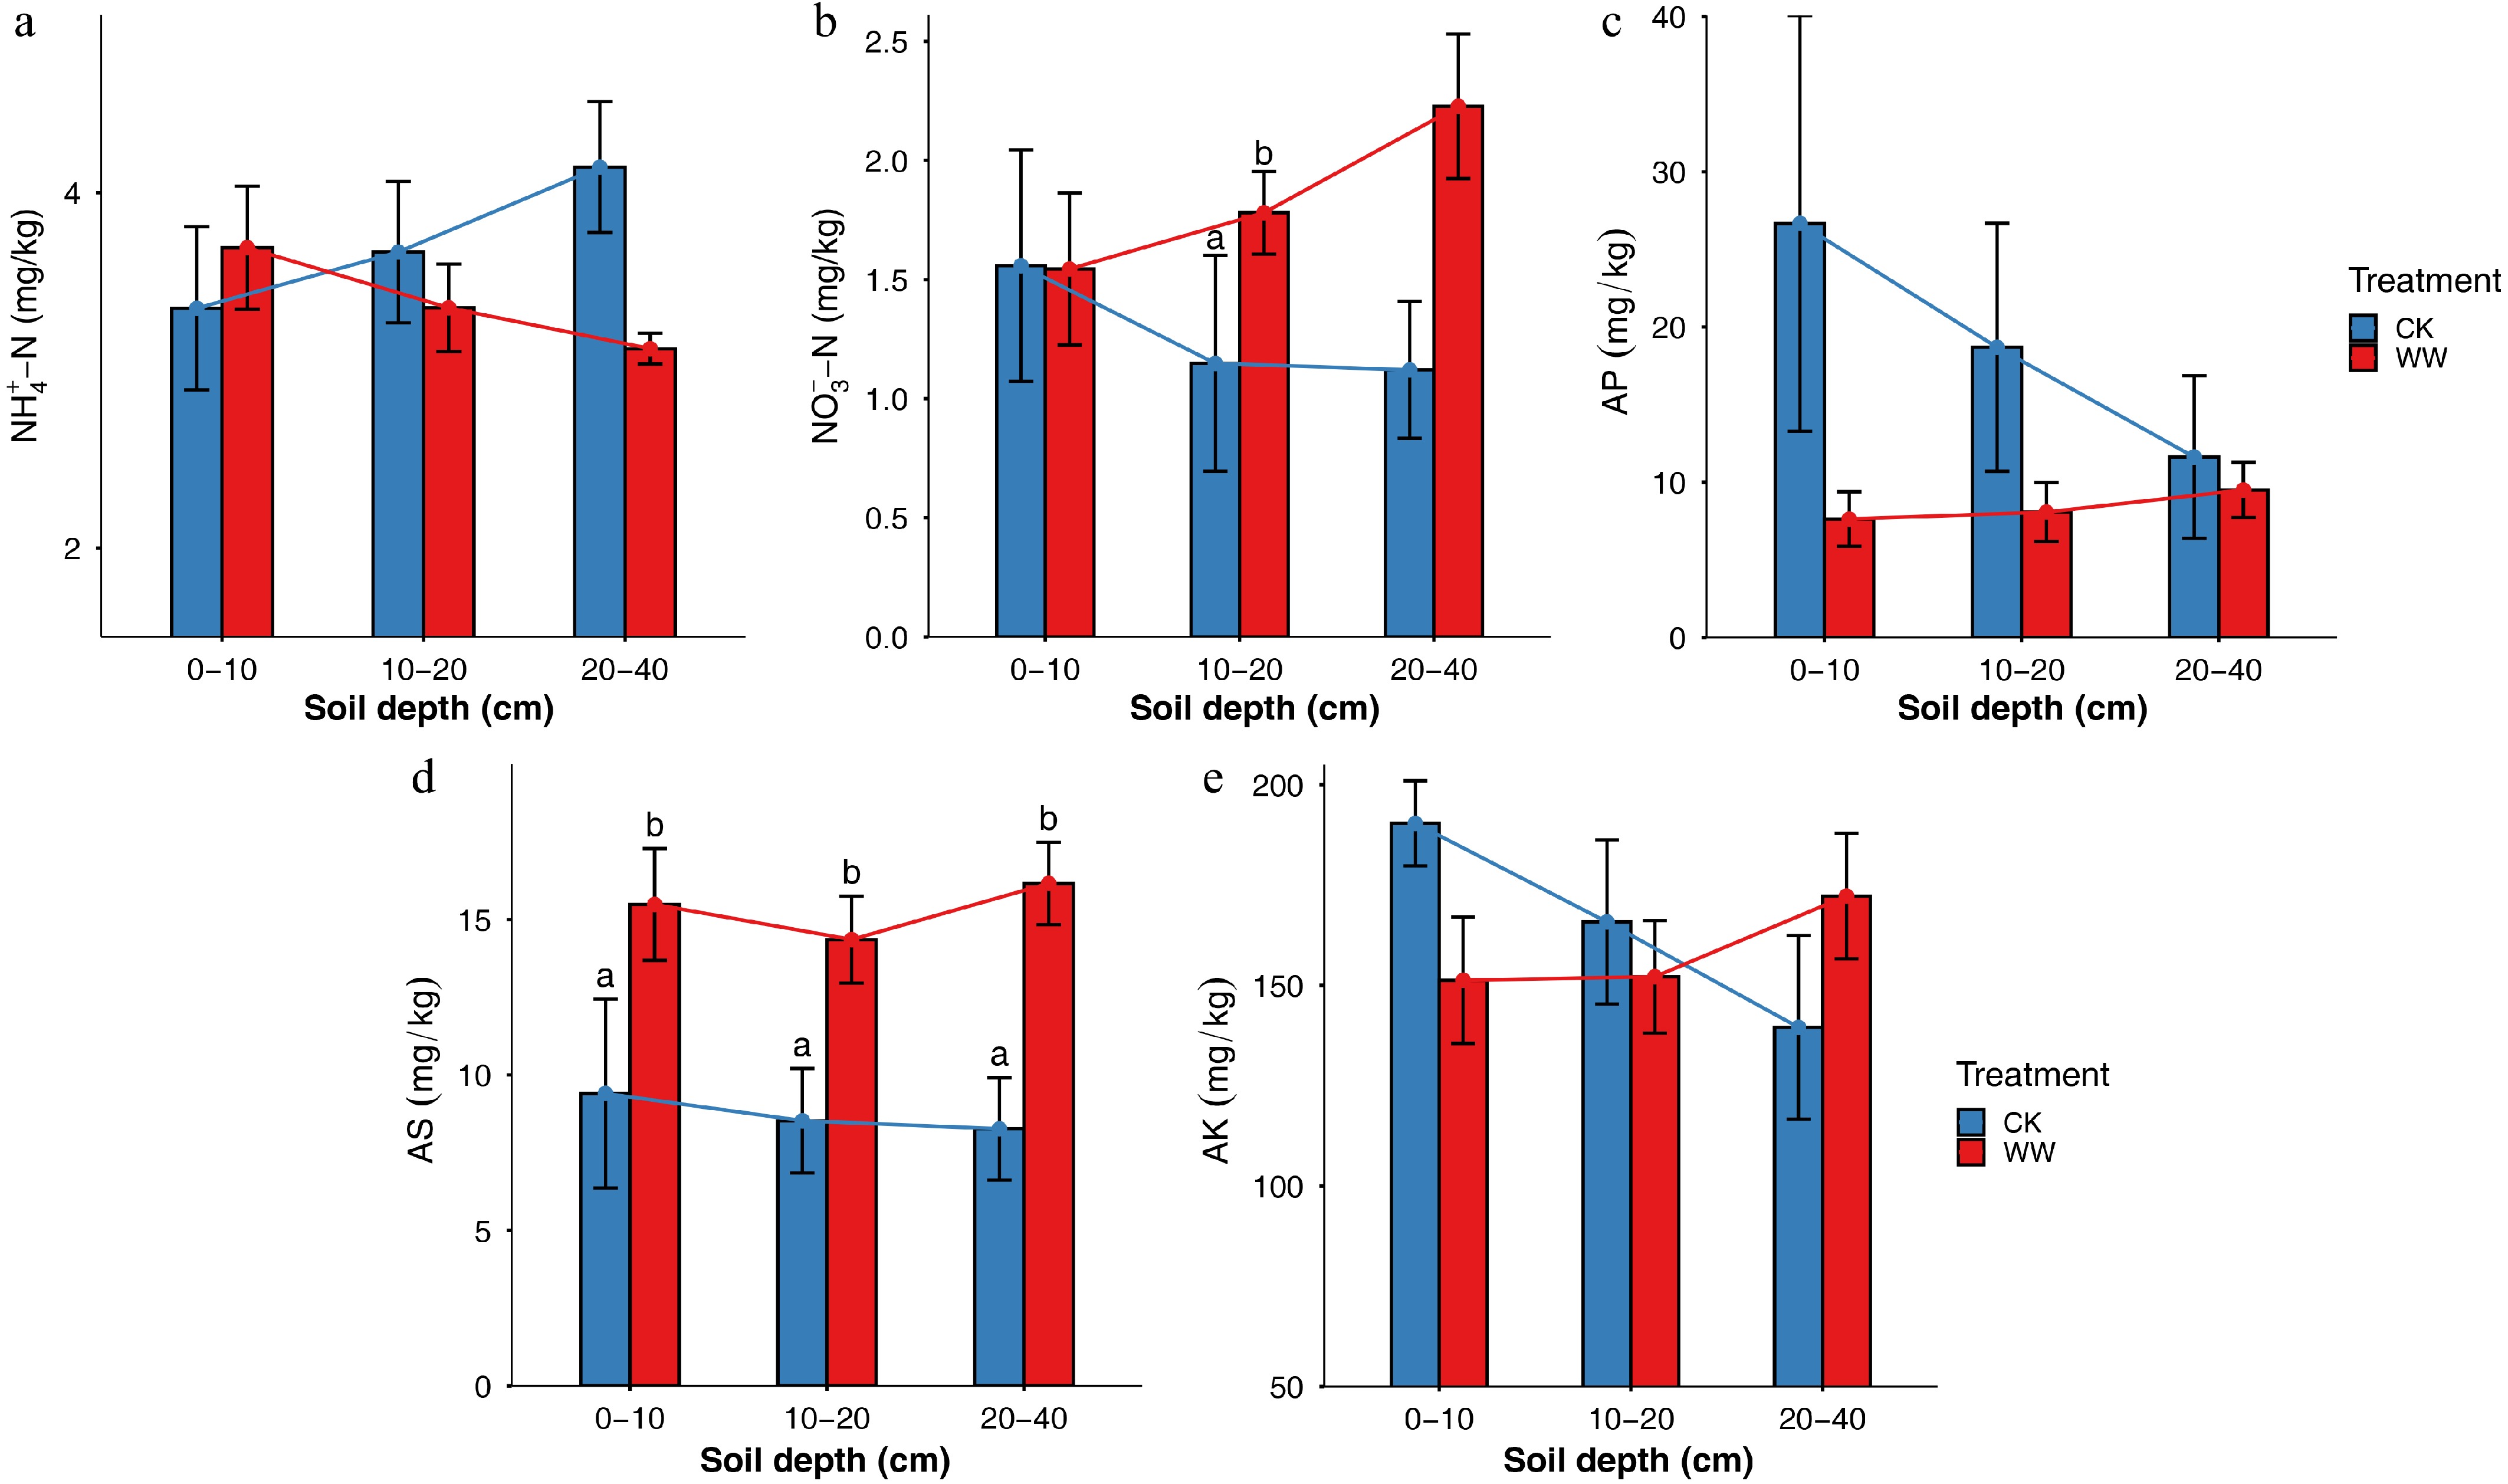
Figure 3.
Changes of soil available nutrients in dry season wastewater irrigation and control treatment: (a) ammonia nitrogen, (b) nitrate nitrogen, (c) available phosphorus, (d) available sulfur, (e) available potassium. Note: WW is wastewater irrigation treatment; CK is control treatment. Data is presented as mean ± standard error (SE, n = 5). Statistical differences between treatments were assessed using two-way analysis of variance (ANOVA) followed by Tukey's HSD test. Different letters above bars indicate significant differences at p < 0.05; no letters indicate no significant difference.
Effects on soil C, N, and P stoichiometry
-
WW treatment altered soil C, N, and P stoichiometry across soil depths (Fig. 4). Compared with the CK treatment, the C/N and C/P ratios consistently decreased under WW treatment in all soil layers, with the most pronounced reductions occurring in the 0–10 cm, where they declined by 11.5% and 10.4%, respectively (Fig. 4a, b). These decreases suggest a relative enrichment of nitrogen and phosphorus in surface soils following wastewater input. In contrast, the N/P ratio showed a slight increasing trend in the 0–10 and 10–20 cm under WW treatment, with increases of 1.5% and 0.87%, respectively, although these differences were a slight improvement (p > 0.05; Fig. 4c). Overall, wastewater irrigation tends to reduce carbon relative to nitrogen and phosphorus, particularly in surface soils, while exerting only minor effects on N/P ratio balance.
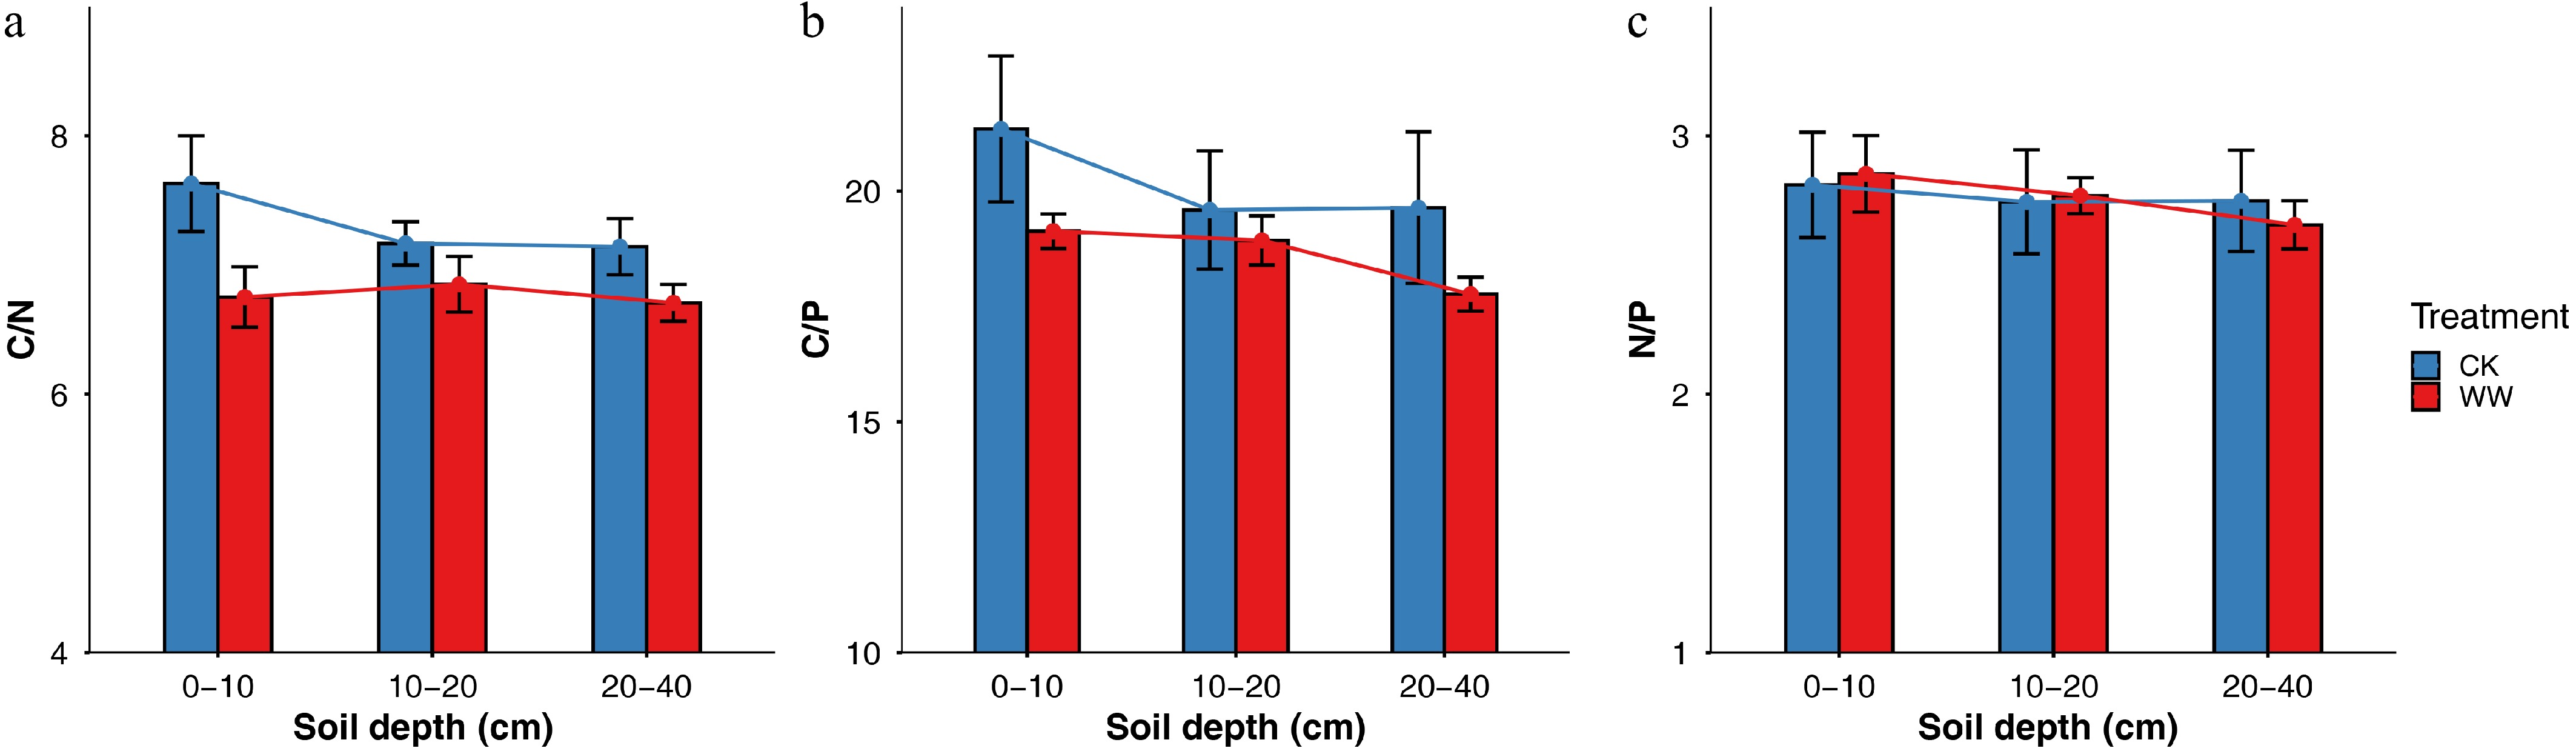
Figure 4.
Changes of soil C, N, and P stoichiometry in dry season wastewater irrigation and control treatment: (a) soil C/N ratio, (b) soil C/P ratio, (c) soil N/P ratio. Note: WW is wastewater irrigation treatment; CK is control treatment. Data is presented as mean ± standard error (SE, n = 5). Statistical differences between treatments were assessed using two-way analysis of variance (ANOVA) followed by Tukey's HSD test. Different letters above bars indicate significant differences at p < 0.05; no letters indicate no significant difference.
Comprehensive evaluation of the effect on soil fertility
Soil nutrient content and spatial heterogeneity
-
According to the classification standards for soil nutrients presented in Supplementary Table S2, the soil nutrients before and after WW treatment were categorized to clarify the nutrient status of the soil and to conduct a preliminary assessment of nutrient deficiencies or excesses. As shown in Table 1, the pH of the soil decreased after WW treatment, indicating an increase in soil acidity. Compared with the control, SOC, TP, and AP each declined by one classification grade. Specifically, SOC and TP decreased to deficient levels, whereas AP declined to a moderately deficient level. In contrast, TN and TK remained at adequate levels, and AK remained at an abundant level. After WW treatment, the variation of SOC, TP, and TS decreased from moderate to weak. The variation of AP changed from strong to moderate. The variation of TN (weak), TP (weak), AP (strong), and AK (moderate) remained unchanged.
Table 1. Soil nutrient content and variation coefficient of different irrigation types in 0–40 cm.
Fertility
factorsCK WW Content CV (%) Content CV (%) pH 5.18 ± 0.18 3.00% 4.94 ± 0.16 3.00% SOC (%) 10.49 ± 2.08 19.80% 8.74 ± 0.95 6.50% TN (g/kg) 1.43 ± 0.19 13.10% 1.29 ± 0.09 6.50% TP (g/kg) 0.52 ± 0.08 15.00% 0.47 ± 0.02 4.50% TK (g/kg) 17.84 ± 0.98 5.00% 17.93 ± 0.79 4.30% TS (g/kg) 0.12 ± 0.02 15.60% 0.127 ± 0.01 9.70% AK (mg/kg) 165.24 ± 44.37 27.00% 158.55 ± 32.98 20.09% AS (mg/kg) 8.73 ± 4.62 53.00% 15.33 ± 3.24 20.00% AP (mg/kg) 18.99 ± 20.66 109.00% 8.4 ± 3.85 44.00% WW is wastewater irrigation treatment; CK is control treatment; CV is coefficient of variation. Content data is presented as mean ± standard error (SE, n = 5). Weak variation (CV < 15%), moderate variation (15% ≤ CV < 35%), strong variation (CV ≥ 35%). Principal component analysis of soil nutrients
-
PCA was conducted on the soil fertility factors from WW treatments and CK treatments. Based on the percentage of variance explained by the eigenvalues, which exceeded 80%, four key principal components were selected for each group. The variance percentages for these four components were 35.6%, 29.3%, 10.8%, and 7.8%, with a cumulative variance percentage of 83.5% (Table 2). The first principal component of WW treatment was significantly influenced by SOC content, the second component was primarily affected by the C/P ratio, the third component was largely influenced by TS content, and the fourth component was predominantly affected by TK content (Table 2).
Table 2. Initial eigenvalues and score matrix of principal components.
Ingredient PC1 PC2 PC3 PC4 Grand total 2.232 2.025 1.229 1.047 Variance percentage (%) 0.356 0.293 0.108 0.078 Accumulation (%) 0.356 0.649 0.757 0.835 pH −0.373 0.049 0.045 0.232 NH4+−N 0.014 0.347 0.186 0.066 NO3−−N 0.026 −0.353 −0.073 −0.526 AP −0.341 −0.286 0.029 0.030 AK −0.142 −0.340 −0.146 0.137 AS 0.244 −0.232 −0.361 −0.243 SOC −0.426 0.108 −0.116 −0.117 TN −0.352 0.241 −0.128 −0.173 TP −0.369 −0.241 0.009 0.093 TK 0.087 0.135 −0.477 0.614 TS −0.008 0.030 −0.723 −0.093 C/N −0.401 −0.107 −0.028 −0.007 C/P −0.232 0.376 −0.119 −0.261 N/P 0.019 0.448 0.099 −0.283 WW is wastewater irrigation treatment; CK is control treatment. PCA was applied to integrate multiple soil physicochemical properties into a comprehensive nutrient score (Table 3). Overall, WW treatment showed a higher comprehensive score across soil layers (0.397) than CK treatment, which exhibited a negative mean value (–0.358). Differences between treatments were most pronounced in the 0–10 cm layer, and gradually diminished with increasing soil depth. Although the comprehensive soil score of the wastewater irrigation treatment group was numerically higher than that of the control group, the difference between the two was not statistically significant (p > 0.05).
Table 3. Comprehensive soil scores of different soil layers under different treatments.
Treatment CK WW Depth (cm) 0−10 10−20 20−40 0−10 10−20 20−40 PC1 −2.712 −0.910 −0.216 1.207 1.216 1.416 PC1 variance percentage 0.356 PC2 0.059 0.214 0.814 0.366 −0.229 −1.225 PC2 variance percentage 0.293 PC3 −0.859 0.915 1.168 −0.818 −0.190 −0.215 PC3 variance percentage 0.108 PC4 0.005 −0.146 0.387 0.548 0.361 0.095 PC4 variance percentage 0.078 Average score per soil layer −1.245 −0.208 0.381 0.588 0.447 0.155 Mean of total scores −0.358 0.397 WW is wastewater irrigation treatment; CK is control treatment. Correlation analysis of soil nutrients
-
There are varying degrees of correlation among the different soil indicators. Correlation analysis of the soil samples from the entire profile indicates that WW treatment changed the relationships between nutrient components. Specifically, WW treatment markedly reduced the correlation between TS and pH, C/N, and TN, as well as TS and AS. Conversely, it enhanced the correlations between C/P and AS, NH4+−N and TN, as well as NH4+−N and SOC (Fig. 5a, b).
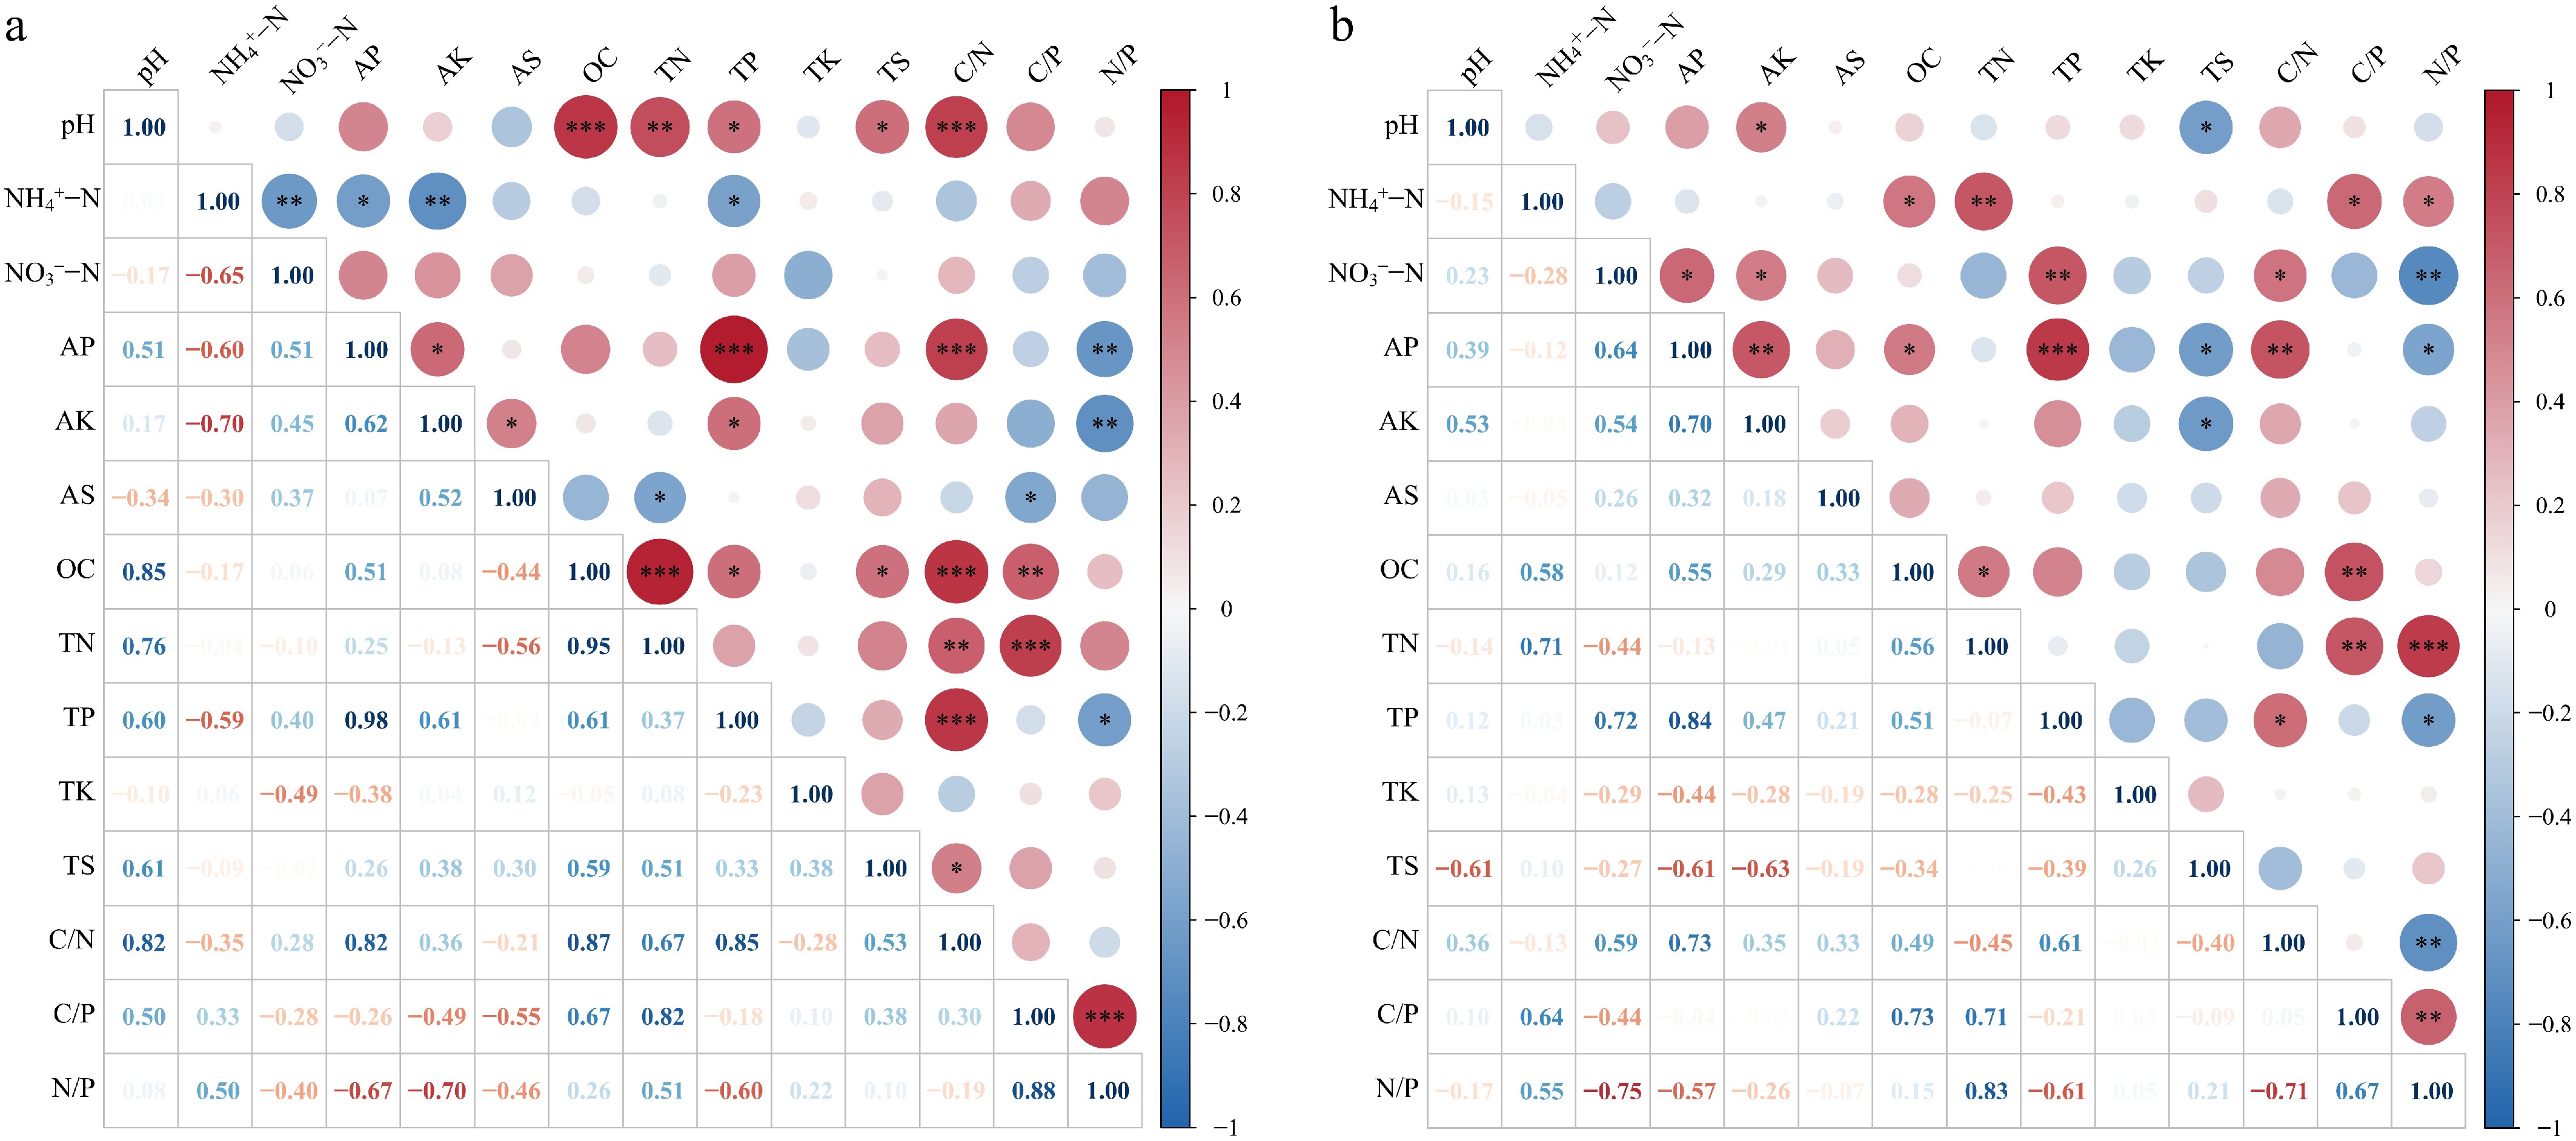
Figure 5.
Comparison of the correlation heatmap of soil nutrient content between wastewater irrigation and control treatment. (a) Correlation heatmap of CK treatment, (b) correlation heatmap of WW treatment; CK is control treatment. Statistical differences between treatment groups were assessed using Pearson correlation analysis, with the significance of correlation coefficients denoted by asterisks (* p < 0.05, ** p < 0.01, *** p < 0.001).
-
The results of this study support Hypothesis 1, showing that dry-season wastewater irrigation can modify soil fertility and nutrient balance in rubber plantations, mainly by affecting nutrient distribution, relative availability, and stoichiometric relationships rather than substantially increasing total nutrient pools.
Effect on soil physicochemical properties
-
C, N, P, and K are key indicators of soil fertility[28−30]. In this study, three years of wastewater irrigation resulted in reductions in SOC, TN, and TP, except for TK (Fig. 3b−e), this may be linked to enhanced rubber tree growth under dry-season wastewater irrigation. Over three years, wastewater irrigation may have enhanced the rubber tree's capacity to uptake N and P[31], and continuous tapping during the dry season likely further stimulated tree growth, increasing nutrient absorption and thereby reducing soil N and P concentrations. The observed decline in SOC compared with CK treatment aligns with findings by Iseas et al. in the Pampas region of Argentina[32]. Decreasing trends in SOC, TN, and TP, were observed which may be associated with dry-season irrigation promoting rubber tree growth, thereby enhancing nutrient uptake, and reducing litter due to drought stress[33]. However, these changes represented modest differences relative to CK treatment, likely due to high within-treatment variability, and further studies with larger sample sizes are required to substantiate this hypothesis.
Additionally, sustained water inputs can promote the leaching and downward transport of dissolved SOC from surface soils to deeper horizons, with the strongest translocation occurring in upper layers and diminishing with depth[34,35]. This pattern may be attributed not only to reduced litter input but also to leaching processes induced by dry season wastewater irrigation, which likely promoted the downward translocation of nitrogen and phosphorus from surface soils to deeper layers, resulting in a more homogeneous vertical nutrient distribution[31,32,36] (Fig. 2b−d). The PCA-based comprehensive scores indicated that wastewater irrigation resulted in a modest overall improvement in soil nutrient status, particularly in the surface layer, although the magnitude of change was limited and decreased with soil depth (Table 3). This suggests that wastewater irrigation primarily altered nutrient structure and relative availability rather than inducing substantial changes in nutrient pools. Collectively, these results indicate that wastewater irrigation may weaken the synergistic relationships among soil nutrients[37,38].
Effect on C, N, and P stoichiometry
-
Soil C : N : P ecological stoichiometry is a key indicator of soil ecosystem processes and functions, serving as effective predictors of nutrient limitation and C, N, and P saturation[39]. In this study, WW treatment led to overall decreases in soil C/N and C/P ratios (Fig. 4a, b), whereas the N/P ratio showed no significant change (Fig. 4c). This pattern may result from reduced litter-derived carbon inputs under increased water availability, coupled with soil carbon losses induced by disturbance during rubber tapping, thereby lowering soil C/N and C/P ratios[40]. This implies that wastewater irrigation may shift soil nutrient balance toward relative carbon limitation without markedly altering N/P ratio, highlighting the importance of maintaining carbon inputs to sustain stoichiometry balance and soil functioning in managed rubber plantations.
The C/N ratio is a widely used indicator of organic matter decomposition, with lower values reflecting higher mineralization efficiency[20]. In this study, the C/N ratio under WW treatment was relatively low, with the greatest difference occurring in 0–10 cm (Fig. 4a). This effect may be attributed to suppressed leaf litter production under WW treatment, which reduced the input of lignin- and cellulose-rich residues, and consequently lowered SOC concentrations[40]. The C/P ratio is a widely used indicator of soil organic matter mineralization, with higher values generally reflecting lower phosphorus availability[41]. WW treatment reduced the C/P ratio across all soil layers (Fig. 4b). The decline in the C/P ratio in the 0–10 cm was mainly driven by a pronounced reduction in SOC, similar to the pattern observed for the C/N ratio. In contrast, the decrease in the C/P ratio in deeper soil layers may be attributed to the limited distribution of rubber tree roots[33], which constrains P uptake, and reduces P depletion in deeper soil layers (Fig. 3d). The N/P ratio provides further insight into soil nutrient limitation, with values < 14 indicating nitrogen limitation, values > 16 indicating phosphorus limitation, and intermediate values suggesting co-limitation by N and P[21,42]. In this study, the N/P ratios under both WW and CK treatments ranged from 2 to 3, indicating strong nitrogen limitation in the soil.
Therefore, when implementing wastewater irrigation in rubber plantations, it is advisable to simultaneously adopt management practices, such as retaining litter[43], applying organic amendments[44], and nitrogen supplementation to WW treatment reduced litter-derived carbon, and nitrogen limitation. Additionally, soil fertility cannot be evaluated solely based on total C, N, and P contents, especially in field experiments where multiple factors jointly influence nutrient availability[43,45]. Further research is needed to systematically assess the long-term impacts of wastewater irrigation on soil fertility, and the sustainable management of rubber plantations.
Effect of dry-season wastewater irrigation on soil pH
-
Based on the analysis of soil pH and the contents of NH4+−N and NO3−−N, the results of this study provide support for Hypothesis 2. The results of this study indicate that WW treatment lowered soil pH compared with CK treatment (Fig. 3a), consistent with previous findings that wastewater irrigation can acidify soils in perennial cropping ecosystems[46]. Soil acidification under wastewater irrigation is driven by multiple interacting biogeochemical processes. One major mechanism of soil acidification is microbial nitrification of NH4+−N supplied by wastewater, during which H+ is released, progressively lowering soil pH[47]. During the experiment, NH4+−N content in the deep soil layer decreased, while NO3−−N content increased under WW treatment (Fig. 3a, b). Additionally, wastewater irrigation enhances soil moisture, stimulating rubber tree growth and root activity, which increases the release of root exudates and organic acids into the rhizosphere, further contributing to localized acidification[48,49]. In this study, soil pH was strongly associated with TS (Fig. 5a, b), indicating that sulfur inputs and their transformation also contribute to soil acidification. Oxidation of sulfur compounds from wastewater generates sulfate and H+, directly promoting acidification, particularly in the aerobic soil typical of rubber plantations[50]. Sulfur cycling also plays a critical role in regulating soil pH under wastewater irrigation[51,52]. These results indicate that increases in soil sulfur are closely linked to acidification processes, implying that sulfur inputs from wastewater require careful management (Supplementary Table S1).
Therefore, it should be emphasized that although nitrogen transformation processes—particularly nitrification of wastewater-derived NH4+−N—represent an important pathway driving soil acidification, they do not operate in isolation. Soil acidification under wastewater irrigation is the integrated outcome of multiple, co-occurring processes, including enhanced plant uptake of base cations and root exudation[53], sulfur inputs and oxidation[54], and changes in soil moisture and aeration[55,56]. These processes may interact synergistically, amplifying acidification beyond the effect attributable to nitrogen transformations alone. Therefore, soil acidification in wastewater-irrigated rubber plantations should be interpreted as a multifactorial phenomenon, necessitating a comprehensive assessment of nutrient inputs and biogeochemical cycles rather than attribution to a single controlling mechanism.
Limitation and implication
-
The findings of this study have several important implications, while also reflecting inherent limitations of field-based wastewater irrigation experiments. From a management perspective, the absence of pronounced short-term negative effects suggests that dry-season wastewater irrigation, when properly managed, may represent a feasible option for water reuse in rubber plantations. However, substantial spatial heterogeneity of soil properties and temporal variability in wastewater composition may have reduced statistical power and partially masked treatment effects[57], highlighting the need for cautious long-term monitoring, particularly with respect to nutrient dynamics and soil acidification processes. From a scientific perspective, the largely non-significant responses, together with the high spatial variability and fluctuating nutrient inputs, underscore the buffering capacity and temporal lag of highly weathered tropical soil[24,58]. These findings indicate that short-term field experiments may be insufficient to capture cumulative or threshold effects. Accordingly, future research should combine long-term field monitoring with increased spatial replication and controlled laboratory incubation experiments to isolate key soil processes and more robustly evaluate the sustainability of wastewater irrigation practices.
-
Dry-season irrigation with rubber-processing wastewater has been proposed as an alternative strategy to alleviate water stress in rubber plantations, yet its impacts on soil fertility under field conditions remain unclear. Based on a three-year field experiment, this study evaluated changes in soil pH and nutrient dynamics under wastewater irrigation relative to non-irrigated management. The results showed that wastewater irrigation altered soil nutrient distribution and stoichiometric relationships, rather than substantially increasing total nutrient pools. Wastewater irrigation increased soil nitrate nitrogen and available sulfur concentrations, while reducing soil C/N and C/P ratios, indicating shifts in nutrient balance. In addition, vertical nutrient stratification was weakened under wastewater irrigation, suggesting enhanced downward redistribution of nutrients within the soil profile. Comprehensive nutrient scoring further indicated an improvement in overall soil nutrient status, although most differences were slight in the short term. Overall, dry-season wastewater irrigation appears to induce structural and stoichiometric adjustments in soil nutrients rather than rapid fertility enhancement. Long-term field monitoring, together with integrated soil fertility management practices, is required to fully assess the sustainability of wastewater irrigation in rubber plantation ecosystems.
This study was supported by the National Natural Science Foundation of China (32361143516, 42361144863), International Joint Laboratory of Tropical Asian Forest Carbon Sequestration in Yunnan (202403AP140005); Yunnan Provincial Department of Scientific and Technology (202205AC160045) and Xishuangbanna Science and Technology Plan Project (202401010). We appreciate the staff and technicians of Mengla Tianye Rubber Sales Co. Ltd. and students of the Climate Change Research Group, XTBG, CAS, helping with field work. We are especially grateful to Yang DH, and Yi TX for their help in sampling and lab work. We also thank Institutional Center for Shared Technologies and Facilities of XTBG, CAS for helping us with the soil analysis.
-
Not applicable.
-
The authors confirm their contributions to the paper as follows: study conception and design: Ma Q, Li Y, Zhou W; data collection: Ma Q, Zhou W, Li Y, Zhu Z, Qiao Q, Deng J, Tian Y, Deng G, Tang Y, Song Q; analysis and interpretation of results: Ma Q and Zhou W; draft manuscript preparation: Ma Q, Li Y, Zhou W. All authors reviewed the results and approved the final version of the manuscript.
-
The datasets generated during and/or analyzed during the current study are available from the corresponding author upon reasonable request. Detailed methods for determining soil physicochemical properties are provided in the electronic Supplementary File 1.
-
The authors declare that they have no conflict of interest.
-
# Authors contributed equally: Qingyuan Ma, Yun Li
- Supplementary Table S1 Basic components of wastewater from natural rubber production for irrigation during dry season.
- Supplementary Table S2 Soil nutrient classification standards.
- Supplementary File 1 Methods for determining soil physicochemical properties.
- Copyright: © 2026 by the author(s). Published by Maximum Academic Press, Fayetteville, GA. This article is an open access article distributed under Creative Commons Attribution License (CC BY 4.0), visit https://creativecommons.org/licenses/by/4.0/.
-
About this article
Cite this article
Ma Q, Li Y, Zhu Z, Qiao Q, Deng J, et al. 2026. Soil fertility responses to dry-season irrigation with rubber-processing wastewater in a tropical rubber plantation. Circular Agricultural Systems 5: e004 doi: 10.48130/cas-0026-0004 

Soil fertility responses to dry-season irrigation with rubber-processing wastewater in a tropical rubber plantation
- Received: 13 December 2025
- Revised: 05 January 2026
- Accepted: 05 January 2026
- Published online: 13 February 2026
Abstract: Xishuangbanna is a major natural rubber production region in China, characterized by extensive monoculture rubber plantations, and a distinct dry-wet seasonal climate. To alleviate dry-season water stress and its constraints on rubber tree growth, a three-year field experiment was conducted in a mature rubber plantation using rubber-processing wastewater as an alternative irrigation source. The experiment included a dry-season wastewater irrigation treatment applied from December to the following March (WW treatment), and a non-irrigated control (CK treatment). The results showed that soil organic carbon (SOC), total nitrogen (TN), total phosphorus (TP), and pH consistently declined with increasing soil depth; however, vertical stratification was less pronounced under WW treatment. Compared with CK, the WW treatment significantly increased soil nitrate nitrogen (NO3−−N), and available sulfur (AS) concentrations (p < 0.05). Wastewater irrigation reduced the soil C/N and C/P ratios, and slightly increased the N/P ratio in 0–20 cm, indicating a shift in nitrogen–phosphorus supply balance. Comprehensive nutrient scoring, integrating multiple soil fertility indicators, showed a modest improvement in nutrient status under WW treatment. Overall, dry-season wastewater irrigation altered soil nutrient distribution and stoichiometric relationships, and resulted in limited short-term improvement in soil fertility in rubber plantations. However, SOC, TN, TP, and total potassium (TK) remained at relatively low levels, suggesting that wastewater irrigation alone is insufficient to substantially enhance soil nutrient status. These findings highlight the need for long-term field studies and integrated soil fertility management strategies to evaluate and ensure the sustainability of wastewater irrigation in rubber plantation systems.