


-
Transportation mobility around the globe was significantly hampered by the COVID-19 pandemic, which had unprecedented effects on various aspects of society, including social activities, the economy, and daily lives. This resulted in increased car ownership, inequalities due to unemployment and poverty worldwide. Furthermore, it was found that the ridership of public transit and ride-hailing services decreased by 70%−90% and 60%−70% respectively in major cities around the globe[1]. Hence, the shift towards private vehicles, and active modes of transportation was prominent[2,3]. For this reason, many operators, micro-mobility, and carpooling players halted their services during the pandemic, which directly affected the traditional automotive section that had projected 7.5 million fewer vehicles in 2020[4].
In the early stages of COVID-19, people strongly responded to the threats imposed by the pandemic and avoided unnecessary travel, which led to the decline of all major transportation uses[5]. Again, the need for travel was noticeably reduced by encouraging work from home, distance education, job dismissals and abandonment of all social gatherings. Since these implications occurred in various phases of the pandemic, the deviations in travel patterns and transport mobility among the phases were prominent, specifically for commuting and social/recreational/leisure trips. In many countries, traffic was reduced dramatically across the weeks and during the lockdown period this volume declined significantly[6]. Therefore, the pandemic has immensely affected how people travel, their mindset, and their modal choices, including the use of private vehicles, public transportation, and active modes. This has also played a delicate role in advocating the decrease of environmental pollution from traveling.
Although most studies were skewed toward traffic demand and mode choice modeling[7], the logical reasoning, and behavioral changes behind such outcomes and decisions were undermined. Therefore, a comprehensive literature review is crucial to delineate the current understanding and explorations associated with user behaviors in transportation mobility during and after COVID-19 in a global manner. Hence, this study aims to explore the literature gaps and point out behavior change, mobility changes, and their holistic impacts on different study themes through a rigorous literature review. The study has explored previous papers that focused on short-distance mobility and have refrained from long-distance mobility modes.
-
The framework for this systematic literature review was prepared considering the Preferred Reporting Items for Systematic Reviews and Meta-Analyses (PRISMA) guidelines. The primary search strategy focused on the keywords: COVID-19, mobility, and transportation. Boolean operators AND and OR were used to combine these keywords for a broader search scope. The study utilized literature from Scopus, a database indexing high-quality, peer-reviewed publications across various topics. The initial search yielded 1,037 articles.
These articles were screened using the following exclusion criteria: only English-language publications from peer-reviewed journals published between January 1, 2020, and December 31, 2022, were included. Articles containing the keywords COVID-19, public transport, travel behavior, mobility, or their synonyms in the titles, abstracts, or reference lists were also included. All other articles were excluded. This screening process eliminated 562 articles, leaving 475 for further review.
For the full-text analysis stage, an additional set of exclusion criteria was applied: studies outside the subject areas of social science, engineering, decision science, mathematics, and psychology were excluded. Additionally, irrelevant studies that did not align with the review scope based on title, abstract, key findings, or keyword review were excluded. This process resulted in the exclusion of 379 studies, leaving a final selection of 96 articles for the bibliometric analysis. The PRISMA diagram (2022) for this study is presented in Fig. 1.
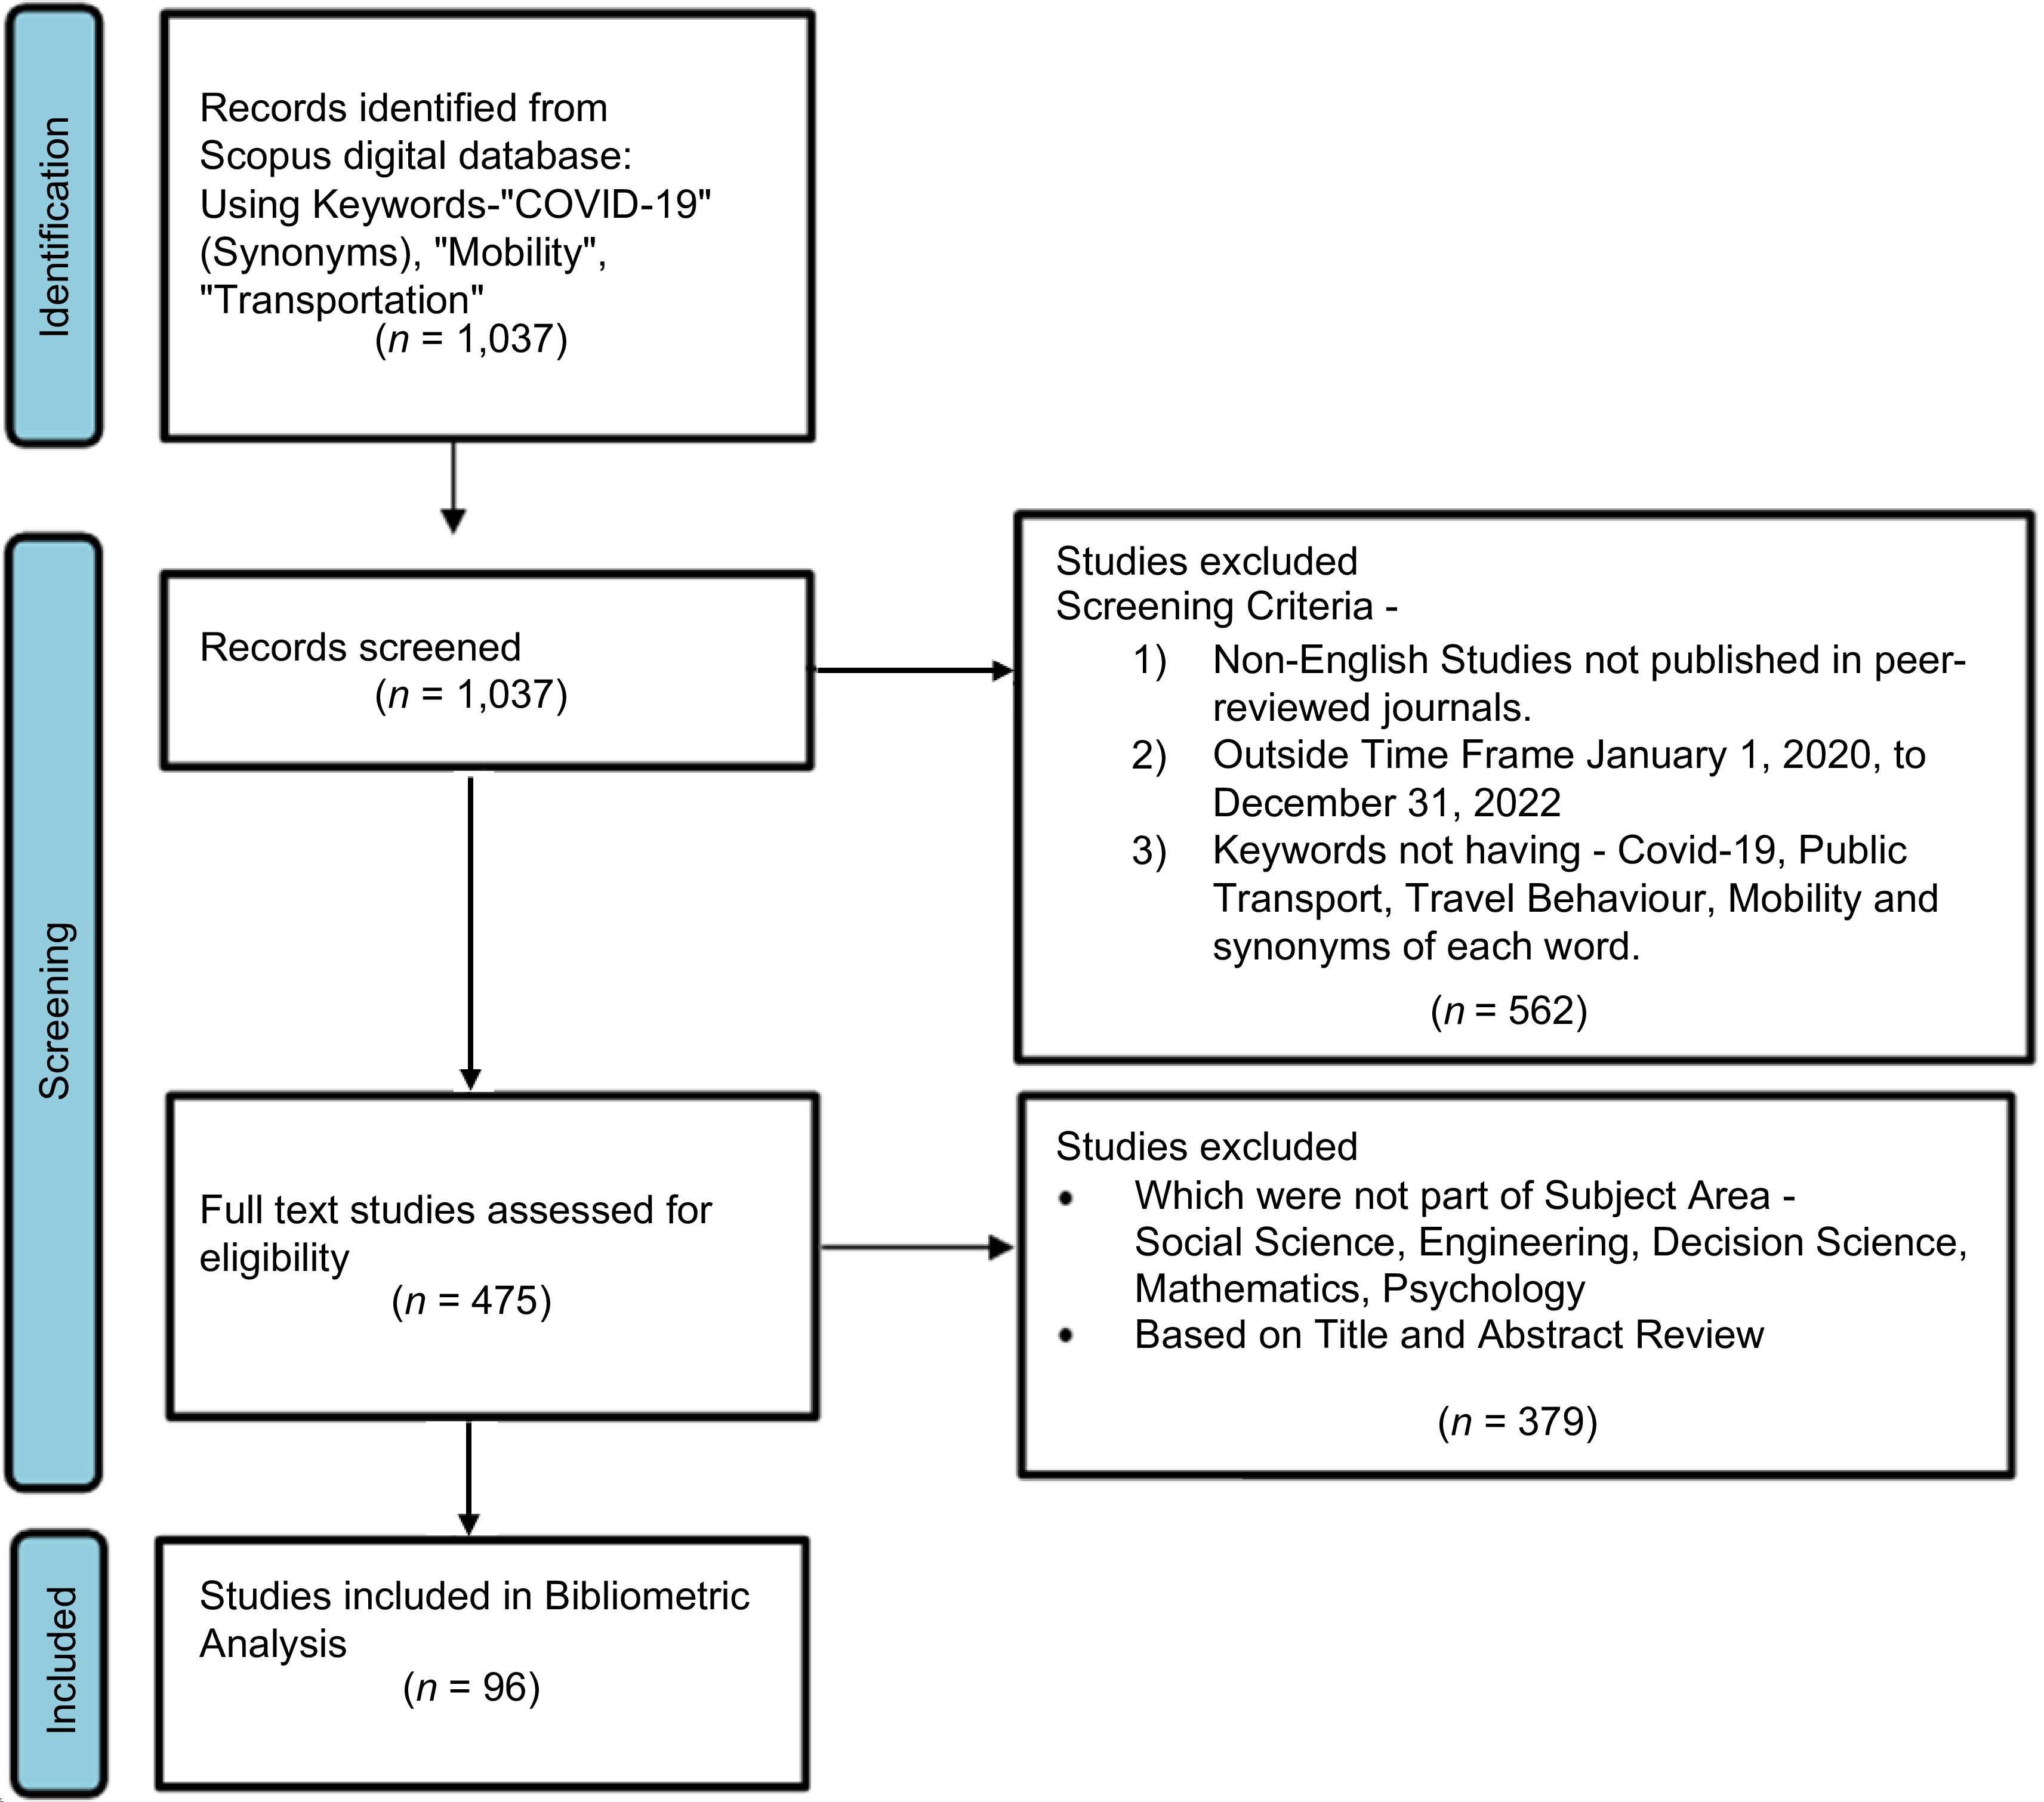
Figure 1.
The three-phased PRISMA (2022) diagram of the literature selection process.
Theme and sub-theme selection
-
In the second phase, the three dominant themes were identified by using three distinct screening processes, which are as follows.
Topic modelling
-
The first step analyzed the abstracts using topic modeling analysis in Python that generated a comparison diagram of the top 50 keywords and their frequencies (Fig. 2), providing the foundational understanding of the overall thematic landscape. This powerful tool is used in bibliographic analysis to uncover and identify thematic patterns.
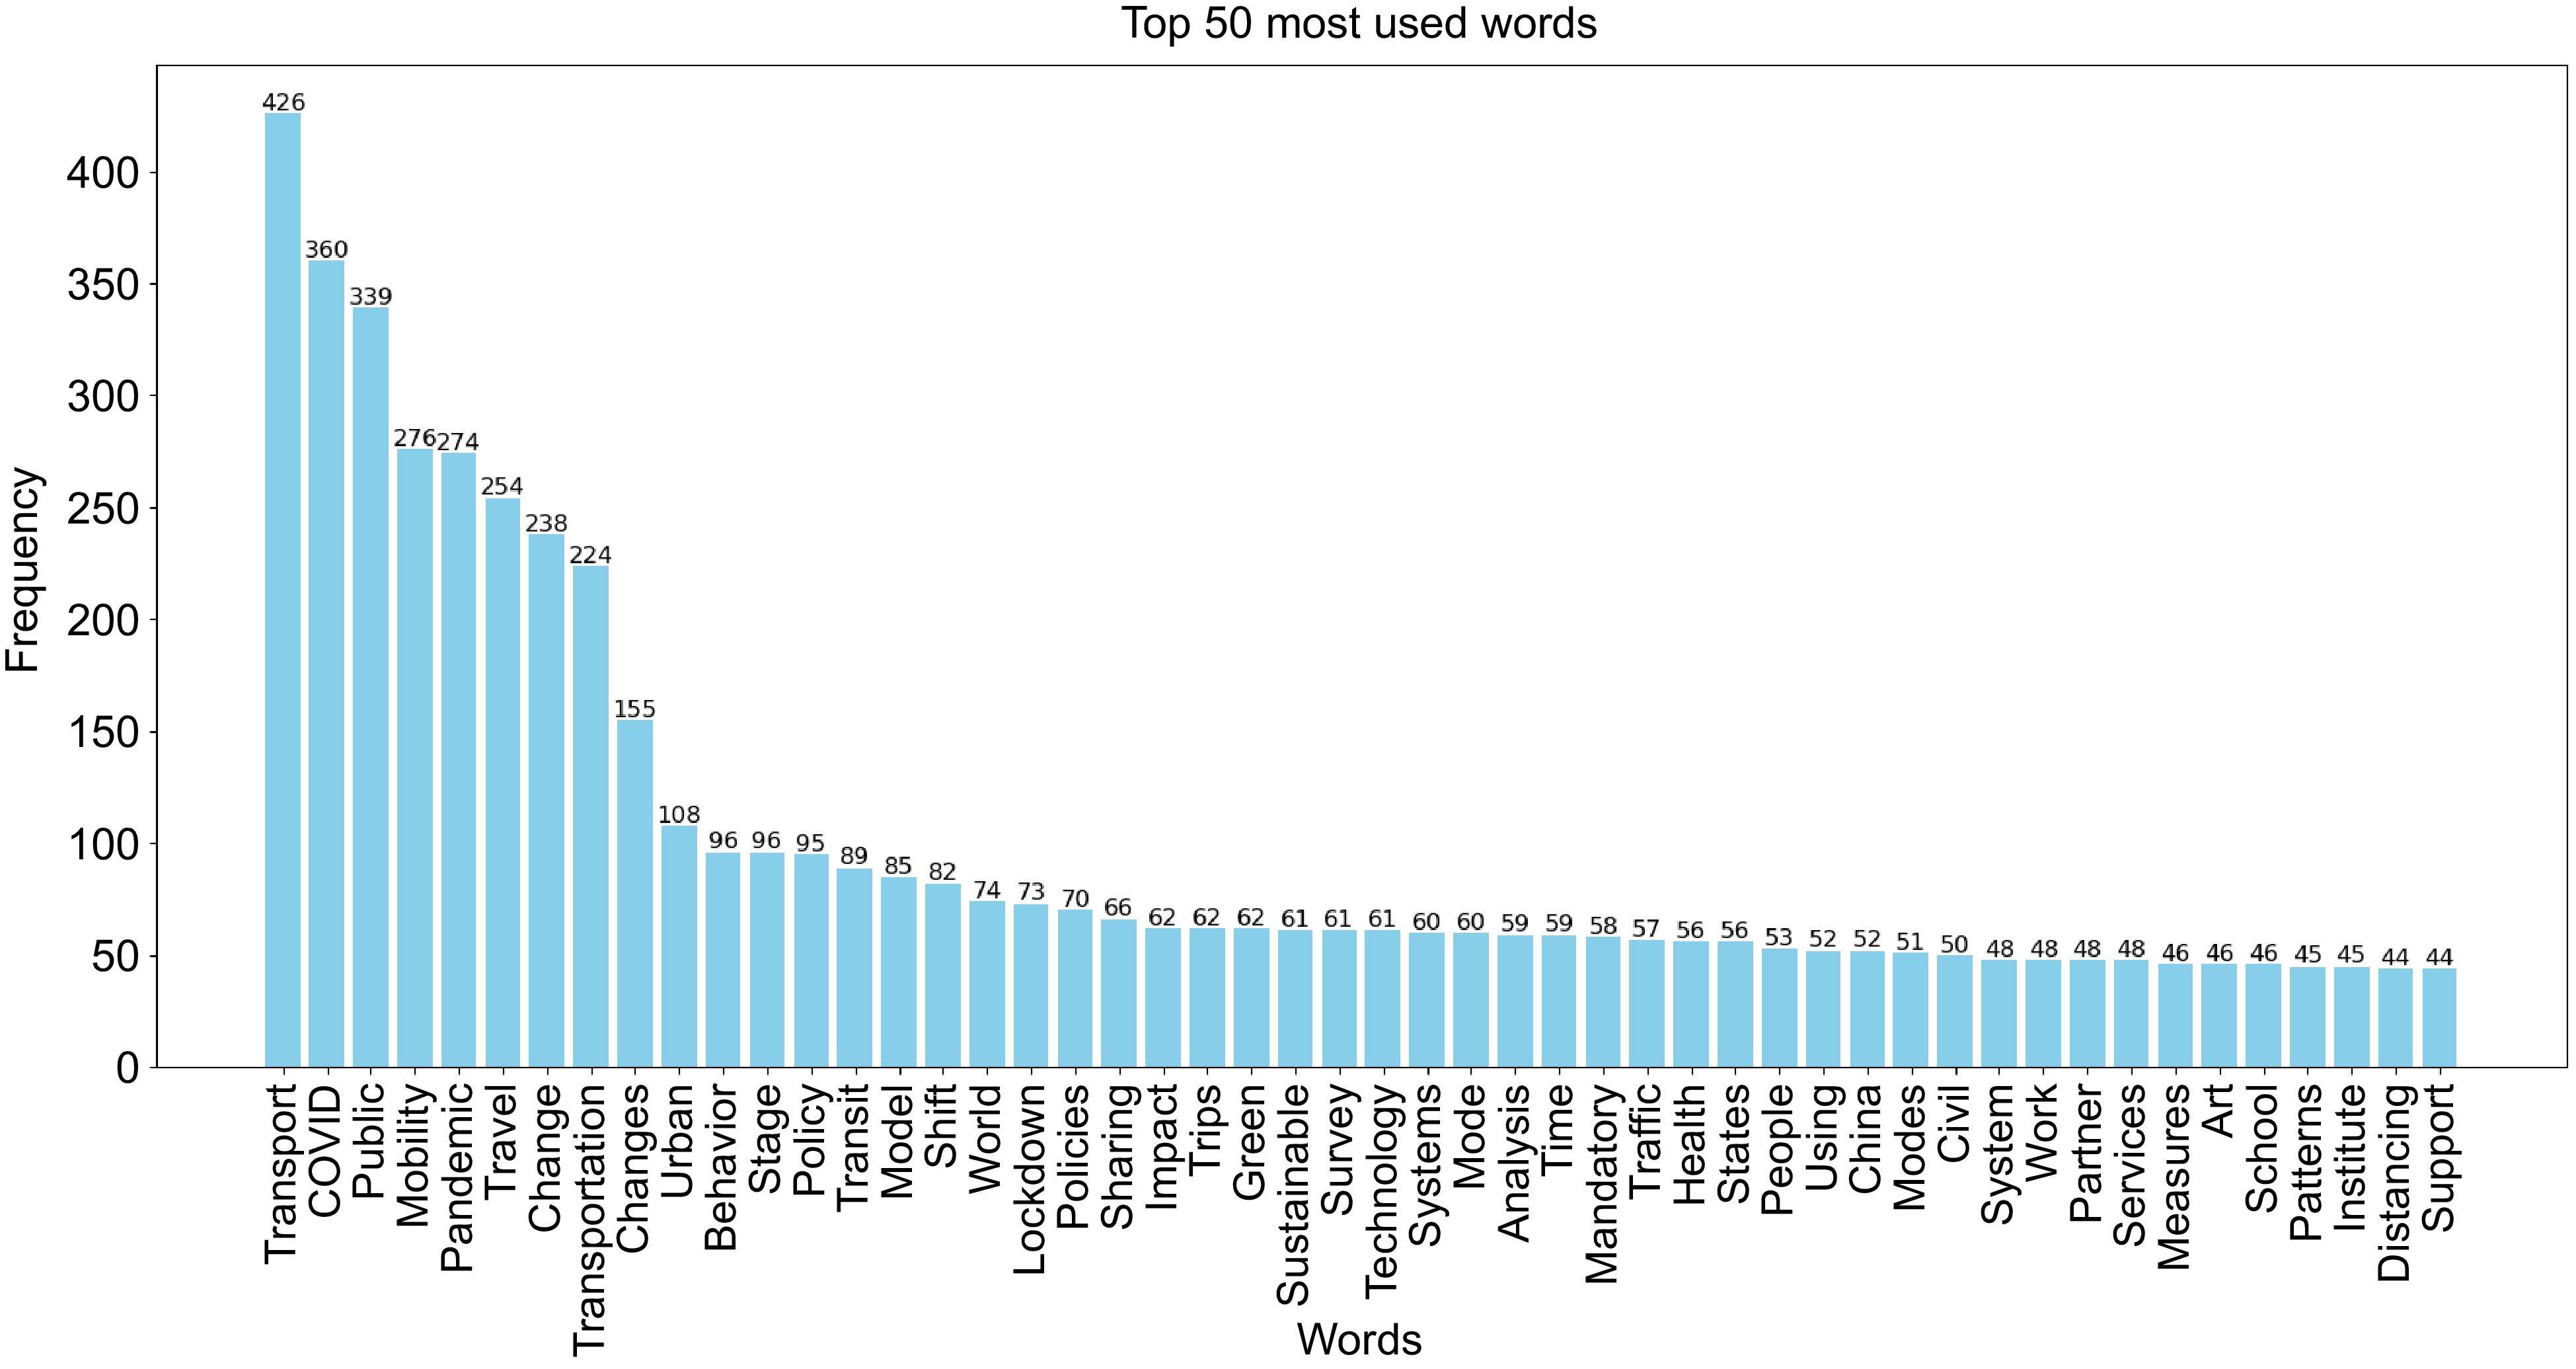
Figure 2.
Frequencies of the top 50 most used words in article abstracts.
The Natural Language Toolkit's (NLTK) Punkt tokenizer was leveraged in Python for sentence splitting. Additionally, a stop word list was employed to clean the textual data from the 96 reviewed papers. Analyzing these high-frequency words provides a glimpse into the main topics discussed across the papers.
For instance, words like 'public', 'mobility', 'changes', 'urban', and 'travel' appeared frequently. Interestingly, terms related to 'policies', 'sustainability', and 'green' were also used quite often. Notably, the prominence of words associated with 'change', 'sharing', and 'behavior' suggests a focus on public mobility and how urban behavior has changed. Additionally, words like 'transit', 'share', and 'system' indicate discussions on various modes of transportation, including mobility sharing and public transit systems. Similarly, the presence of terms like 'traffic', 'demand', and 'patterns' imply that traffic demand and patterns might have been analyzed for different modes of transportation.
However, this preliminary analysis offers limited insights. To gain a deeper understanding of the thematic landscape, a Keyword Co-Occurrence analysis was conducted based on the keyword interpretations derived from topic modeling.
Keyword co-occurrence diagram
-
Next, VOSviewer was employed, a text-mining tool, to conduct an in-depth analysis of the two-dimensional co-occurrence patterns of keywords (Fig. 3). Following this analysis, the keywords identified were simplified in the co-occurrence diagram by grouping them into three overarching themes based on their thematic dominance.
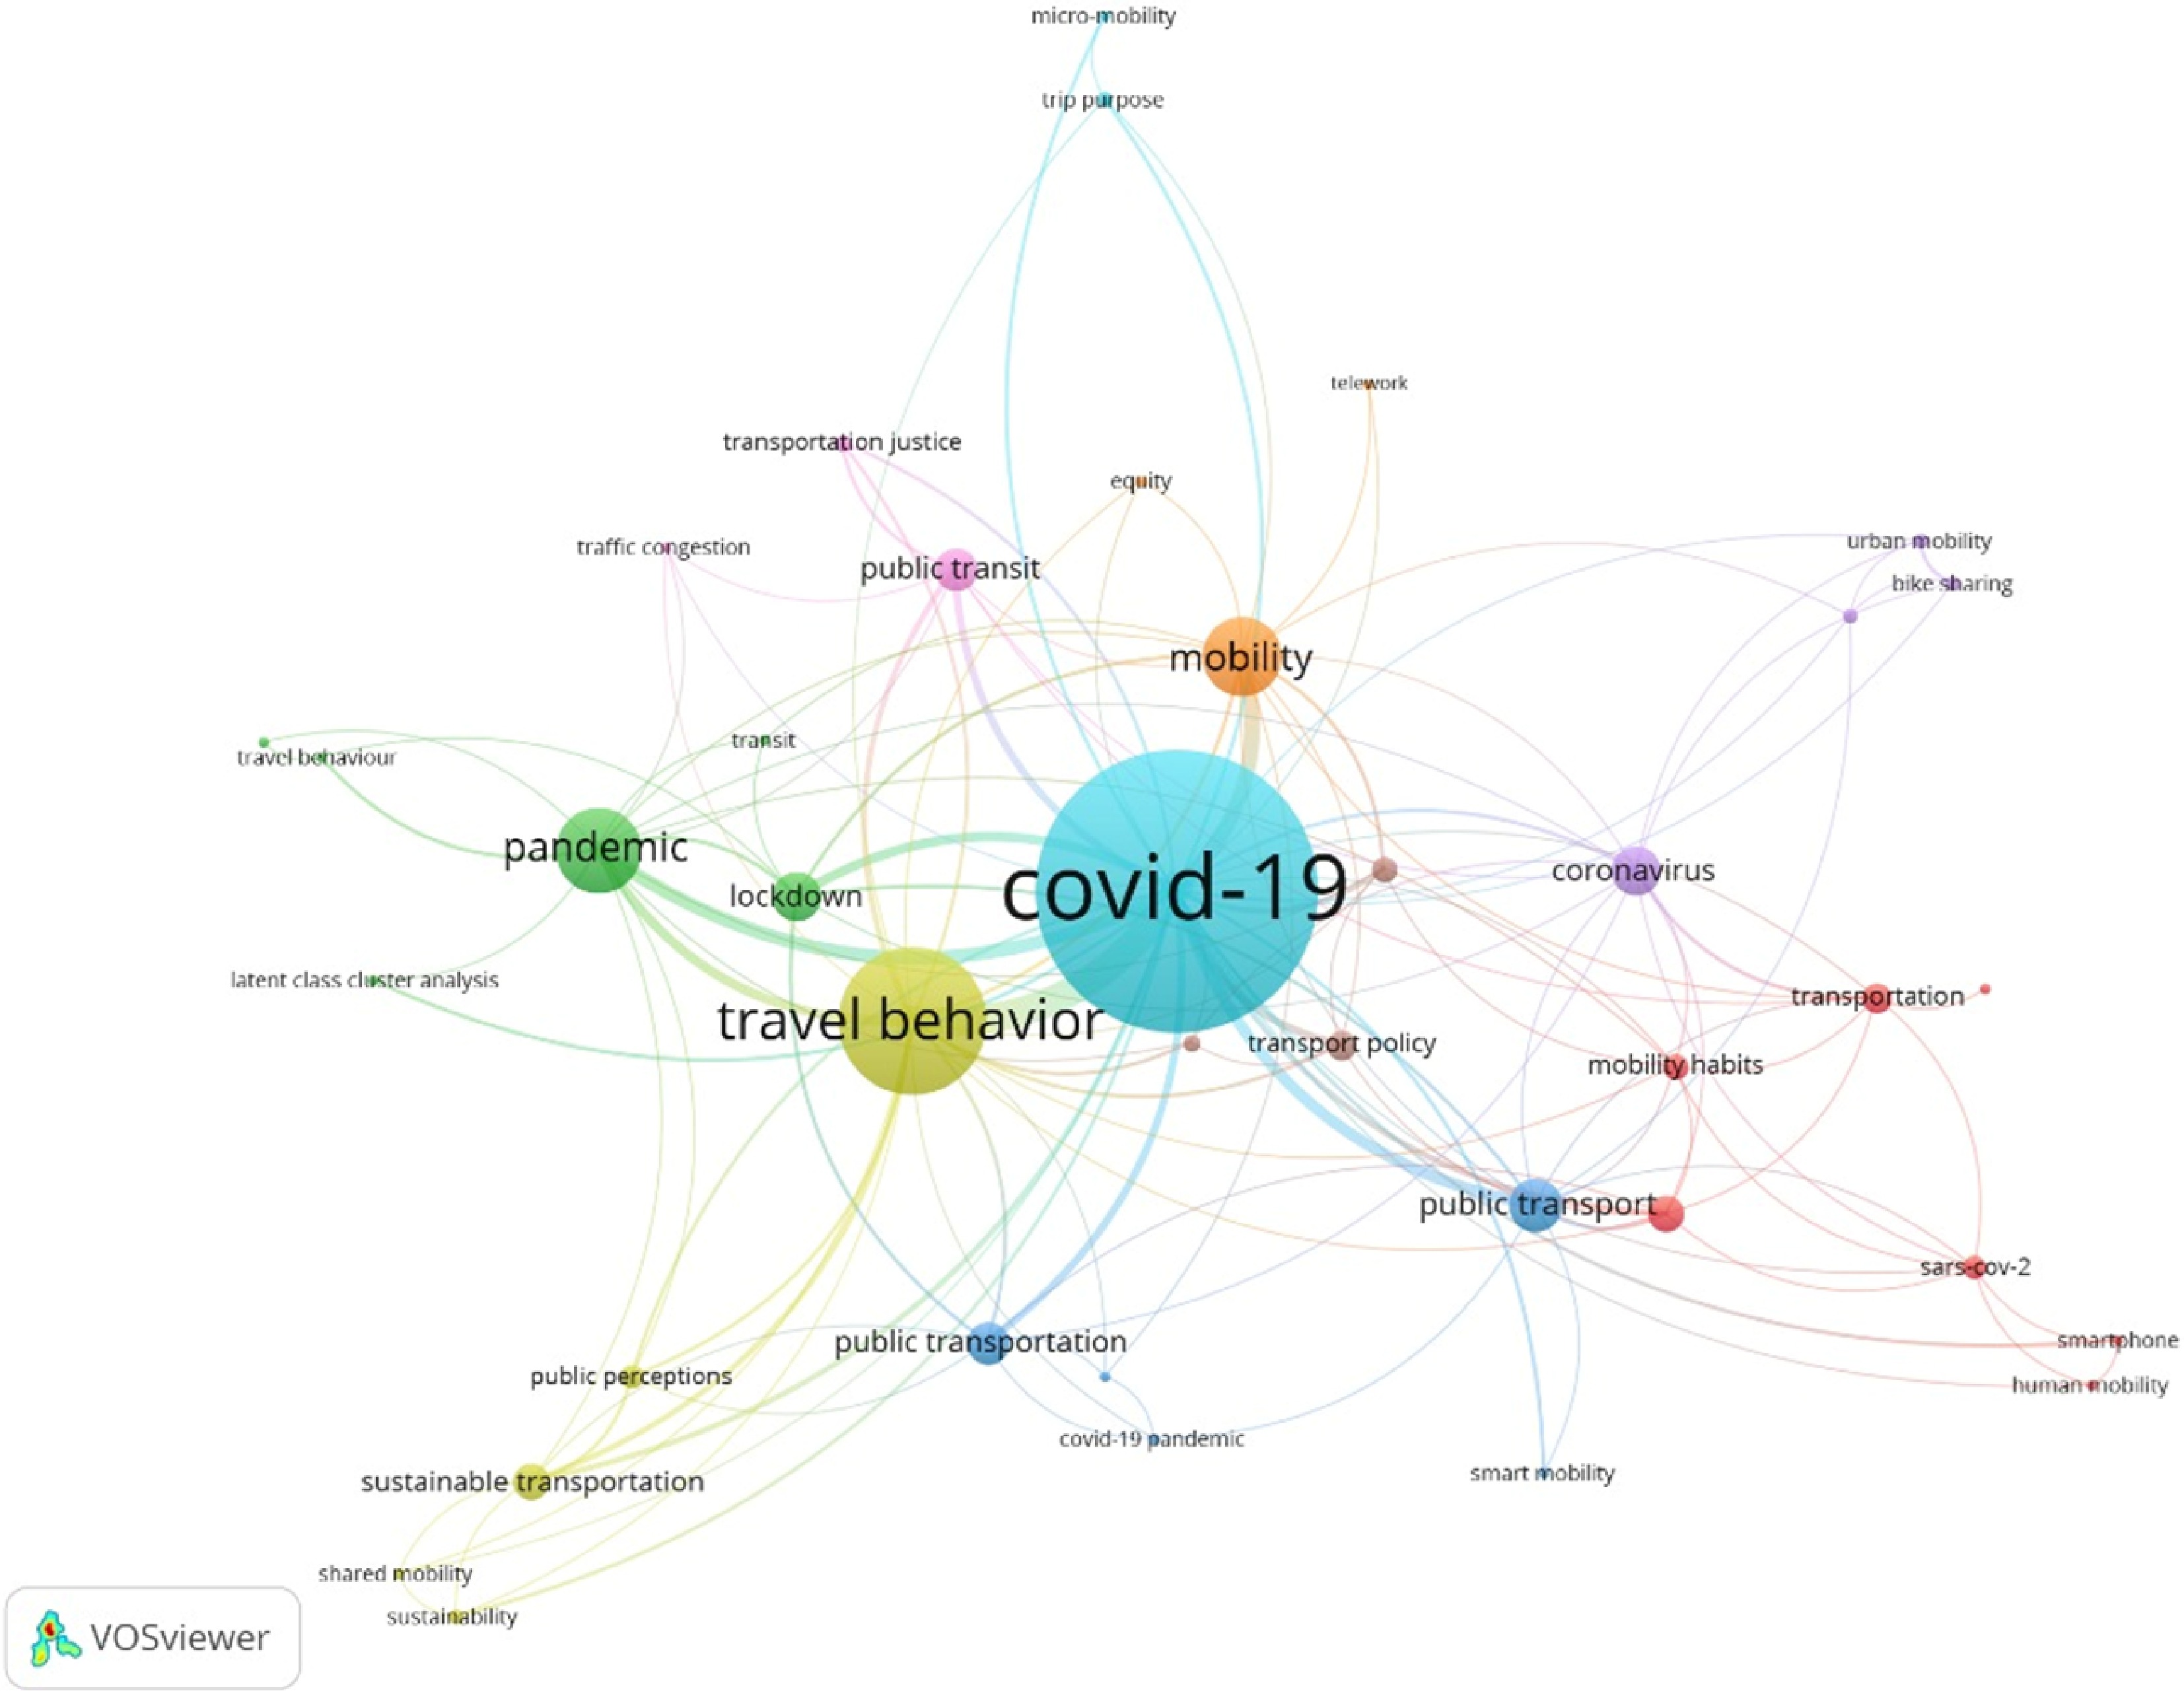
Figure 3.
Keyword Co-Occurrence of 96 papers.
Figure 3 depicts the co-occurrence of keywords extracted from the 96 reviewed papers, visualized using VOSviewer text mining software. The illustration reveals nine distinct research lines represented by nine colors.
Thematic analysis of research lines:
(1) Light blue cluster: This cluster, with the largest area, focuses on the impact of COVID-19 on travel behavior, specifically its effects on micro-mobility, trip purpose, and public transportation.
(2) Dark blue cluster: While this cluster also touches upon the impact of COVID-19, it has a more specific focus on public transportation. It likely explores the pandemic's unique effects on ridership, service provision, and potential changes within public transportation systems.
(3) Straw-colored cluster: This cluster explores the relationship between travel behavior changes and broader transportation trends. It examines the influence of travel behavior on public perception shared mobility adoption, and sustainable transportation.
(4) Green cluster: This cluster investigates the interplay between the pandemic, travel behavior modifications, and transportation policies. It focuses on the pandemic's impact on travel behavior, the resulting traffic congestion patterns, and the effectiveness of lockdown policies.
(5) Orange cluster: This cluster focuses on the impact of telework and equity on mobility.
(6) Purple cluster: This cluster explores research related to shared urban mobility during the pandemic.
(7) Pink cluster: This cluster investigates primarily public transit and congestion.
(8) Brown cluster: This cluster examines the topic of transport policies.
(9) Red cluster: This cluster focuses on human mobility habits and their relationship with smartphones.
While the VOSviewer analysis identifies nine research lines, these can be logically grouped into three overarching themes based on their focus. These are:
(1) Impact on ride-hailing services
The light blue, red, straw, and purple clusters touch upon aspects of ride-hailing services (depending on the specific studies within those clusters), their impact on the mobility and change in behavior.
(2) Impact on mode preference
This theme could potentially encompass the light blue, dark blue, purple, straw-colored, and pink clusters. These clusters explore various aspects of travel mode selection including:
• Impact of COVID-19 on public transportation use (light blue, dark blue)
• Shared mobility options during the pandemic (purple)
• Influence of travel behavior changes on mode preferences (straw-colored)
• Public transit and congestion patterns (pink)
(3) Impact on trip purpose
This theme could potentially encompass the light blue, green, orange, and brown clusters. These clusters explore the reasons behind travel choices during the pandemic:
• Impact of COVID-19 on trip purposes (light blue)
• Travel behavior changes and their link to trip purposes (green)
• Impact of telework arrangements on travel needs (orange)
• Effectiveness of transport policies on trip purposes (brown)
• Impact of mobility habits due to COVID-19 (red)
This thematic grouping provides a more structured understanding of the diverse research directions. However, it's important to acknowledge that automated analysis using VOSviewer may not perfectly capture the nuances of each study. To address this limitation, manual screening was employed as an additional step.
Manual screening
-
In the third phase, four reviewers (the authors) manually screened and verified the three themes based on key findings, research objectives, and abstracts of the 96 selected articles (as depicted in Table 1). This manual verification process helps ensure the accuracy and robustness of the thematic grouping.
Table 1. Theme considerations of keywords from different colored clusters.
Keywords of different colored clusters (Fig. 3) Theme considerations after manual checking Telework Impact on Ride Hailing Services:
In this theme, keywords and topics related to shared modes of transport, ride hailing services obtained via smartphone/tele networks, sustainable transportations used in ride hailing services and smart mobility options were considered.Bike sharing Transport policy Sustainable transportation Smart mobility Smartphone Shared mobility Sustainability Micro mobility Impact on Mode Preference:
In this theme, keywords and topics related to different types of modes like public transportation, micromobility options, motorized mobility and mobility habits and choices that affected mode choices were considered.Public transit Transit Mode choice Mobility habits Public transportation Public transport Trip purpose Impact on Trip Purpose:
In this theme, keywords and topics related to travel behavior and public perceptions regarding mobility that affected trip purpose were considered. In addition, the effect of traffic congestion was also taken into account.Traffic congestion Travel behavior Public perceptions Urban mobility Common Themes/Search Terms:
COVID-19 and its synonyms used throughout different literature were taken into consideration. For mobility, its synonyms were also considered.Human mobility Mobility Pandemic Lockdown Covid-19 Corona virus Transportation Sars Cov-2 Covid-19 pandemic Equity Other Items:
These keywords came out as prominent in different literature.Transportation justice Machine learning Latent class cluster analysis After identifying the three themes, they were further subdivided into sub-themes through manual screening by reviewers. Subsequently, the selected articles were assigned to the themes and sub-themes, considering and presenting any overlapping themes in Table 2.
Table 2. Theme and sub-theme distribution of reviewed literature.
Major theme Ref. Sub-theme Keywords Impact on Ride
Hailing Services[9−31]
Overlapped with Major Theme: Impact on Mode Preference − [46, 49, 51]
Overlapped with Major Theme: Impact on Trip
Purpose − [69, 97]Change of Demand and Usage Anthropogenic air pollution, autonomous public transport, autonomous vehicles, bicycles, bike sharing, bike sharing system, car use, COVID-19, case studies, demand responsive transport, diseases, disease prevention, emerging mobility, epidemic and pandemic, human and behavioral factors, information and communications technology (ICT), instrumental variables, literature review, modal shift dynamics, ordinal logistic regression, public transportation, public transport, ridership, safety perceptions, Seoul, sharing anxiety, smart cities, smart city, social factors, transportation demand, transportation policy, travel behavior, travel characteristics, urban form, urban mobility, urban planning Rise of
MicromobilityActive travel, bike sharing system, causal inference, cycling, COVID-19, e-scooter sharing system, food purchases, transportation means, spatial coupling, travel behavior, Saudi Arabia, spatiotemporal mean, user perception, lockdown, lockdown citi bike usage, urban greenway, micro-mobility, infrastructure intervention, mobility-as-service, natural experiment, yellow taxi demand, propensity score regression discontinuity Shift in service offering and safety measures Accident, car sharing usage, China, COVID-19, discrete choice modeling, generalized regret minimization, Heckman modeling, lockdown, ordered logit model, pandemic times, perception of risk, post-COVID-19 travel behavior, post-COVID-19 mobility public transport, random regret minimization, random utility maximization, ride-sourcing, road safety, shared mobility, sharing mobility, smartphone, sustainability, transport equity, travel behavior, travel mode choice, urban infrastructure, urban mobility, factor analysis, bike sharing motivations, perceived accessibility, sustainable transportation Socioeconomic Disparities Causal inference, coronavirus, COVID-19, COVID-19 effects, demand forecasting, discriminative pattern mining, health impacts, high-speed rail, instrumental variables, interpersonal distancing, mobility habits, mobility, multimodality, order-preserving traffic dynamics, public transport, recovery, ride-sharing, smartphone, suburban rail services, sustainable mobility, train capacity, transport equity, transportation, transportation planning, perceived accessibility, public transportation, lifestyle, teleworking, residential location Impact on Mode Preference [1−3,8,32−68]
Overlapped with Major Theme: Impact on Ride
Hailing Services −
[10, 12, 17, 21, 29, 31]
Overlapped with Major Theme: Impact on Trip
Purpose − [71, 76, 86, 87, 95]Personal Vehicles Active travel, anthropogenic air pollution, bluetooth traffic monitoring system, COVID-19, disease prevention, equity, generalized linear mixed effects mode, Google and Apple mobility data, greenhouse gas emissions, healthy cities, Indian cities, mobile device data, mobility, mobility-shift, multi-disciplinary, post-pandemic, prediction, public transport, resilient public transport, smart card data, smart mobility, transport modes, transport policy India, transportation demand, travel behavior, travel modes, university students, transportation, travel behavior, modal share, level of urbanization, lockdown, Slovenia Towards Public Transportation and Shared mobility Bicycles, big data analysis, bike sharing motivations, bike-sharing system, biking Barcelona, Bluetooth traffic monitoring system, capacity management, case studies, case study, commuting, coronavirus, COVID-19, diseases, dockless bike-share system, emergency, epidemic and pandemic, factor analysis, food purchases, health impacts, homelessness, human and behavioral factors, inequality, infection fear, lockdown, lockdown CITI bike usage, longitudinal case study, mixed methods, mobility, mobility behavior, mobility change, mobility habits, mode shift, new normal, pandemic, prediction, probabilistic machine learning, propensity score regression discontinuity, public perceptions, public transit, public transport, public transport networks, public transport planning, public transportation, quasi-experimental research, recovery period, resilient transport systems, ridership, rural areas, safety-and-mobility trade-off, sars-cov-2, Seoul, smart card data, smart mobility, social distancing, social equity, social factors, spatial compartmental model, spatial coupling, spatiotemporal, sustainability, sustainable, sustainable mobility, tactical urbanism, teleworking, transit, transport and mobility related inequalities, transport and society, transport policy, transportation, transportation justice, transportation means, transportation planning, travel behavior, urban mobility, work from home, yellow taxi demand, Air quality index, COVID-19 response Active Transportation Activity-travel, best-worst scaling, bike-sharing system, biking Barcelona, built environment, central businesses district (CBD), corona, COVID-19, daily commuting, discrete choice, equity, generalized linear mixed effects mode, google and apple mobility data, google mobility report, Indian cities, mobile device data, mobility, modal choice, mode choice, pandemic, passenger transport, person-miles traveled, policy, probabilistic machine learning, public transport, quasi-experimental research, smart city, social impact, structural equation modeling, sustainability, sustainable mobility, tactical urbanism, telecommuting, traffic psychology, transport, transport policy, travel behavior, travel modes, urban mobility, urban planning, working from home, active travel, bike sharing Impact on Trip Purpose [69−97]
Overlapped with Major Theme: Impact on Ride
Hailing Services − [20]
Overlapped with Major Theme: Impact on Mode Preference −
[34, 37, 55, 65, 67]Mode Choice on
Trip PurposeActivity-travel, activity chain, adaptive travel behavior, Americans with disabilities act (ADA), best-worst scaling, bike sharing systems, car use, causal inference, city periphery, COVID-19, covid-19 effects, COVID-19 strategies, disabled people activities of daily community, discrete choice, discrete choice model, disruptive events, dynamic CGE model, everyday leisure travel, GBDT model, global south, google mobility report, households, hurdle model, intercity bus transport, level of urbanization, lifestyle, lockdown, mobility, mobility patterns under epidemic modal choice, modal share, modal shift dynamics, modal split, non-mandatory activities, older adult, pandemic, paratransit, passenger transport services, people with disabilities, person-miles traveled, policy evaluation, public perceptions, public transit, public transport, public transport networks, public transportation, recovery period, recovery scenarios, residential location, ride-sharing, risk, safety perceptions, service contracting, service quality, Slovenia, social and recreational trips, social distancing, structural equation modeling, sustainable transport, sustainable transportation, telecommuting, teleworking, time-varying, transit, transport, transport and society, transport behavior, transportation equity, travel behavior Behavioral and Socioeconomic Effects Activity space, attitude towards teleworking, auctioning, coronavirus, commuting, COVID-19, daily commuting, demand management, equity, greater bay area (GBA), inequality, inflow control, latent class cluster analysis, mobile phone data, mobility, mobility habits, mode choice, movement control order, o–d flow, pandemic, pricing, public transit, public transport, public transportation, recovery, shopping, shopping trips, social exclusion, social inequity, spatial interaction, sustainable mobility, sustainable mobility, teleworking behavior, tradeable permit schemes, train travelers, transportation, travel behavior, travel frequency, travel patterns, trip purpose, work-based trips Finally, comprehensive review techniques like keyword extraction, key finding analysis, method analysis, etc. were employed to analyze various bibliographic features of the 96 reviewed articles. These features included location (country), study methodology, research timeline, trip purpose, analyzed modes, mode preference, and socioeconomic factors. Word cloud diagrams for the top 50 words were also used to show how the different literature revolved around certain keywords.
Full-text analysis of the selected literature was then conducted to examine the impact, trends, and behavioral factors influencing transportation mobility within the three identified themes. This analysis also aimed to identify potential recommendations and research gaps. The workflow of the research is presented in Fig. 4.
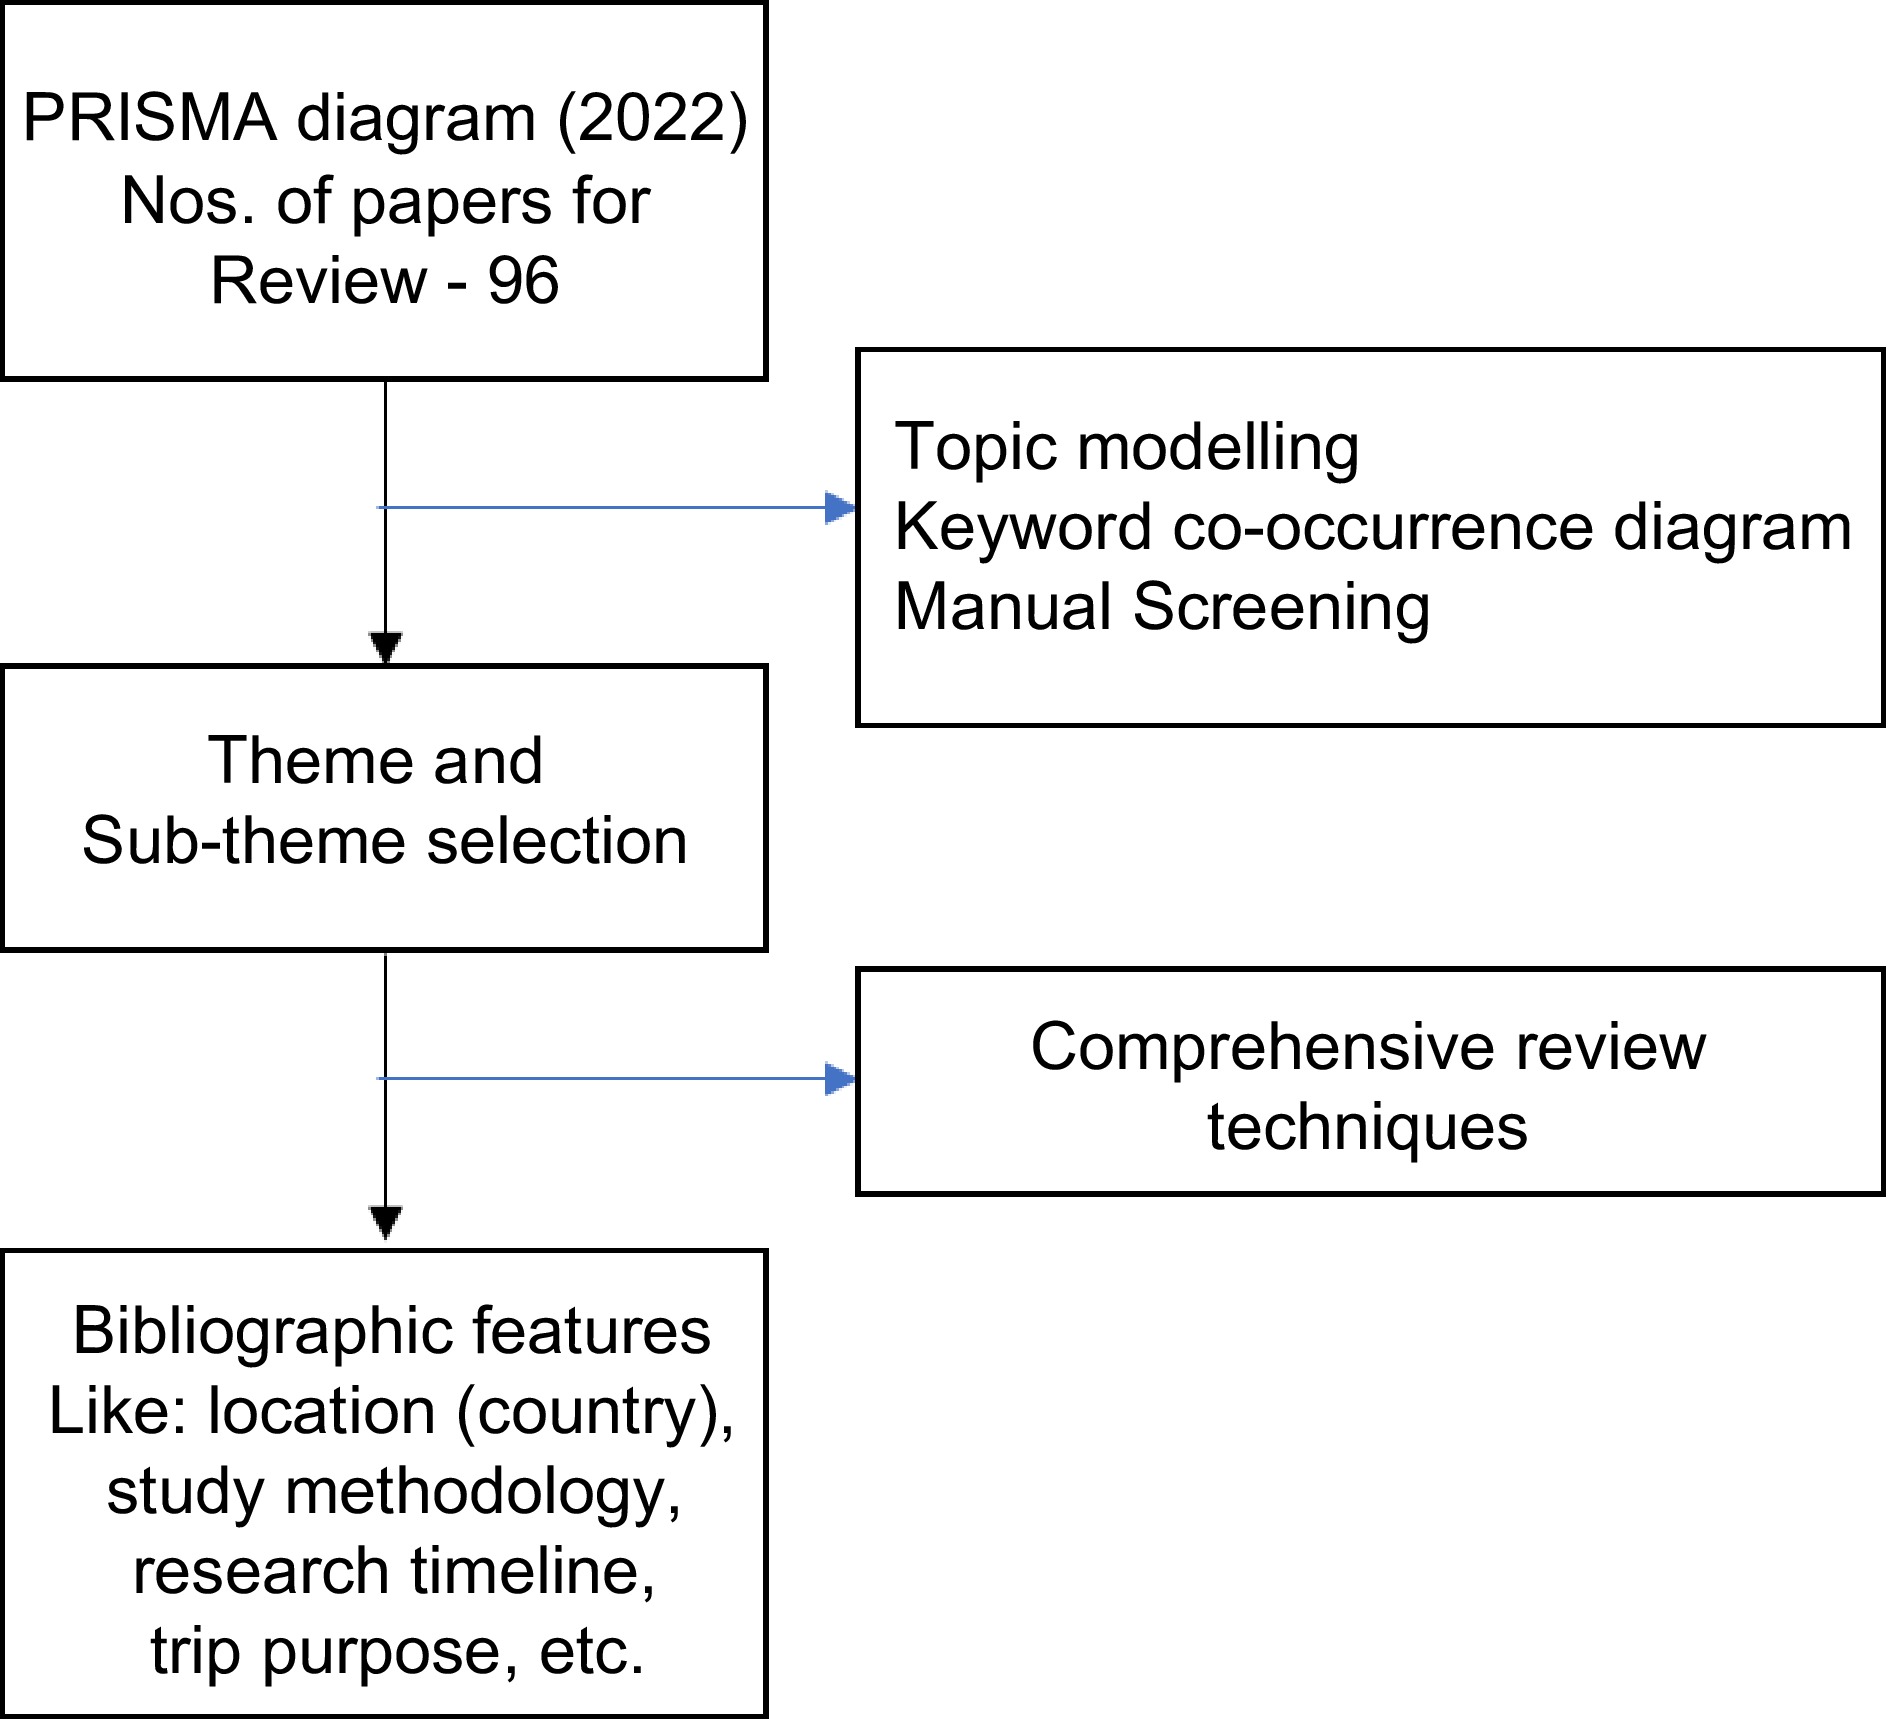
Figure 4.
Research workflow.
-
The selected 96 articles were published in 36 reputed peer-reviewed journals, where the top three journals were Transport Policy with 21 publications, Sustainability with 13 publications, and Transportation Research Part A: Policy and Practice with 10 publications. All the journal articles are presented in Fig. 5.
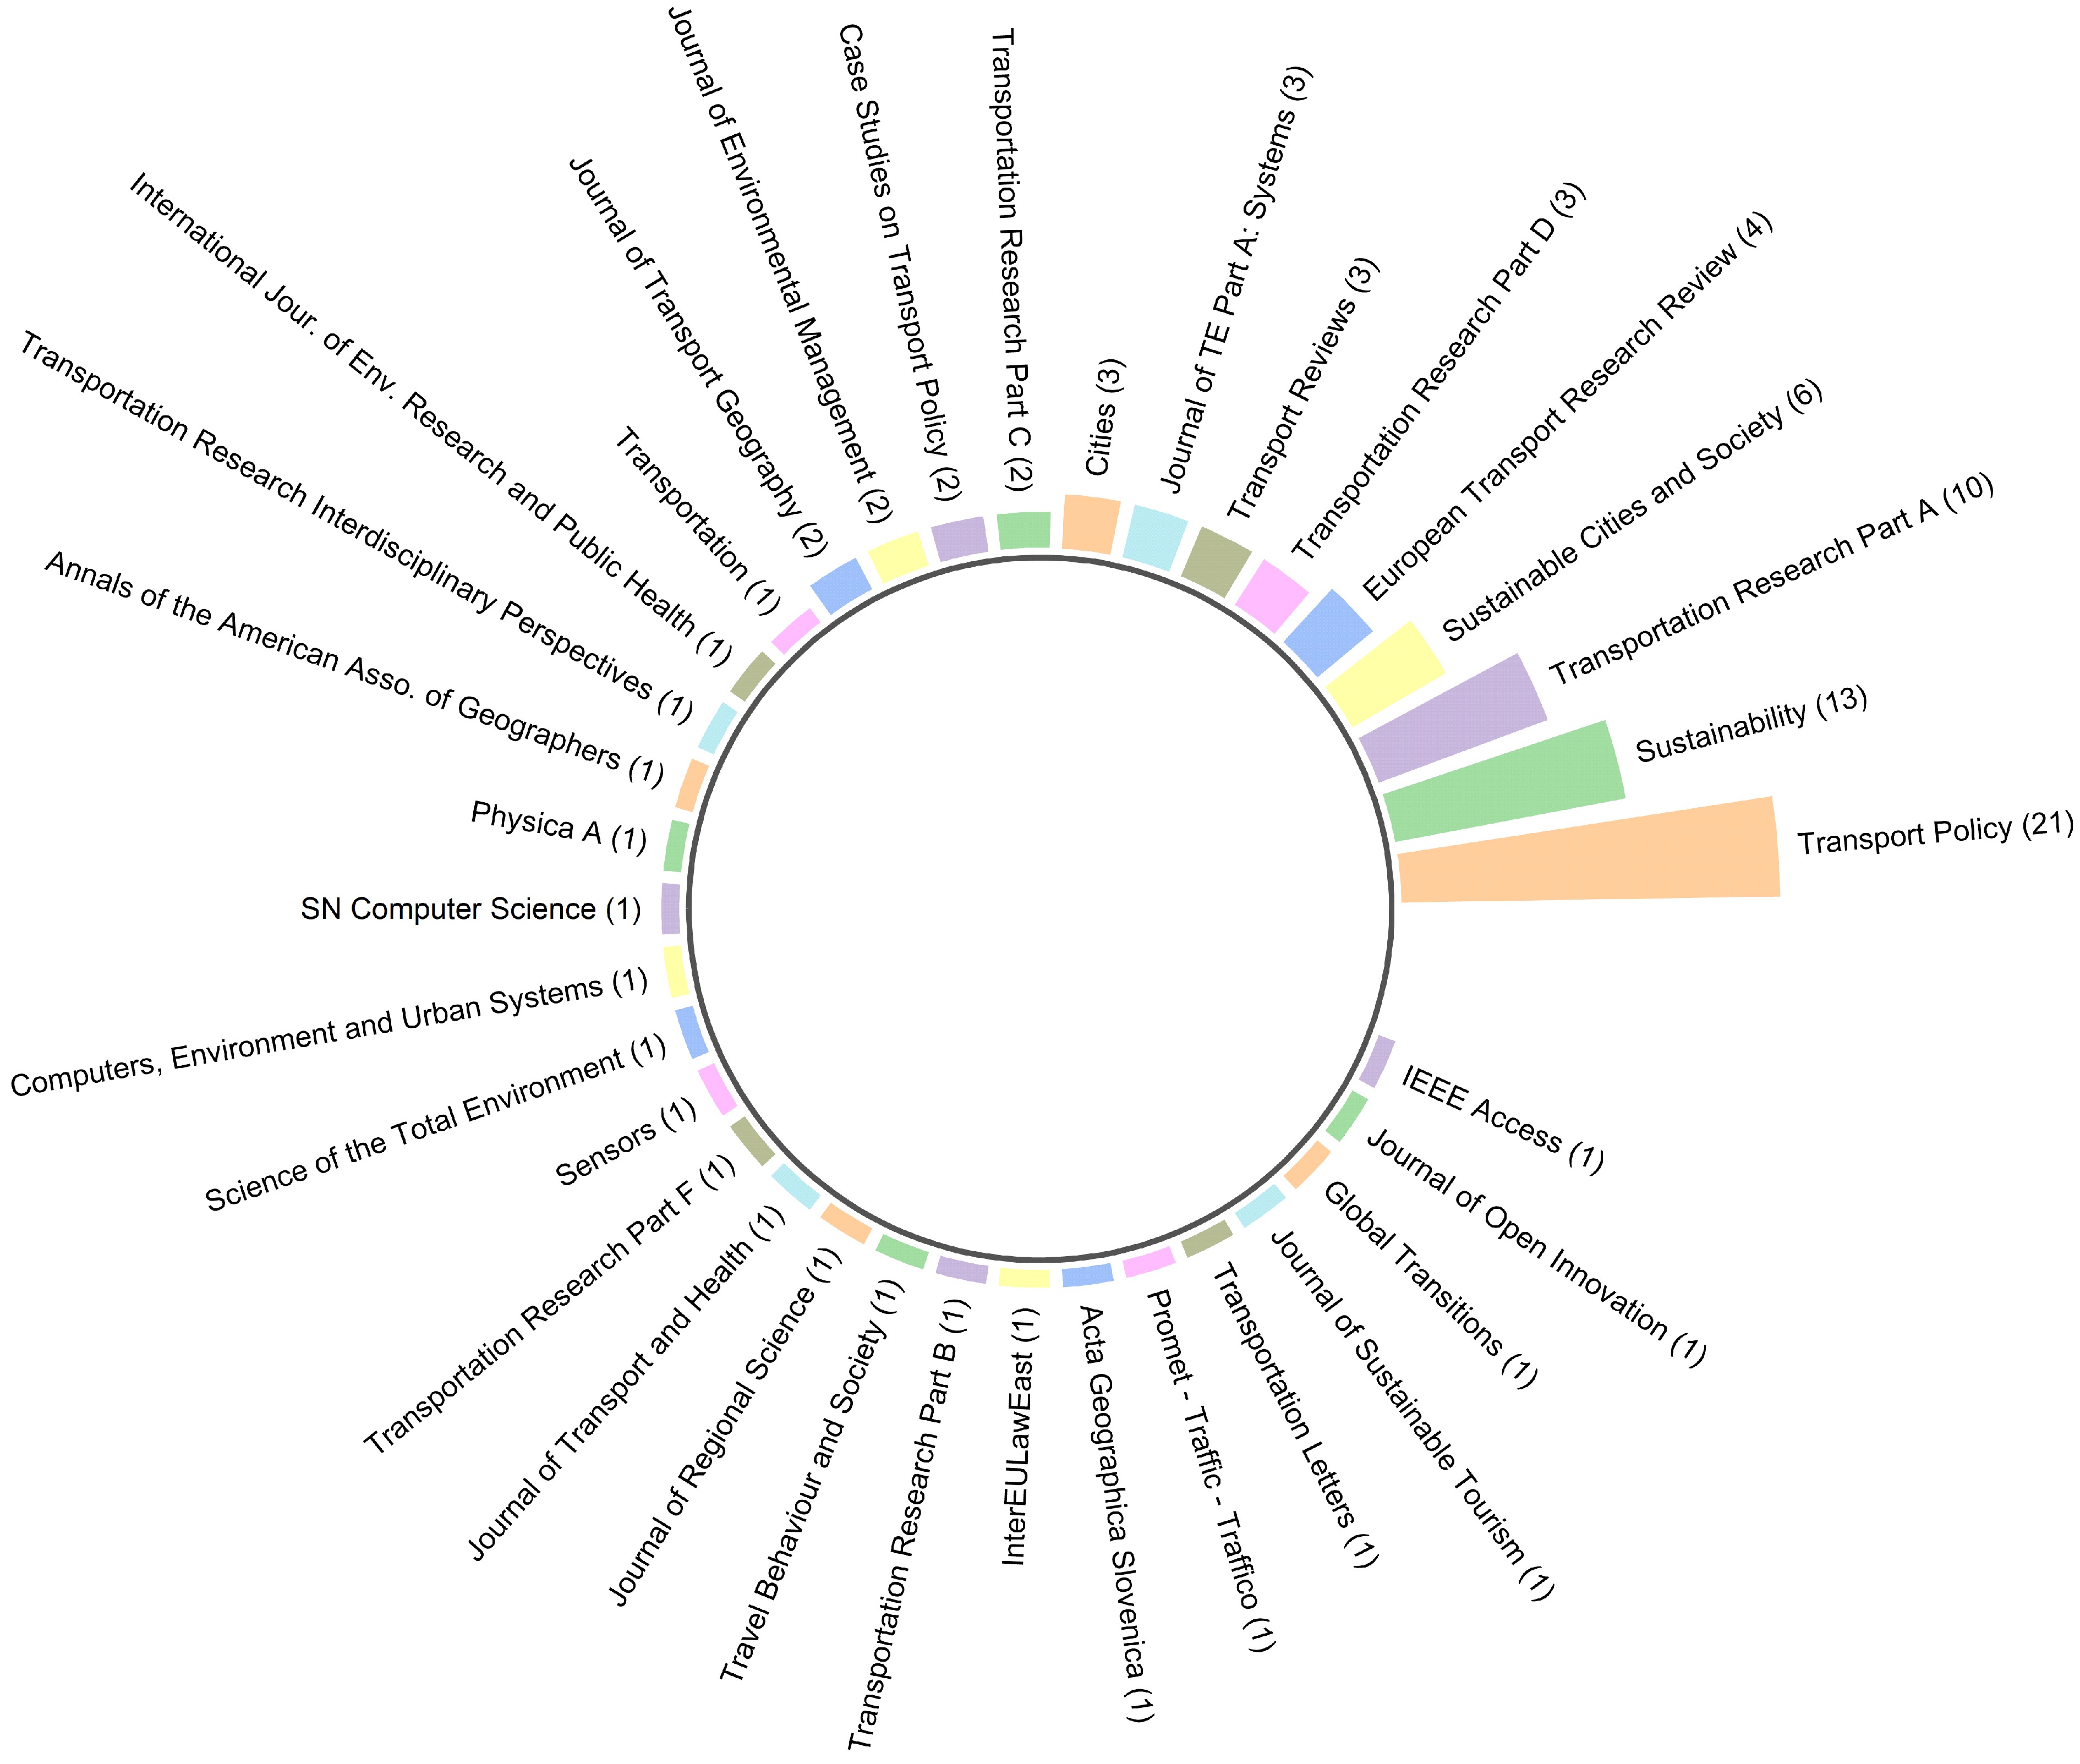
Figure 5.
Articles from different journals considered for detailed review and analysis.
Among the 475 primary selected papers, 96 papers from 36 academic journals were retained for systematic literature review. 69.8% of the papers conducted research during 2021, followed by 2022, and the least number of papers during 2020. This pattern coincides with the fact that by 2021, the pandemic had its highest infection rate and this started to decrease during 2022[1]. Unfortunately, 216 countries or territories were affected by this disease. Subsequently, in the 96 papers, research was conducted in 35 countries, where the USA was one of the most affected countries, showing the highest numbers of research (16 papers), followed by Spain (seven papers) and India (six papers) in second and third positions respectively. Again, eight papers focused on worldwide coverage, while five concentrated on Europe and other selected countries since lockdowns in countries globally started in March 2020 (except China) owing to the uncontrolled outbreak (Fig. 6). The distribution of papers in different countries around the globe is illustrated in Fig. 7.
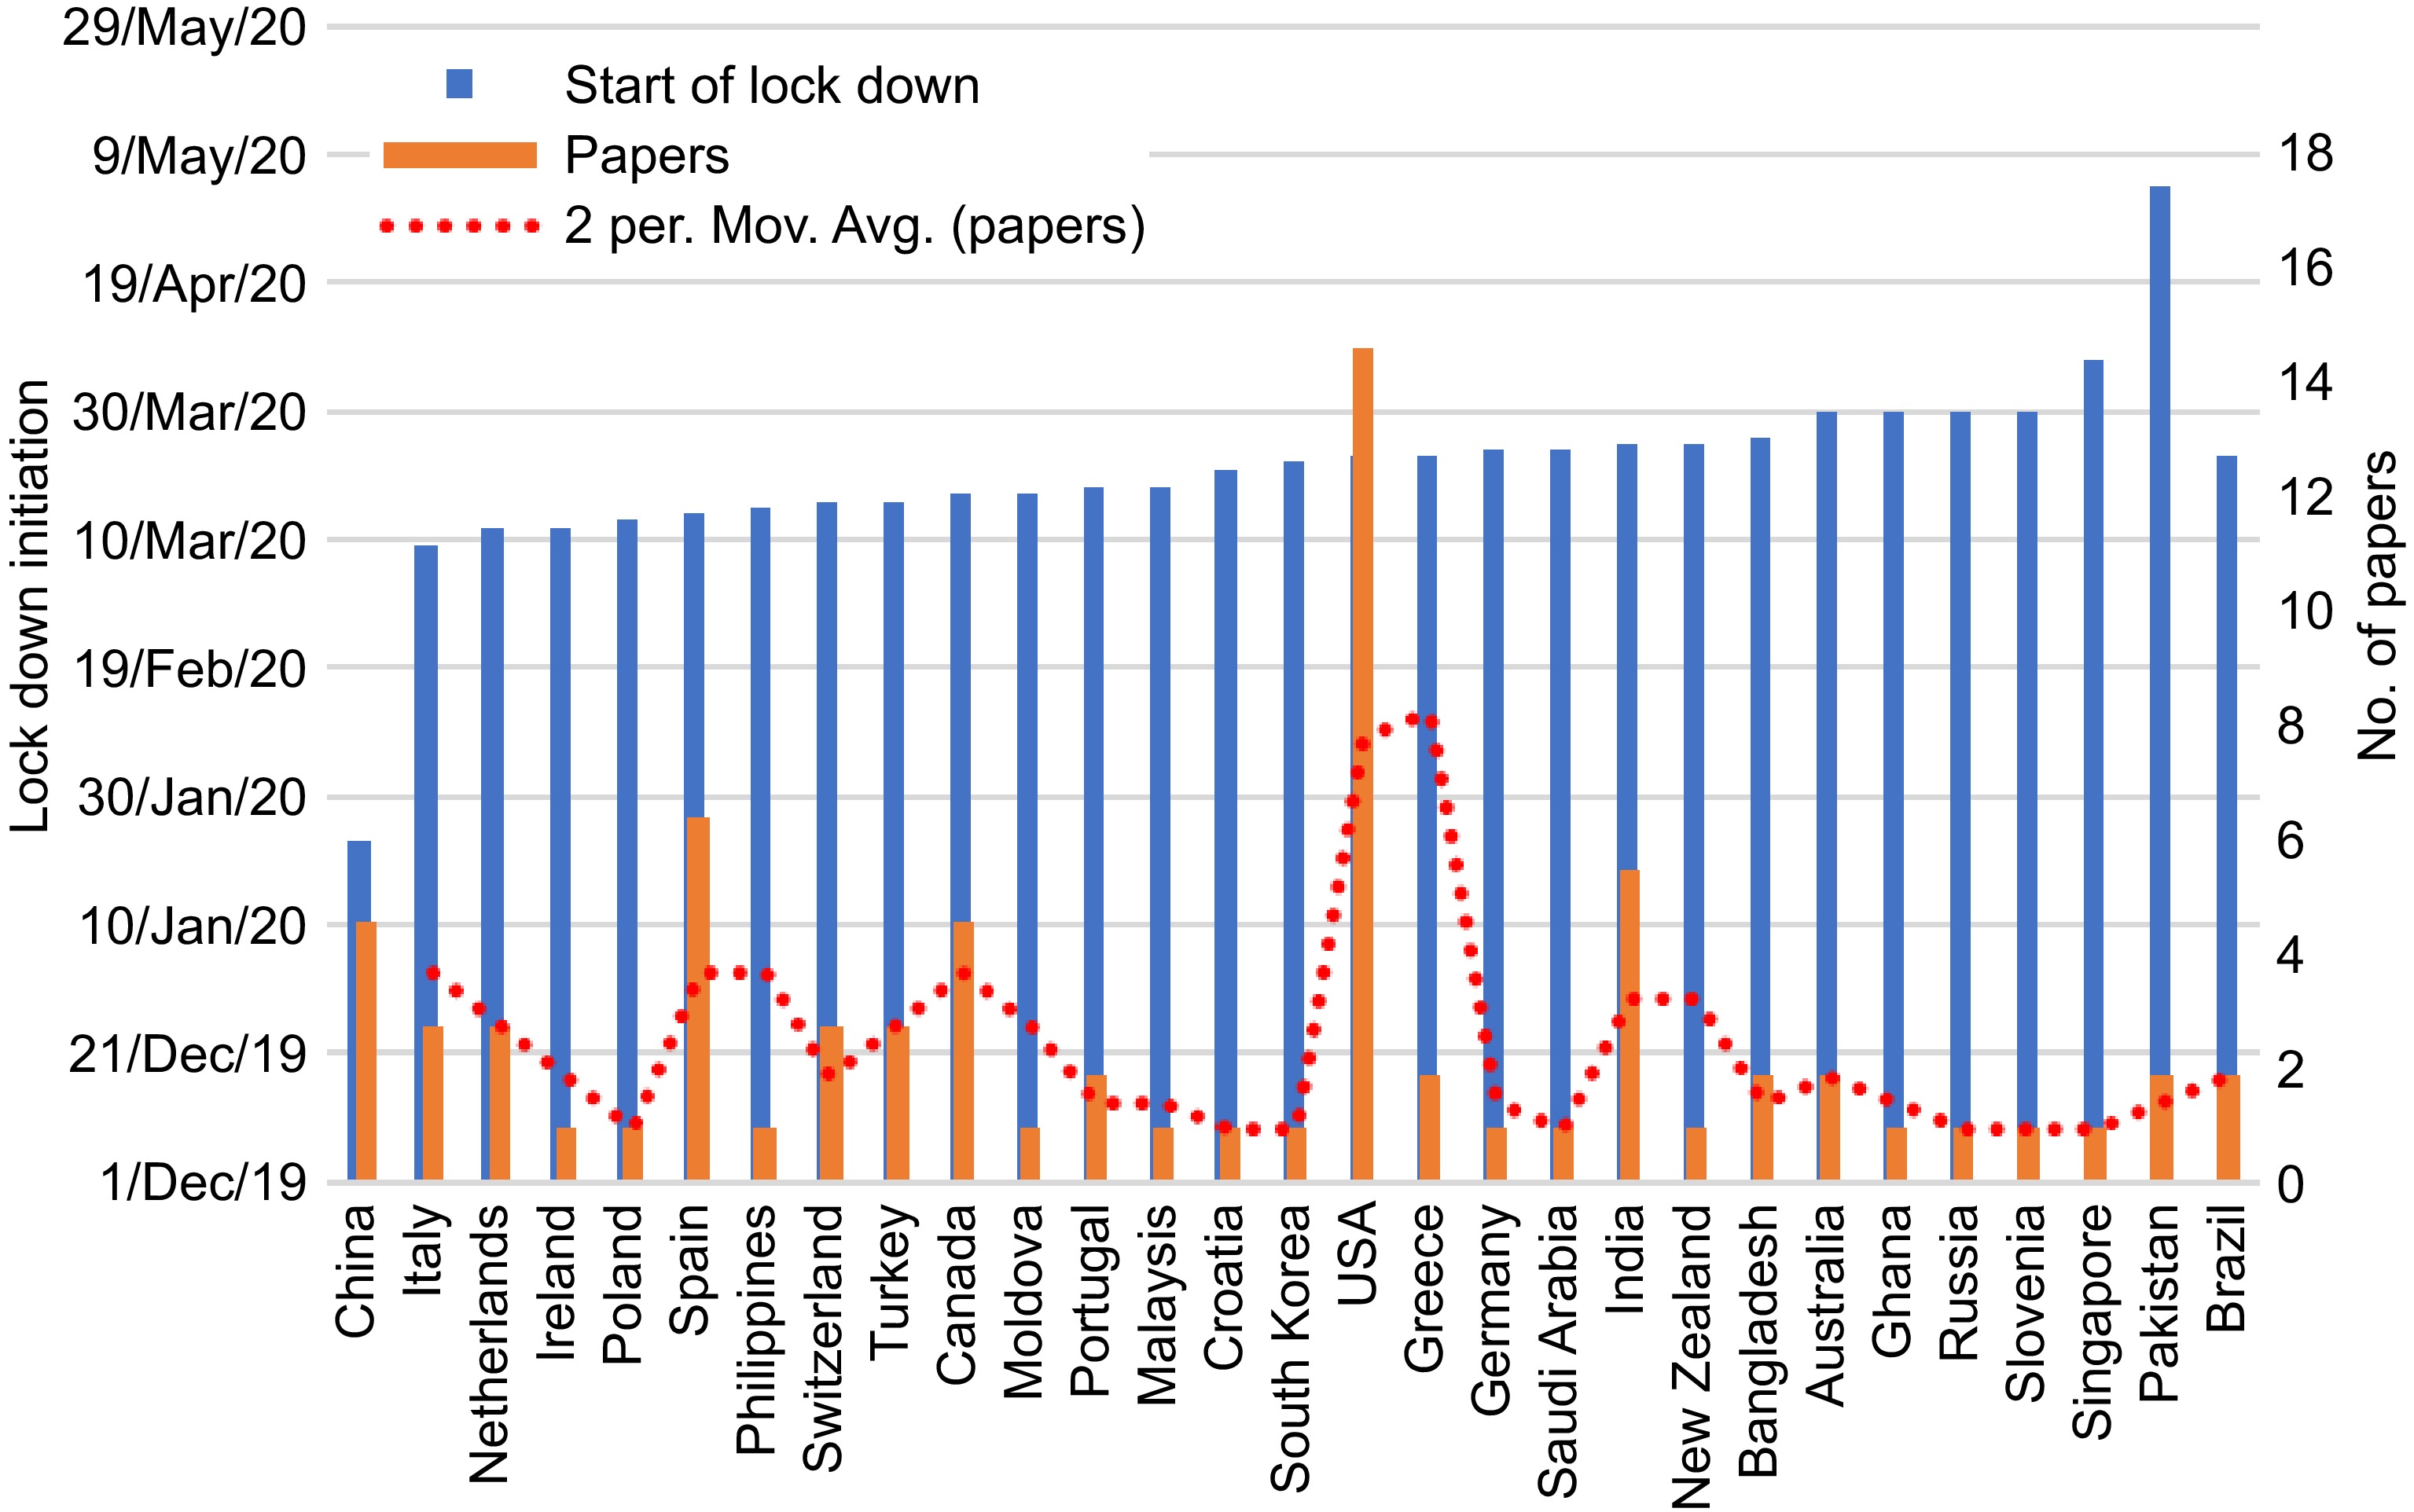
Figure 6.
Lockdown initiation date and origin location of the analyzed articles.
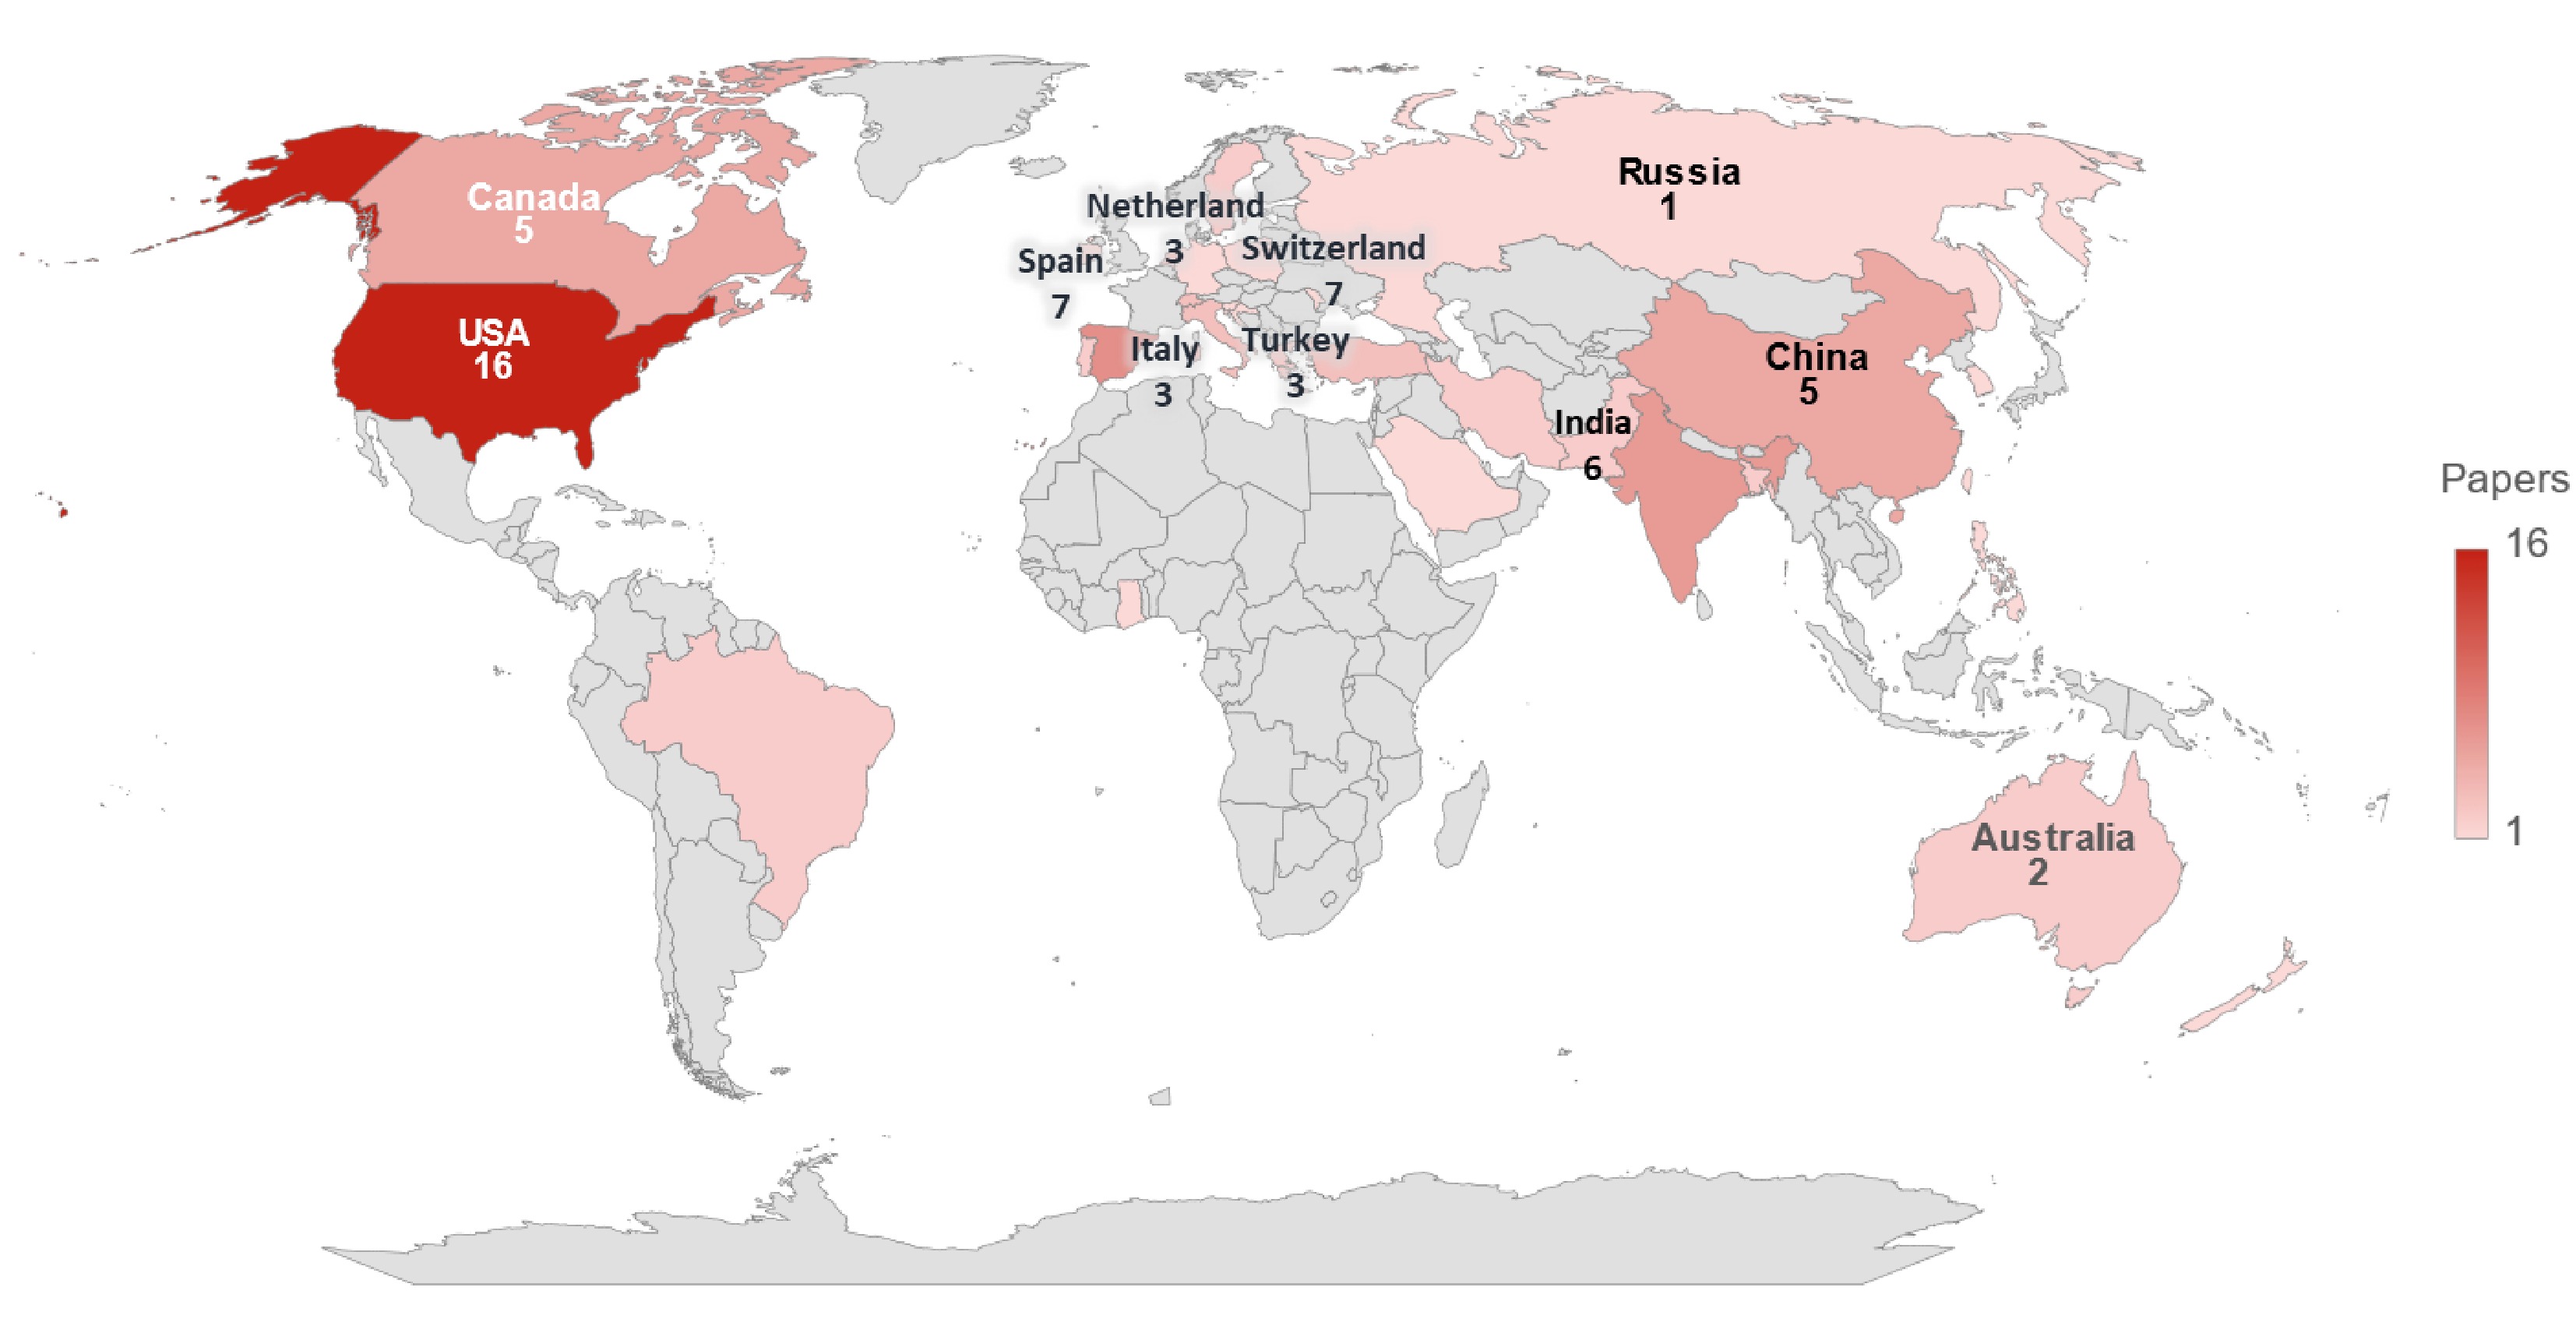
Figure 7.
Distribution of countries based on research location (highlighting the top 10 countries).
This dispersal was further analyzed through a Sankey diagram (Fig. 8) to illustrate the distribution of the selected papers across different countries and highlighting their contribution to each focal theme (Table 2). The size and position of the Sankey's segments correspond to the number and significance of papers from each country, where the USA had a key contribution in all the focal themes, followed by Canada and Spain. However, India, Switzerland, Iran, and Sweden, among others, lacked the ride-hailing theme. Furthermore, other countries focused on either a single theme that had a physical effect on their society or was expected to have a foreshadowing effect soon.
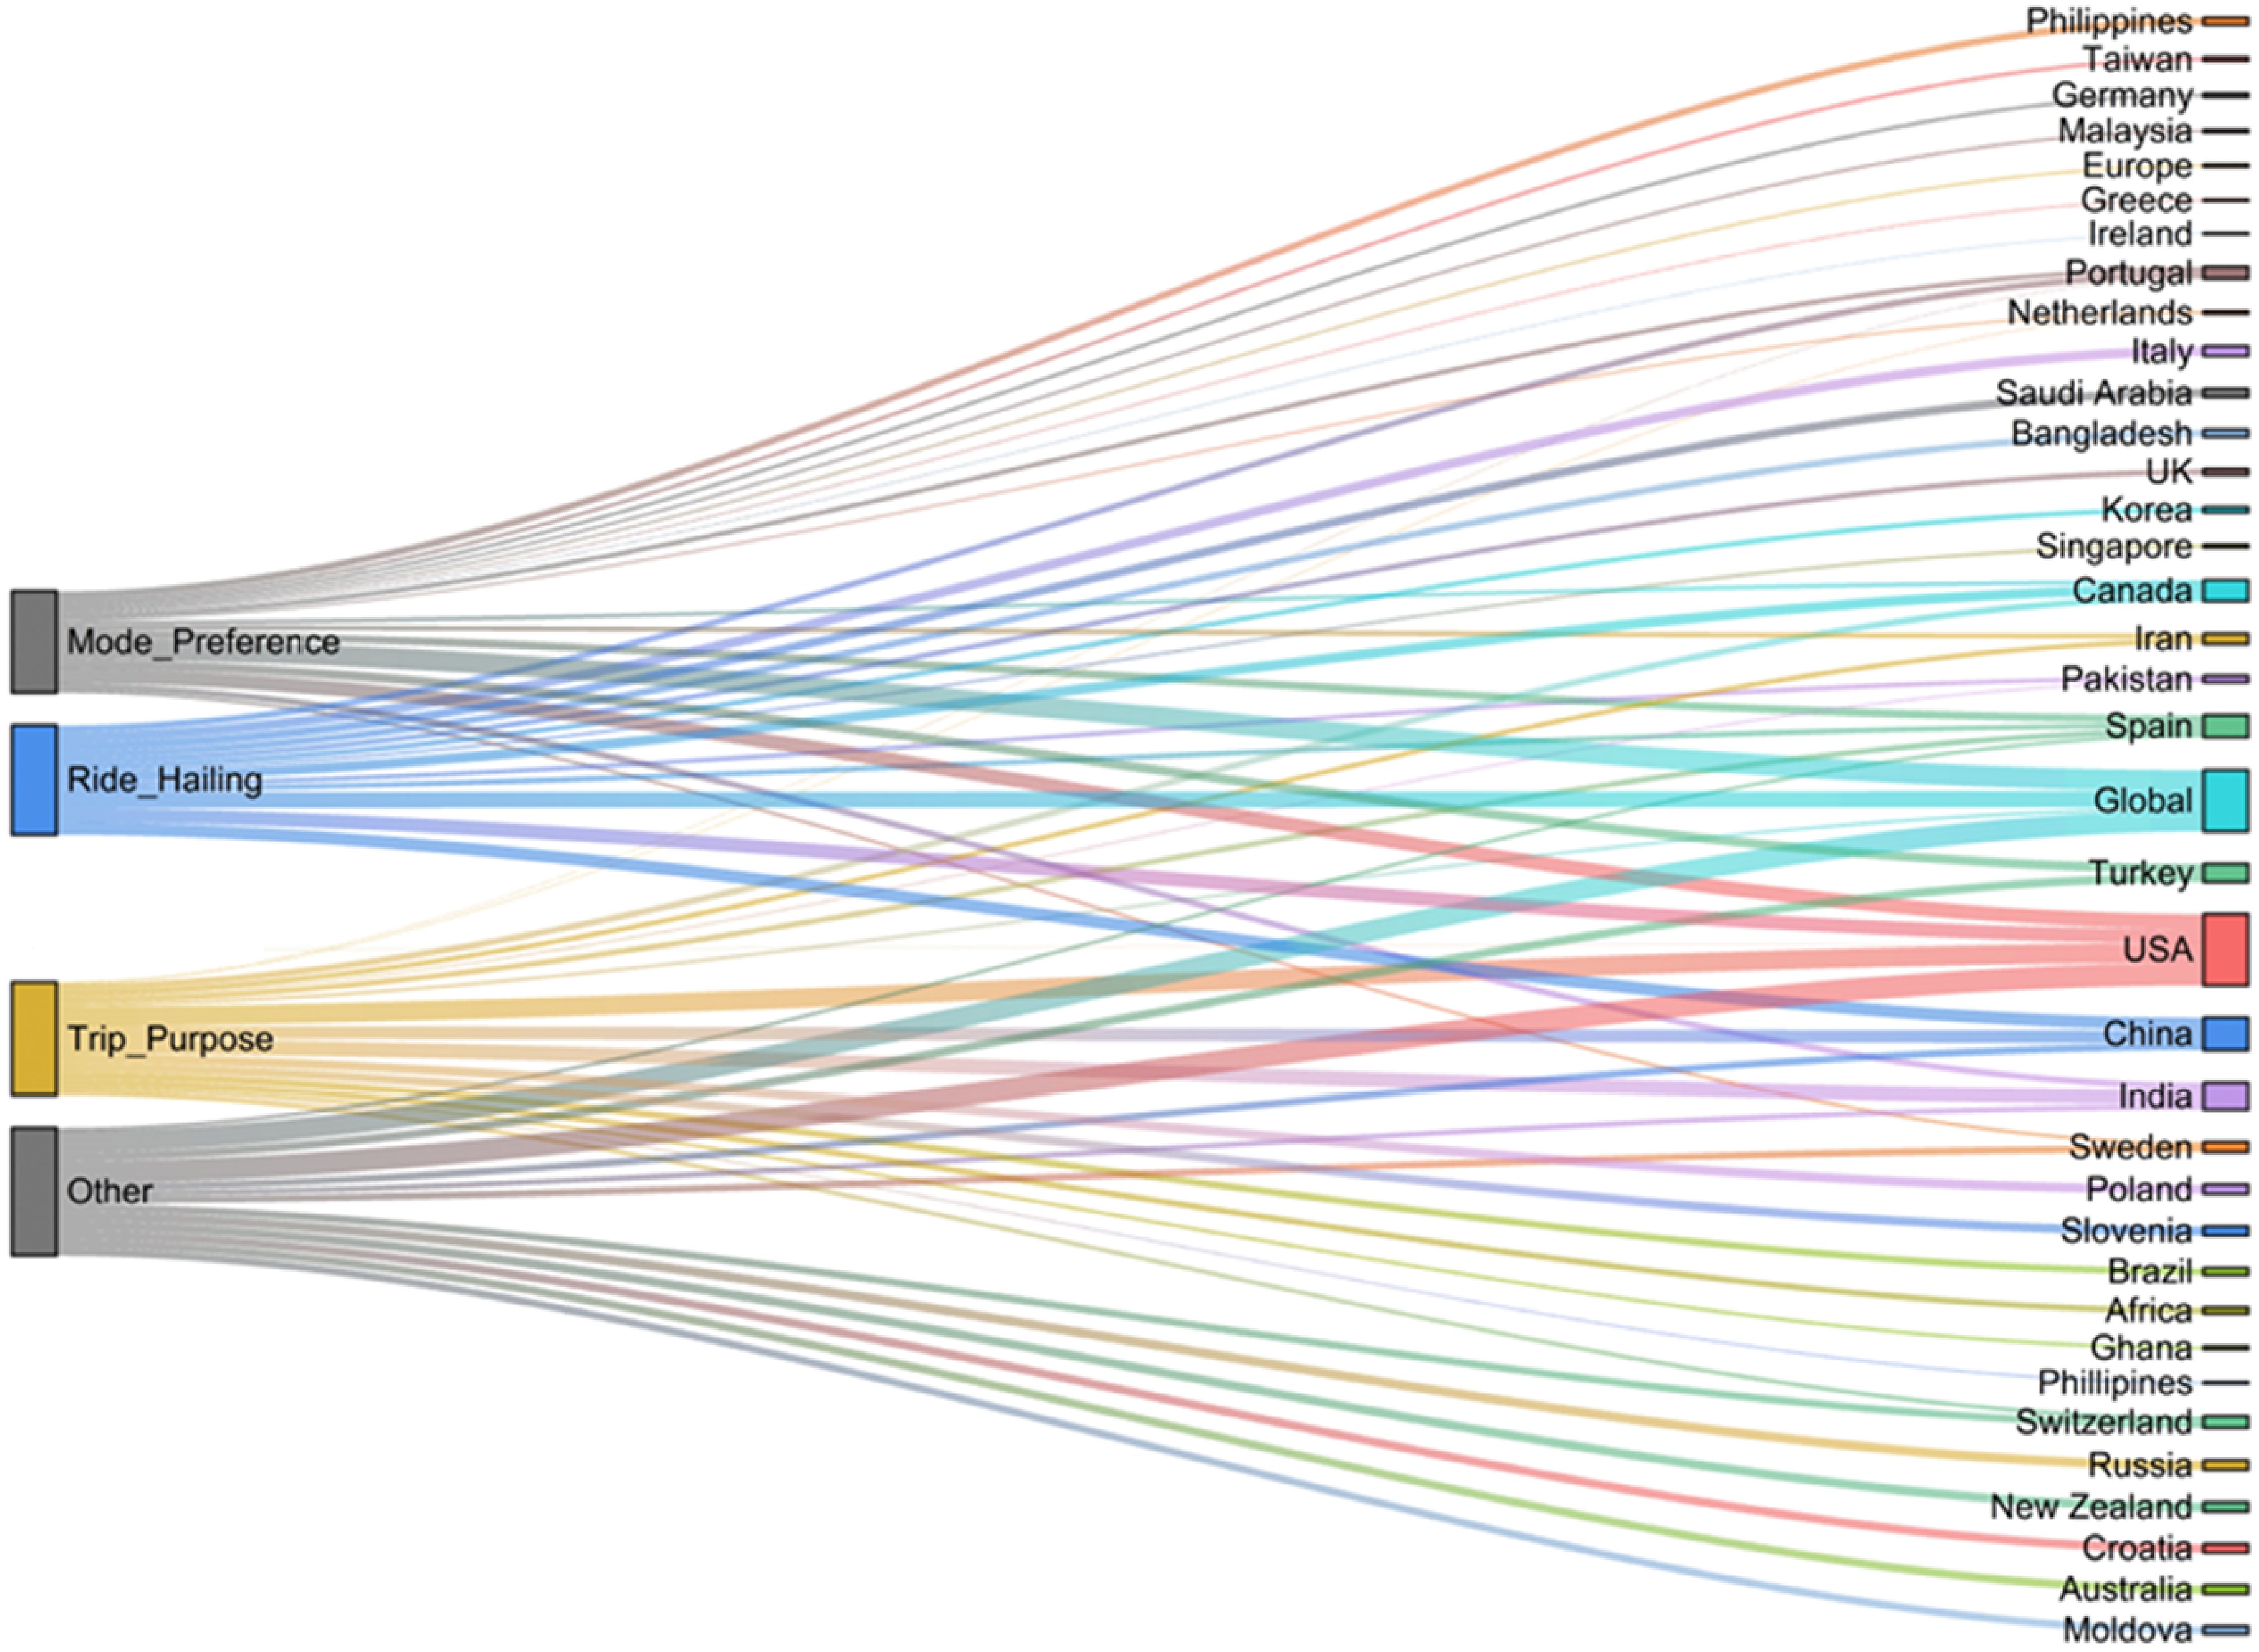
Figure 8.
Sankey diagram showing country of origin of the articles from three focal themes.
Interestingly, 44.8% of the papers were either interviews, survey-based, or hybrid, whereas the rest of the papers used secondary data for their analysis. In the interview/survey-based papers, 31 pieces of literature collected their data online, and only nine papers physically considered the pandemic situation. Web-based interviews/surveys usually provide a wide range of convenience and respondents even in distant places. However, this could serve as the nesting ground for various biases, including self-reporting and response and non-response biases[8], which decreased the accuracy of the analysis. On the other hand, all these papers conducted their research through general evaluation of reports (highest), model building, standard statistical analysis, case study, and literature reviews presented in Fig. 9.
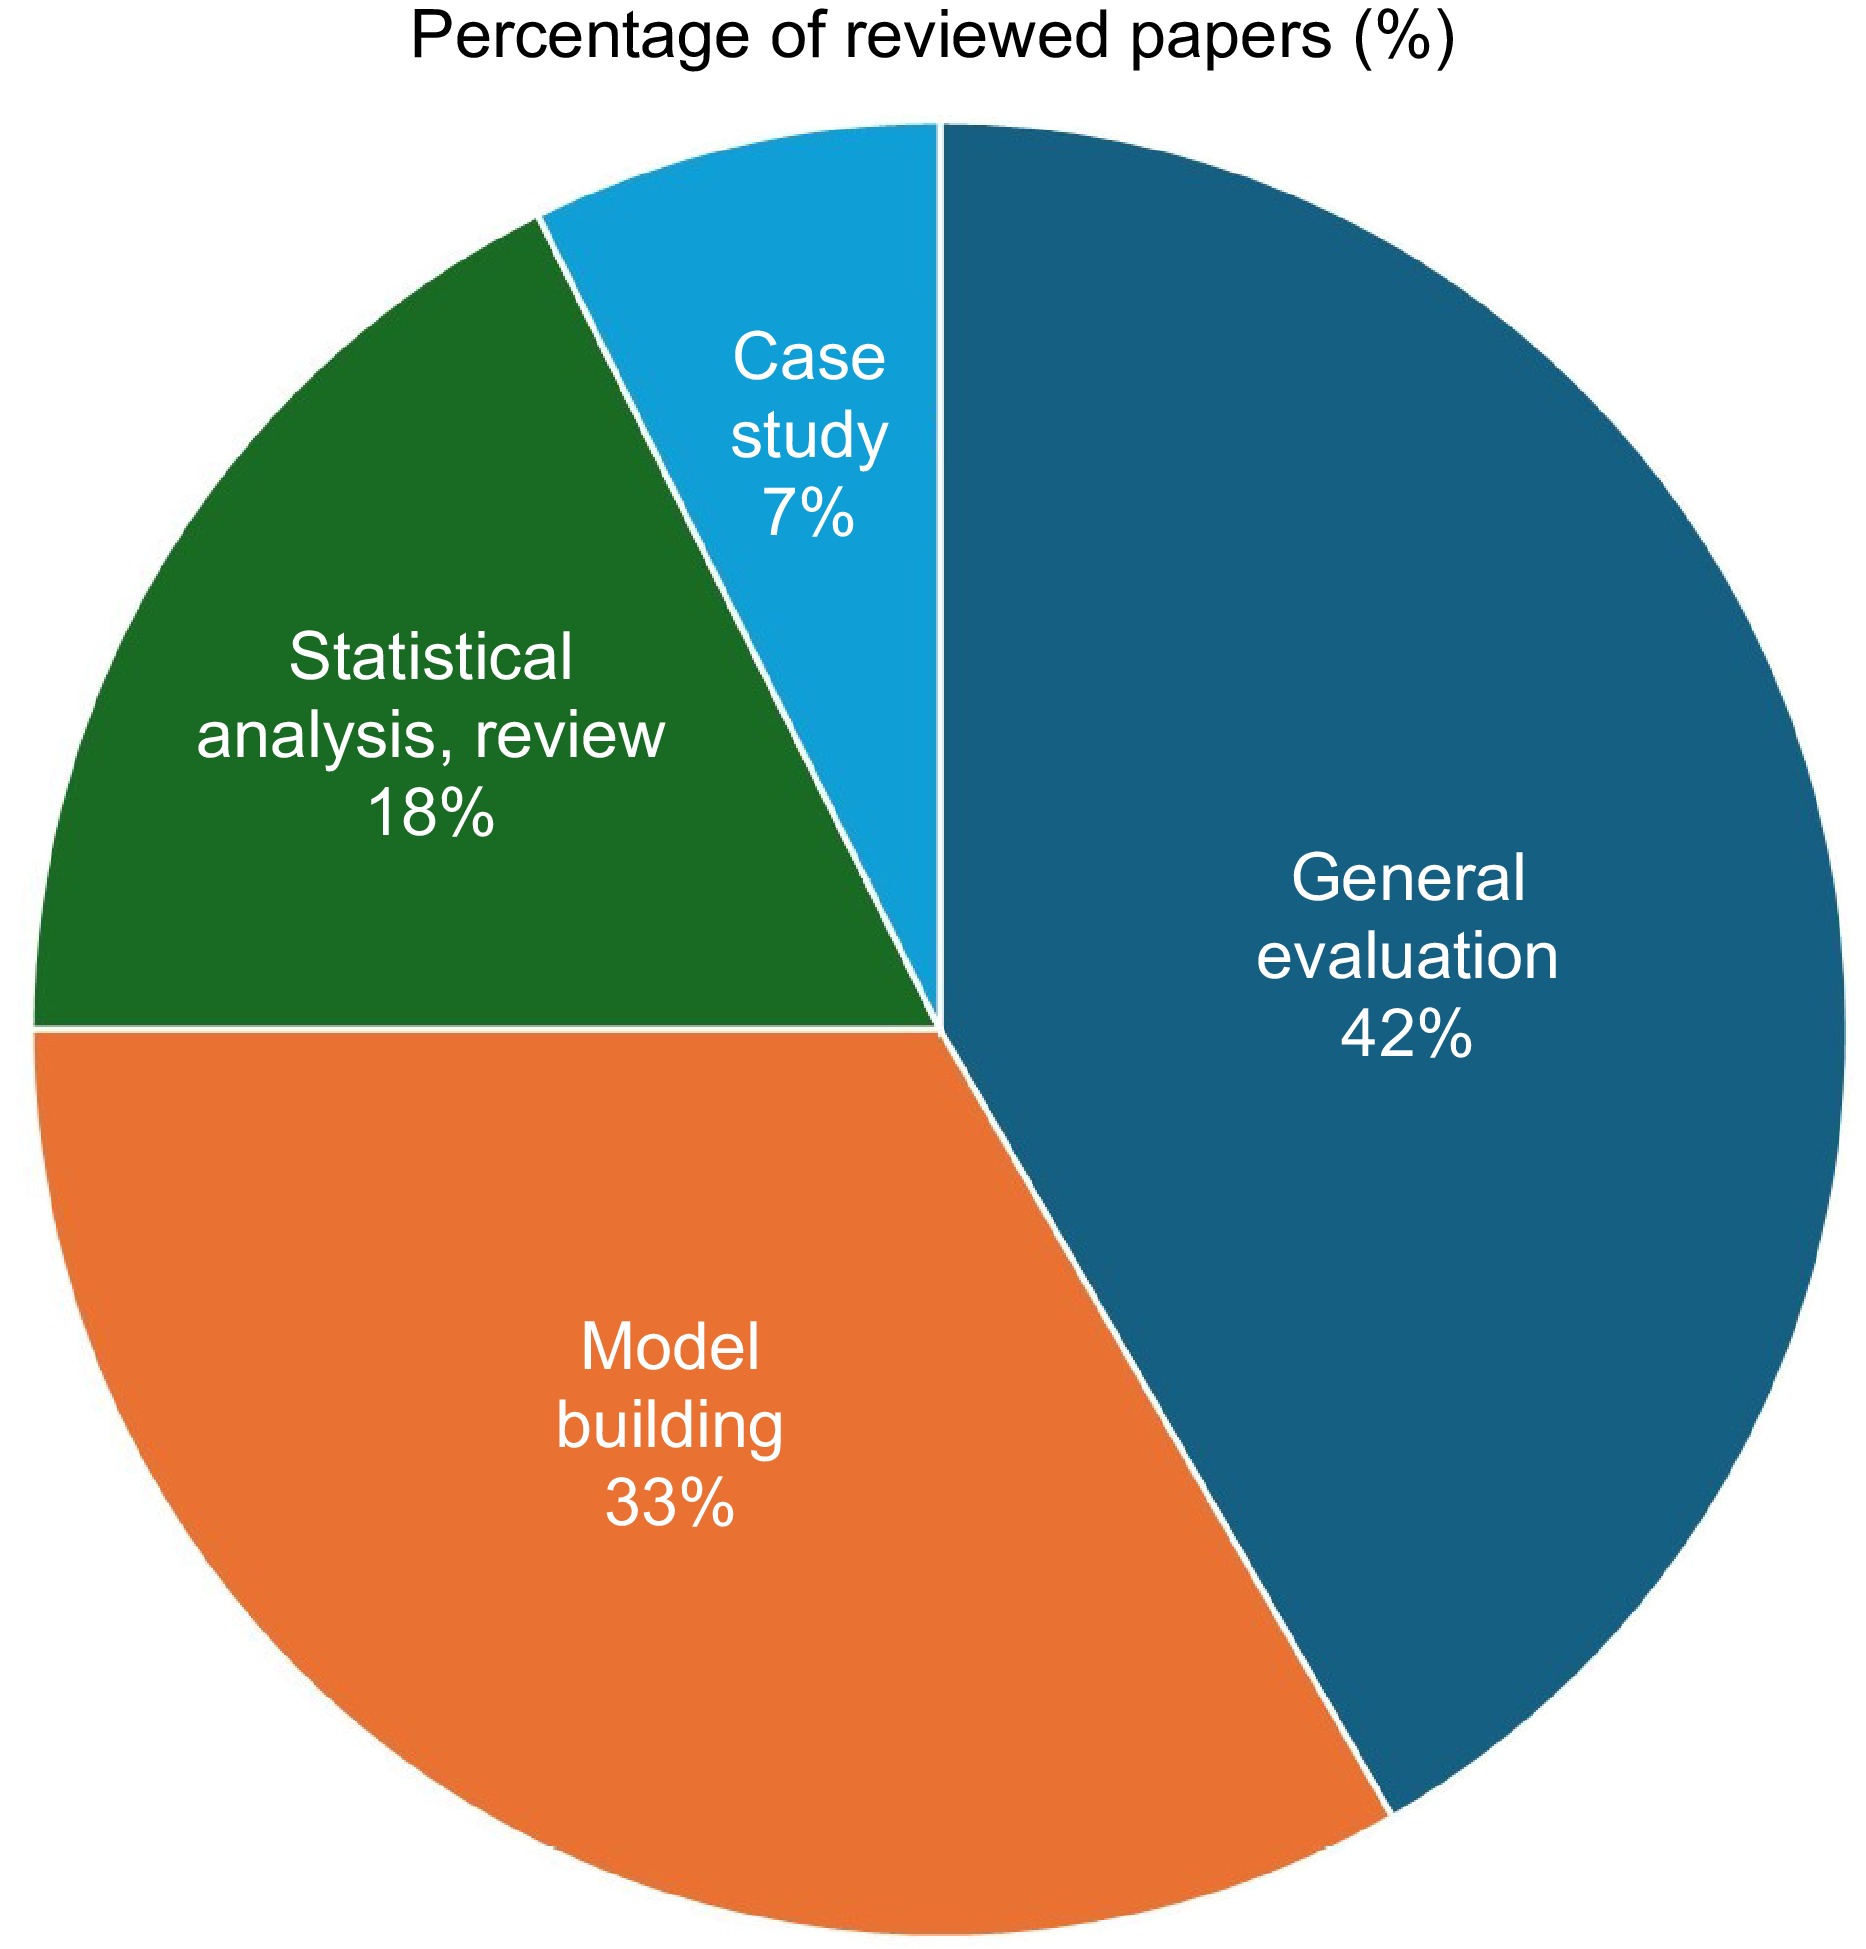
Figure 9.
Analysis methodology adopted across 96 articles.
Out of the 96 papers analyzed, 12 did not mention or analyze any specific transport mode and they discussed mobility in general. The remaining 84 papers focused on various transport modes, collecting and analyzing primary and/or secondary data. Public Transport Systems (PTS) were the most frequently analyzed, mentioned in 59 papers. Private transport was the subject of 35 papers, while both Road Safety Systems (RSS) and pedestrian transport (Foot) were covered in 27 papers, each. Cycle transportation appeared in 25 papers, and motorcycle transport was discussed in nine papers. Less frequently analyzed modes included paratransit and air, each mentioned in three papers, and micro transit, which was the focus of only one paper. Fifty-three papers discussed more than one mode to form a comparison. This distribution indicates the diverse range of research interests and the varying emphasis placed on different transport modes. A graphical representation of this is shown in Fig. 10.
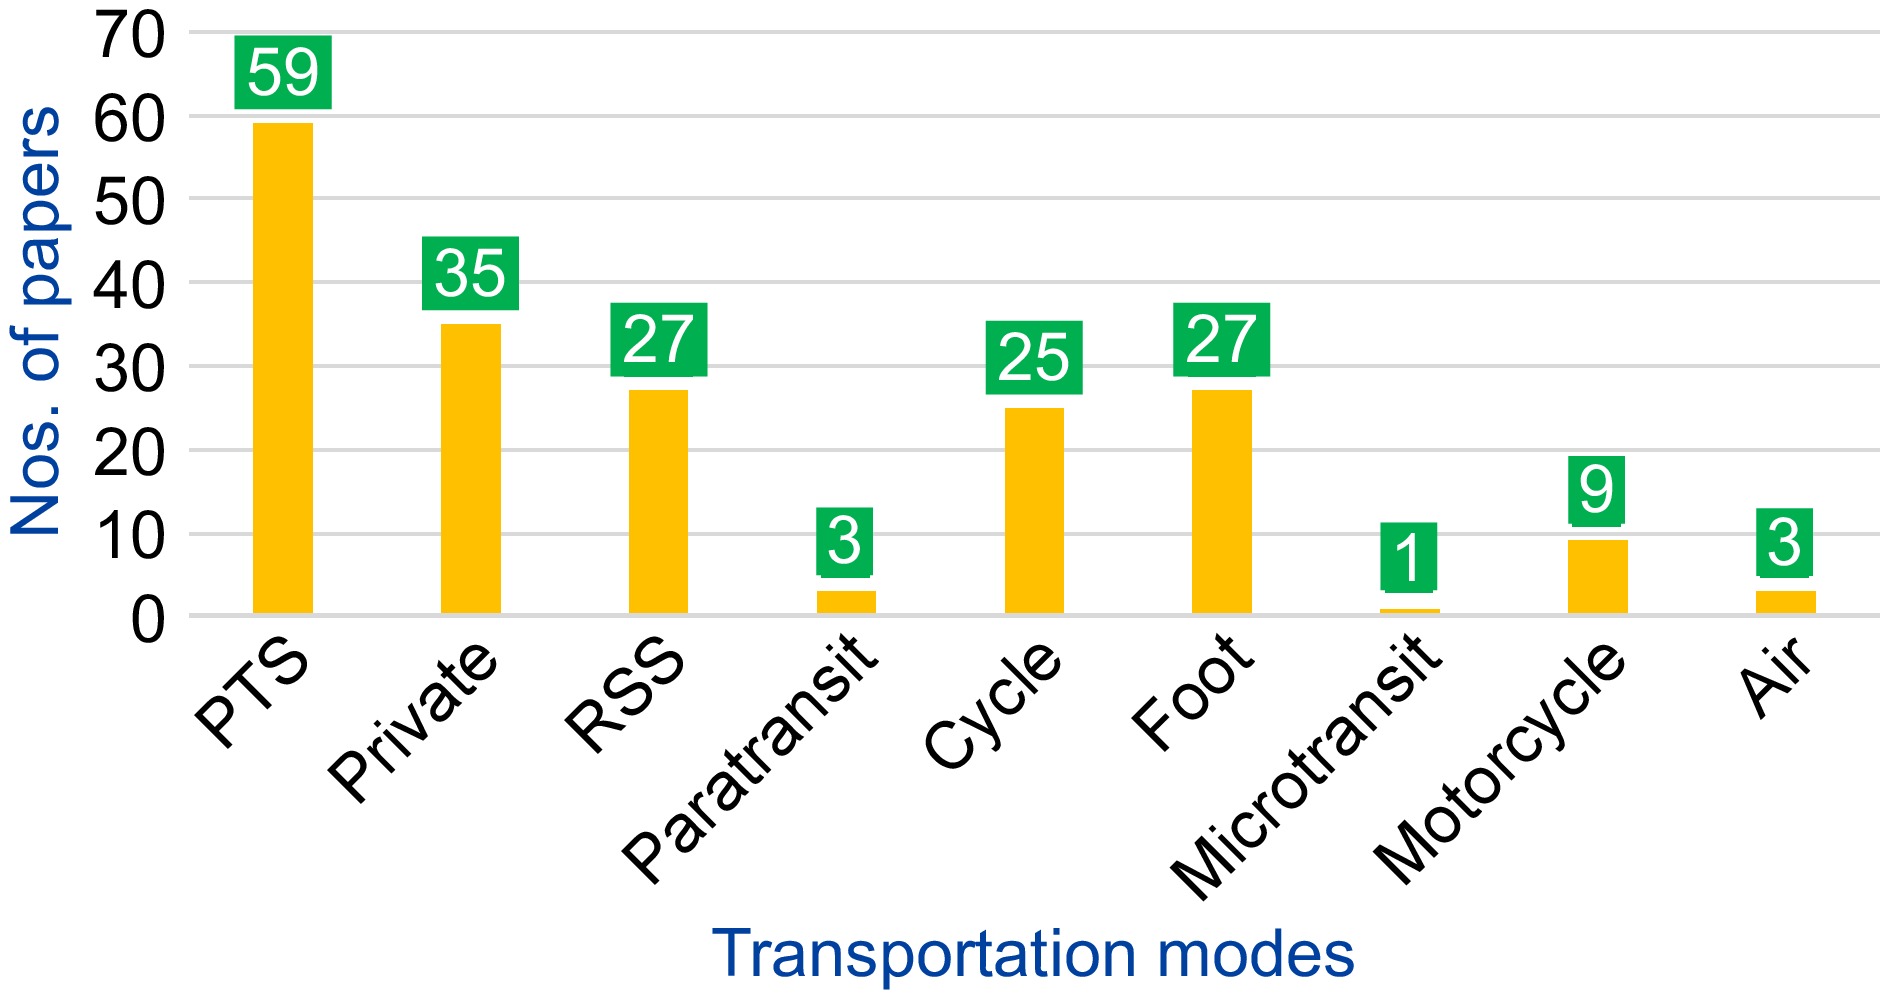
Figure 10.
Number of papers mentioning the listed transportation modes.
A word cloud with the top 50 words from keyword analysis depicts the intensity and dynamicity of keywords (Fig. 11), to which indicates the studies mostly revolve around the keywords mobility, public, transport, covid, travel change, research, etc.
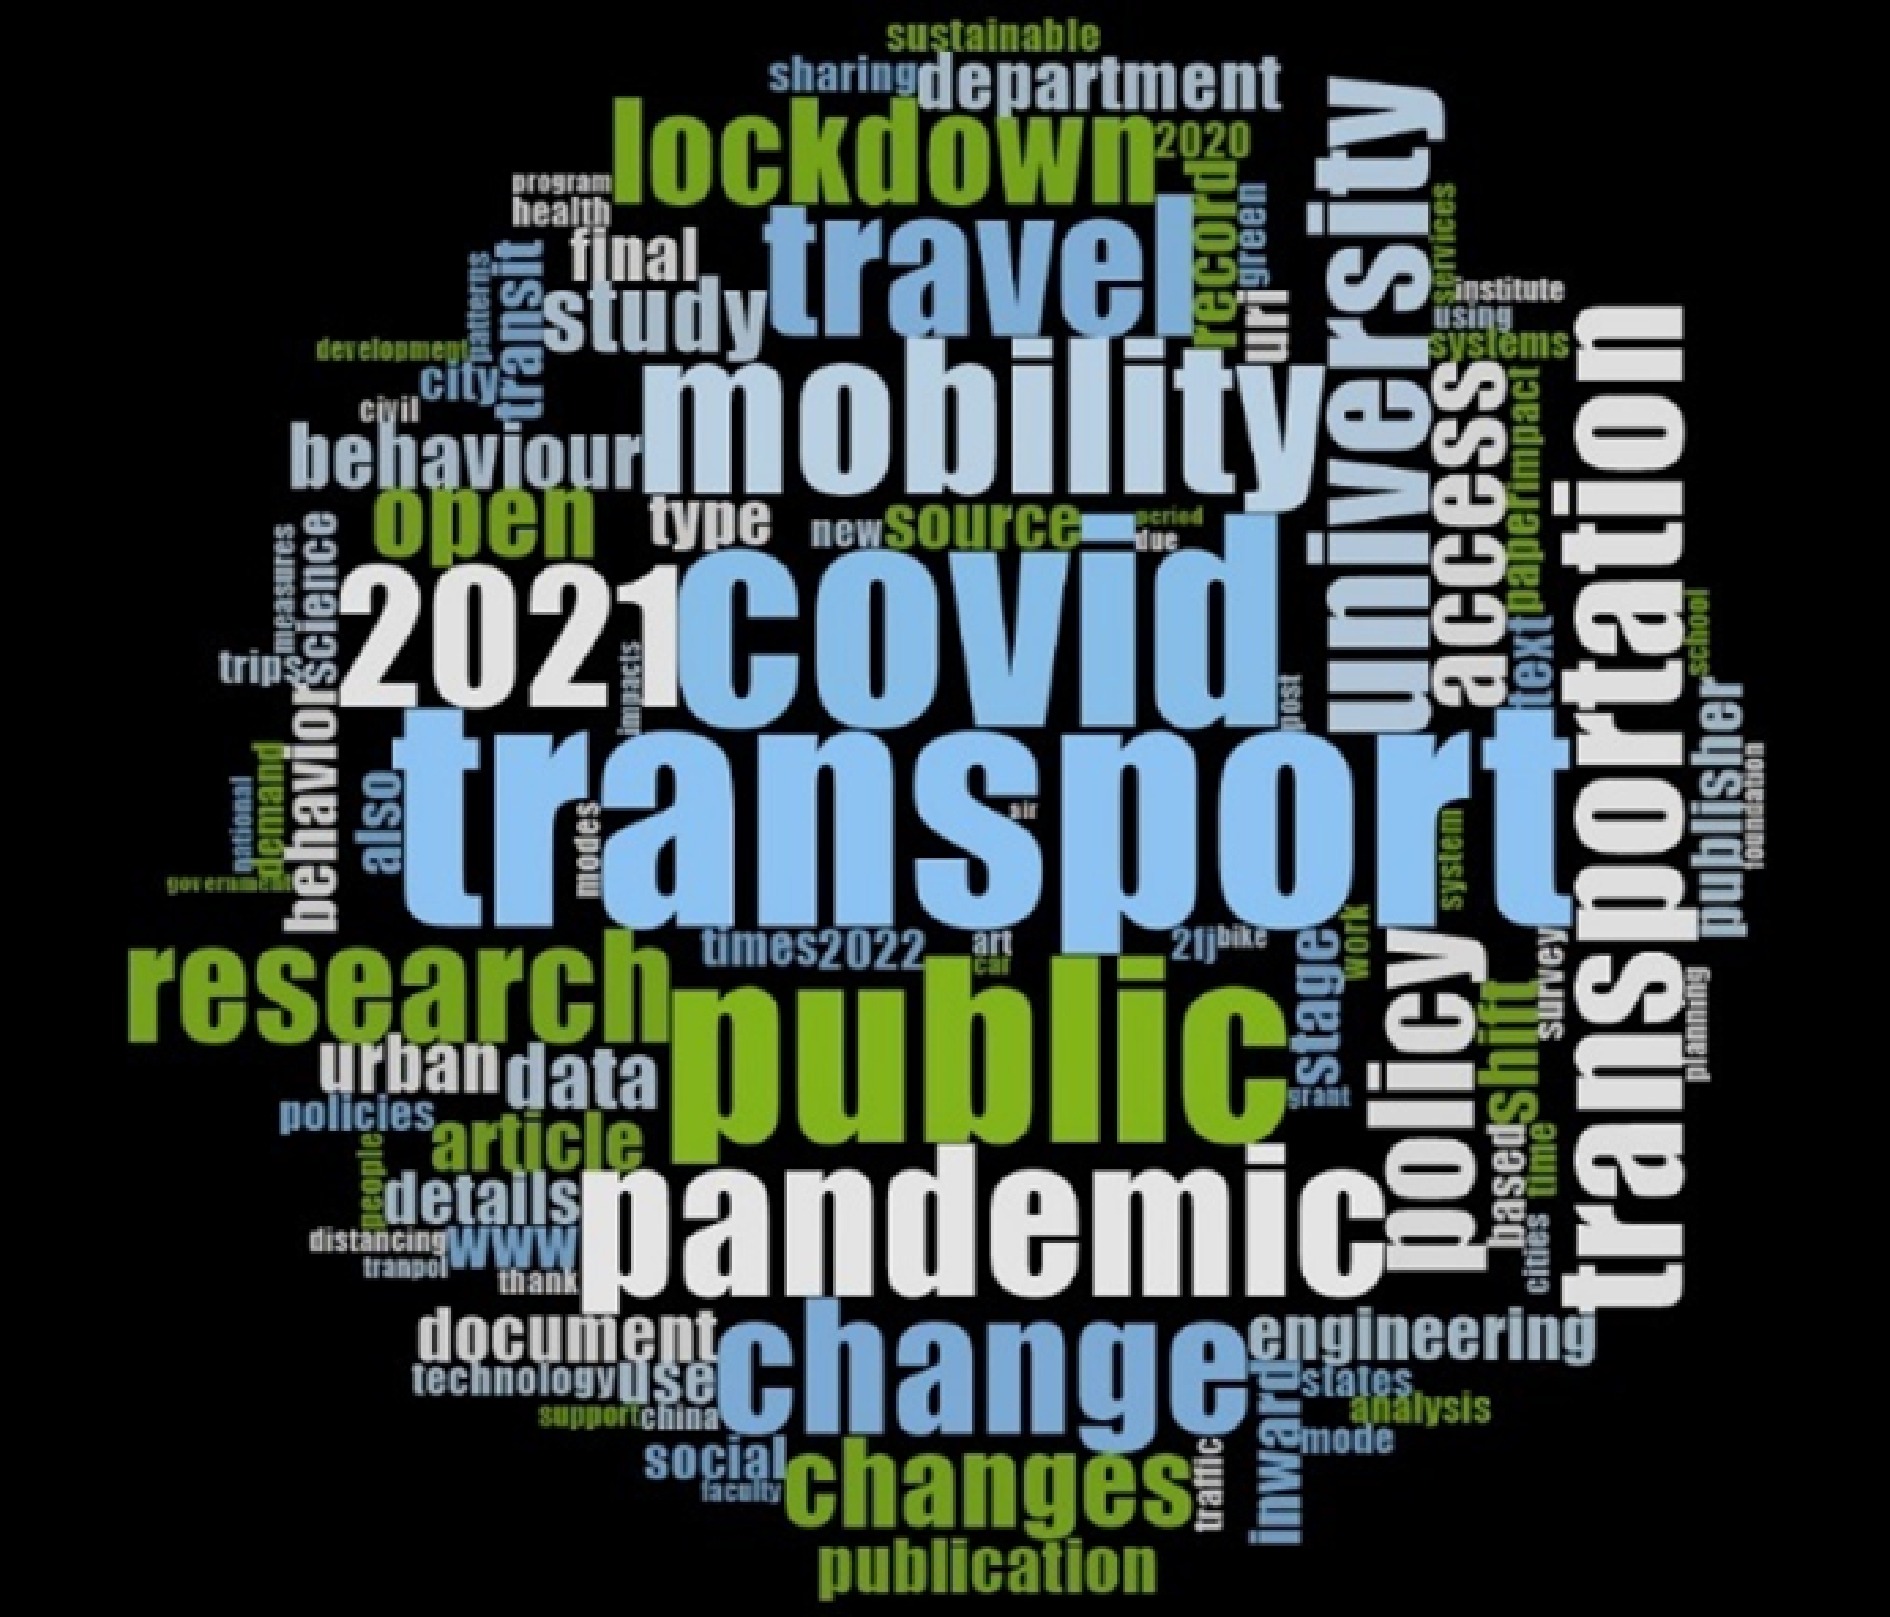
Figure 11.
Word cloud with the top 50 words from keyword analysis.
Impact on ride-hailing services
Changes in demand and usage and the rise of micro mobility
-
Shared-micro mobility services surged in demand to facilitate a disease-resilient transportation system during the pandemic. A study in Singapore found that the total ridership increased by 150%, suggesting that the bike-sharing systems were an important alternative when public transit services became restricted[12]. Furthermore, in Karachi, Pakistan, individuals with more than two family members who traveled less than seven miles likely preferred carpooling[20]. Surprisingly, people with a higher net monthly income continued to generate more shared trips during this time in Dhaka, Bangladesh[13]. In Lisbon, Portugal there was an increase in bike sharing systems which became the most favored mode of mobility while public transport use decreased[69]. Unfortunately, sharing anxiety and willingness to share rides come as a major obstacle[22] in ride-sharing programs. For example, in Seoul, South Korea this decreased bike sharing and rentals drastically[21].
During the pandemic, a study in India found that for public transit and sharing mobility, the demand dropped by 11% and 2% than the pre-pandemic time[98]. In Taipei and New Taipei of Taiwan there was a decrease in usage of metro and bicycle sharing between 8% and 18%, as well[46]. In Manhattan, USA the use of bicycle sharing was high and its demand surged more than yellow taxi system[51]. These findings correspond with study results that show public transport being the least preferred mode (Fig. 12). After the pandemic, there was a difference in travel demand recovery for different modes. For example, demand recovery was seen faster worldwide in private modes than in public transit or shared mobility[99].
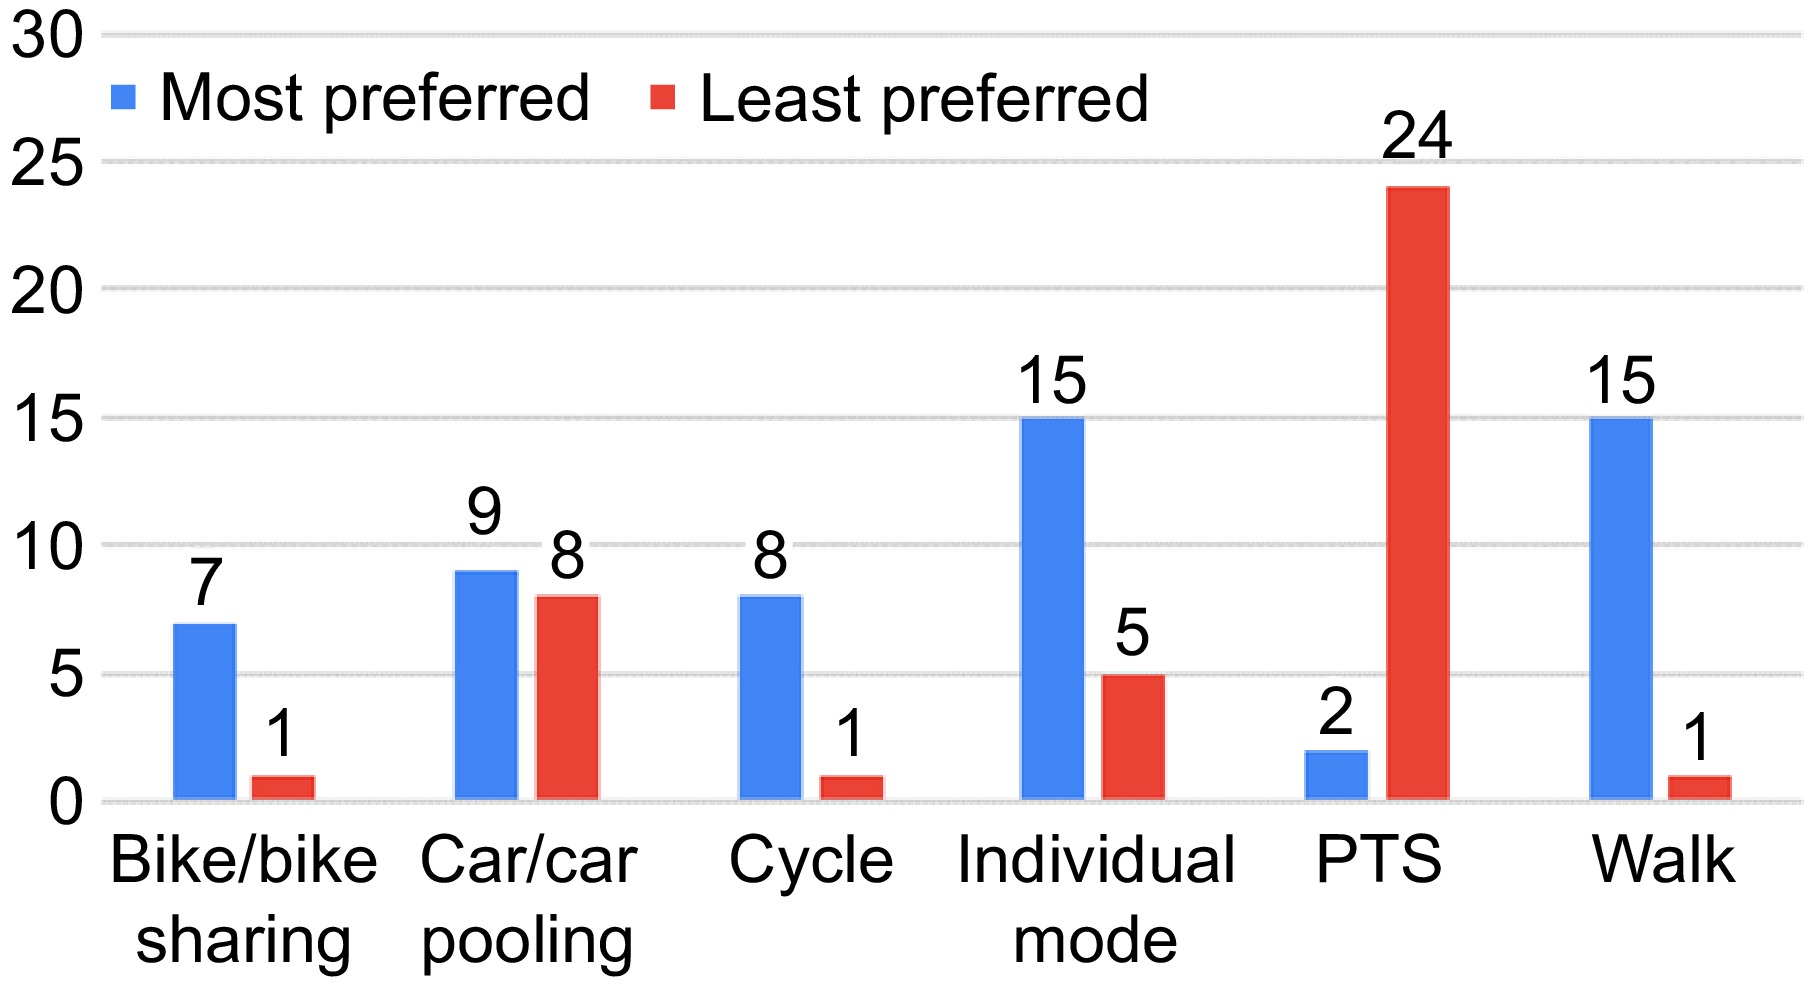
Figure 12.
Comparison between most preferred and least preferred transportation modes.
Many of the studies were limited to the data from students[10], and many respondents had cultural differences, where herd behavior and personal space were not taken into account[22]. Limitations to demographic factors[19,30], and socioeconomic factors like high and low-income neighborhoods[31] decreased the accuracy of the models to predict behaviors and mode choice. Hence, factors like socioeconomic and psychological characteristics that affected user behavior in shared mobility went unnoticed in many cases.
Shift in service offering and safety measures
-
As the impact of the pandemic started to diminish, service offerings in vehicles increased which improved the willingness to use vehicle-sharing services[14]. Users felt safer in this case and understanding user preference provided improved management in recovering demand[9]. For example, in Lisbon, Portugal before the COVID-19 pandemic the motivation to use bike sharing relied on personal well-being, service coverage and quality, this changed during the pandemic and the importance of public transport started to decrease[49]. In addition, a study in China found that travel mode choice shifted towards maximizing utility rather than fear of infection. There was an increase in using ride-hailing services for shopping and recreation activities in China, as well[25]. This might have happened due to the disruption created to the normal economy in China which suggests that individuals had to reassess their spending habits and divert to more cost-effective and convenient options to maximize utility. However, there was a willingness to pay between 19%−41% more for ride-sharing services depending on different trip purposes in Spain[14].
However, these studies in many instances underrepresented populations, for example, respondents over age 65 referring to the elderly and lower-income households[11]. However, a study found that the disadvantaged group (elderly, low-income, and less tech-savvy people) had the disadvantage of accessible choice such as using virtual platforms and were forced to go outside to fend for daily and social necessities[24]. In addition, survey-based data might be highly conditioned by traumatic experiences that have been caused by socioeconomic uncertainty and health concerns[8]. Hence, further research considering this underrepresented group can be in understanding their ride-hailing services can be done in this regard.
Socioeconomic disparities
-
Along with increased public transit trips, there was a sturdy growth in the number of COVID-19 cases, which indicated a cause-effect relationship[17]. In another study, it was found that the impact of COVID-19 on public transportation at stations situated outside Lisbon municipality and in lower-income zones was lower[23]. This might have happened as areas outside the municipality have fewer users of public transportation and people in lower-income zones were forced to use active modes like walking and cycling. Interestingly a study suggested that cost and convenience which played a crucial role in the mode choice decision was slowly being replaced by the risk of getting infected through different modes which in turn hinted to the increased demand for private modes and active modes of transport[97]. Since higher-income people had alternatives to this type of sharing service, they were exempt from using ride hailing services. In China, during this period, experienced older drivers who were active in duty and were highly respected depended more on ride-sharing services to make a living[18].
Policy implications based on these studies had specific limitations, for example, lacks causation insights and is limited to an ordinal variable[26]. Artificial intelligence and urban computing get easily influenced by data bias and data transparency[23], raising ethical issues. Overall, studies never explored the long-term effect and recovery strategies for ride-hailing services in a post-pandemic scenario.
Impact on mode preference
Personal vehicle preference
-
The demand for bikes, private cars, and public transportation trips gradually changed in popularity with the increased health concerns during the pandemic[21]. Because of the lockdown, web-based activities substituted many of these trips[29]. Many people quickly rehabilitated their preferences from public and shared means to foot and private vehicles when the infection rates got worse[10]. For example, in Slovenia when commuting was reduced significantly due to lockdown, private modes like cars remained the main choice of travel, especially in rural areas[95]. Also, in Taipei, Taiwan, there was an increase in motor vehicle ridership[46]. This might have been because of factors like reduced exposure risk, avoidance of crowded spaces, and safe mobility. However, a study in Fuenlabrada, Spain contradicts this as private mobility decreased to 86% of their pre-COVID demand during the pandemic and made a faster recovery than public mobility which decreased to 94% of its pre-COVID-19 demand[48]. A finding in India found that for work trips, share for private modes and non-motorized transport were 10% and 4% higher among respondents after the COVID situation relaxed[100]. Preference for individual modes of transportation in China increased by 8.7%, whereas shared transportation modes decreased by 12%[25]. Similarly, in Greece, the use of public transportation services decreased significantly, dropping from 3.85 times per week to 0.69 times per week[39]. Again, Fig. 12 demonstrates that individual modes like private vehicles, motor bikes, bicycles, walking, etc. were preferred most.
These findings indicate factors like socioeconomic stability and healthy safety perception play major roles in choosing modes. Notably, in some studies, lower-income people with limited access to the web and modern devices were underrepresented[1,31,44,86]. Furthermore, other studies had limited sample sizes that had spatial and temporal limitations[47,48], and few focused on students only[10,41]. In addition, processes like generalized linear mixed-effects[3] and regression models[1,44,55] being suitable for hierarchical data accounted for random effects of mobility due to COVID. Similarly, Gaussian Process Regressors[48] require a relatively large amount of data to effectively model complex relationships. These methods were employed by utilizing underrepresented lower-income groups and the socioeconomic stability of users, which is a recurring practice in many of the studies under this theme.
Towards public transportation and shared mobility
-
The pandemic situation highlighted the vulnerability of local public transit and the perception of safety[60]. During the pandemic, public transportation usage in Turkey and Spain drastically decreased by 80%[64] and 95%[48] respectively. In addition, because of the lockdown, there was a higher willingness to telework which further decreased public transportation use[36]. However, public transit was a critical mobility option for the homeless or lower-income people[76]. In Washington, USA the lower-educated and lower-income people experienced declines in travel intensity, which affected their travel behavior even after the COVID period[54]. This solidifies the finding of this study that public transportation is the least preferred mode in most of the papers that discussed this topic (Fig. 12) but for people who have no other choice, public transportation played a significant role. However, many countries have already started to bounce back with predictions going for higher travel frequencies related to public transport[98]. Again, a study in Toronto, Canada observed a decrease in the usage frequency of ride-sourcing but a small percentage of respondents showcased an increased ride-sourcing usage, which might have attributed to the increased perseverance to avoid crowded spaces and public transit[11].
Similarly, a study in Manhattan, USA found that the impact of the shared mobility system was higher than the yellow taxi system, and the demand surged during the pandemic[51]. In Daejeon, Korea, bike-sharing increased both during and after the pandemic[101]. However, a study in Barcelona revealed that the liking to bike sharing decreased during the pandemic[2], which is opposed to the study findings that found mobility sharing as one of the most preferred modes (Fig. 12). Then again, a study suggested that shared micro-mobility had the potential in the future to become a disease-resilient mode of transport[12]. This indicates that certain demographic, socioeconomic, and psychological factors address the choice of shared mobility, which needs to be focused on.
Active mode of transportation
-
In North Carolina, USA, individuals preferred walking and driving over public transit during the pandemic[1]. On the other hand, a study in Dhaka, Bangladesh found that non-motorized vehicles were 19.93% more popular[10]. Again, in The Netherlands, measures that encouraged cycling and walking also scored positively[42]. However, in Greece, this effect varied for males and females as parameters like ecological footprint, safety measures, and personal safety mattered most for females. Cycling was more preferred there and 30% of their population already reduced car usage even after the pandemic[67]. In Spain, there was also a slight increase in the usage of active modes of transport[87]. In Shiraz, Iran, the average cycling and biking was still higher for Central Business District users after the pandemic[55].
A similar case also occurred in many European countries as demand for active modes of transportation continued to increase after the pandemic[32]. These outcomes align with the findings of this study. Active modes of transportation are one of the most preferred modality choices (Fig. 12). However, the majority of the papers that discussed active modes of transportation relied on general evaluation and normal statistical analysis and had data limitations mentioned in the earlier themes. However factors that presented user behavior/personas were sometimes shadowed by traffic demand and policy mapping.
Impact on trip purpose
Mode choice on trip purpose
-
For rigorous classification, trip purposes were clustered into three distinct types: (1) Mandatory trips, (2) Maintenance trips, and (3) Discretionary trips[91]. At the start of the pandemic in Brazil, there was a substantial reduction in working (Mandatory trips) and non-essential (Discretionary trips) trips. Results indicated that essential workers were nearly three times more likely than the general population to make a mandatory trip during this time. Discretionary trips were more likely to be made by males in comparison to females[77]. Again, in Zurich, Switzerland, maintenance trips like park and grocery visits increased, while discretionary trips decreased during the lockdown period. This observation coincides with the findings of this paper that revealed the occurrence of Maintenance trips the most, with 12 papers focusing on this aspect.
It is noteworthy that Mandatory trips experienced the most substantial decline during the COVID-19 pandemic. Findings of the study conducted by Rafiq et al.[71] and Pawar et al.[93] concluded that the severity of COVID-19 had a more pronounced impact on workplace visits during the pandemic, which also affected low-income workers. Discretionary trips had lower travel frequency by 92% in comparison to mandatory trips in India. The diverse choices made by users during the COVID-19 pandemic are presented in Fig. 13. In Seattle, USA mandatory trips like medical trips increased drastically and people from lower-income communities highly relied on paratransit[34].
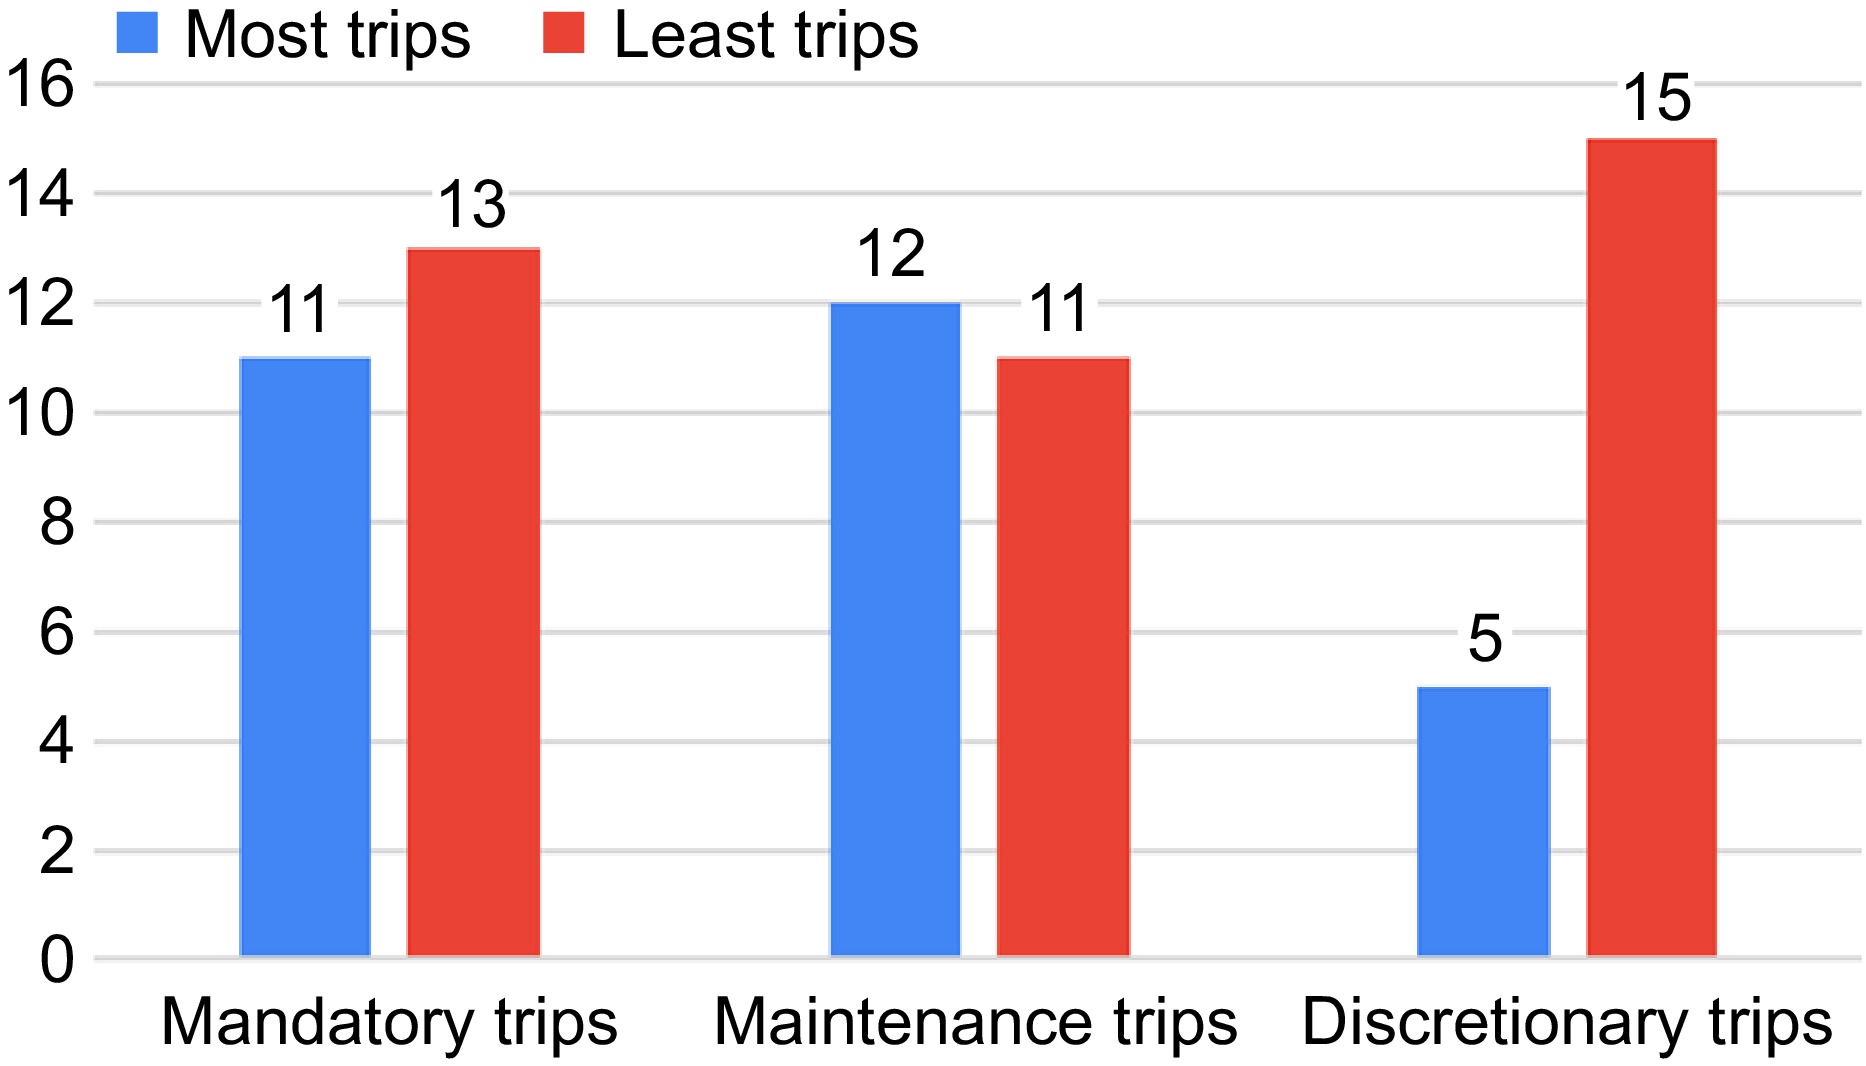
Figure 13.
Mode choice preference by percentage.
Behavioral and socioeconomic effects
-
During the pandemic, discretionary trips were largely canceled due to lockdowns[78]. For people with disabilities, their daily travels were significantly reduced by destination[82]. However, older adults preferred active modes of transportation during and after the pandemic to avoid social constraints and crowds in their trips[55]. In the USA, transit riders with lower incomes had reduced their trips significantly[87]. In King County, Washington, USA people with lower education and lower income also reduced their travel significantly[55]. Again, in Toronto, Canada, people were reliant on private vehicles rather than public transit for non-mandatory trips[91]. Furthermore, there was a significant drop in trips based on travel purposes, infection, fear, occupation, and household[96]. In the USA, public transportation use among lower-income groups decreased by 32%, and among the general population, it declined by 51%[54]. These findings signify changes in travel behavior due to changes in socio-economic characteristics[55,65]. This greatly affects the purpose of trips for different demography of people during the COVID-19 pandemic.
-
The objective of this research was to examine the alterations in transportation mobility and travel patterns due to the COVID-19 pandemic. Utilizing a systematic review and bibliometric analysis, 96 papers from the Scopus database were rigorously. These papers were categorized into three major themes: 'Impact on Ride-Hailing Services', 'Impact on Mode Preference', and 'Impact on Trip Purpose'. Text mining techniques were employed to extract key findings from each theme.
The majority of the research works focused on the year 2021, corresponding with the pandemic's peak. Interestingly, a geographical correlation emerged between the severity of the outbreak and the location of the research. The USA dominated research output, followed by Spain and India. Notably, the USA consistently played a significant role across all themes, while some countries prioritized themes with direct societal impact, potentially reflecting resource limitations or immediate infrastructural needs. This research disparity highlights the need for a more balanced global perspective in future investigations. Increased research focus in regions with initially lower output is crucial for a comprehensive understanding of the pandemic's long-term effects on travel behavior.
This systematic review identified a dominance of interview/survey-based research (44.8%), often relying on online data (31 papers), which can introduce bias. Future studies should prioritize data triangulation with on-ground surveys and travel data, alongside longitudinal approaches, to gain a more comprehensive picture. Future research should incorporate sensor-based data collection (e.g., travel time estimation from GPS data) and agent-based modeling to simulate travel behavior under different pandemic scenarios. This would allow engineers to test and refine infrastructure modifications and public transportation policies for optimal efficiency and user safety. Significant literature gaps exist in under-represented regions (minimal initial research) and for vulnerable populations, highlighting the need for broader regional coverage and a deeper understanding of the pandemic's impact on diverse demographics and the three themes: 'Impact on Ride-Hailing Services', 'Impact on Mode Preference', and 'Impact on Trip Purpose' of this paper.
The COVID-19 pandemic exposed significant vulnerabilities in the shared mobility landscape, with ride-hailing services experiencing drastic shifts in demand, usage patterns, service offerings, and safety protocols. Shared-micro mobility also emerged as a crucial alternative during public transport restrictions, particularly in developing regions where usage surged[12], other areas witnessed declines due to concerns about shared surfaces and potential virus transmission. These contrasting trends highlight the multifaceted nature of user behavior in shared mobility and underscore the critical need for in-depth research on the psychological and behavioral factors influencing mode choice within this sector. The co-occurrence diagram of keywords also revealed prominent studies on the effect of travel behavior on shared mobility and sustainable transportation. Such research can be instrumental in developing targeted interventions to foster long-term sustainability for shared mobility models across diverse geographical and socio-economic contexts. In addition, research on the provision of flexible transportation strategies should be given emphasis to prepare for similar pandemic situations in the future.
For sustainable urban development, multimodal transportation is advocated over reliance on a single mode, with telecommuting being an integral part of sustainable infrastructure strategies[7]. However, during the pandemic a concerning trend has emerged – a rise in private car usage documented across various studies[1,3,10,20,25,46,47,52,60,91,95,97]. Studies have consistently emphasized the importance of bolstering infrastructure for cycling, such as expanding and maintaining dedicated bike lanes and improving route quality and intersection safety for pedestrians[2,35,93]. Similarly, enhancements in walking infrastructure were recommended, focusing on route quality, intersection safety, and the incorporation of green spaces, which positively influence walking utility[35,93,83]. It is seen from above that many studies emphasized infrastructure and policy recommendations that promoted multimodal travel, particularly combinations with active transportation modes. This presents an opportunity for urban planning engineers to re-evaluate existing infrastructure. While the focus on sustainability is commendable, a gap exists in understanding commuter preferences for these combined trips. To address this gap, further research is necessary to explore commuter preferences and the various travel mode combinations they utilize, with a specific focus on informing the development of sustainable infrastructure.
Public transportation usage by low-income groups persisted during the pandemic[23,34,37,39,40,54,76,77,86,91]. It was also found the modal share of public transportation drastically decreased to less than 10% according to certain authors[95,77]. These findings signify that public transportation systems were one of the least preferred modes of travel during the pandemic and this was the most frequently analyzed, mentioned in 59 papers. This highlights the need for targeted solutions and policy implementations to support these populations. Strategies such as contactless travel, e-tickets, and improved sanitation measures were recommended to mitigate the risk of infection and promote public transit use[41,43,50,67,74,83]. In addition, to better support this population, rigorous research is needed on solutions that promote safe and hygienic public transport travel.
However, the uneven recovery rates between public transit/transport and private vehicles in different regions suggest a need for context-specific solutions. In areas with limited access to private vehicles, could investments in public transit infrastructure (e.g., improved ventilation systems) and real-time occupancy information displays entice riders back to public transportation? Engineering solutions could involve integrating real-time travel demand data from ride-hailing services with public transportation schedules to dynamically allocate resources during emergencies. Additionally, exploring partnerships between public and private transportation providers could lead to innovative micro transit solutions (e.g., demand-responsive buses) that cater to specific trip purposes and demographics during disruptions.
Maintenance trips, though reduced, continued to occur during the pandemic. Effective management strategies, such as establishing outdoor sites near residences for daily necessities, were proposed to reduce the frequency of these trips and minimize infection risks[81]. Workplace trips saw the highest decline during the pandemic compared to non-workplace trips. For ride-sharing services, understanding customer willingness to pay more and considering economic factors in service cost calculations were highlighted[8,31]. It was found that customers were willing to pay upwards of 19% for better services[14]. Increasing the number of electric and cargo bikes was suggested to enhance service utility[2,35]. Surprisingly, different studies also talked about the effect on the differently abled population and their behavior shift in using different modes but they were few[82,34]. Among the 96 analyzed papers, 35 studies directly or indirectly addressed the factors influencing trip choice. This highlights the need for further research to analyze the direct and indirect factors influencing trip purpose, with a particular focus on the differently-abled population. Such research is crucial for understanding and addressing sudden changes in mobility behavior.
In summary, this study synthesizes an extensive array of policies and recommendations, providing valuable insights into the multifaceted approaches adopted by governments and policymakers. While this research offers a comprehensive review of transportation mobility during the COVID-19 pandemic, it also provides recommendations and discusses the potential areas of focus considering future transport mobility. However, the study did not consider the extreme shifts in travel behavior at various pandemic stages and long-distance travel modes like air travel and sea travel. This needs to be addressed in future studies. Researchers should undertake a time-series analysis to evaluate how transportation mobility has evolved throughout the pandemic.
In addition, the review process might have inadvertently favored published studies with statistically significant findings. Studies with null or negative results may not have been published, potentially skewing the overall interpretation of the data. To mitigate this, studies should include unpublished reports or grey literature (e.g., government reports, conference proceedings) in future reviews. The selection of keywords and databases used for the literature search could have limited the range of studies identified. However, this search bias was kept to a minimum by considering synonyms of the primary keywords and using Boolean operators such as AND and OR to combine the keywords. Selection bias was also reduced by utilizing pre-defined inclusion and exclusion criteria along with a rigorous screening process by four reviewers. By employing four reviewers with diverse perspectives, the influence of the reviewer's own biases on the interpretation and synthesis of the findings from the reviewed studies (also known as synthesis bias) was kept to a minimum.
-
The authors confirm contribution to the paper as follows: study conception and design: Bhuiyan MRH; data collection: Basunia A, Muttaqi A, Bhuiyan MRH, Badhon FA; analysis and interpretation of results: Basunia A, Muttaqi A; draft manuscript preparation: Basunia A, Muttaqi A, Badhon FA, Bhuiyan MRH. All authors reviewed the results and approved the final version of the manuscript.
-
The data that support the findings of this study are available from the corresponding author, upon reasonable request.
-
The authors declare that they have no conflict of interest.
-
# Authors contributed equally: Aditya Basunia, Azwad Muttaqi
- Copyright: © 2024 by the author(s). Published by Maximum Academic Press, Fayetteville, GA. This article is an open access article distributed under Creative Commons Attribution License (CC BY 4.0), visit https://creativecommons.org/licenses/by/4.0/.
-
About this article
Cite this article
Basunia A, Muttaqi A, Bhuiyan MRH, Badhon FA. 2024. Transportation mobility during COVID-19: a systematic review and bibliometric analysis. Digital Transportation and Safety 3(3): 169−183 doi: 10.48130/dts-0024-0015 

Transportation mobility during COVID-19: a systematic review and bibliometric analysis
- Received: 26 May 2024
- Revised: 10 August 2024
- Accepted: 22 August 2024
- Published online: 30 September 2024
Abstract: The COVID-19 pandemic has significantly affected global transportation mobility, presenting unprecedented challenges to transportation management. Public transit and ride-hailing services saw a drastic reduction in ridership, leading to an increased inclination towards private vehicles. The pandemic also altered travel patterns and individual mobility due to various COVID-19 protocols. This study conducted a comprehensive review of 96 academic papers spanning from January 1, 2020, to December 31, 2022, focusing on transportation and mobility using the Scopus database. Three major themes were identified: 'Impact on Ride-Hailing Services', 'Impact on Mode Preference', and 'Impact on Trip Purpose', with subdivisions based on keywords and key findings extracted using VOSviewer. The pandemic significantly impacted ride-hailing services, altering demand, usage, and safety measures. Mode preference shifted towards private vehicles due to safety concerns. The present study underscores the long-term implications of the pandemic, emphasizing recovery strategies for ride-hailing services and mode preferences post-pandemic. It highlights the need for sustainable transportation policies, advocating for enhanced public transportation systems, promoting active travel modes, and addressing socioeconomic disparities in mobility patterns. The findings emphasize the need for resilient transportation strategies in the face of future disruptions.
-
Key words:
- COVID-19 /
- Transportation mobility /
- Bibliometric analysis /
- Text mining /
- Travel patten /
- Travel behavior