-
Tractor and trailer transportation is an advanced transportation organization mode in which the tractor drops the trailer at the cargo handling depot according to the predetermined operation plan and tows the other trailer to operate. Because of the separation of the handling process and the transportation process, the waiting time for the tractor can be reduced to the maximum extent. It is an effective way to build an environment-friendly and resource-saving transportation system. However, there are often incidents that disrupt the original scheduling scheme of the transportation system. These disruption events will cause transportation efficiency to decrease, or even the shutdown of the transportation network. Therefore, it is necessary to study the tractor and trailer transportation scheduling problem under disruption events, to maintain the high efficiency and stability of the system.
At present, many scholars have studied the tractor and trailer routing problem (TTRP) and summarized the research on the TTRP mainly from the perspectives of both deterministic and uncertain environments. What’s more, the essence of the TTRP is a vehicle routing problem (VRP). Therefore, relevant researches are summarized from three perspectives, namely, research on TTRP in a deterministic environment, in an uncertain environment, and VRP in a certain environment.
Research on TTRP in a deterministic environment
-
Research on TTRP in a deterministic environment mainly focuses on task time windows, operation modes, scheduling algorithms, and other perspectives.
In research on TTRP considering time window constraints, Xu et al.[1] took into account the cargo demand vectors and vehicle aging conditions at the initial state of tractor and trailer transportation, and constructed an integer programming model to maximize time window revenue. A genetic algorithm based on time urgency was designed to solve the model. Lin et al.[2] investigated the route optimization problem for trucks and trailers considering time window constraints and solved it with the simulated annealing algorithm. Parragh & Cordeau[3] studied the TTRP problem with time windows and employed a branch-and-price algorithm to solve the proposed problem. Batsyn & Ponomarenko[4] constructed a tractor scheduling model that considered both soft and hard time window constraints, as well as split delivery, for the heterogeneous fleet truck and trailer routing problem. A greedy algorithm was used for solving this model. Derigs et al.[5] investigated the route optimization problem for trucks and trailers with heavy reload transfers and time window constraints, employed an algorithm combined with local search, large neighborhood search, and standard meta-heuristic control strategies. These studies consider time window constraints, making the TTRP more closely similar to the actual process of tractor and trailer transportation.
In the research on the TTRP problem considering the operation mode, Wang et al.[6] addressed the issues of low transportation efficiency and customer satisfaction in network-based tractor and trailer transportation by considering multiple alternative warehouses and simultaneously making vehicle scheduling decisions to optimize the existing transportation network. They constructed a bi-level programming model with the objective of minimizing generalized total costs, where the first level pertains to location-allocation and the second level involves vehicle scheduling. A two-stage hybrid heuristic algorithm was designed to solve the model. Drex[7] studied the trailer and transfer vehicle routing problem and proposed modeling methods for vehicle routing problems with multiple synchronized constraints, such as the multi-level location-routing problem and the vehicle-and-crew synchronization routing problem. Feng & Cheng[8] proposed a two-stage cargo-vehicle matching model for truck alliances and task sets in tractor and trailer transportation, addressing the matching problem for trucks and cargoes, and then solved it with a demand-capacity adaptive genetic algorithm. These studies provide important references and insights for the TTRP in the context of tractor and trailer operation modes.
Some scholars have conducted research on the TTRP from the perspective of improving the solution algorithm. Villegas et al.[9] established a mathematical model aiming at minimizing the total travel distance of trucks and trailers for the truck and trailer routing problem and designed algorithms combining greedy random adaptive search procedures and iterative local search for its solution. Chen et al.[10] formulated an integer programming model to minimize the cost of tractors and trailers, and employed an ant colony algorithm to solve the problem. Li et al.[11] addressed the tractor and semi-trailer routing problem with many-to-many demands, established a model to minimize CO2 emissions per kilometer, and used an improved savings algorithm for its solution. These studies provide important references and insights for rapidly generating scheduling solutions for tractor and trailer transportation.
Research on TTRP in an uncertain environment
-
Current research on the TTRP in an uncertain environment mainly focuses on scenarios such as uncertain demand and vehicle travel time, approaching the issue from a proactive perspective.
In the research on the TTRP problem considering uncertain demand, Mirmohammadsadeghi & Ahmed[12] investigated the TTRP problem under uncertain demand and time window constraints. They established a mathematical model aimed at minimizing costs and employed a memetic algorithm for its solution. Guo & Ni[13] studied the potential imbalance and multiple demands at both ends during the transportation process of tractors and semi-trailers. They developed a mathematical model to minimize total costs and the number of tractors, and designed a heuristic algorithm to solve the model. Mirmohammadsadeghi & Ahmed[14] modelled the TTRP problem considering stochastic demand constraints, and solved it with a tabu search algorithm. These studies provide references for handling uncertain demand issues in practical tractor and trailer transportation, enabling the improvement of the anti-interference capability of the tractor and trailer transportation system.
In the research on the TTRP problem considering random vehicle travel time, Li et al.[15] established an opportunity constraint programming model for the TTRP problem with uncertain travel time, and designed a heuristic tabu search algorithm to solve the problem. Zhang et al.[16] proposed a vehicle routing problem with simultaneous pickup and delivery considering stochastic travel time. They established a mathematical model aimed at minimizing costs, transforming the dynamic problem into a static one, and solved it using a genetic algorithm based on scatter search methods. Mirmohammadsadeghi et al.[17] studied the TTRP problem with stochastic travel and service times, employing a multi-point simulated annealing algorithm for its solution. Wang et al.[18] addressed the disruption issues caused by new tasks in tractor and trailer transportation. Using the concept of disruption management, they analyzed the impact on the original costs and service time, established a disruption management model aimed at minimizing generalized deviation costs, and solved it using a parallel genetic algorithm. These studies can ensure the efficiency of coupling and tractor and trailer transportation under the condition of uncertain vehicle driving time.
Some scholars have conducted research on the TTRP in uncertain environments from other perspectives. Regnier-Coudert et al.[19] designed a simple constructive solver to address real-time dynamic optimization problems and evaluated the optimization level of scheduling plans for the Aberdeen Crail Transport Company in the UK. Torres et al.[20] considered the TTRP problem with fuzzy constraints, established a mathematical model and solved instances of the TTRP problem. Subsequently, Torres et al.[21] established a mathematical model based on fuzzy theory and solved it using a local search algorithm. These studies can ensure the efficiency of tractor and trailer transportation under uncertain conditions.
Research on VRP in an uncertain environment
-
Current research on VRP in uncertain environments mainly consider situations where customer demand is uncertain and customer time windows change.
In the research on VRP considering time window changes, Tan et al.[22] addressed the routing problem with time windows in an uncertain environment by constructing a robust multi-objective model and designing a robust optimization algorithm based on MOEA/D for its solution. Wang & Zhou[23] studied the electric vehicle routing problem with time windows under uncertain travel time, and constructed a robust optimization model based on path-dependent uncertainty sets. They proposed a hybrid metaheuristic algorithm combining an adaptive large neighborhood search algorithm with a local search algorithm for its solution.
In the research on VRP considering time uncertainty in customer demand, Artur et al.[24] focused on the robust counterpart of the capacitated vehicle routing problem, considering two types of customer demand uncertainty sets. They transformed the problem into a vehicle routing problem in a deterministic environment through set partitioning and designed a branch-and-bound algorithm for its solution. Sun & Wang[25] tackled the open vehicle routing problem with uncertain demand. They proposed a target-oriented robust optimization approach, constructing a robust optimization model and designing a genetic algorithm-based particle swarm optimization method for its solution. Cao et al.[26] also addressed the open vehicle routing problem with uncertain demand, describing customer demand as a specific bounded uncertainty set with expected demand values and nominal values. They constructed a robust optimization model, proposed four robust strategies to address uncertain demand, and designed an improved differential evolution algorithm for its solution. Gounaris et al.[27] focused on the robust capacitated vehicle routing problem under demand uncertainty, constructing a chance-constrained robust optimization model. Zhao et al.[28] addressed the simultaneous pickup and delivery vehicle routing problem with fluctuating customer demand, constructing a disruption management model and designing an improved tabu search algorithm for its solution. These studies can provide more flexible and efficient vehicle scheduling solutions for enterprises in practice, and new ideas for dealing with such uncertainty problems of TTRP.
Some scholars have researched VRP considering other uncertainty factors. Wang et al.[29] addressed parameter uncertainty in vehicle routing problems by introducing a new method that combines cutting plane techniques with advanced branch-price-and-cut algorithms. Mu et al.[30] addressed the perturbed vehicle routing problem by constructing a disruption management model and designing two tabu search algorithms for its solution. Uccedilar & Muter[31] considered the multi-depot vehicle scheduling problem under two types of disturbances: delays and additional trips. They proposed a column generation algorithm to eliminate the impact of disturbances by swapping some routes and rescheduling the vehicles. These studies can enrich the research on VRP under uncertainty and provide a reference for the research on TTRP under uncertainty.
Existing research on the scheduling of tractor and trailer transportation mainly focus on deterministic environments. However, in the practical process of tractor and trailer transportation, disrupted events often occur, such as vehicle malfunction, change of time windows or task origin/destination, and addition of new tasks. Such unexpected events may result in decreased efficiency, increased costs, compromised service quality, increased safety risks, and increased difficulty in executing the original plan.
To maintain high efficiency and operational stability of tractor and tailer transportation system, it is necessary to handle disruptive events and generate new scheduling plans with minimal impact on service quality. Therefore, how to generate a robust scheduling plan with minimal deviations to the original scheduling plan is an important research topic. Thus this paper measures the impact of disrupted events on the tractor and trailer transportation system from the perspectives of deviation under three states of the tractor. It constructs a disruption management model with the goal to minimize the cost of each deviation to provide decision support for generating a new scheduling plan with minimal impact on the original scheduling plan of tractor and trailer transportation.
-
The Tractor and Trailer Routing Problem (TTRP) is a complex combinatorial optimization problem that involves arranging combined paths of the tractors and trailers to fulfill a set of transportation tasks. Considering the influence of disrupted events, the objective is to minimize the generalized cost, which is the sum of the number of used vehicles, deviation of path under different driving conditions, time deviation, and the penalty cost of abandoning tasks while satisfying a series of constraints.
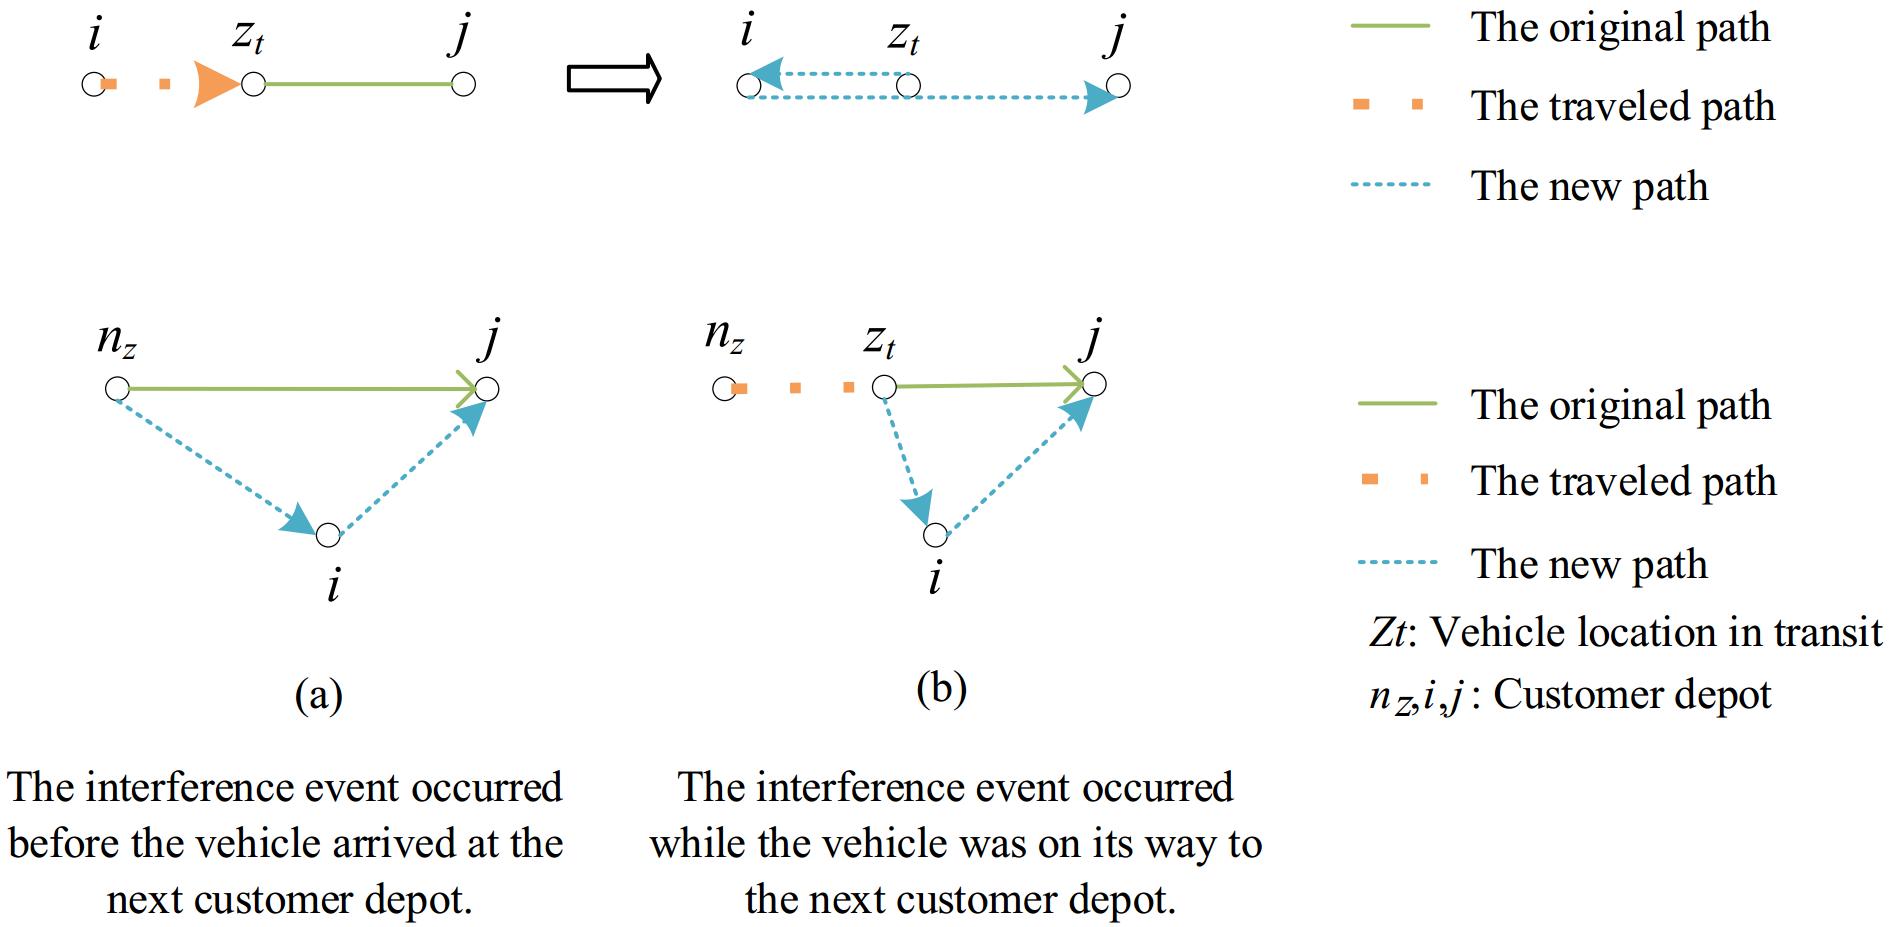
Therein, the tractor's transportation tasks are categorized into receiving and delivering, with each main task further divided into two sub-tasks: delivering an empty trailer and loading a heavy trailer for receiving, and taking an empty trailer and delivering a heavy trailer for delivering. Each sub-task can be accomplished by a different tractor. The tractor follows a sequence to complete these tasks, operating in three states: tractor towing loaded trailers, towing empty trailers, and idle driving. The deviation of the re-routing caused by the addition of a new transportation task is shown in Fig. 1.
The deviation of the route is divided into two situations: (1) When the tractor receives a new task before leaving the end point nz of the previous transportation task, the vehicle directly goes to the starting point i of the new task after completing the current task, as shown in Fig. 1a. At this time, the deviation of the route is manifested as a decrease in
$ {r}_{{n}_{z}jk} $ $ {r}_{{n}_{z}ik} $ $ {r}_{{n}_{z}jk} $ $ {r}_{{n}_{z}ik} $ Based on the hub-and-spoke tractor and trailer transportation network, this article generates an initial scheduling plan to minimize transportation costs under three states: tractor-towing loaded trailers, towing empty trailers, and idle driving. The tractor executes the transportation operation according to the generated scheduling plan. Taking the addition of transportation tasks as an example, this article explores the impact of emergencies on the current tractor execution scheduling plan. Three factors including transportation time deviation, transportation path deviation, and vehicle deviation, are selected to measure the impact of disrupted events on the original scheduling plan. Based on this, a new plan with minimal impact on the original scheduling plan is generated.
Indicators are selected to measure the impact of disrupted events on the transportation subject, including the deviation of towing loaded trailers, towing empty trailers, and idle driving transportation routes, the deviation of transportation time, and the deviation of the number of used vehicles.
The implementation of the transportation task of the swap transportation is divided into three stages: tractor towing the empty trailer from the depot to the customer point, the tractor towing the heavy trailer from the customer point to the swap center, and the tractor towing the empty trailer from the customer point or swap center to the depot. Thus the deviation of the empty trailer of the tractor is manifested as the deviation of the path of delivering the empty trailer to the customer point and delivering the empty trailer from the customer point or swap center to the depot in completing the newly added transportation task. The deviation of the idle driving of the tractor is manifested as the deviation of the idle driving path of the tractor caused by the connection between the newly added transportation task and the uncompleted task in the scheduling plan.
The time deviation caused by the addition of transportation tasks is reflected in its impact on the unfinished transportation tasks of the tractor. The completion of the new transportation tasks by the tractor will have an impact on the completion time of the original transportation tasks, which may cause the tractor to arrive at the customer point of the original task beyond its time window limit. The deviation in the number of used vehicles caused by a new transportation task is reflected in the change in the number of vehicles in the system.
-
(1) The vehicles are stored in the trailer-on-trailer center and the number of vehicles is a fixed value;
(2) Whenever the tractor is towing an empty trailer, heavy trailer, or empty truck, the driving speed is consistent;
(3) A tractor can only tow one semi-trailer at a time;
(4) The time for the tractor to unhook/hook the trailer is negligible;
(5) Time window constraints exist at customer points;
(6) The transportation network structure is in the form of hub-and-spoke, with two hubs in the network.
Parameters and variables
Parameters
-
The notations of the nodes and associated tasks in the model are defined in Table 1.
Table 1. Parameters and meanings of nodes and related tasks.
Parameters Meanings Parameters Meanings K Set of transportation vehicles, K = {1, 2, k, ..., K}, K = K* $ \cup $ K' M Set of tasks, M = {1, 2, m, ..., M}, M = M* $ \cup $ M' K* Set of vehicles currently in transit, K* = {1, 2, 3, k*, ..., K*} M* Set of newly added disruptive task set, M* = {1, 2, m*, ..., M*} K' Set of remaining vehicles, K' = {1, 2, k', ..., K'} M' Set of original tasks, M' = {1, 2, m', ..., M'} N Set of transportation nodes, N = {1, 2, n, ..., N}, N = C $ \cup $ S M" Set of unfinished transportation tasks at the time of the disruption occurrence, M" = {1, 2, m", ..., M"} S Set of trailer-swapping centers, S = {1, 2, s, ..., S} tijk The time taken by tractor k to travel from customer point i to customer point j n" Node that is currently being serviced after the occurrence of the disturbance. C Set of customer points, C = {1, 2, c, ..., C} nz Current location of the vehicle in transit Relevant parameters such as resource and runtime requirements of the trailer exchange transportation network are defined as shown in Table 2.
Table 2. Parameters and meanings of dumping network resources and operating moments.
Parameters Meanings Parameters Meanings V Speed of the vehicle C2 Path deviation cost of the tractor towing a loaded trailer t The time of the occurrence of the disturbance C3 Path deviation cost of the tractor towing an empty trailer p The number of vehicles already in use C4 The cost of path deviation for a tractor driving in an empty state p' The number of remaining vehicles in the depot C5 The cost of time deviation for a task e Status of the tractor, e = {e1, e2, e3} C6 Penalty cost for abandoning a task by a tractor e1 Status of the tractor towing an empty trailer c1 Fixed cost coefficient for vehicles e2 Status of the tractor towing a loaded trailer Gk The rated carrying capacity of the tractor e3 Status of the tractor with idle driving Wk The weight of an empty trailer cz The cost per unit of tractor driving in different statuses (in CNY), cz = {c2, c3, c4} Wm The weight of task m c2 Driving cost of the tractor towing an empty trailer α Coefficient of early arrival penalty c3 Driving cost of the tractor towing a loaded trailer $\phi $ Coefficient of task time deviation penalty c4 Driving cost of the tractor when it is idle driving γ The cost coefficient for abandoning a task p* The newly dispatched vehicle tmk The original start time of the task f0 The transportation cost coefficient $t'_{mk}$ The new start time of the task $ {{t}_{{{m}_{d}}{{m}_{o}}{k}}} $ The time taken by tractor k to travel from the starting point to the ending point of task m d2k Remaining mileage of tractor k with an empty trailer ${t_{m^{\text{k,e}}}}$ The start time of tractor k to perform task m d3k The remaining mileage of tractor k with a loaded trailer ${t_{m^{\text{k,}}l}}$ The end time of tractor k to perform task m d4k The remaining mileage of tractor k when driving empty C Total cost ETm The required start time for task m C1 The deviation cost of the used vehicles LTm The required end time for task m Variables
-
$ {{r}}_{{ijk}}^{{e}}=\left\{\begin{array}{l} 1,\;\;{\mathrm {if \;tractor}}\;{k}\;{\mathrm{ drives\;from\;point}}\;{i}\;{\mathrm {to}}\;{j}\;{\mathrm {in\;state}}\;{e}\\ {0},\quad\quad\quad\quad\quad\quad{\mathrm{ else}}\end{array}\right. $ $ {y_{mk}} = \left\{ {\begin{array}{l} {1,\;\; {\mathrm {if\;task}}\; m\;{\mathrm{is\; completed\; by\; tractor}}\;k} \\ {0,\quad\quad\quad\quad\quad {\mathrm{ else}}} \end{array}} \right. $ Mathematical model
-
Based on the disruption management modeling methodology, this paper defines the objective function as minimizing the sum of the generalized costs, including deviation of the number of used vehicles, deviation of the path under different driving conditions, time deviation, and the penalty cost of abandoning tasks, as shown below.
Objective function:
$ \min C = ({C_1} + {C_2} + {C_3} + {C_4} + {C_5} + {C_6}) $ (1) $ {C_1} = {c_1} \cdot p $ (2) $\begin{split} {C_2} =\;& \sum\limits_{k = 1}^{p + {p^*}} {c_2} \cdot \Bigg( \sum\limits_{j = 0}^n {r_{{n^{''}}jk}^{{e_2}}{d_{{n^{''}}jk}} + \sum\limits_{j = 0}^n \left( {r_{{n^{''}}{n_z}k}^{{e_2}}{d_{{n^{''}}{n_z}k}} + r_{_{{n_z}jk}}^{{e_2}}{d_{{n_z}jk}}} \right)} +\\& \sum\limits_{i = 0}^n \sum\limits_{j = 0}^n {r_{_{ijk}}^{{e_2}}{d_{ijk}}} - {d_{2k}} \Bigg)\end{split} $ (3) $ {C_3} = \sum\limits_{k = 1}^{p + p*} {{c_3} \cdot \left( {\sum\limits_{i = 0}^n {\sum\limits_{j = 0}^n {r_{ijk}^{{e_3}}{d_{ijk}} - {d_{3k}}} } } \right)} $ (4) $ {C_4} = \sum\limits_{k = 1}^{p + p*} {{c_4} \cdot \left( {\sum\limits_{i = 0}^n {\sum\limits_{j = 0}^n {r_{ijk}^{{e_4}}{d_{ijk}} - {d_{4k}}} } } \right)} $ (5) $ {C}_{5}={\displaystyle \sum _{k=1}^{p+{p}^{*}}{\displaystyle \sum _{m=0}^{{m''}+{n}^{*}}\varphi \cdot}}{y}_{mk} $ (6) $ {C}_{6}={\displaystyle \sum _{k=1}^{p+{p}^{*}}{\displaystyle \sum _{m=0}^{{m''}+{n}^{*}}\gamma \cdot}}(1-{y}_{mk}) $ (7) Equation (1) is the deviation of the generalized cost. Equation (2) is the deviation cost of the used vehicles. Equation (3) is the deviation of the tractor’s paths towing the loading trailer. Equation (4) is the deviation of the tractor’s paths towing an empty trailer. Equation (5) is the deviation cost of the path of towed vehicles when idle driving. Equation (6) is the time deviation cost of the task. Equation (7) is the penalty cost of the tractor when abandoning the task.
Constraints:
$ \sum\limits_{k = 1}^{p + {p^*}} {{y_{mk}} = 1,\;m \in 1,2,3,....,{m''} + {n^*}} $ (8) $ \sum\limits_{k = 1}^{p + {p^*}} {{y_{mk}}{W_m}} + {W_k} \leqslant {G_k},\; m \in 1,2,3...,{m''} + {n^*} $ (9) $ {\displaystyle \sum _{i=0}^{n}{r}_{{}_{sik}}^{e}{d}_{sik}=1,\; k\in 1,2,3,\mathrm{...},}p+p*;\; s\in 1,2,\mathrm{3...},n $ (10) $ {\displaystyle \sum _{j=0}^{n}{r}_{{}_{jsk}}^{e}{d}_{jsk}=1,\; k\in 1,2,3,\mathrm{...},}p+p*;\; s\in 1,2,\mathrm{3...},n $ (11) $ {\displaystyle \sum _{i=0}^{n}{X}_{sik}}={\displaystyle \sum _{i=0}^{n}{X}_{isk}=1,\; k\in 1,2,3,\mathrm{...},p+p*};\; s\in 1,2,\mathrm{3...},n $ (12) $ \sum\limits_{\text{k}}^{p + p*} {{t_{mk,l}}} + {{\text{t}}_{{m_o}{m_d}k}} + {{\text{t}}_{{m_d}{m_o}k}} \leqslant {t_{m^{\text{k,e}}}},\; m,\; m \in 1,2,3,...,n $ (13) $ \varphi = \left\{ {\begin{array}{*{20}{c}} {\alpha \cdot \left( {E{T_m} - t_{mk}^{'}} \right) + \phi \left| {t_{mk}^{'} - {t_{mk}}} \right|,\; E{T_m} \gt t_{mk}^{'}} \\ {\phi \left| {t_{mk}^{'} - {t_{mk}}} \right|,\begin{array}{*{20}{c}} {\begin{array}{*{20}{c}} {}&{} \end{array}}&{} \end{array}E{T_m} \leqslant t_{mk}^{'} \leqslant L{T_m}} \\ {M,\begin{array}{*{20}{c}} {\begin{array}{*{20}{c}} {}&{} \end{array}}&{}&{}&{} \end{array}t_{mk}^{'} \gt L{T_m}\begin{array}{*{20}{c}} {}&{} \end{array}} \end{array}} \right. $ (14) $ \sum\limits_{i = 0}^n {r_{ilk}^e = \sum\limits_{j = 0}^n {r_{ljk}^e = 1,\; k \in 1,2,3,...p + p*} ,\; l \in 1,2,3,...,n} $ (15) $ p* \leqslant p' $ (16) Equation (8) indicates that each task can only be completed by one vehicle. Equation (9) indicates that the freight volume cannot exceed the vehicle capacity. Equation (10) indicates that each tractor must depart from the coupling center. Equation (11) indicates that the tractor must return to the coupling center after the task is completed. Equation (12) indicates the status of the tractor traveling to and from the depot. Equation (13) indicates that the time for the tractor to start executing the task must be after the completion of the previous task. Equation (14) indicates the time penalty cost coefficient. Equation (15) indicates the balance of node task flow. Equation (16) indicates that the number of newly dispatched tractors in the system must be less than the number of remaining tractors in the system.
-
Due to the NP-hard nature of the TTRP problem under changing task status, and the sudden and random nature of the occurrence of new transportation tasks, it is necessary to process the newly added transportation tasks in a timely manner to minimize their disruption to the transportation system. Although the CNA (contract network algorithm) can solve the problem of task distribution, and the bidding and selection process in the algorithm also has a certain degree of randomness, the simulated annealing algorithm avoids falling into the local optimal by accepting the poor solution with probability, and the way of continuously lowering the temperature and iterative search to find the global optimal solution is more global, and the nodes inside the task are more optimized after the task is assigned. Therefore, this article designs a CNSAA (Contract Net and Simulated Annealing Algorithm) to solve the proposed problem. The algorithm simulates the bidding process of a project to process the newly added transportation tasks, to generate an initial solution. Two types of neighborhood search methods are used to search for new solutions in the simulated annealing algorithm process, and when the temperature reaches the termination temperature, a scheduling scheme is output.
Algorithm flowchart
-
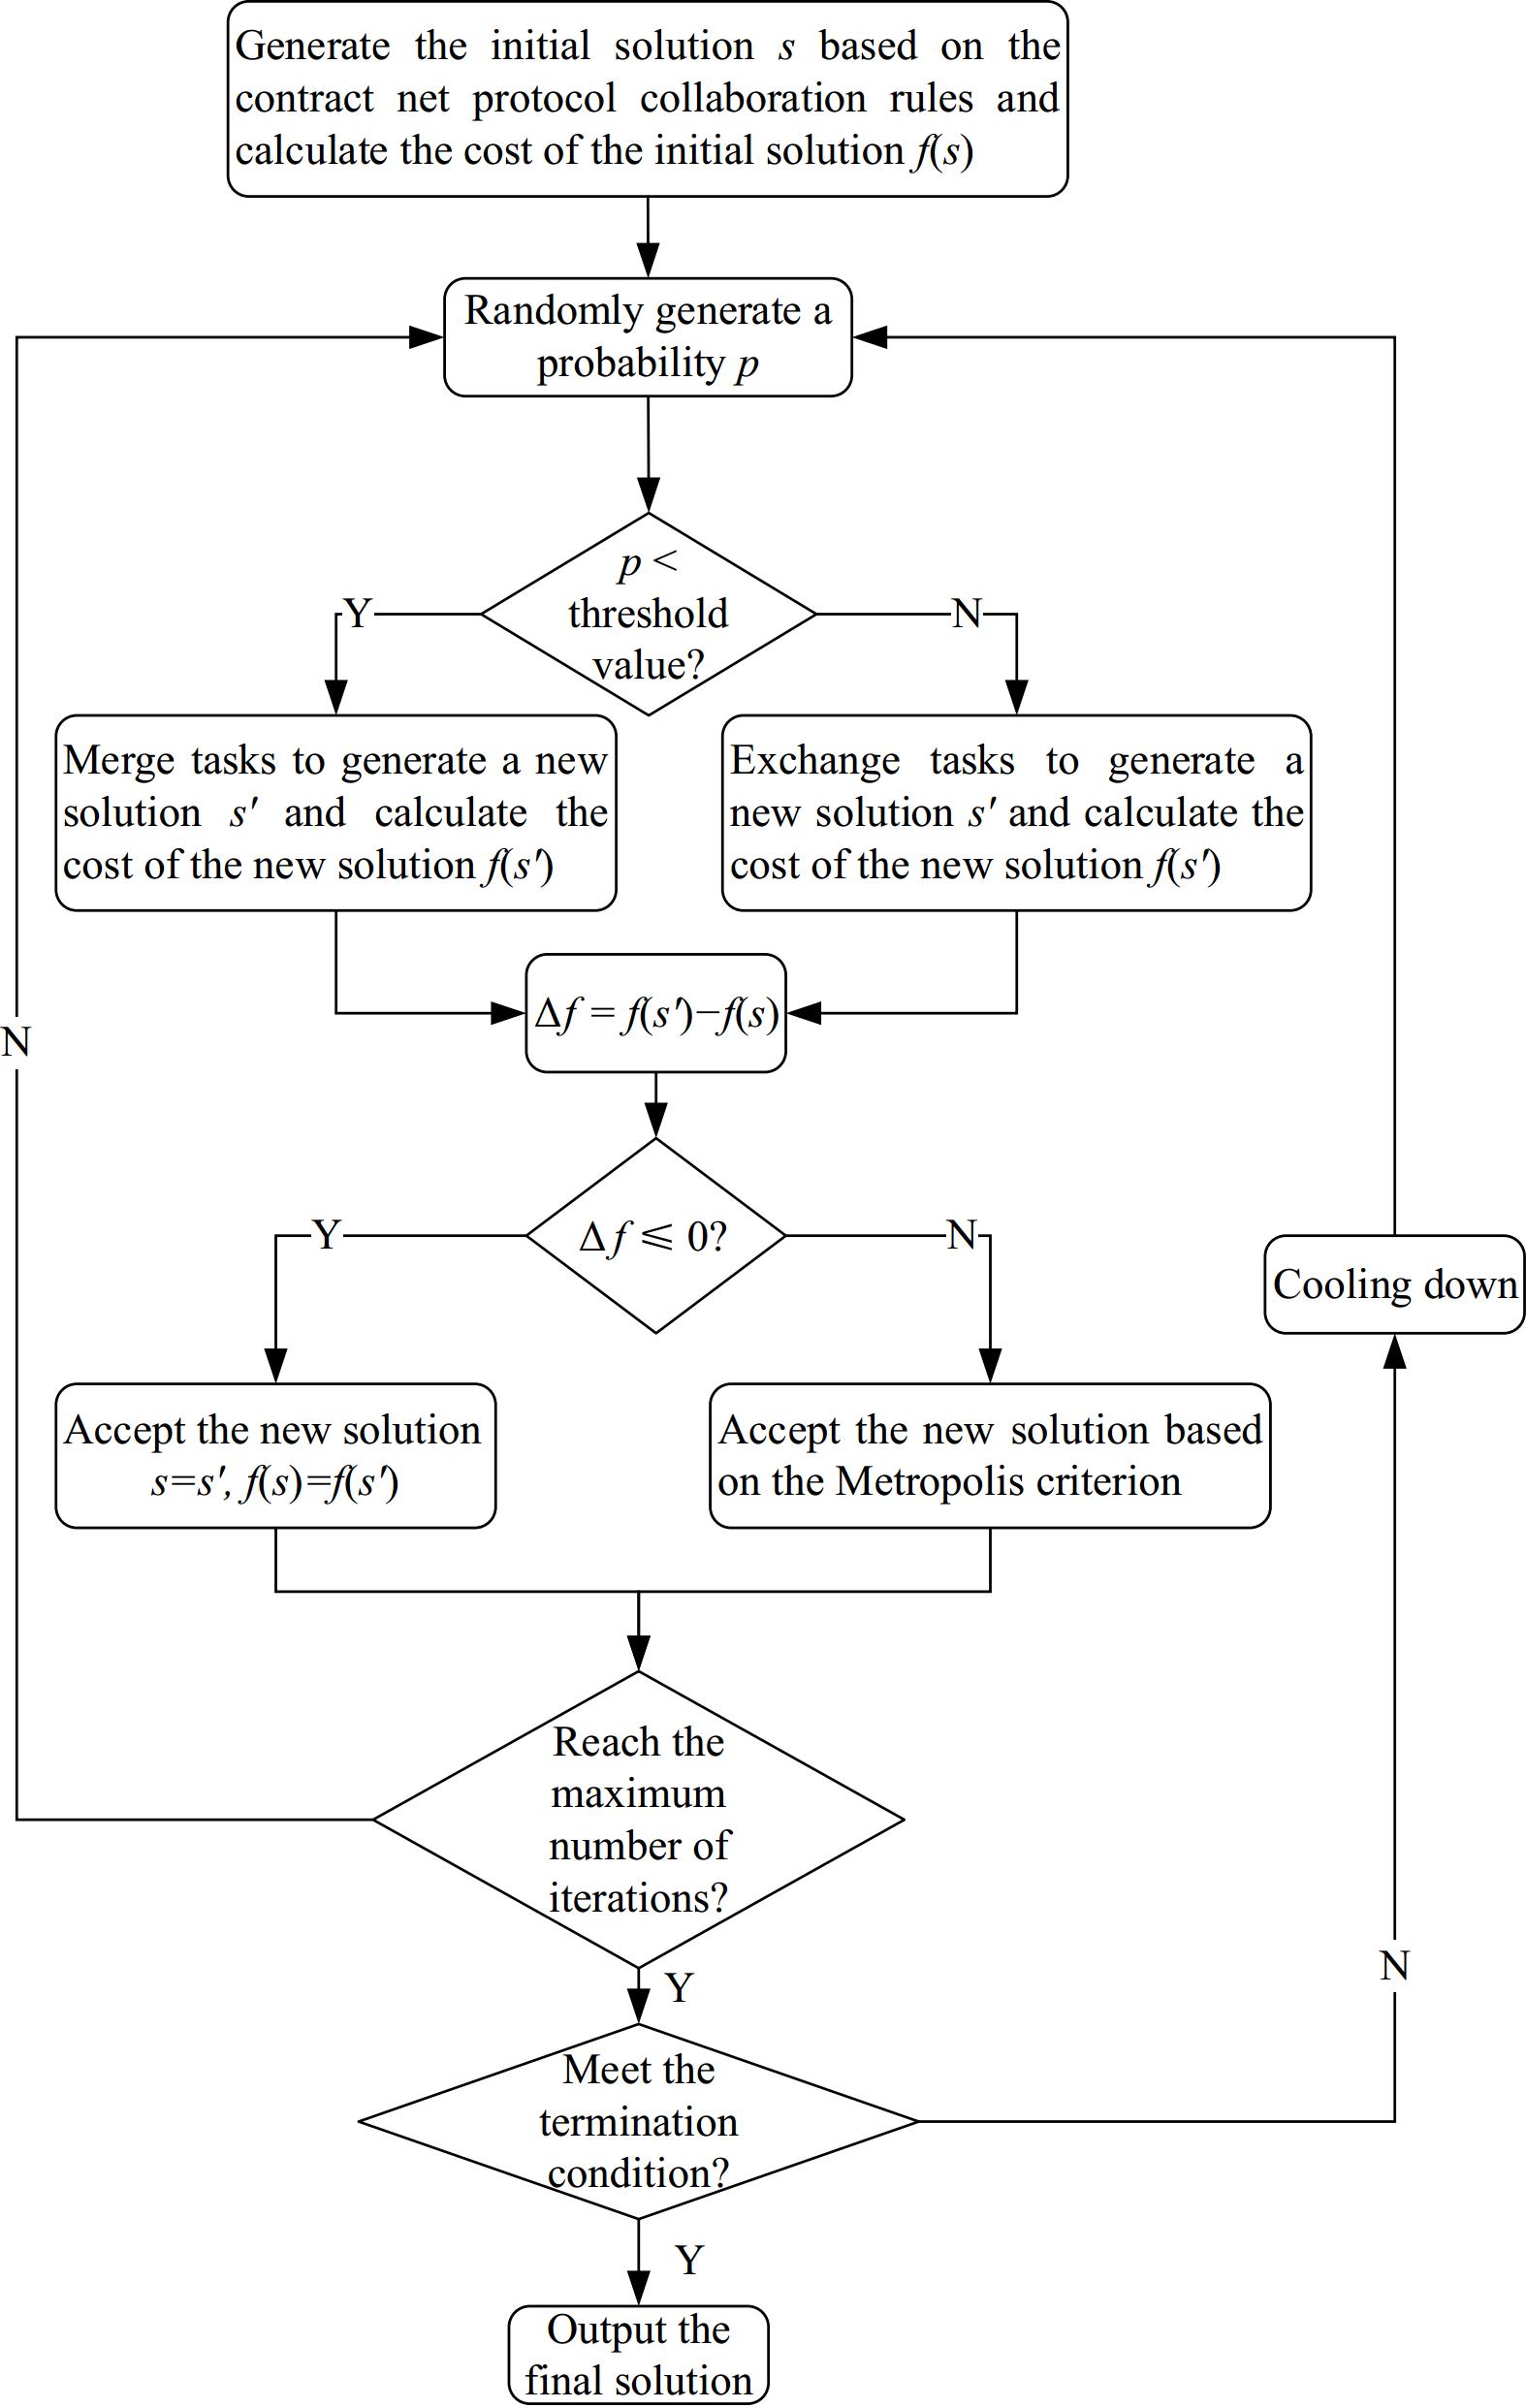
The flowchart of the proposed CNSAA is shown in Fig. 2. The main operations of the algorithm are as follows:
Step 1: Generate an initial solution and calculate the cost f(s) based on the bidding rules in the contract network algorithm.
Step 2: Generate a random probability p and compare it with the given value.
Step 3: If p < the given value, choose the task merging method to generate a new solution, otherwise choose the task swapping method to generate a new solution, and calculate the cost f(s') of the new solution.
Step 4: Calculate the cost difference Δf between the new solution and the old solution.
Step 5: Determine whether Δf is less than or equal to 0. IfΔf ≤ 0, accept the new solution; otherwise, accept the new solution according to the Metropolis criterion.
Step 6: Determine whether the maximum number of iterations is reached. If yes, go to Step 7; otherwise, go to Step 2.
Step 7: Determine whether the termination condition is met. If yes, output the final solution; otherwise, go to Step 2.
Initial solution generation
-
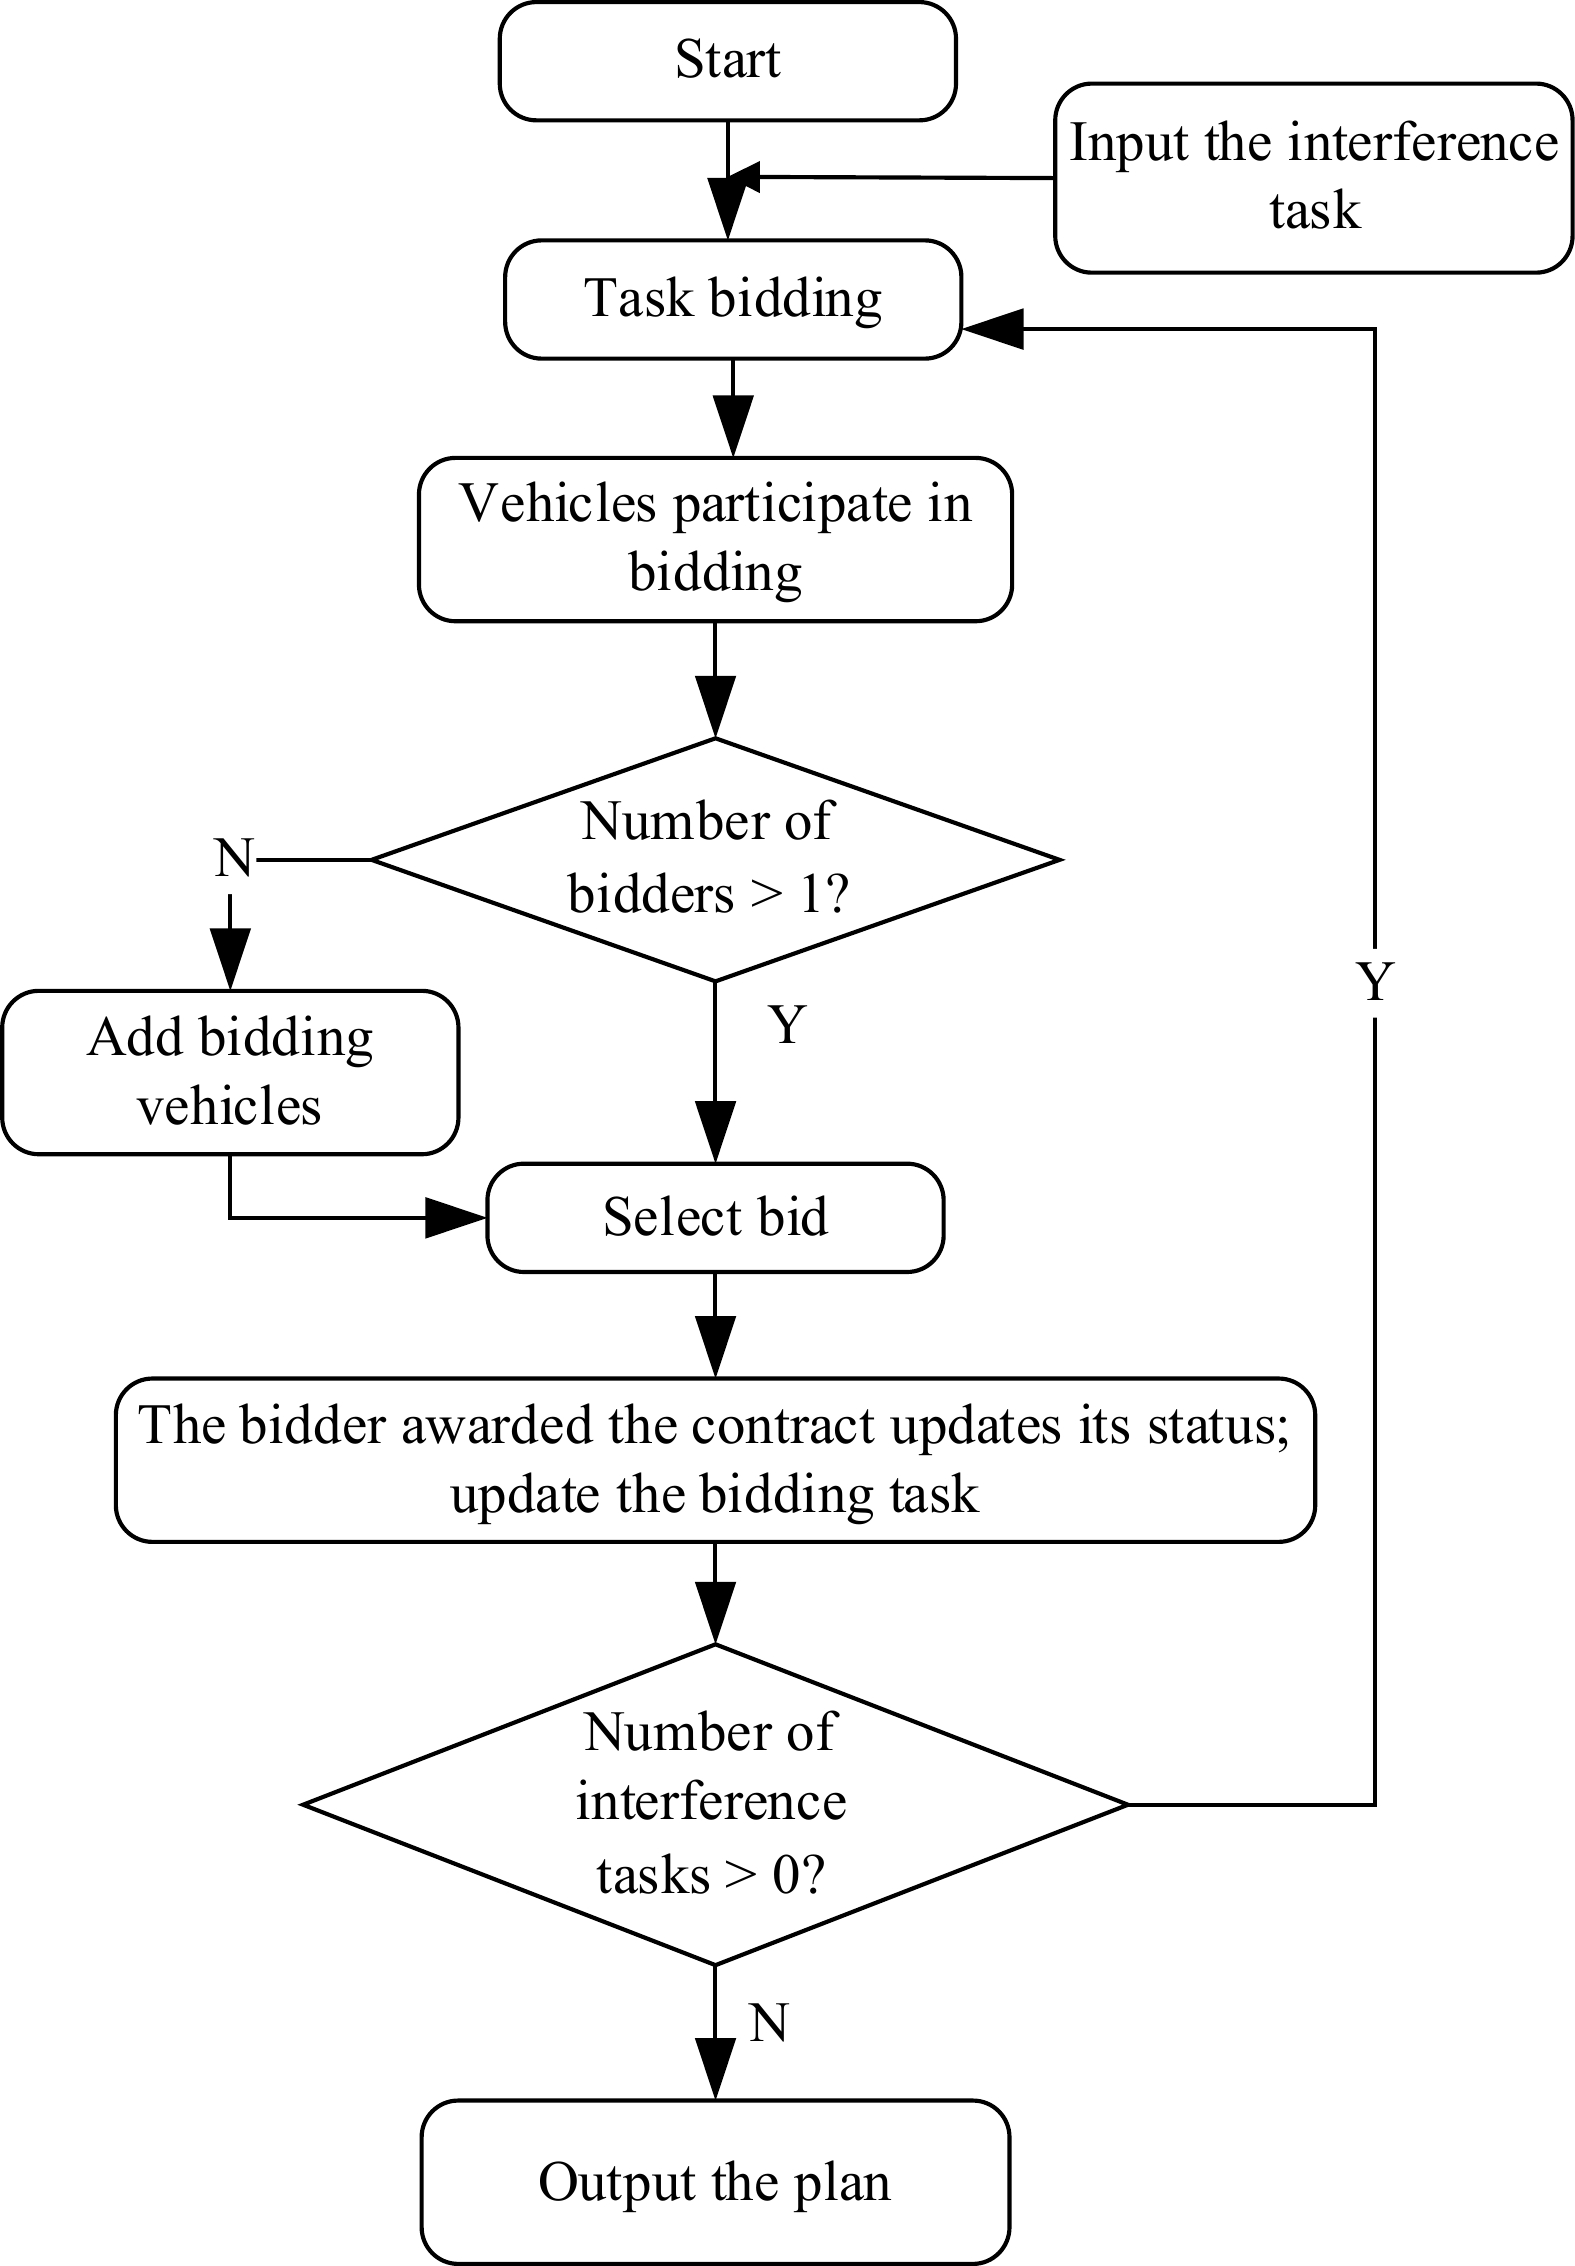
The generation rules for the initial solution are as follows. Set up a virtual customer for publishing transportation tasks, and compare the occurrence of new transportation tasks to the process of a company issuing a bidding project. The tractor in the transportation system is analogous to the participating bidding companies. The task allocation process of the initial solution is a bidding process for multiple tasks. Therefore, the allocation process for each task is divided into four parts: task bidding, vehicle bidding, task winning, and task execution. When there is no task bidding in the system, an initial solution is formed. The generation process of the initial solution is shown in Fig. 3.
The main operations of the generation for the initial plan based on the contract net algorithm are as follows:
Step 1: Enter the disruption task.
Step 2: Publish the task bidding information according to the order of appearance of the disrupted tasks.
Step 3: Each vehicle determines whether to participate in the bidding based on its status, and the vehicles that participate in the bidding calculate their costs to complete the bidding task.
Step 4: Determine whether the number of vehicles participating in the bidding is greater than 1. If it is, select the bid based on the bidding costs of each vehicle. Otherwise, add new vehicles to participate in the bidding.
Step 5: The winning vehicle updates its status.
Step 6: Determine whether the number of tasks not subject to bidding is greater than 0. If yes, go to Step 2; otherwise, output the scheduling plan.
Design of solution space structure
-
In this algorithm, the coding method of the scheduling scheme is integer coding, as shown in Fig. 4. The line number in the list represents the number of vehicles and the integer in each line represents the task sequence of vehicles. The scheduling scheme in Fig. 4 is completed by four vehicles. For example, the task sequence of vehicle 1 is 2-1-4-8-5-26-27, the task sequence of vehicle 2 is 3-6-9-7-11-10-19-21-29, the task sequence of vehicle 3 is 9-14-13-22-23, and the task sequence of vehicle 4 is 12-16-18-20-24-25-30.
Neighborhood search method
-
This algorithm uses two types of neighborhood search methods, namely merging tasks and swapping tasks, to search for new solutions. The following are descriptions of the two types of neighborhood search methods:
(1) Merging tasks. First, select vehicles with a task quantity of 1. If the number of vehicles that meet the conditions is greater than 2, merge the tasks in these vehicles in order of task start time. As shown in Fig. 5, vehicles 1-4 all have just one transportation task. Vehicle 1 has task number 1, vehicle 2 has task number 2, vehicle 3 has task number 4, and vehicle 4 has task number 3. After the merging operation, the transportation task that originally required four vehicles to complete becomes one vehicle that completes four tasks. The vehicle's task sequence is 1-2-3-4.
(2) Exchange tasks. Randomly select two vehicles and randomly select new tasks in the vehicle task sequence from the two-vehicle sequences for exchange. If there are no new tasks in the randomly selected vehicle task sequence, a new vehicle needs to be selected. As shown in Fig. 6, vehicles 1 and 2 are randomly selected. The task sequence of vehicle 1 is 1-3-5-7-9-11, where tasks 3 and 9 are new transportation tasks added to vehicle 1, and the remaining tasks are the original transportation tasks of vehicle 1. The task sequence of vehicle 2 is 10-6-8-2-12-13, where tasks 2, 12, and 13 are new transportation tasks added to vehicle 2, and the remaining tasks are the original transportation tasks of vehicle 2. Randomly select task 3 in vehicle 1 and task 12 in vehicle 2 for exchange. After the exchange, the task sequence of vehicle 1 is changed to 1-12-5-7-9-11, and the task sequence of vehicle 2 is changed to 10-6-8-2-3-13.
-
To verify the effectiveness of the proposed model and algorithm, this article improves on the Solomon standard instance dataset, selects three road networks, and sets up original examples based on different time window intervals. The planning period is 24 h and the time window is set to be 1/2/3 times the maximum station spacing for each tractor to travel at the current network speed. Each example consists of two drop-off centers and 30 customer points. The number of examples, node numbers, road network types, etc. are detailed in Table 3. The 90 scheduling schemes solved by the original examples are used as the original examples, and the settings for adding new transportation tasks are set according to the number of disrupted tasks. Three different types of examples with different numbers of added tasks are set up, including 5 added tasks, 15 added tasks, and 25 added tasks. The information for the examples is shown in Table 4. The parameters for deviation costs and the CNSAA algorithm are set as shown in Tables 5 & 6.
Table 3. Example settings.
ID Total no. of nodes Type of road network No. of tasks Time window interval Distance between any two points (km) Max. Min. 1-10 30 C 30 60 47 10 11-20 30 C 30 120 59 11 21-30 30 C 30 180 48 5 31-40 30 R 30 60 44 3 41-50 30 R 30 120 60 6 51-60 30 R 30 180 44 5 61-70 30 RC 30 60 94 6 71-80 30 RC 30 120 88 6 81-90 30 RC 30 180 97 5 Table 4. Settings for the example of newly added tasks.
No. of
tasksMax. distance
between tasks
(km)Min. distance
between tasks
(km)Max. task
time window
(min)Min. task
time window
(min)5 46.1 5 313 60 15 59.8 5 333 47 25 59.8 5 333 47 Table 5. Parameter setting for deviation costs.
Cost of vehicle count deviation (CNY/vehicle) Tractor heavy trailer deviation cost (CNY/km) Tractor empty trailer deviation cost (CNY/km) Tractor idle deviation cost (CNY/km) Tractor early arrival penalty (CNY/min) Cost of penalties for abandoning transportation tasks (CNY/task) 300 2.2 1.89 1.51 10 300 Table 6. Parameter setting for the CNSAA algorithm.
Initial temperature (°C) Cooling rate Abandonment of temperature (°C) Internal cycle time (T is the current temperature) 100 0.7 1 100-T/20 In addition, the tractor-trailer travels at 60 km/h while tractor towing loaded trailers, towing empty trailers, and idle driving. To better demonstrate the effectiveness of CNSAA, the algorithm and the contract network algorithm are applied below to solve the proposed problem and the results are compared.
Total deviation cost of the transport system
-
The total deviation cost is categorized into three groups: those under the C road network, the R road network, and those under the RC road network, based on the type of road network.
(1) The total deviation cost in the C road network
The total deviation cost in the results of the two methods used to solve the example under the C road network is shown in Fig. 7. When the number of disrupted tasks is 5, the average difference in the total cost between the two methods is −7,479.175 CNY; when the number of disrupted tasks is 15, the average difference is −30,113.339 CNY; and when the number of disrupted tasks is 25, the average difference is −52,808.907 CNY. The deviation between the two methods gradually increases with the increase in disrupted tasks, thereby demonstrating that the CNSAA under the C road network outperforms the CNA in searching for solutions with a smaller deviation in the total cost.
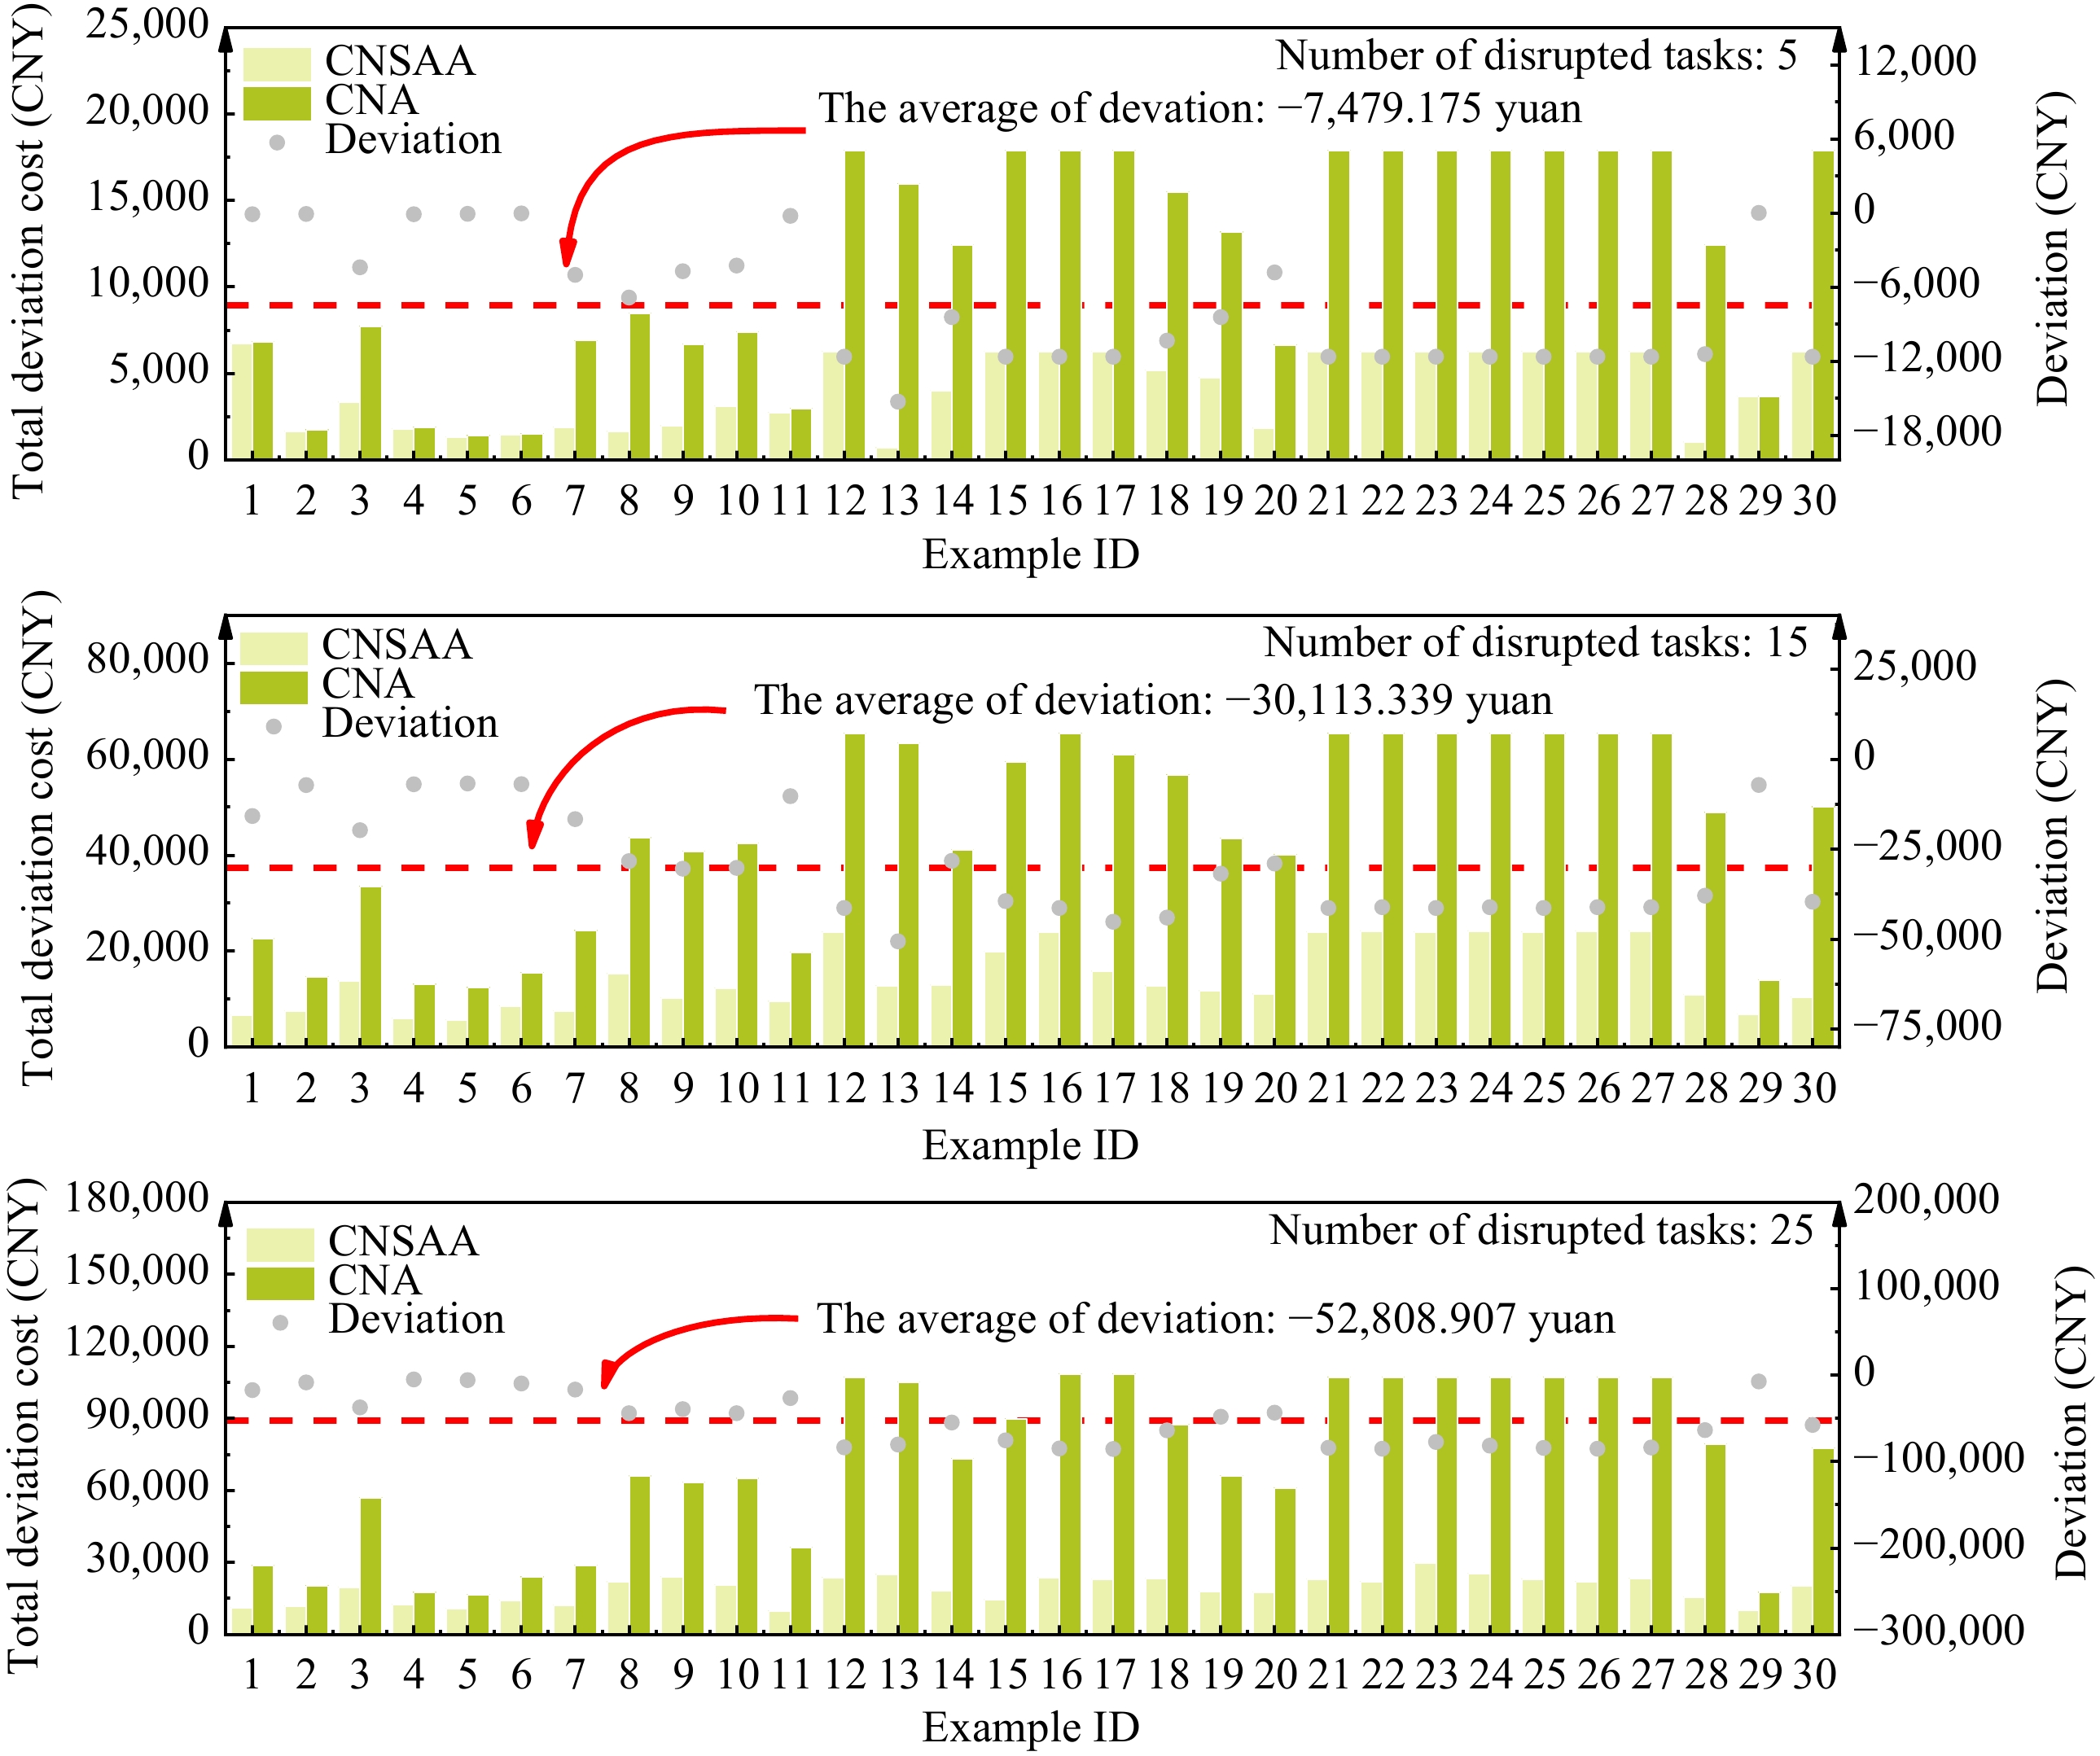
Figure 7.
The total deviation cost in the C road network. Deviation = The total deviation cost of CNSAA − The total deviation cost of CNA.
(2) The total deviation cost in the R road network
The total deviation cost in the results of the two methods used to solve the example under the R road network is shown in Fig. 8. When the number of disrupted tasks is 5, the average difference in total cost between the two methods is −7,088.958 CNY; when the number of disrupted tasks increases to 15, the average difference is −23,504.288 CNY; and when the number of disrupted tasks reaches 25, the average difference is −46,496.53 CNY. The difference between the two methods gradually increases with the increase in the number of disrupted tasks, proving that the CNSAA under the R road network outperforms the CNA in searching for solutions yielding a lower total cost.
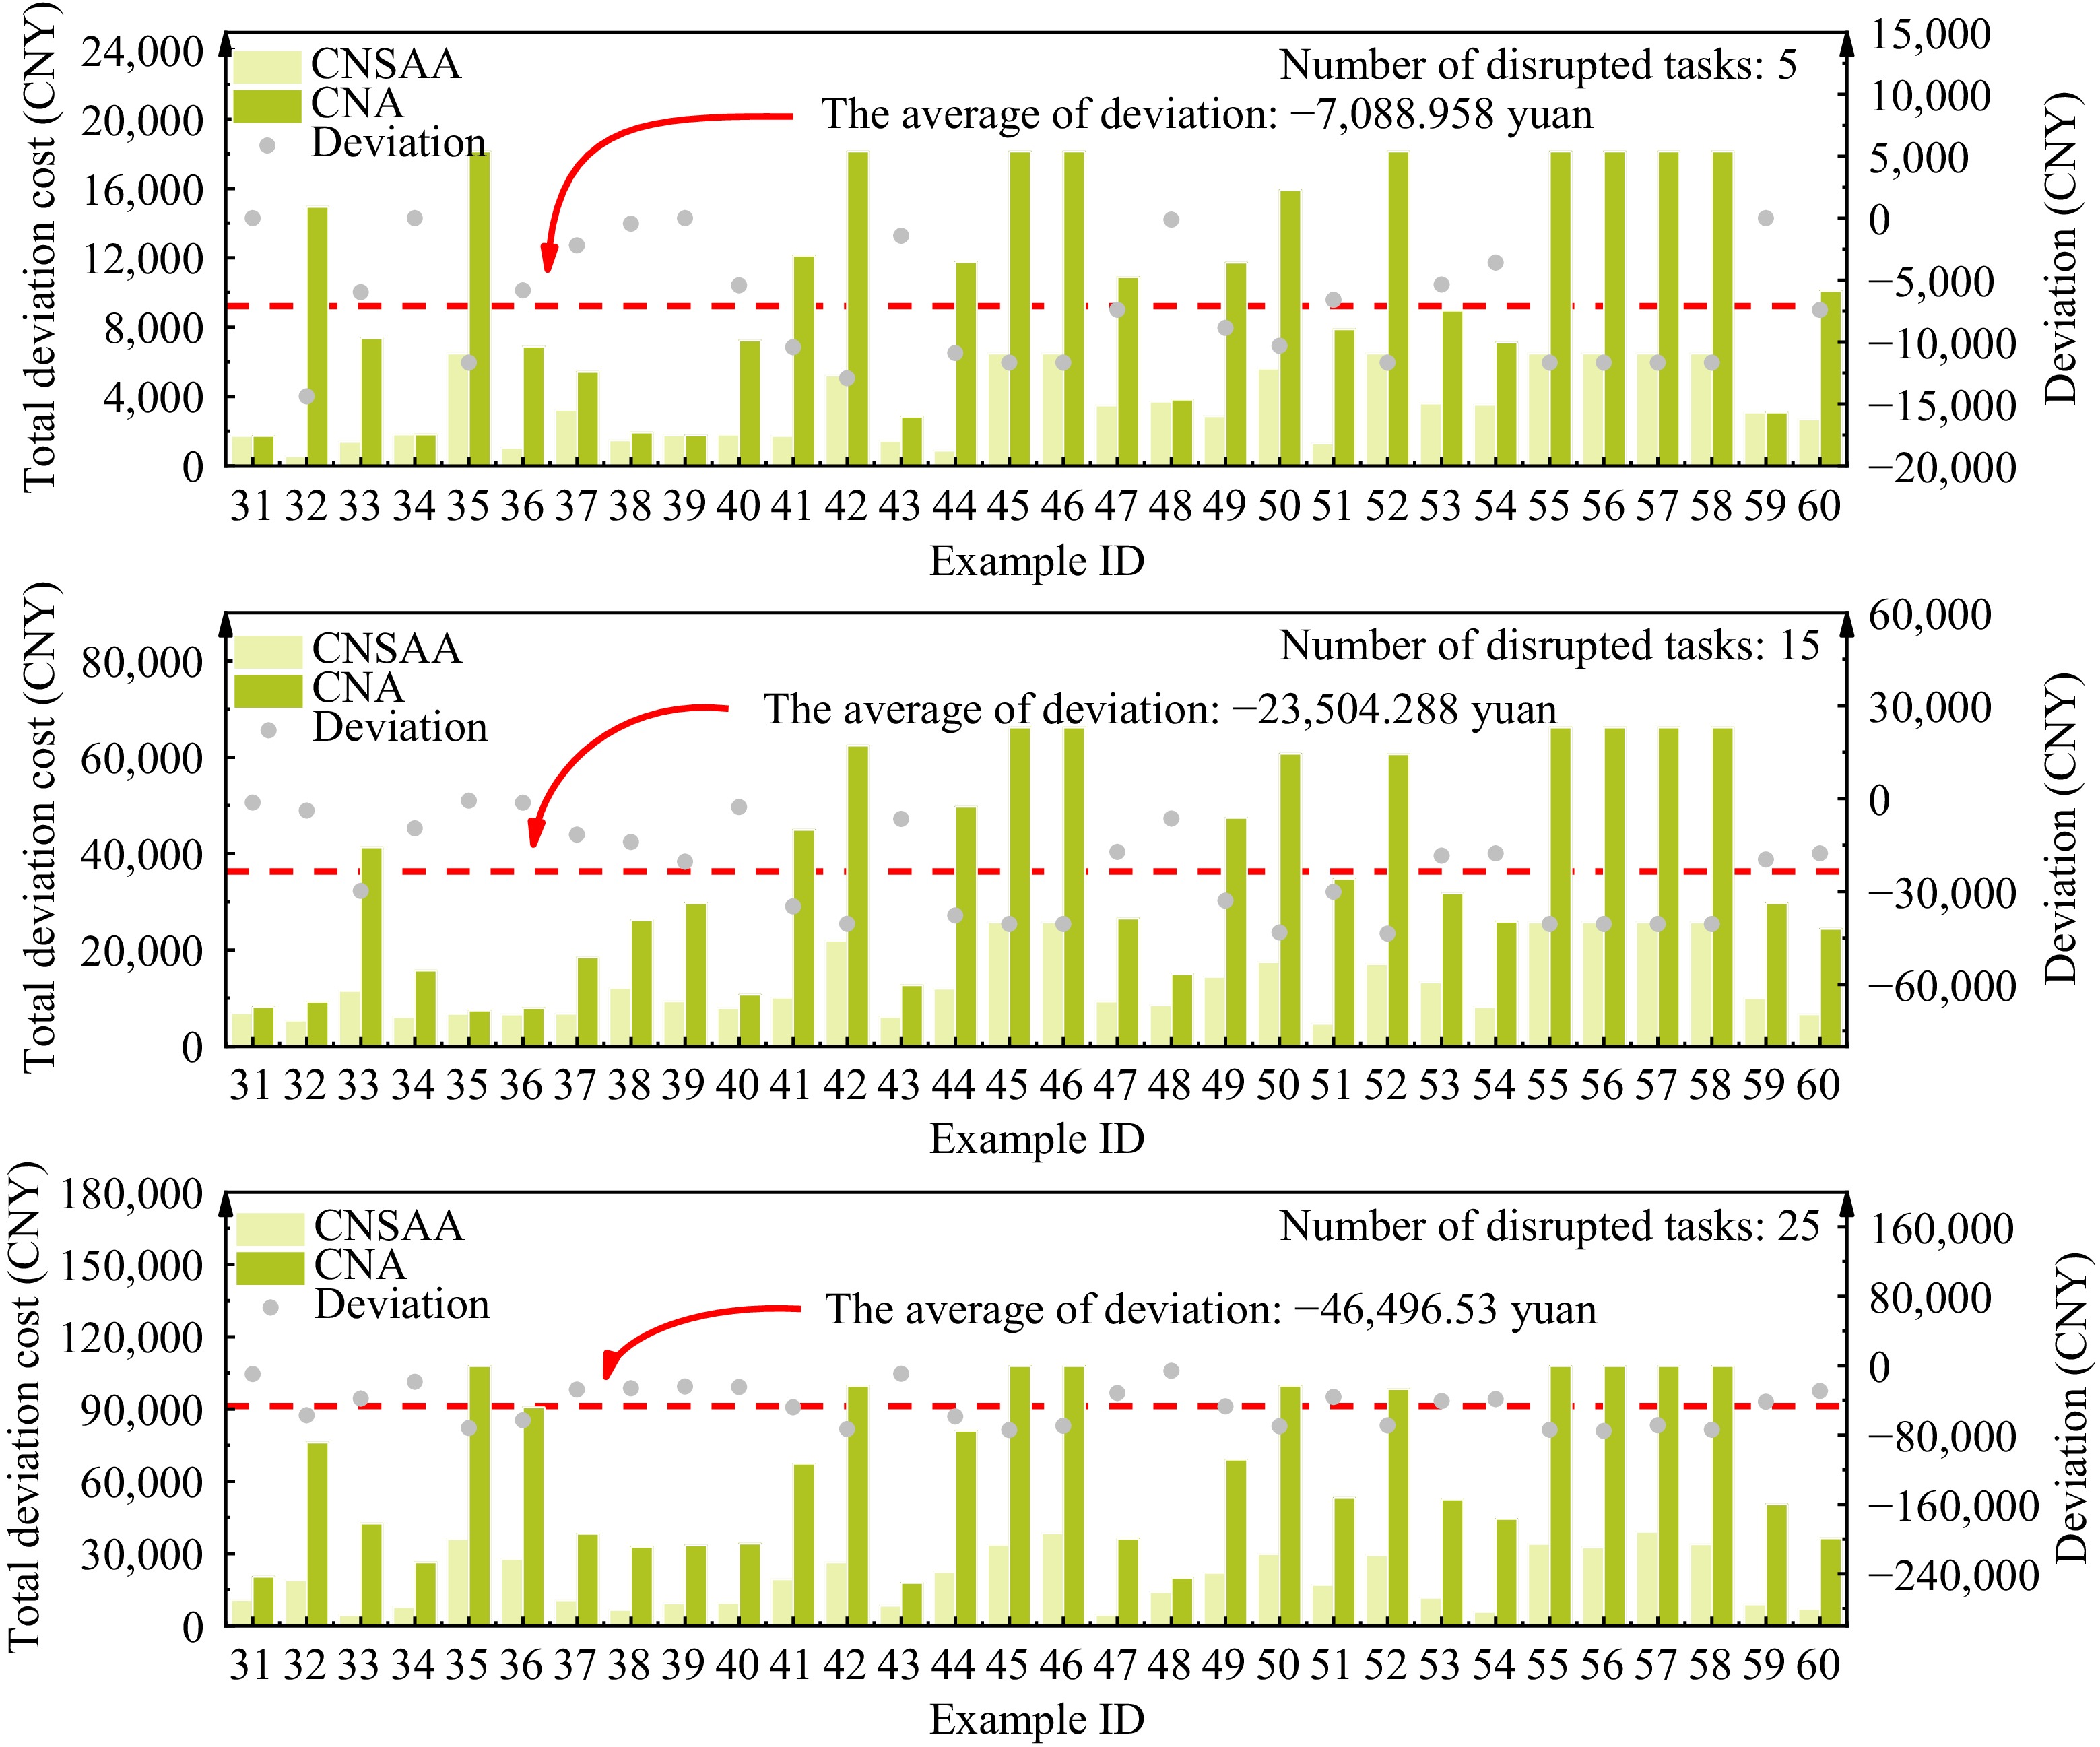
Figure 8.
The total deviation cost in the R road network. Deviation = The total deviation cost of CNSAA − The total deviation cost of CNA.
(3) The total deviation cost in the RC road network
The total deviation cost in the results of the two methods used to solve the example under the RC road network is shown in Fig. 9. When the number of disrupted tasks is 5, the average difference in total cost between the two methods is −2,474.461 CNY; when the number increases to 15, the average difference is −12,648.611 CNY; and when it reaches 25, the average difference is −30,771.43 CNY. The difference between the two methods gradually increases with the increase in disrupted tasks, thereby demonstrating that the CNSAA under the RC road network is better able to search for solutions with a lower total cost than the CNA.
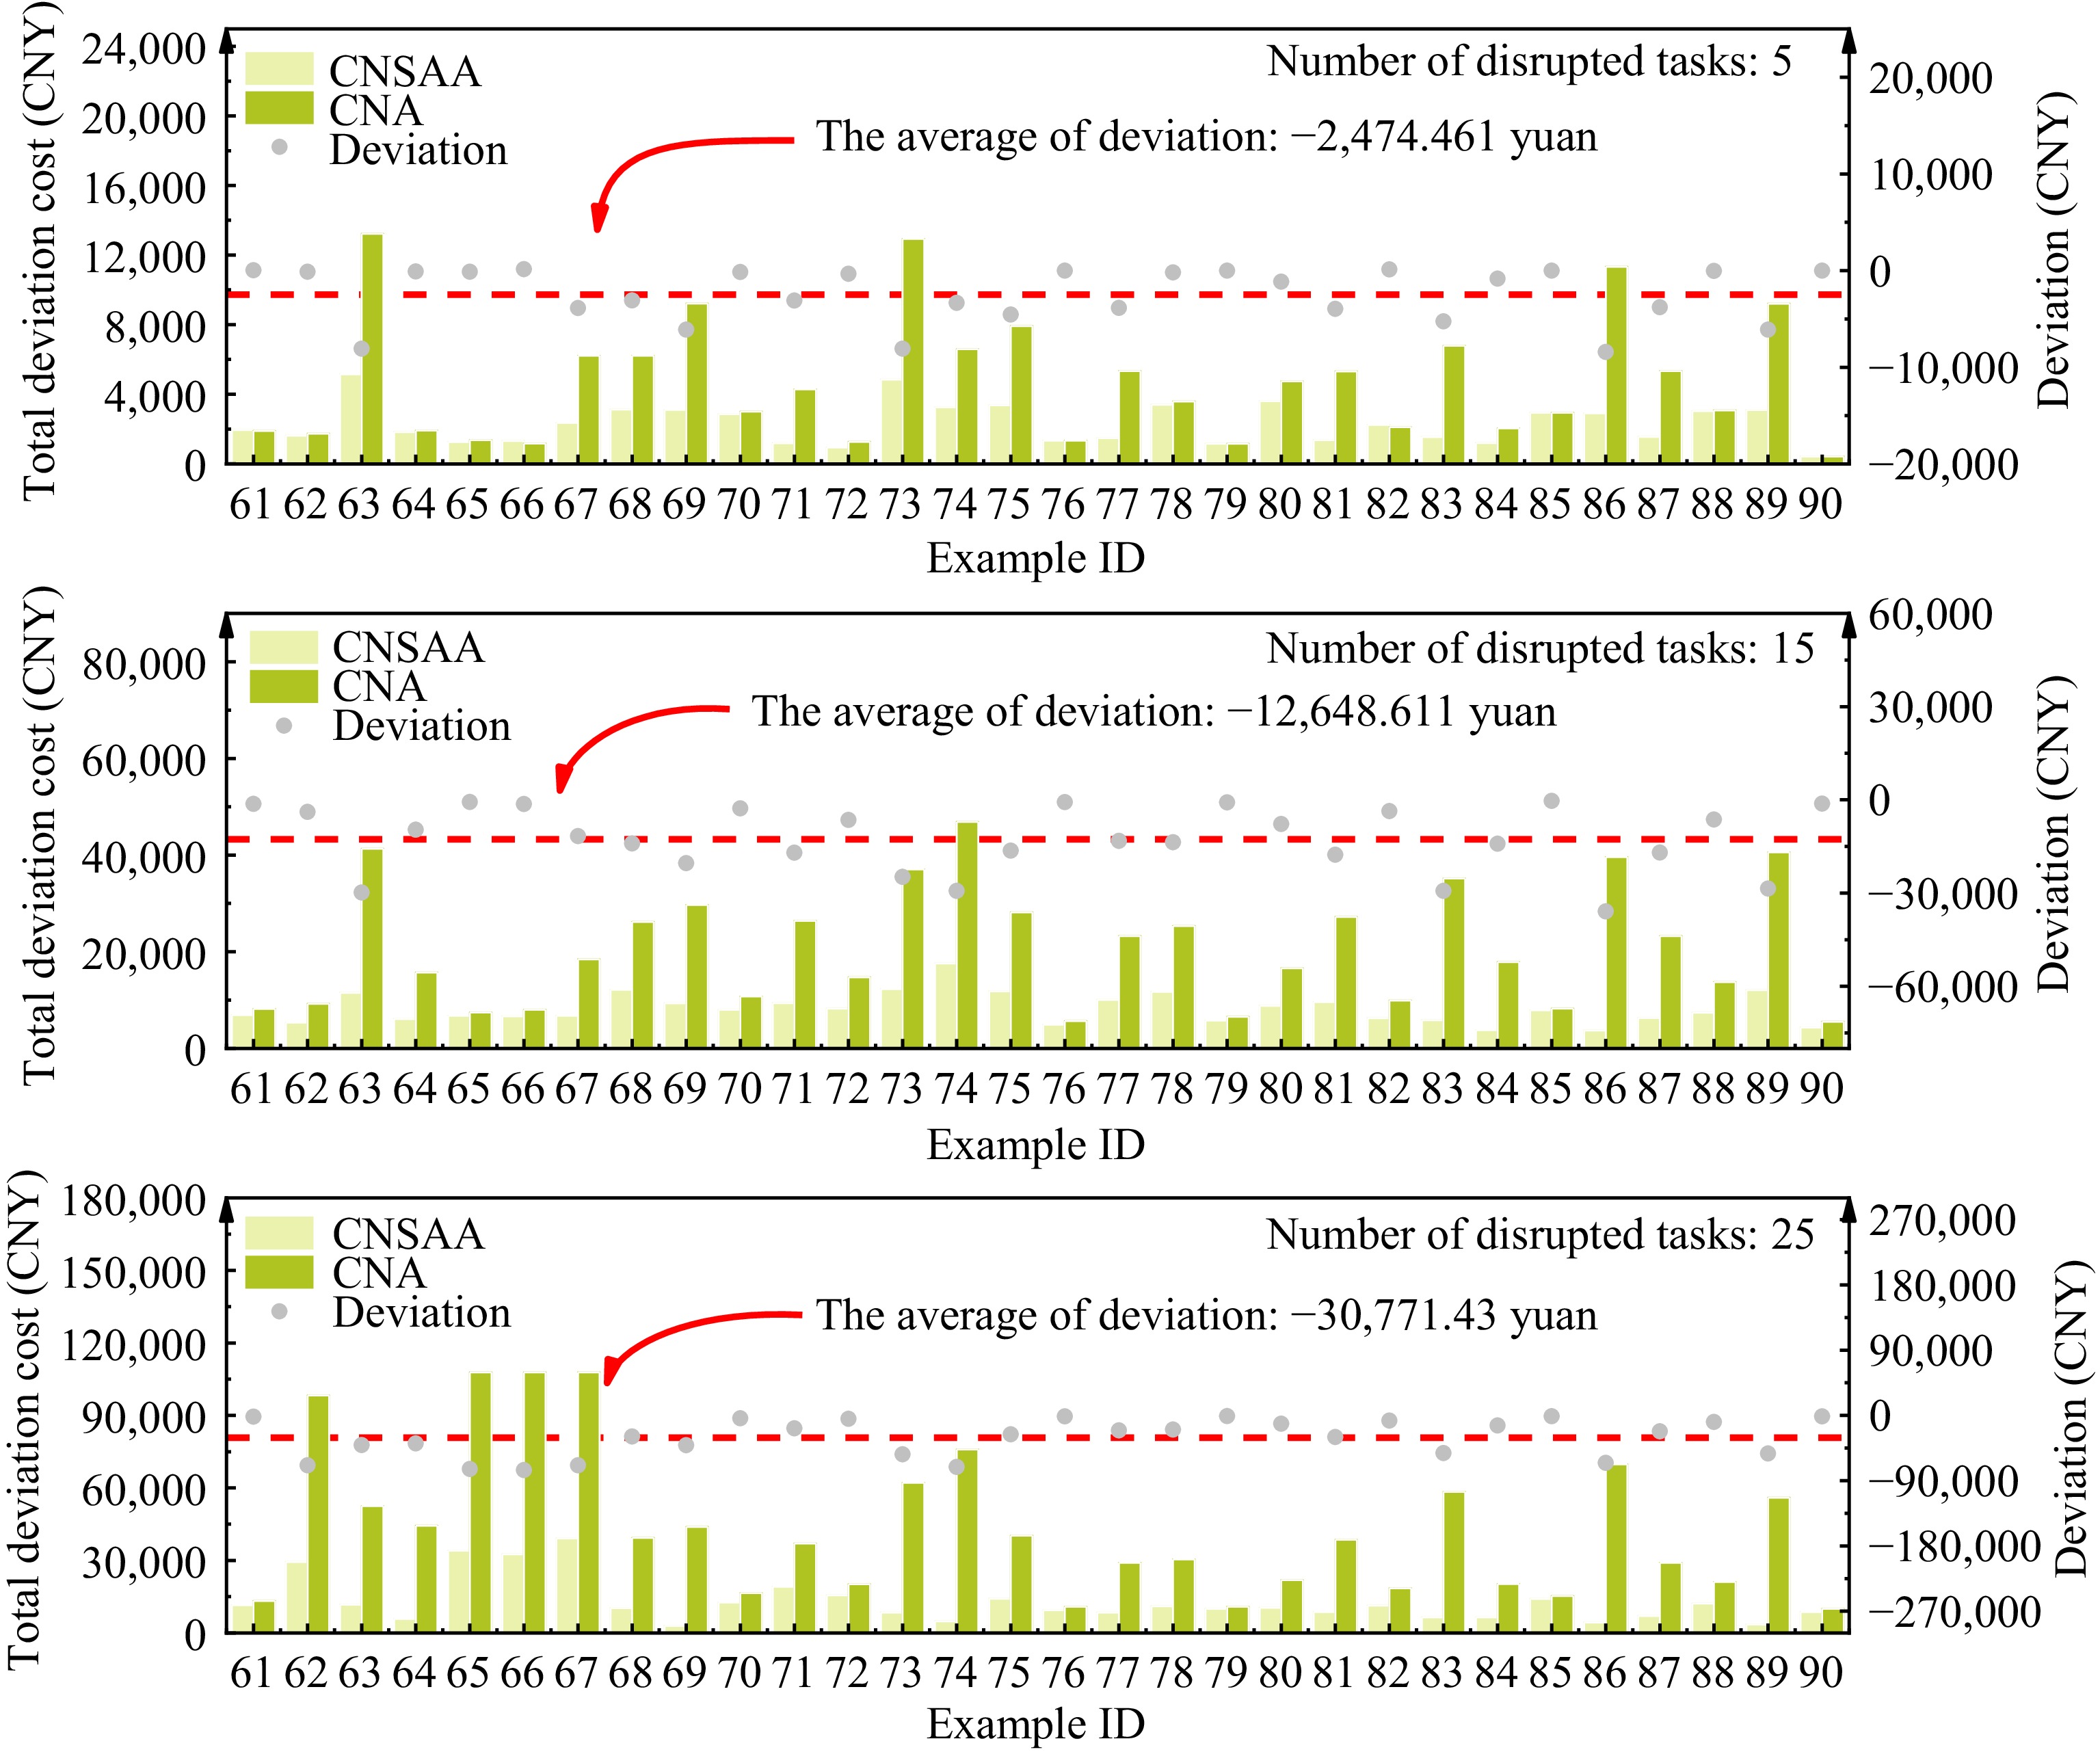
Figure 9.
The total deviation cost in the RC road network. Deviation = The total deviation cost of CNSAA − The total deviation cost of CAN
In summary, the CNSAA under the C, R, and RC road networks are all capable of searching for solutions with lower total deviation cost compared to the CNA. With the increase in the number of disruptive tasks, the degree of the decrease of the deviations can be achieved by the CNSAA.
Next, we will analyze the deviations from the tractor’s paths, transportation time and number of used vehicles respectively, to see if there are any rules in the system.
Deviations of the transportation time
-
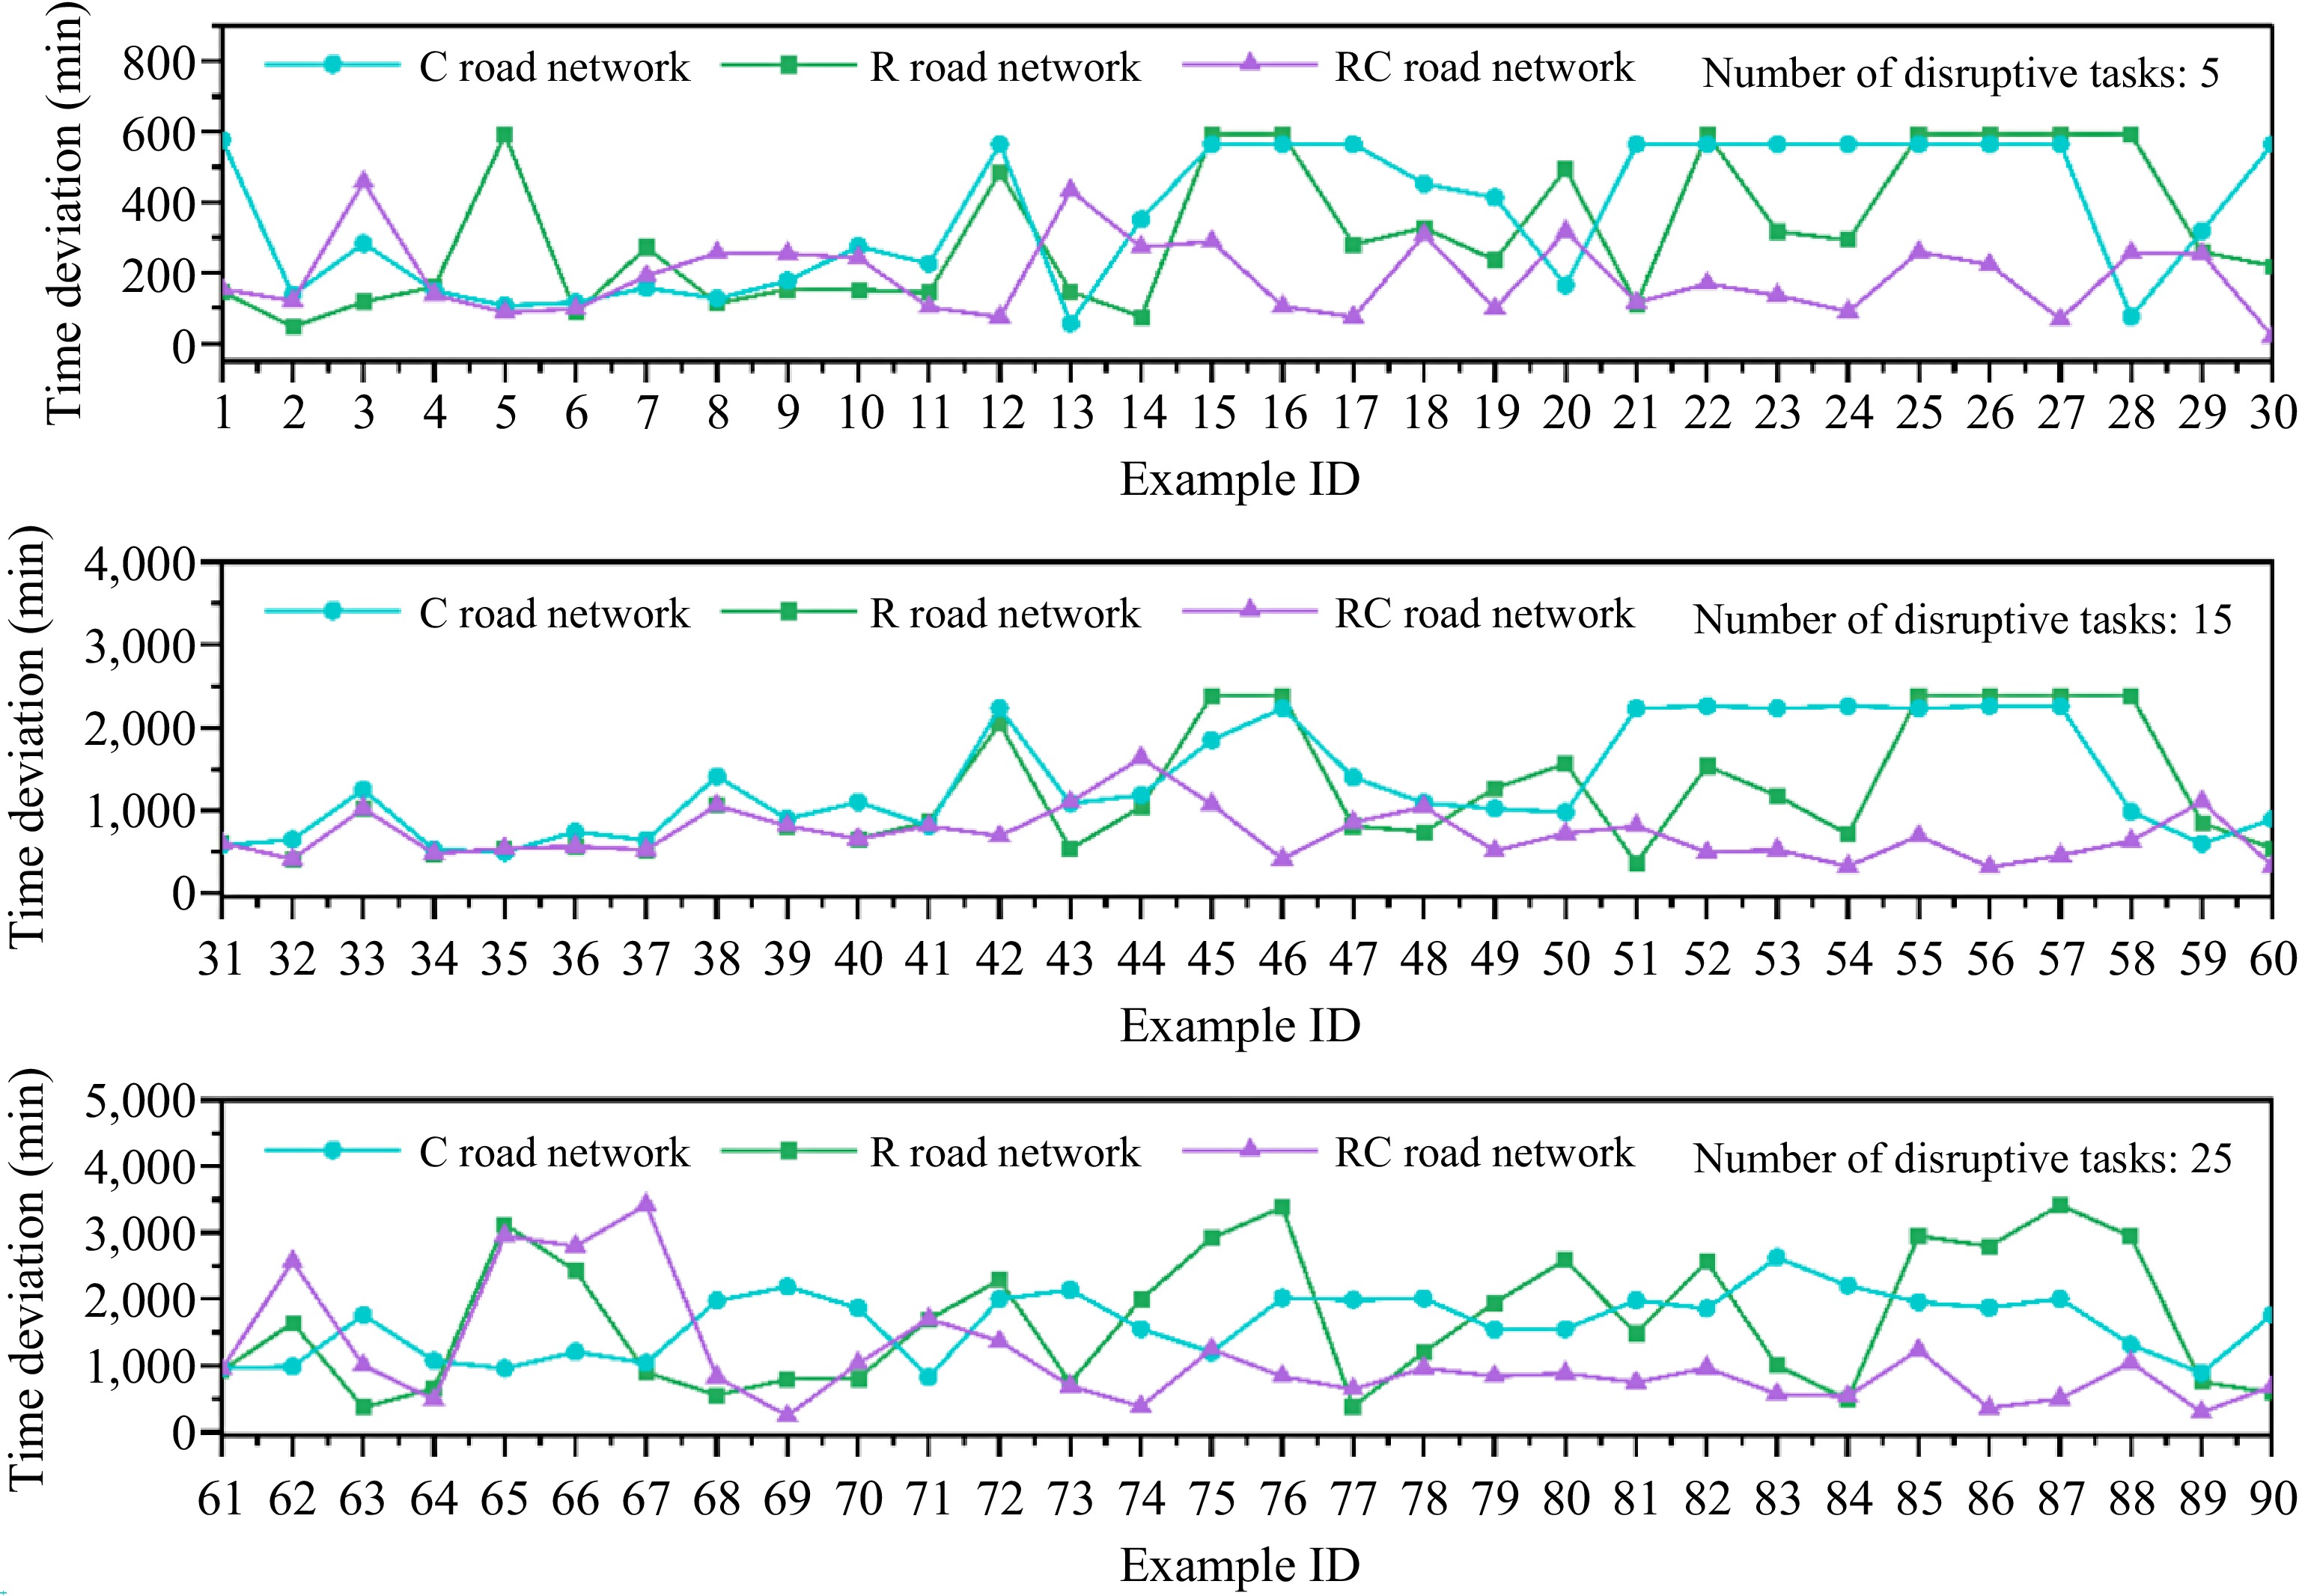
Based on the validation that the proposed CNSAA can achieve a better scheme for the tractor and trailer system, we analyze the deviations in the transportation time in the three types of road networks, as shown in Fig. 10. The figures from top to bottom shows the deviations of the transportation time with different numbers of disrupted tasks. In general, with the increase of the disrupted tasks, the time deviation under the three road networks has an increasing trend, but the increase of time deviation under each task number is also different.
From Fig. 10, it can be seen that when the number of disrupted tasks is 5, the time deviation under the RC network increases the least, and the time deviation of the C and R networks is more than that of the RC network. When the number of disrupted tasks is 15, the time deviation under RC network increases the least, and the time deviation under C network increases the most. When the number of disrupted tasks is 25, the time deviation in the three road network states increases significantly, the time deviation in the RC road network still increases the least, and the time deviation in the R road network increases the most.
In summary, with the increase in disrupted tasks, the time deviation of the three road networks increases, but no matter how many interference tasks are, the time deviation under the RC road network is always smaller than that of the other two road networks, indicating that compared with the other two types of road networks, the vehicles can search for a solution with a smaller time deviation by using the CNSAA in the RC road network.
Deviations in the number of used vehicles
-
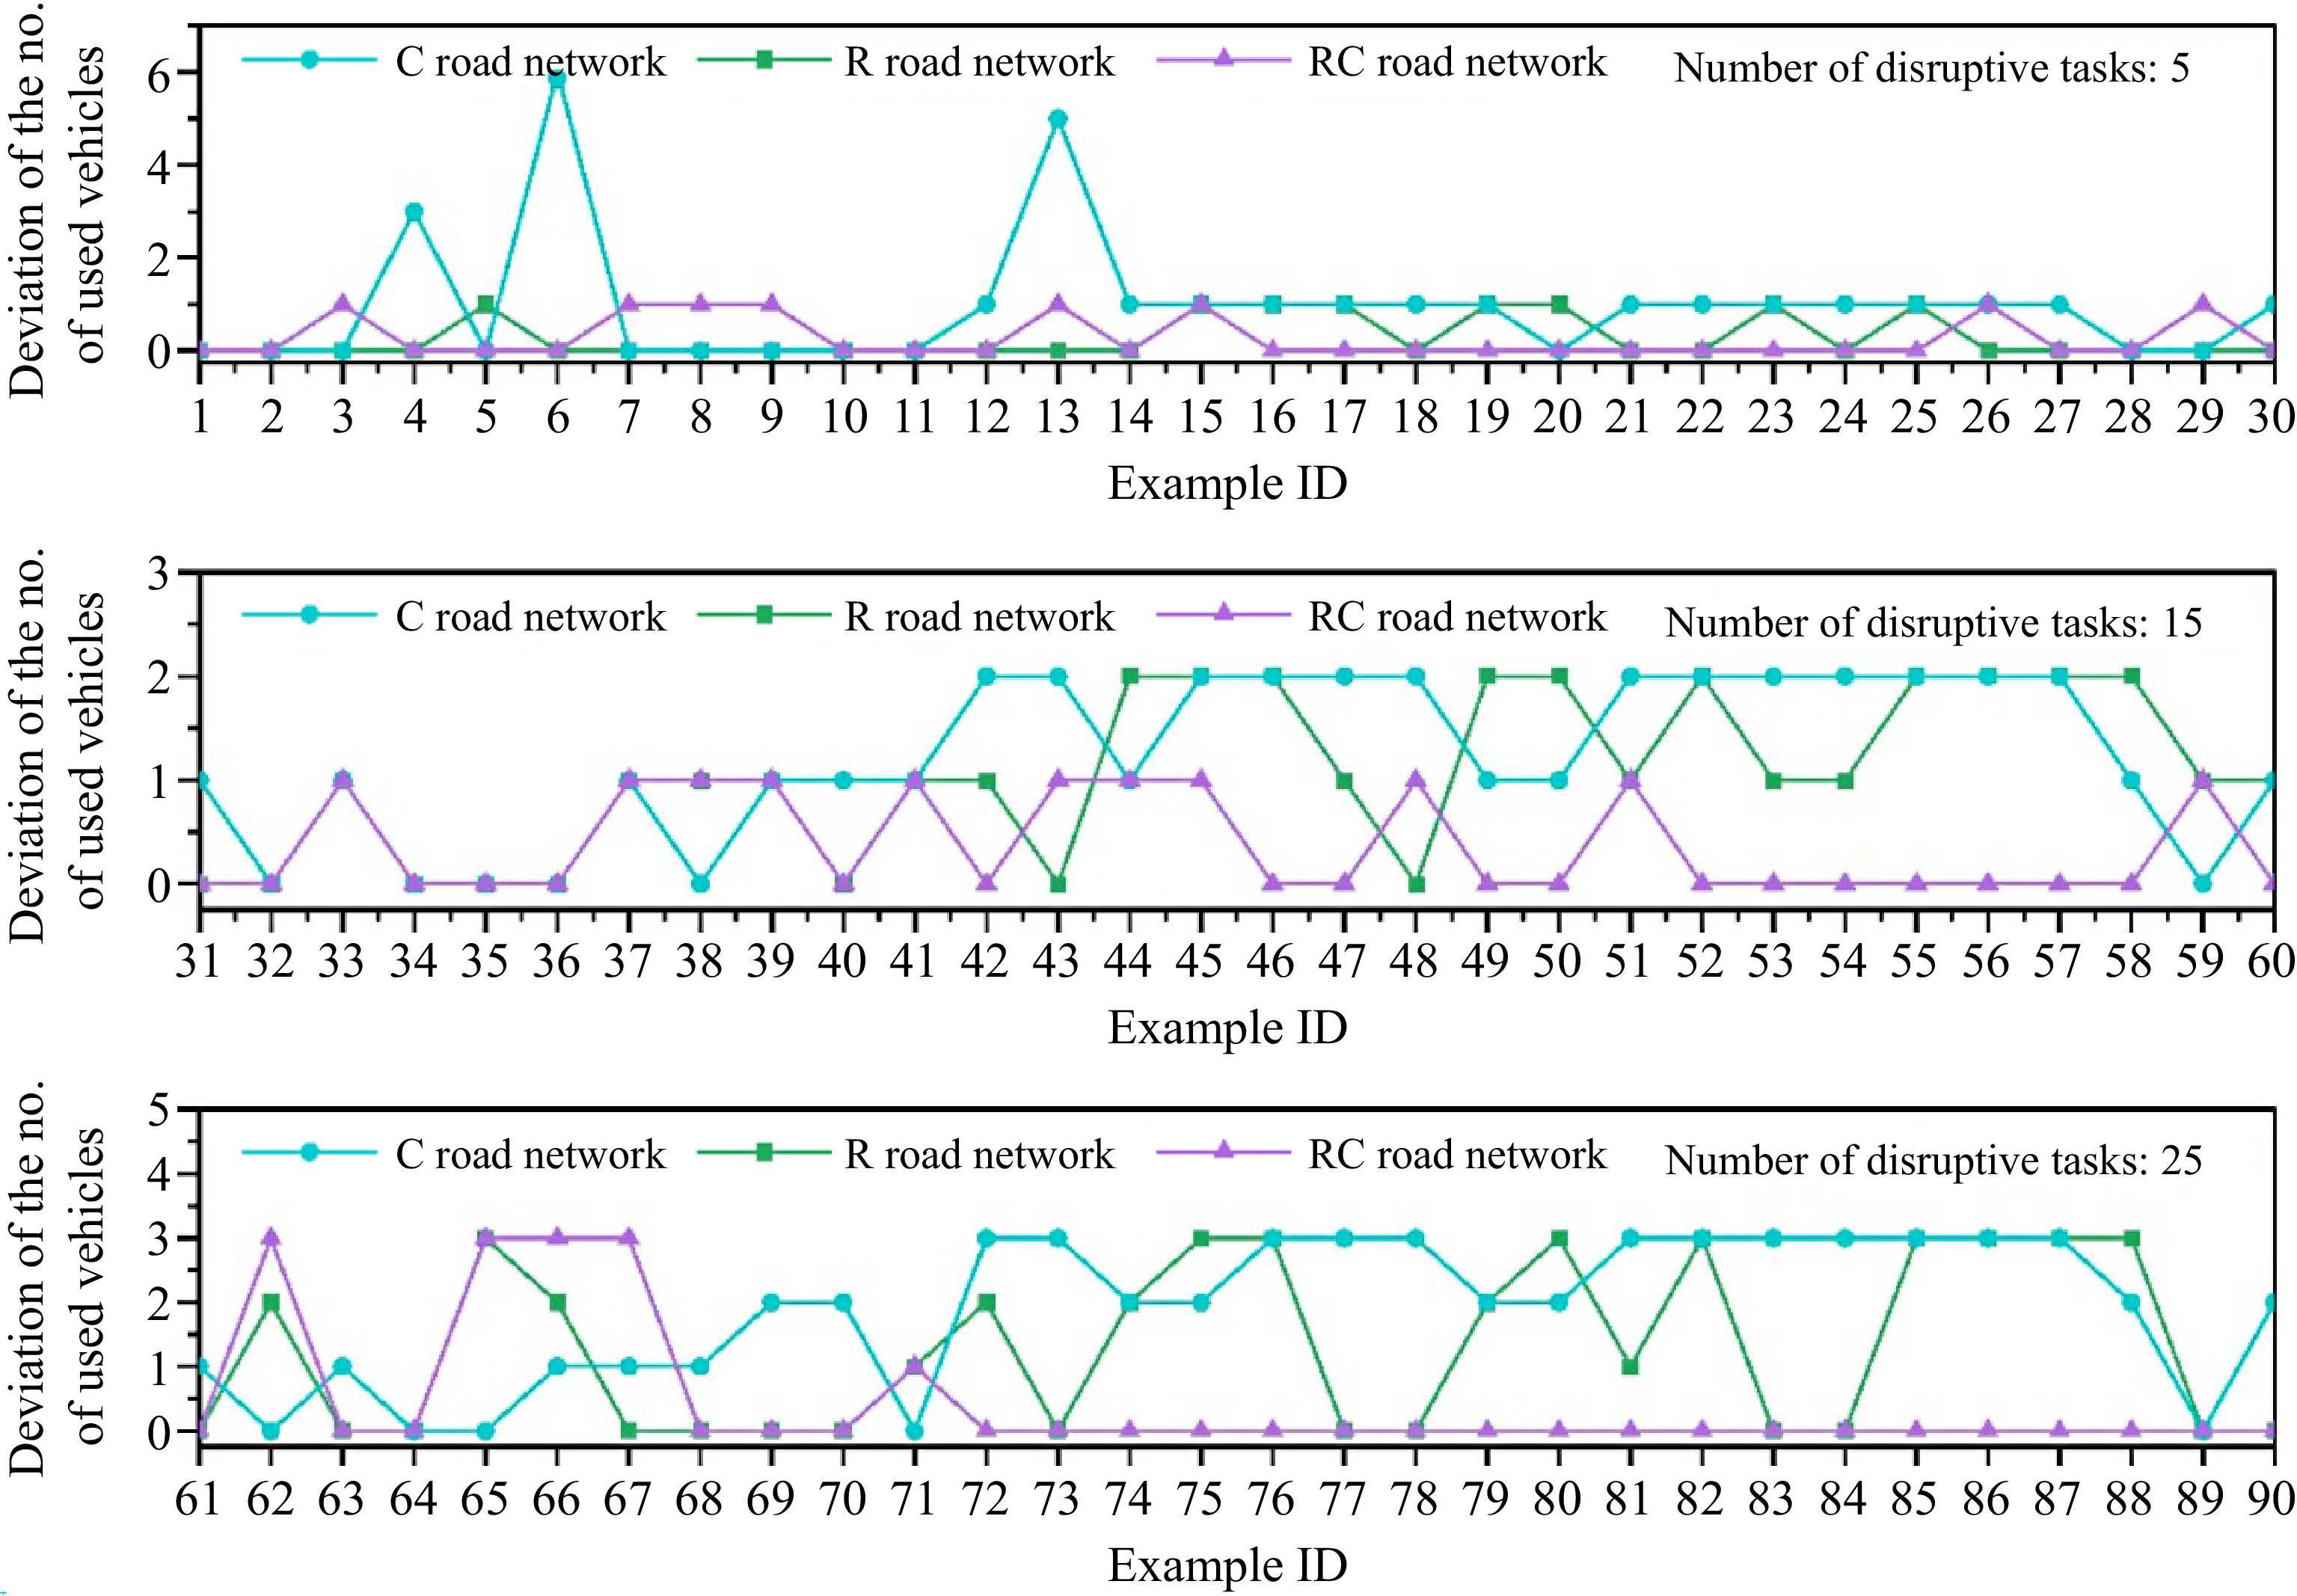
The deviations in the number of used vehicles in the three types of road networks are shown in Fig. 11. The figures from top to bottom shows the deviations in the number of used vehicles with 5, 15, and 25 disrupted tasks. We can see from the figure that as the number of disrupted tasks increases, the deviation of the number of used vehicles increases regardless of what kind of the road network is. Moreover, the deviation of the number of used vehicles under the C road network and the R road network increases greatly, and the deviation of the number of fixed vehicles in the RC road network increases slightly.
Overall, the deviation of fixed vehicles under the RC road network is always the least with 5, 15, and 25 disrupted tasks, which indicates that compared with the other two road networks, the vehicles under the RC road network can search for solutions with smaller deviations from the fixed number of vehicles by using the contract network simulation annealing algorithm.
In summary, from the deviation results of vehicle time deviation and fixed number of vehicles, it can be seen that the disruption management model is more advantageous in the RC road network than in the C road network and the R road network and the scheduling scheme with the minimum overall deviation cost will be generated by sacrificing the idle driving deviation distance in the R road network and the C road network.
Deviations of the tractor's paths
-
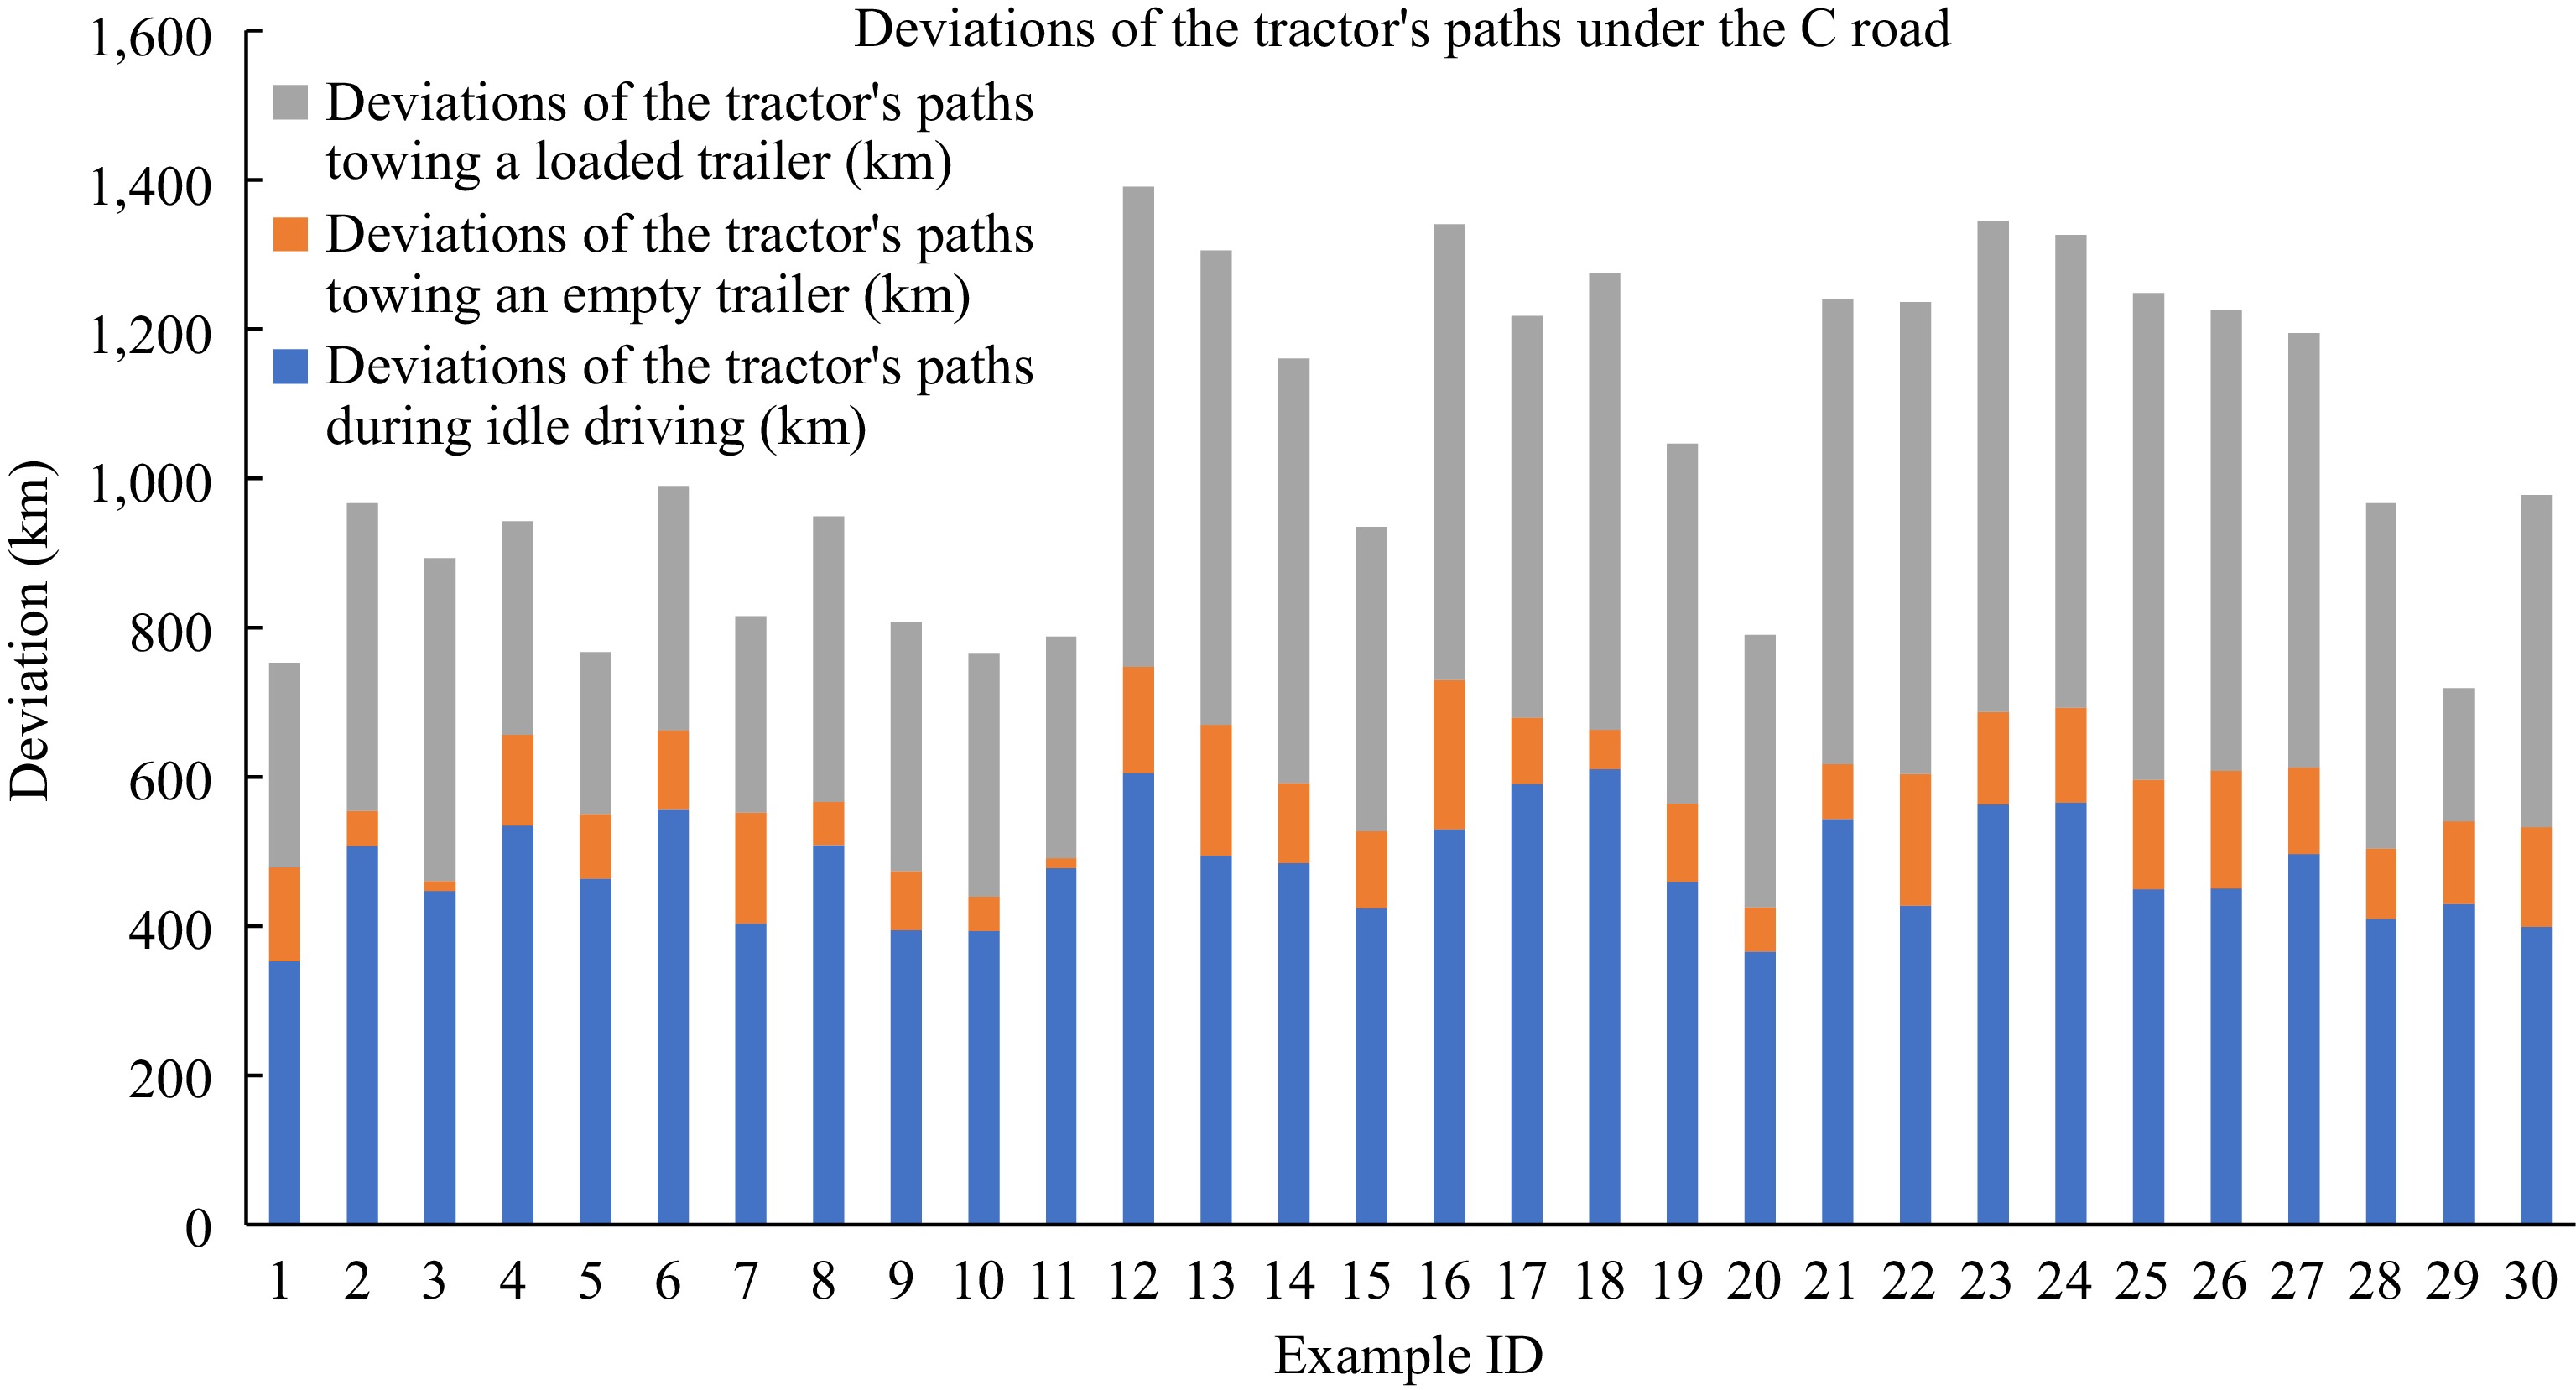
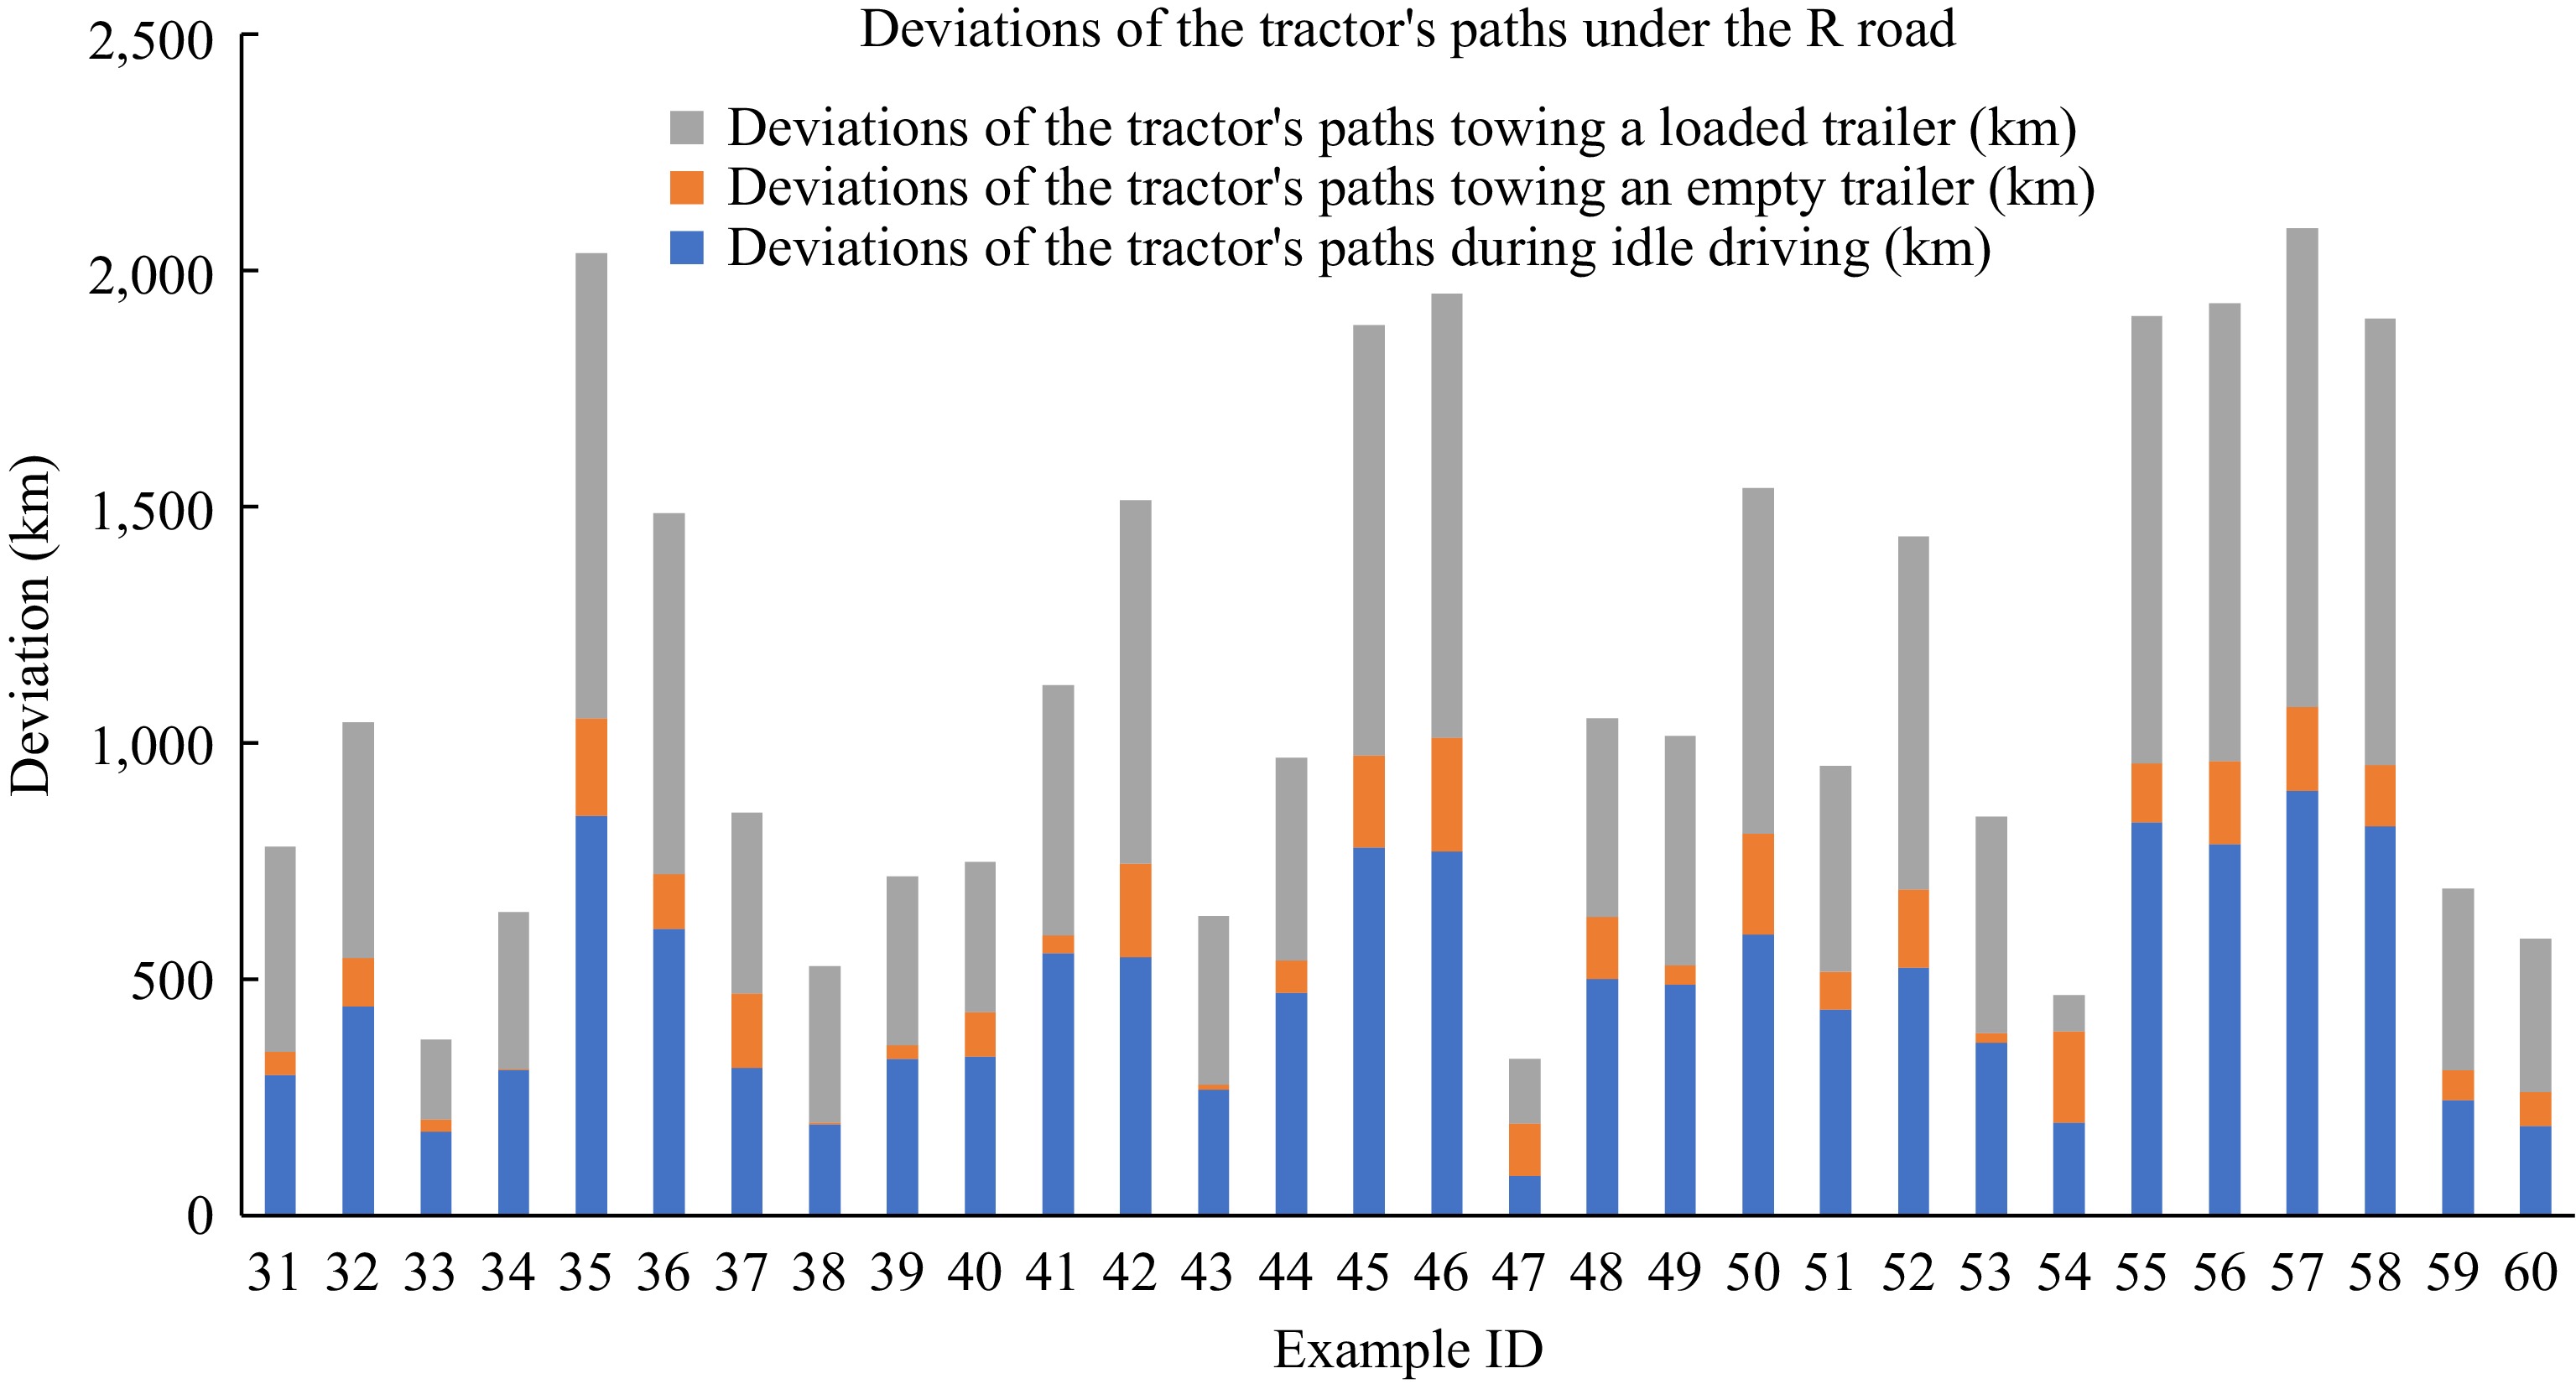
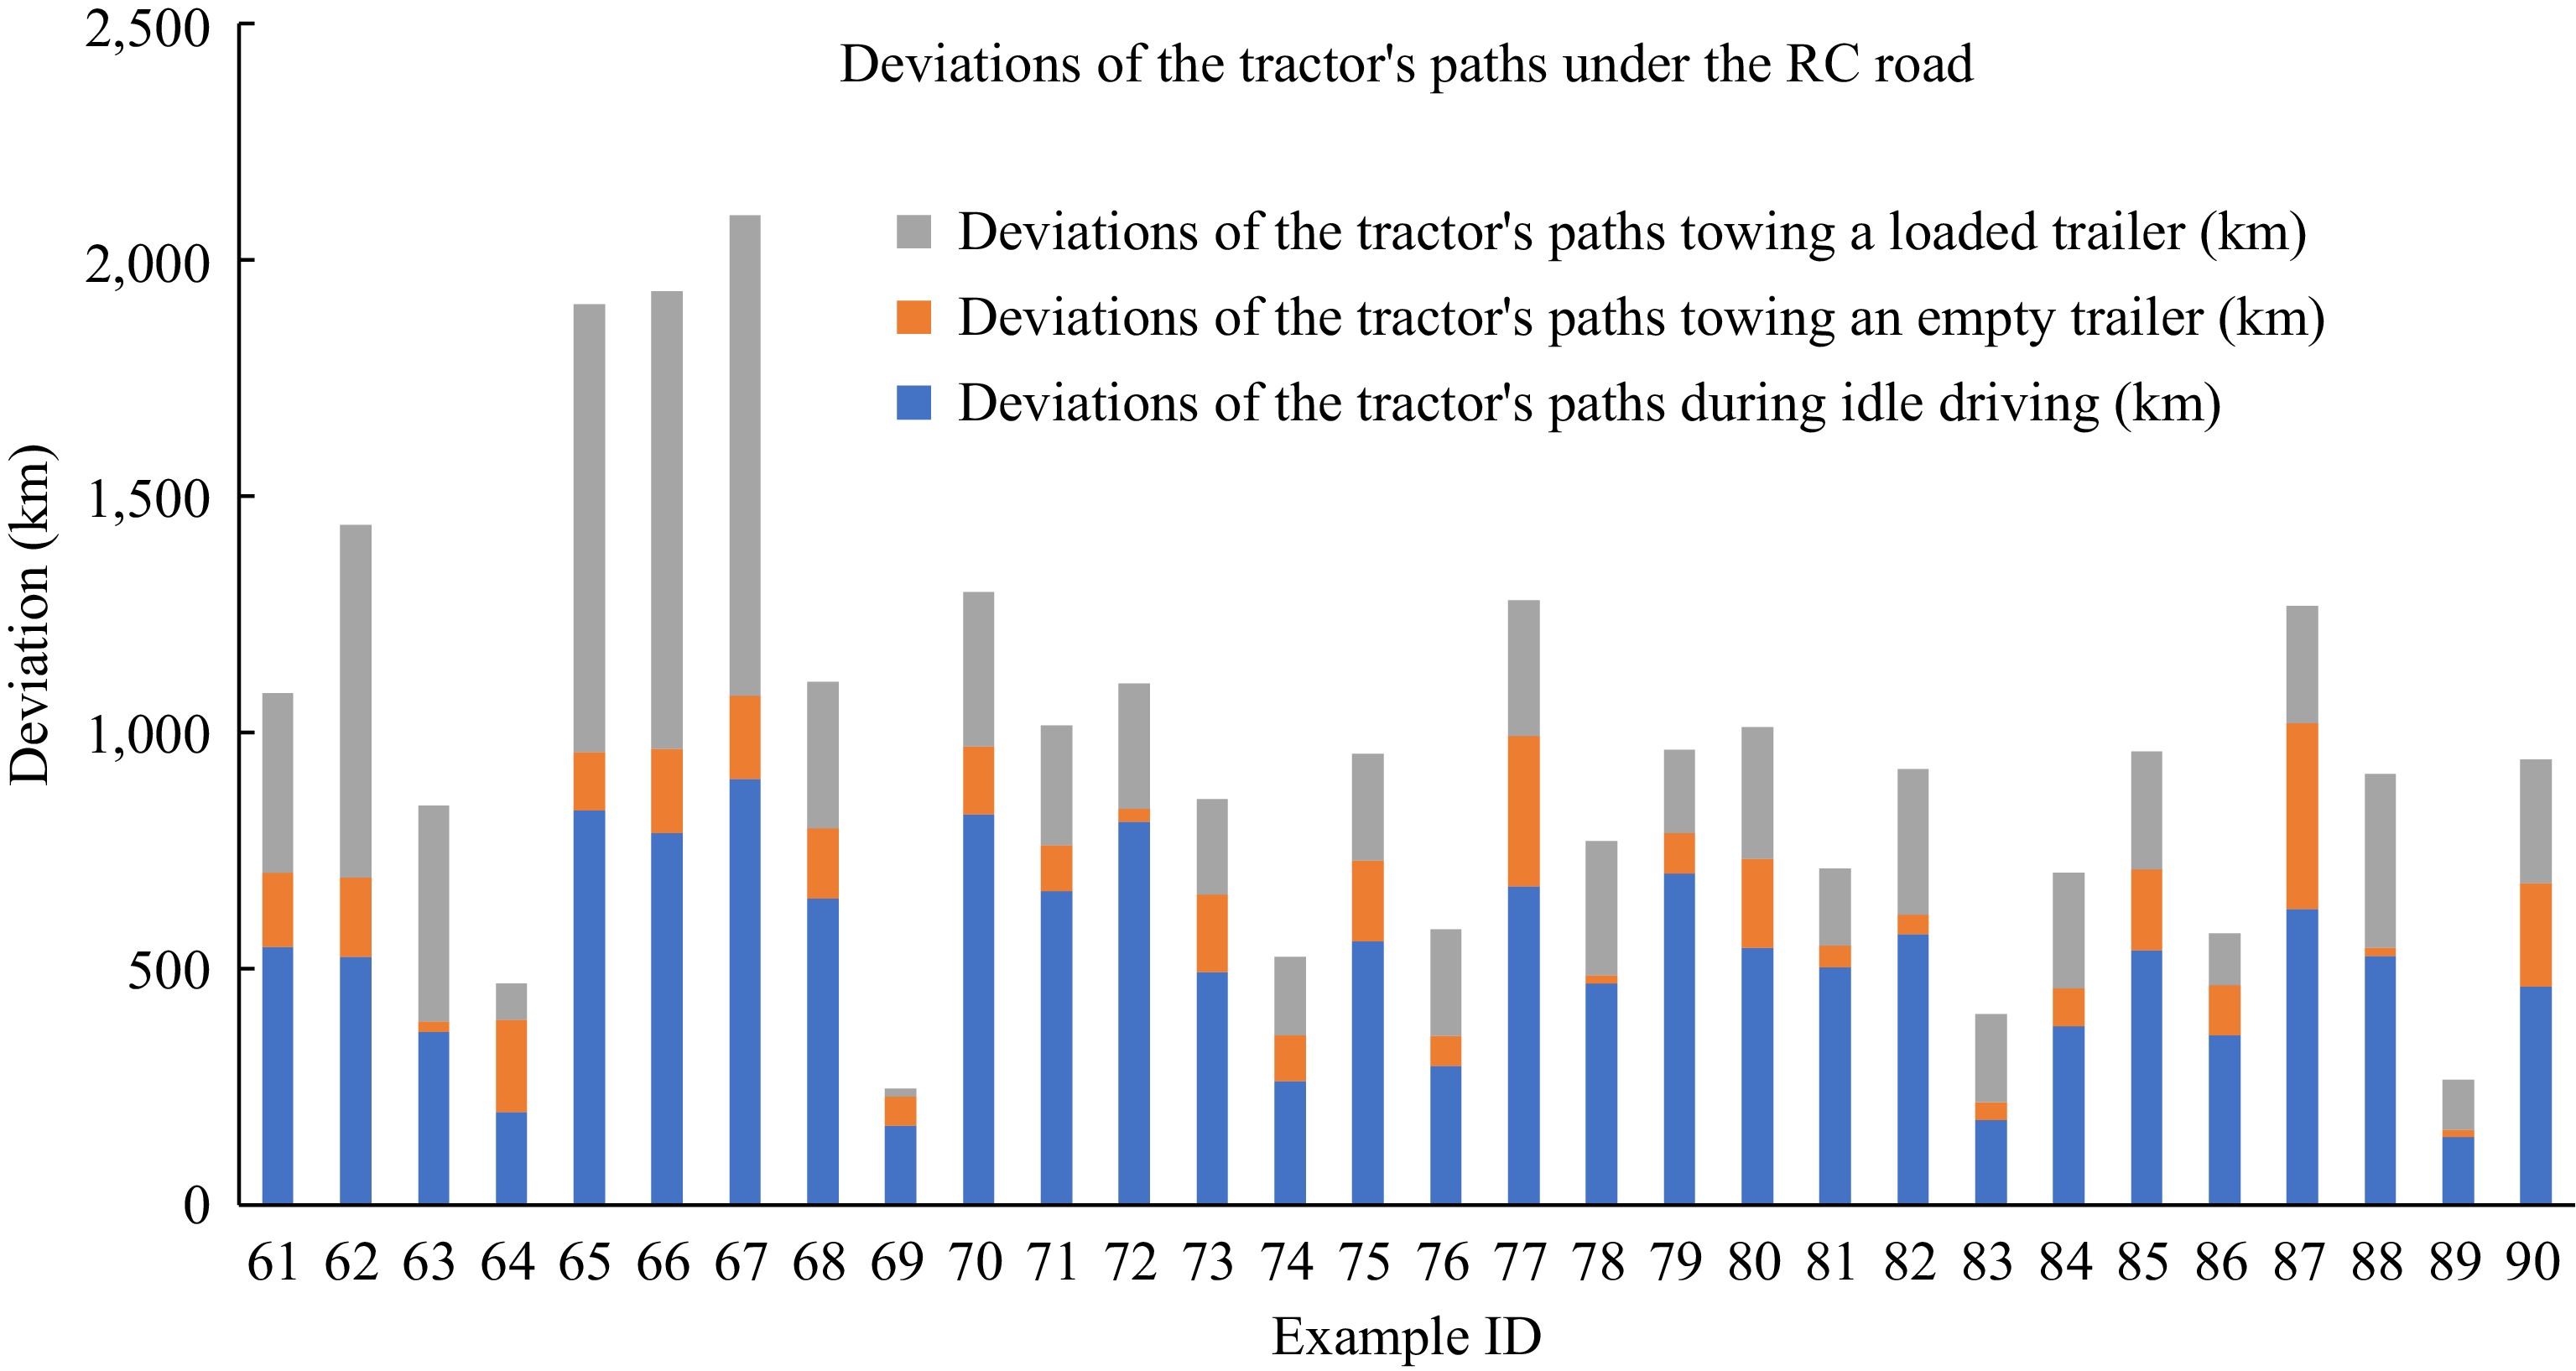
In this part, we analyze the deviations of the tractor’s paths under different kinds of road network, which is shown in Figs 12−14. Within each figure, the deviations from the path of the tractor are composed of three parts, i.e., deviations of the tractor’s paths towing a loaded trailer, towing an empty trailer, and during idle driving. The numbers of disrupted tasks are all 25 in this subsection.
It can be seen from the figures that no matter what kind the network is, the path deviation in the towing of an empty trailer of the tractor is always the least on the whole, indicating that the vehicles in the towing an empty trailer state under these three road networks can search for solutions with smaller path deviation by using the CNSAA compared with the other two states.
-
This article studies the TTRP problem in hub-and-spoke networks under uncertain environments, focusing on the generation of tractor and trailer transportation scheduling plans under the influence of emergencies, using the example of newly added transportation tasks. Disruption management methods are used to identify, measure, and analyze the disturbances caused by the newly added transportation tasks. A disruption management model is constructed, and the CNSAA (Contract Net and Simulated Annealing Algorithm) is designed to solve the problem based on its characteristics. Finally, instances are designed to validate the effectiveness of the model and two algorithms.
In the case studies of the disruption management model constructed under uncertain environments and the CNSAA designed, comparative analyses are conducted on the deviation in path distance, time, number of used vehicles, and total transportation deviation cost of optimal solutions under different numbers of newly added transportation tasks and different transportation networks. Results show that the CNSAA exhibits significant advantages in terms of path, time, vehicle count, and total cost deviation, regardless of the transportation network. The application of the disruption management model in the RC road network is particularly effective in generating scheduling plans with lower deviation costs. However, in the C and R road networks, it may be necessary to sacrifice some of the tractor's driving distance during idle travel to generate scheduling plans with lower deviation costs.
-
The authors confirm contribution to the paper as follows: study conception and design: Xu Q; data collection: Zhong Y; analysis and interpretation of results: Deng H, Chen X; draft manuscript preparation: Zhong Y, Wang X. All authors reviewed the results and approved the final version of the manuscript.
-
The datasets generated during and/or analyzed during the current study are available from the corresponding author on reasonable request.
The authors would like to express their gratitude for the support provided by the National Natural Science Foundation of China (Grant No. 52362055), the Science and Technology Plan Project of Guangxi Zhuang Autonomous Region (Grant No. 2021AC19334) and Guangxi Science and Technology Major Program (Grant No. AA23062053).
-
The authors declare that they have no conflict of interest.
- Copyright: © 2024 by the author(s). Published by Maximum Academic Press, Fayetteville, GA. This article is an open access article distributed under Creative Commons Attribution License (CC BY 4.0), visit https://creativecommons.org/licenses/by/4.0/.
-
About this article
Cite this article
Xu Q, Zhong Y, Deng H, Wang X, Chen X. 2024. Scheduling on tractor and trailer transportation considering the influence of disrupted events based on the contract net and simulated annealing algorithm. Digital Transportation and Safety 3(3): 155−168 doi: 10.48130/dts-0024-0014
Scheduling on tractor and trailer transportation considering the influence of disrupted events based on the contract net and simulated annealing algorithm
- Received: 11 June 2024
- Revised: 01 August 2024
- Accepted: 13 August 2024
- Published online: 30 September 2024
Abstract: To provide a much more resilient transport scheme for tractor and trailer transportation systems, this paper explores the generation method of tractor and trailer transport schemes considering the influence of disrupted events. Three states of tractors including towing loaded trailers, towing empty trailers, and idle driving are taken into account. Based on the disruption management theory, a scheduling model is constructed to minimize the total deviation cost including transportation time, transportation path, and number of used vehicles under the three states of tractors. A heuristics based on the contract net and simulated annealing algorithm is designed to solve the proposed model. Through comparative analysis of examples with different numbers of newly added transportation tasks and different types of road networks, the performance of the contract net algorithm in terms of deviations in idle driving paths, empty trailer paths, loaded trailer paths, time, number of used vehicles, and total deviation cost are analyzed. The results demonstrate the effectiveness of the model and algorithm, highlighting the superiority of the disruption management model and the contract net annealing algorithm. The study provides a reference for handling unexpected events in the tractor and trailer transportation industry.


