











-
The maritime industry serves as the primary backbone of international commerce, facilitating approximately 80% to 90% of global trade volume[1]. However, the continuous growth of economic globalization has led to an increase in ship size, sailing speeds, and traffic density, creating complex navigational environments and escalating the risks of maritime accidents[2,3]. Despite significant international efforts, including the adoption of the International Safety Management (ISM) code and the International Convention for the Safety of Life at Sea (SOLAS), the frequency of reported accidents and casualties remains at a high level[4,5]. Disastrous events such as the grounding of the 'Ever Given' in the Suez Canal in 2021, which caused daily trade losses of approximately GBP£7 billion, underscore the catastrophic economic, environmental, and human costs these incidents can incur[3].
Maritime accidents are complex phenomena influenced by a confluence of risk factors, including vessel characteristics, adverse meteorological conditions, human behaviors, and management capabilities[6,7]. Literature consistently identifies human error as a primary cause, often accounting for 75% to 96% of maritime incidents[8,9]. Furthermore, environmental factors such as strong winds, limited visibility, and heavy sea states significantly exacerbate the probability of serious casualties[10,11]. Because these variables often exhibit intricate, non-linear, and high-dimensional relationships, conventional statistical methods frequently struggle to provide accurate or holistic predictions[12,13].
In recent years, Machine Learning (ML) has emerged as an indispensable tool for enhancing maritime safety due to its robust pattern recognition capabilities and ability to manage complex, multi-dimensional datasets[12,14]. While traditional research focused heavily on accident frequency and the identification of individual risk factors, there is a growing need to transition toward predicting accident severity[5,13]. Accurately classifying the severity of an incident, whether non-serious, serious, or very serious, is critical for informed safety decisions, optimized emergency resource allocation, and targeted prevention strategies[12,15].
Despite the great capability of ML in risk assessment and forecasting for maritime accidents, there are some research gaps that need to be explored. There are only limited studies that conduct comparison experiments of various ML algorithms. Most of the current studies only use a few types of algorithms to handle maritime accident forecasts. Additionally, the vast majority of existing studies are focused on the forecast of a single type of accident, such as collisions. Furthermore, the datasets of maritime accidents exhibit a severe category imbalance problem, i.e., serious accidents occur less frequently than minor accidents. As a result, classification bias is embedded in most models[12,13]. In order to enhance the model interpretability, interpretable deep learning techniques are adopted in this study. Model interpretability is critical for decision-makers to have a clear understanding of risk assessment results and to analyze the relevant factors that affect certain risk predictions[12,16].
To address the problems mentioned before, a comparative analysis approach is required. The main contribution of this study lies in the implementation of a unified comparative framework in which multiple machine learning models are evaluated under the same dataset, feature set, and experimental conditions. This enables a consistent assessment of model performance for maritime accident severity classification and provides clearer insights compared to studies focusing on single-model approaches or heterogeneous evaluation settings. Predicting the severity of maritime accidents using classification-based ML techniques is the main objective of this study. A novel dataset is utilized to evaluate and compare a number of techniques, including tree-based models, classical classifiers, and deep learning models. The best practices for severity prediction are identified, and the study integrates the state-of-the-art data balancing approaches and feature selection methods. This study will provide a scientific basis for risk-informed decision-making for stakeholders and authorities involved in maritime activities. They can use the results to prevent major maritime accidents from happening in the future. The existing literature on accident severity prediction is reviewed, followed by a detailed discussion on the methodology and data used in this study. Finally, the performances of the various classification models are compared to determine the most effective model for predicting accident severity for maritime disasters.
-
The analysis and severity classification of maritime accidents have attracted significant attention in the literature, particularly with the increasing availability of digital accident records and advances in data-driven methodologies. Researchers have employed a wide range of statistical and ML techniques to better understand the underlying risk factors, identify patterns, and improve predictive capabilities in maritime safety management. A critical aspect influencing the robustness and generalizability of these studies is the size and structure of the datasets utilized. In this context, the literature presents considerable variation in dataset scale, scope, and composition, reflecting differences in research objectives, geographical focus, and data accessibility. Accordingly, existing studies can be broadly categorized based on the volume and characteristics of the datasets they employ, ranging from small, case-specific samples to large-scale, multi-source historical databases.
Studies on the analysis and severity classification of maritime accidents vary in terms of the volume of datasets used, depending on regional focus or global databases. In the literature, narrow-scope studies focusing on specific waterways or particular accident types have used limited sample sizes, such as the study by Wang & Yang[17] with 350 records, Yang et al.[2] with 549 accident reports, Fan et al.[6] with 502 incidents, and Zhou et al.[3] with 402 global accident records. Studies examining more specific scenarios have analyzed 240 ship collision reports[18], between 300 and 617 accident cases[8], and 853 accident reports[19]. On the other hand, datasets compiled from multi-center international agencies have sample sizes in the thousands; for example, studies by Cao et al.[12,20] based on 1,294 reports from seven different agencies, Sevgili et al.[21] on 2,080 tanker accidents, and Wang et al.[7] on 1,128 accident reviews. The largest volume datasets in the literature generally include long-term historical records; Munim et al.[22] analyzed 9,025 accidents covering 40 years, Brandt et al.[10] analyzed 9,226 accidents integrated with weather variables, and Merrick et al.[23] analyzed approximately 13,000 accident logs. These data reveal that the sample size in the maritime safety literature varies between 240 and 13,000 accidents, from local/specific studies to large-scale historical analyses, and that datasets are mostly imbalanced in nature. Therefore, this study utilizes a relatively small but carefully curated dataset of 223 accident records (2015–2020), prioritizing data quality and contextual consistency over sample size.
In addition, it should be noted that data scarcity is an inherent limitation in maritime accident research due to restricted accessibility, confidentiality concerns, and fragmented reporting systems. Therefore, many studies in the literature rely on relatively small datasets while still achieving robust and reliable results. From a methodological perspective, several machine learning algorithms, particularly ensemble-based models and support vector machines, are known to perform effectively on small to medium-sized datasets when the data quality is high and properly curated. In this regard, the dataset used in this study is consistent with the domain-specific constraints and aligned with common practices in the existing literature.
Accident research is highly relevant for the maritime industry. Two decades differ significantly with respect to the methods and techniques applied to maritime accident analysis. The first decade focused primarily on traditional statistical methods in order to analyze maritime accidents and develop empirical models to explain the phenomenon of accidents at sea. In the last decade, however, data-driven methods and techniques have increasingly gained more importance for maritime accident analysis. Most of the existing studies utilize traditional regression analysis, including logistic regression. They also incorporate other models like grey system models and time series analysis (like ARIMA, SARIMA, and EEMD-SCT). However, as the structure of maritime accident data is complex, non-linear, and high-dimensional, the traditional methods are no longer sufficient for effective maritime accident analysis. ML methods are increasingly being used as they enable us to achieve higher accuracy and improved ability to handle multi-factorial causality than traditional econometric models. Therefore, the focus has shifted from simply predicting the occurrence of accidents to classifying the severity of accidents, which can assist in formulating effective strategies for emergency response as well as risk-informed decision-making.
Compared with traditional risk assessment, this paper focuses on identifying and ranking the Risk Influential Factors (RIFs) that affect the gravity of the accidents. By reviewing the existing research, this paper sums up the RIFs from different aspects, including human factors, vessels' characteristics, environmental factors, and management factors[6,7]. The results indicate that human error is the most important RIF in maritime accidents, accounting for 75% to 96% of maritime accidents[8,9]. Particularly, human operational errors and rule violations are the most frequently mentioned[8]. In addition to human error, the gross tonnage, total length, and main engine power of the ships are important factors for predicting the severity of the accidents[24,25]. The complication of ship operations and management increases with increasing ship size[26]. Recent updates to the database have incorporated higher-resolution weather data to consider the effect of environmental stressors on the risk of serious casualties; wind force, visibility, and sea level pressure have been found to be particular predictors of risk.
In the literature, different approaches have been explored to construct predictive models. Bayesian Networks (BN) have been used to develop predictive models to handle conditional dependencies and uncertainty, especially when there is a limited amount of data[6,27]. However, experiments in the literature have shown that tree-based ensemble methods generally perform better in terms of predictive accuracy. In this paper, the authors have explored the usage of BN and other types of models. However, they found that tree-based ensemble methods performed better in terms of predictive accuracy. For building a predictive model to assess the severity of storms from weather data, in terms of efficiency and generalization ability to handle a large number of features, they used Light Gradient Boosting Machine (LightGBM) as a reference model, and for classification tasks, they used the CatBoost model that enhanced performance by balancing data specific to the domain of data, especially when the data has a large number of categorical features[12]. Most of the comparative studies on stock market prediction were concentrated on time series approaches. Recently, Automated Machine Learning (AutoML) techniques have emerged, which allowed researchers to evaluate more than 100 models to select the most suitable model for a particular region or even for global analysis[10,22].
Although the accuracy rate of forecasting maritime collision risk models is high, there are two technical issues that need to be studied further. On the one hand, most models encounter severe category imbalance problems. On the other hand, there is a 'black box' problem for many ML models. First, the data of maritime collision risk severity has a severe class imbalance problem in reality. There are many minor events, but few serious or even catastrophic events in the historical data. Many oversampling methods have been used to handle imbalanced data to improve the ability to detect critical events. Second, to address the problems of the 'black box', many studies have explored the application of Explainable Artificial Intelligence (XAI) methods to improve the transparency and model interpretability of the risk severity prediction models. In terms of the global and local feature importance and interpretability, the SHAP values and the plots generated by SHAP and various techniques can clearly illustrate the contributions of factors such as 'ship age' and 'the location of the ship', and so on, in risk severity prediction. Meanwhile, the local interpretations provided by LIME and the corresponding interaction heatmaps can describe the contribution of specific features and their interactions with other features[16].
While there have been many scientific applications of ML methods in identifying and assessing maritime risks, there is a need for more comparative and in-depth studies by using multi-source data and multiple models, considering more features, and enhancing model interpretability. The most scientifically reasonable way to prevent the occurrence of catastrophic maritime accidents is optimal data balancing and feature selection methods followed by gradient-boosting models. In this paper, comparative experiments are conducted based on a variety of global maritime incident data, and this paper aims to help maritime safety authorities transition from a traditional, reactive mindset to a more proactive approach to risk management, using data and analysis to make intelligent, informed decisions. Consequently, a summary of the literature on maritime accident prediction and analysis is presented in Table 1.
Table 1. Review of maritime accident studies.
Ref. Method Data Performance metrics Variables used Results [2] Stacking combined model, GBDT, Random Forest (RF), SVM, LSTM, CNN 549 accident reports (Fujian Sea area) Accuracy (0.912), precision (0.910), recall (0.912), F1 (0.904) Characteristic variables (x) Stacking model provided superior accuracy over traditional ML. [6] Data-driven BN, Fisher optimization, PMM, KNN, CatBoost 10-year maritime data (2014–2024) Accuracy (95.37%), CatBoost/RF/KNN > 85% Ship type, gross tonnage, length, power, wind, weather, speed BN model demonstrates high accuracy in severity predictions under imperfect data. [28] RF, XGBoost, LightGBM, NN, SVM, SMOTE 617 incidents (fishing vessels) RF AUC (0.93), Accuracy (0.8455) Tonnage, speed ratio, Delta-V, collision angle, relative speed SMOTE effectively balanced data; RF model was superior to other tested models. [3] Data-driven BN (TAN) 402 global accident records (2017–2021) Accuracy (92.86% for
2-year model), recall,
F-measure24 RIFs (ship type, age, location, weather, etc.) Data-driven TAN model uncovers more intricate relationships than expert-driven models. [22] AutoML (29 algorithms), LightGBM, XGBoost, RF 9,025 Norwegian accidents (1981–2020) Best accuracy (0.647), AUC (0.81) Vessel type, length, tonnage, navigation waters Light Gradient Boosted Trees Classifier was the best performing model. [12] LR, DT, RF, ET, NN, LightGBM, XGBoost, CatBoost, SMOTE, XAI 1,294 reports from seven global agencies Accuracy (0.7954 for LightGBM/ET), AUC (0.8469) Human factors, vessel characteristics, environment, management Feature selection and data balancing significantly enhance prediction accuracy. [21] BN (K2 and EM algorithms), ANN 2,080 tanker accident reports (USCG) Accuracy (75.96%), AUC (0.722) Accident type, vessel age, size, waterway type Vessel age and size are critical factors in predicting oil spill occurrence. [29] Decision Tree (CART), Tree Augmented Naive Bayes (TAN) 1,468 oil spill instances (USCG) Accuracy (0.669), AUC (0.704) Vessel type, accident type, waterway, severity TAN outperforms standard Naive Bayes; vessel type is a major spill predictor. [10] AutoML, LightGBM, RF, XGBoost 9,226 accidents + 57 weather variables Accuracy (0.7143 combined), AUC (Log Loss 0.816) Wind speed, visibility, temperature, moon phase Integrating high-resolution weather data improves accident risk prediction by ~6%. [5] RF, NB, SVM, XGBoost,
Adaboost, LightGBM,
FS (PGI-SDMI)MARIFD (1,294 reports) Accuracy (0.8555), AUC (0.9226) 68 RIFs (human, ship, env, management) The two-stage feature selection method achieves highest stability and precision. [15] ARIMAX, ARIMA Historical time series of accidents RMSE, MAE, MAPE, R2 Collision, machinery damage, weather conditions ARIMAX (multivariate) provides more accurate trends than simple ARIMA. [30] GBDT, LightGBM, XGBoost, ARFuse (ARM) Marine accidents risk influential factors database UAR (unweighted average recall) Management, regulation, human error, ship type ARFuse method optimizes the identification of hidden feature contributions to severity. [31] Systematic Literature Review (Survey) Review of 100+ publications Identification of research gaps (black box models) Vessel management, MetOcean, incident history Shift from naval mechanical analysis to human-environmental multi-factorial risk. [7] Ordered Logistic Regression 1,128 accident reports Significance (p < 0.05) Ship type, size, age, location, weather Ship age and crew experience are statistically significant severity predictors. [20] Data-driven TAN-BN 1,294 reports (AIF database) Mutual information values 35 third-level AIFs (human, ship, env) Human violation and ship age are top-ranked determinants of severity. [17] Augmented BN, Naive BN 350 waterborne records MDL score, ROC curve 20 risk variables (tonnage, speed, visibility) Augmented BN provides better structural fit and predictive power than standard Naive BN. [32] Grey-Markov prediction model Historical frequency data Prediction accuracy rates Minor, general, and major accidents Combinatorial models outperform single models in frequency forecasting. [33] SVM (Linear/Gaussian), Naive Bayes, Text Mining MAIB investigation reports (text) F-measure (SVM-Gaussian: 74%) Connective words, causal transitions NLP algorithms can effectively extract causal relations from textual reports. [34] kNN, XGBoost, Random Search optimization NISA/Korea Coast Guard data Precision, recall, F1 score Time, location, voyage data kNN-based data retrieval outperforms k-d tree and Ball tree methods. [35] Dynamic BN 460 emergency text cases Marginal probabilities X1–X13 (operational, environmental) Dynamic BN captures temporal risk evolution across different time slices. [19] CART, RF, Bayesian Optimization (BO) Text-mined accident reports Precision (0.8564), specificity, F1-score Ship type, age, accident type BO-RF model achieves highest precision for consequence scenario prediction. [8] ANOVA, Clustering, NN 300–617 Spanish SAR incidents Error histogram, predictor importance Ship type, crew, length, year Crew number and vessel length are the primary determinants of accident type. [23] LR, DT, RF, NN, GBT, Stochastic GBT 13,000 traffic records (New Orleans) Accuracy (SGBT: 0.983), sensitivity Traffic, environment, waterway SGBT models provide a highly reliable warning mechanism for maritime authorities. [36] GBDT, XGBoost, LightGBM, KMeans-SMOTE Marine accidents reports UAR (unweighted average recall) Tonnage, speed, weather features KMeans-SMOTE combined with GBDT shows optimal UAR scores for imbalanced data. -
This study aims to predict the severity of maritime accidents by using classification-based ML algorithms. The secondary aim of this study is to compare the performances of ML algorithms and to identify the most crucial variables that affect the severity of maritime accidents. Accordingly, this research utilizes three classification-based ML algorithms: ET (Boosted and Bagged Trees), SVM (Linear, Quadratic, Cubic, and Gaussian variants), and NN (Narrow, Medium, Wide, Bilayered, and Trilayered architectures). Classification-based ML algorithms are supervised learning methods that aim to assign data to predetermined categories or classes. These algorithms learn patterns and relationships from training data, enabling them to accurately predict and classify previously unrecognised data according to their respective categories. MATLAB R2025a was used for the classification-based ML modeling study. MATLAB is a platform that provides a high-level programming environment used for numerical calculations, data analysis, and model development. It is widely preferred in academic and scientific research and various computational applications for data processing, modeling, simulation, and the development of ML algorithms.
This study proposes a comprehensive comparative framework for classifying maritime accident severity using an open-access dataset containing 223 accidents recorded between 2015 and 2020, incorporating 18 risk-influential variables related to vessel characteristics and environmental conditions. Severity was used as the predictive variable in this study. Severity is modeled as a binary classification task (0: non-serious; 1: serious), aligning with standard safety reporting focused on casualties and ecological damage[5,13]. Model performance is exactly compared using metrics such as accuracy, precision, recall, and F1-score to identify the most robust predictor[22]. This comparative approach addresses the limitations of traditional statistical methods in handling non-linear, high-dimensional maritime data[7,18].
Data preprocessing
-
The dataset used for the analysis in this study was obtained from open-access sources. The accidents are 223 maritime accidents for the years 2015−2020. There are 18 different variables. In this study, some sub-processes were carried out within the scope of data pre-processing. These include removing outliers and duplicates, filling in missing data, regularizing, normalizing, and standardizing data, as well as removing columns with missing values and those that are out of scope. Finding missing data, eliminating outliers, and cleaning the dataset generally increase model accuracy and reliability.
Cleaning and standardizing categorical variables is a broad definition of data regularization. One-hot encoding and label encoding were the two methods used to finish the data regularization stage. The rescaling and standardization of numerical variables is a broad definition of data editing. Before normalization and standardization, the data had to be arranged. Categorical variables were labeled and transformed into numerical classifications.
Normalization scales data into the range between 0 and 1, while standardization scales data by making the mean of the data 0 and the standard deviation 1[37]. Normalization and standardization are two well-known methods in data scaling for ML and statistical analysis purposes. Normalization is applying the formula of the variable to fit between 0 and 1:
$ {X}_{new}=\dfrac{X-{X}_{min}}{{X}_{max}-{X}_{min}} $ (1) where, Xnew is the normalized value, X is the original observation, Xmin is the minimum value, and Xmax is the maximum value in the variable. This method is particularly useful when the data needs to be constrained within a fixed range. On the other hand, standardization transforms data to have a mean of zero and a standard deviation of one using the formula:
$ Z=\dfrac{X-\mu}{S} $ (2) where, Z is the standardized score (z-score), X is the observation, μ is the mean of the observations, and S is the standard deviation. Standardization is useful when comparing data with different units or scales, as it centers the data around zero and accounts for the variance.
Data analysis
-
Some statistical analyses were performed on the final dataset. Statistical analysis is a method for interpreting data, identifying patterns, understanding relationships between variables, and predicting future events. In this study, descriptive analysis and correlation analysis were performed within the scope of statistical analysis.
Descriptive analysis is applied to know the general characteristics of the dataset, to recognize main patterns and trends, and to become more familiar with the dataset for any preliminary analysis. The descriptive analysis aims to reveal the general characteristics of the variables related to the severity of maritime accidents in the final dataset in detail. The study dataset and the results of the descriptive analysis are shown in Table 2.
Table 2. Study dataset and descriptive analysis results.
Variable name Description Data type Unique value count Min. Max. Range Mean Median Mode Standard deviation Variance Date of occurrence The date when the accident happened Numerical 6 2015 2020 5 2016.96 2017 2015 1.52 2.31 Occurrence severity The severity of the accident Categorical 2 0 1 1 0.33 0 0 0.47 0.22 Occurrence with ship(s) The name(s) or description
of the vessel(s) involved in
the accident.Categorical 8 1 8 7 3.75 4 1 2.29 5.26 Ship/craft type The type of vessel Categorical 8 1 8 7 4.22 4 2 2.20 4.84 Lives lost - Total The total number of fatalities in the accident. Numerical 9 0 19 19 0.35 0 0 1.55 2.39 People injured - Total The total number of injured people. Numerical 10 0 37 37 0.59 0 0 2.85 8.14 Pollution Environmental pollution caused by the accident Categorical 2 0 1 1 0.12 0 0 0.32 0.10 Age on casualty The age of the vessel at the time of the accident Numerical 56 0 65 65 18.50 16 18 13.55 183.59 Length overall The total length of the vessel Categorical 205 5 179.985 179.980 11,889.11 176 225 29,806.39 888,420,805.75 Flag state The country where the ship is registered. Categorical 47 1 47 46 25.88 30 30 12.91 166.65 Sea area of occurrence The maritime zone where the accident took place Categorical 10 1 10 9 3.88 4 1 2.57 6.59 Wind force Wind intensity during the accident Categorical 13 0 12 12 4.20 4 5 2.35 5.51 Sea state Wave height and sea conditions Categorical 10 0 9 9 3.06 3 4 1.83 3.34 Natural light Lighting conditions at the time of the accident Categorical 3 1 3 2 1.69 2 2 0.63 0.40 Visibility Visibility range Categorical 5 1 5 4 2.36 2 2 0.66 0.44 Weather conditions General weather Categorical 5 1 5 4 2.55 2 2 0.75 0.56 Bad weather Whether adverse weather contributed to the accident Categorical 3 0 2 2 0.69 1 0 0.71 0.50 Education Crew's education/training level Categorical 2 0 1 1 0.41 0 0 0.49 0.24 Inappropriate behavior Human error led to the accident Categorical 2 0 1 1 0.45 0 0 0.50 0.25 Equipment Equipment failure or inadequacy contributed
to the accident.Categorical 2 0 1 1 0.48 0 0 0.50 0.25 Correlation analysis is a method in which the association between two or more variables and the strength of that relation is assessed statistically. Correlation analysis is commonly reported using the Pearson Correlation Coefficient[38]. Pearson correlation is a parametric measure of the degree of linear relationship between two interval variables[39,40]. It ranges from −1 to +1[41]. +1 is a perfectly positive relationship, so as one variable rises, the other rises linearly. 0 signifies a lack of correlation between the two variables. −1 represents 100% negative correlation (when one variable has a positive change, then the other has a negative linear change. The variables that are correlated with eachother are presented in Table 3.
Table 3. Pearson correlation matrix of dataset variables.
Date of
occurrenceOccurrence
severityOccurrence
with ship(s)Ship/craft
typeLives lost -
TotalPeople injured -
totalPollution Age on
casualtyLength
overallFlag
stateSea area of
occurrenceWind
forceSea
stateNatural
lightVisibility Weather
conditionsBad
weatherEducation Inappropriate
behaviorEquipment Date of occurrence 1.00 −0.03 −0.13 −0.03 −0.07 0.03 −0.14 0.07 0.09 0.02 0.17 0.08 0.09 0.01 0.12 0.11 0.14 −0.06 −0.11 −0.02 Occurrence severity −0.03 1.00 0.15 0.18 0.32 −0.01 0.13 0.15 −0.07 0.02 0.09 0.07 0.07 −0.06 0.15 0.03 0.07 −0.04 −0.07 −0.08 Occurrence with ship(s) −0.13 0.15 1.00 0.00 0.19 0.05 0.02 −0.07 −0.06 0.07 −0.04 −0.10 −0.04 −0.05 −0.09 −0.08 −0.16 −0.01 −0.25 0.12 Ship/craft type −0.03 0.18 0.00 1.00 −0.10 0.14 0.14 0.33 0.06 −0.10 0.04 −0.01 −0.05 0.06 0.03 0.23 0.06 −0.01 0.10 0.01 Lives lost - Total −0.07 0.32 0.19 −0.10 1.00 0.00 −0.05 −0.02 −0.02 −0.12 −0.06 0.03 0.08 −0.10 0.23 −0.01 0.10 0.05 −0.07 −0.04 People injured - Total 0.03 −0.01 0.05 0.14 0.00 1.00 −0.06 0.02 −0.02 0.04 −0.04 −0.15 −0.11 0.10 −0.17 0.14 0.08 0.07 0.01 −0.02 Pollution −0.14 0.13 0.02 0.14 −0.05 −0.06 1.00 −0.02 −0.03 −0.02 −0.04 0.05 0.07 −0.02 −0.03 0.00 0.08 −0.07 0.06 −0.01 Age On Casualty 0.07 0.15 −0.07 0.33 −0.02 0.02 −0.02 1.00 −0.05 −0.03 0.03 0.16 0.00 0.09 0.00 0.11 0.13 0.04 0.00 −0.03 Length overall 0.09 −0.07 −0.06 0.06 −0.02 −0.02 −0.03 −0.05 1.00 −0.04 0.05 −0.07 −0.05 −0.05 0.00 −0.02 −0.04 −0.01 0.10 −0.09 Flag State 0.02 0.02 0.07 −0.10 −0.12 0.04 −0.02 −0.03 −0.04 1.00 −0.03 −0.10 −0.05 −0.03 −0.14 0.00 −0.01 −0.08 −0.02 −0.11 Sea area of occurrence 0.17 0.09 −0.04 0.04 −0.06 −0.04 −0.04 0.03 0.05 −0.03 1.00 0.04 0.16 −0.10 −0.04 0.09 0.11 −0.02 0.09 −0.05 Wind force 0.08 0.07 −0.10 −0.01 0.03 −0.15 0.05 0.16 −0.07 −0.10 0.04 1.00 0.69 −0.03 0.20 0.00 0.59 −0.09 −0.08 0.09 Sea state 0.09 0.07 −0.04 −0.05 0.08 −0.11 0.07 0.00 −0.05 −0.05 0.16 0.69 1.00 −0.05 0.14 0.02 0.59 −0.09 −0.12 0.03 Natural light 0.01 −0.06 −0.05 0.06 −0.10 0.10 −0.02 0.09 −0.05 −0.03 −0.10 −0.03 −0.05 1.00 0.06 −0.08 −0.02 0.11 −0.12 0.00 Visibility 0.12 0.15 −0.09 0.03 0.23 −0.17 −0.03 0.00 0.00 −0.14 −0.04 0.20 0.14 0.06 1.00 0.03 0.05 −0.12 −0.19 0.03 Weather conditions 0.11 0.03 −0.08 0.23 −0.01 0.14 0.00 0.11 −0.02 0.00 0.09 0.00 0.02 −0.08 0.03 1.00 0.51 −0.02 0.05 −0.13 Bad weather 0.14 0.07 −0.16 0.06 0.10 0.08 0.08 0.13 −0.04 −0.01 0.11 0.59 0.59 −0.02 0.05 0.51 1.00 −0.07 −0.08 0.03 Education −0.06 −0.04 −0.01 −0.01 0.05 0.07 −0.07 0.04 −0.01 −0.08 −0.02 −0.09 −0.09 0.11 −0.12 −0.02 −0.07 1.00 0.27 −0.08 Inappropriate behavior −0.11 −0.07 −0.25 0.10 −0.07 0.01 0.06 0.00 0.10 −0.02 0.09 −0.08 −0.12 −0.12 −0.19 0.05 −0.08 0.27 1.00 −0.16 Equipment −0.02 −0.08 0.12 0.01 −0.04 −0.02 −0.01 −0.03 −0.09 −0.11 −0.05 0.09 0.03 0.00 0.03 −0.13 0.03 −0.08 −0.16 1.00 In this study, a correlation analysis was conducted on the final dataset used. According to Köklü et al.[42], a correlation coefficient (r) ranging from 0.01 to 0.29 revealed a weak relationship, values from 0.30 to 0.70 showed a moderate relationship, and r ranging from 0.71 to 0.99 showed a strong relationship. Negative values indicate an inverse relationship. As shown in Table 3, correlations less than −0.50 and greater than 0.50 are highlighted in red. The results of the analysis revealed moderately positive correlations between certain variables: Wind Force and Sea State (0.69), Sea State and Bad Weather (0.59), and Wind Force and Bad Weather (0.59). Based on these findings, it can be concluded that multicollinearity is not present in the model. Multicollinearity refers to a condition in a predictive model where independent variables are highly correlated with each other[43]. In other words, one or more independent variables are strongly associated with other independent variables, which can negatively affect model performance. However, the analysis indicates that there are no variables with high positive correlations that could adversely impact the model.
Modelling
-
In this study, ML algorithms are used to predict the severity of 223 maritime accidents. The categorical variable (light accident = 0, severe accident = 1), which is the metric of accident severity, was numbered and analyzed in two different ways. In order to perform comparative analysis with different models, the classification learner tool was used through the MATLAB application. The models tested in the study consist of various classification algorithms widely used in the literature. The model categories include ET, SVM, and NN. Each algorithm was evaluated in terms of different performance metrics on training and test datasets. The metrics used include accuracy, error rate, precision, recall, sensitivity, F1-score, and total cost. These metrics were used to evaluate both the overall success of the model and its ability to classify particularly severe accidents correctly. The key formulas of the main algorithms used and their operating principles are summarized. It presents both the theoretical background of the models and their role in the classification process in a comparative manner. It is shown in Table 4.
Table 4. Classification algorithms and explanations.
Algorithm Formula/key concept Explanation ET $ \begin{gathered}\hat{y}=majority\_ vote({h}_{1}\left(x\right),\\{h}_{2}\left(x\right),\ldots ..,{h}_{n}\left(x\right))\end{gathered} $ h1 (x): each represents a decision tree trained on different data subsets or features. Predictions are combined through majority voting. SVM $ f\left(x\right)=sign\left({w}^{T}x+b\right) $ w: Weight vector, x: Input feature vector, b: Bias term. SVM finds the optimal hyperplane that maximizes the margin between classes. Kernels can be used to transform non-linear data into a linear separable form. NN $ y=f\left(Wx+b\right) $
(for a single-layer example)W: Weight matrix, x: Input vector, b: Bias term, f: Activation function (e.g., ReLU, sigmoid). NN consists of layers of interconnected nodes and can model complex relationships. Deep learning models use multiple hidden layers. It should be noted that no explicit data balancing technique (e.g., oversampling, undersampling, or cost-sensitive learning) was applied in this study. All models were trained and evaluated on the original imbalanced dataset to ensure a consistent and unbiased comparison framework. While this approach allows for direct assessment of model behavior under real-world data distributions, it may also lead to reduced predictive performance for minority classes. This limitation is acknowledged and considered in the interpretation of the results.
Performance metrics
-
In this study, accuracy, total cost, error rate, precision, recall, and F1 score metrics are used to measure the performance of ML algorithms. Acc is used to measure the overall success of the model and is the ratio of all correct predictions, both positive and negative, to the total predictions. Total cost is calculated by multiplying the false positive (FP) and false negative (FN) predictions made by the model by the cost values assigned to each of them. Error rate is the frequency with which the model often makes incorrect predictions. In short, it is the percentage of times the model fails. Precision is used to show how many of the predictions shown as positive are actually positive. Recall is used to find out how many of the true positive samples are actually correctly identified. The performance measures used in this study and their notations are presented in Table 5.
Table 5. Performance metrics and explanations.
Metric Formula Explanation Accuracy $ \dfrac{TP+TN}{TP+TN+FP+FN} $ Proportion of total predictions that were correct. Total cost $({\mathrm{FP}} \times {\mathrm{C}}_{{\mathrm{FP}}}) + ({\mathrm{FN}} \times {\mathrm{C}}_{{\mathrm{FN}}}) $ Total cost of false positives and false negatives based on their respective costs. Error rate $ \dfrac{FP+FN}{TP+TN+FP+FN}=1-Accuracy $ Proportion of total predictions that were incorrect. Precision $ \dfrac{TP}{TP+FP} $ Proportion of positive predictions that were actually correct. Recall $ \dfrac{TP}{TP+FN} $ Proportion of actual positives that were correctly identified by the model. F1 score $ 2\times \dfrac{Precision\times Recall}{Precision+Recall} $ Harmonic mean of precision and recall; balances both metrics. TP (true positive): correctly predicted positive instances; TN (true negative): correctly predicted negative instances; FP (false positive): incorrectly predicted positive instances; FN (false negative):iIncorrectly predicted negative instances; C_FP, C_FN: cost assigned to false positive and false negative predictions, respectively. -
Performance of developed ML models for maritime accident severity classification is evaluated using a set of performance assessment tools: confusion matrices, precision–recall curves, and Receiver Operating Characteristic (ROC) curves, and a number of statistical performance indicators.
The confusion matrices in Fig. 1 reveal the detailed classification results of the representative models from ET, SVM, and NN. The ET (Bagged Trees) model obtains more balanced accuracy rates on the two classes, achieving higher correct classification rates for both the majority and minority classes. Both SVM and NN models obtain moderate accuracy rates, and their main errors arise from incorrect classification of minority class samples. It can be seen that all models are affected by the dataset imbalance issue and present various biases towards the majority class, with reduced sensitivity in recognising severe accidents.
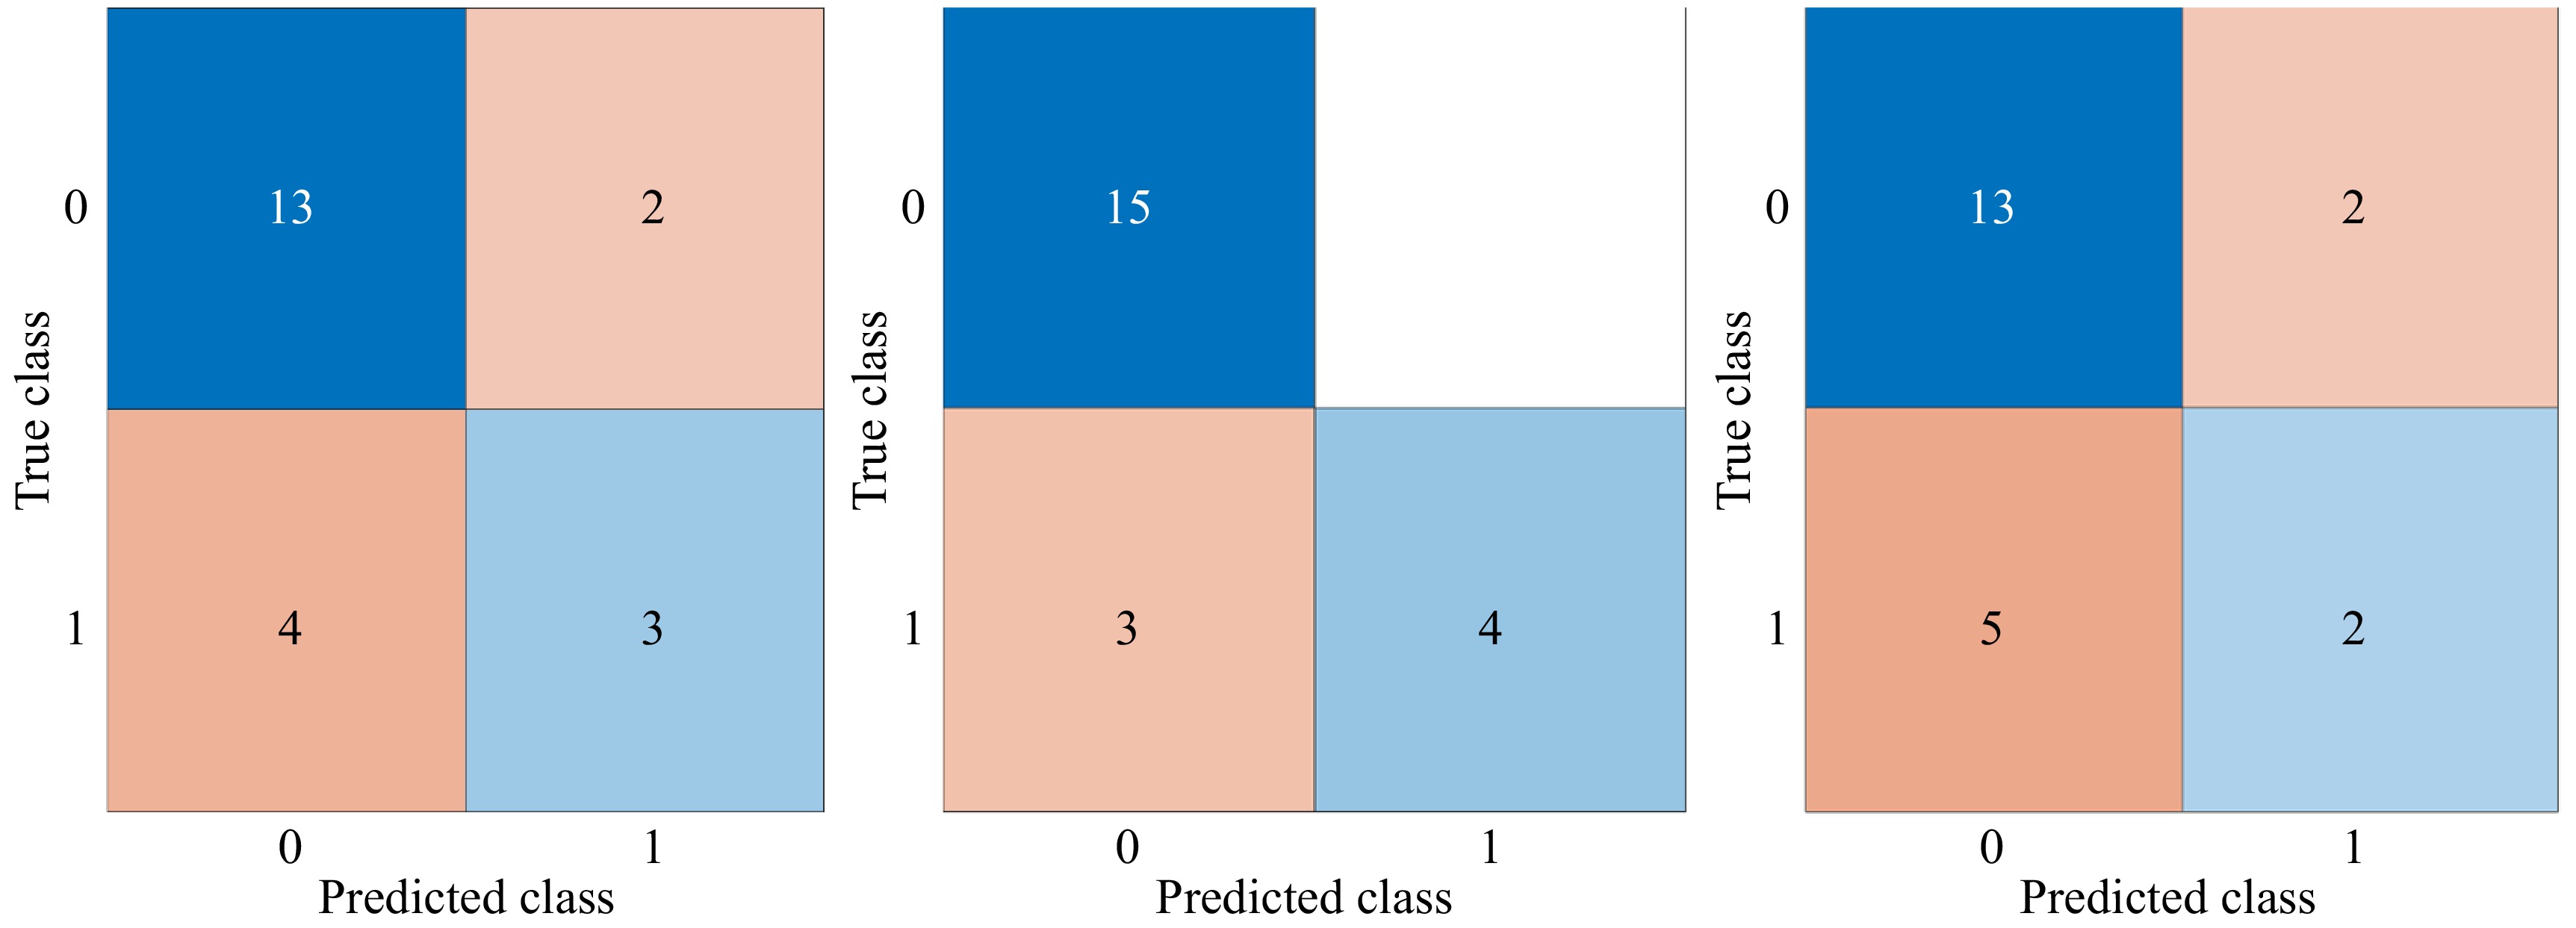
Figure 1.
Test results of confusion matrix for SVM, ET, NN.
Figure 1 provides additional evaluation in the form of precision-recall curves. These curves are especially relevant to imbalanced classification problems. The ET method has a relatively consistent level of both precision and recall that is generally favorable, especially for the identification of severe cases that are true positives without excessive false positives. The SVM method has high precision for lower levels of recall but is less consistent than the ET method. The NN method has poor consistency in precision for the minority class. This further supports the ET method as a good approach to dealing with imbalanced data. Figure 2 presents the precision-recall curves.
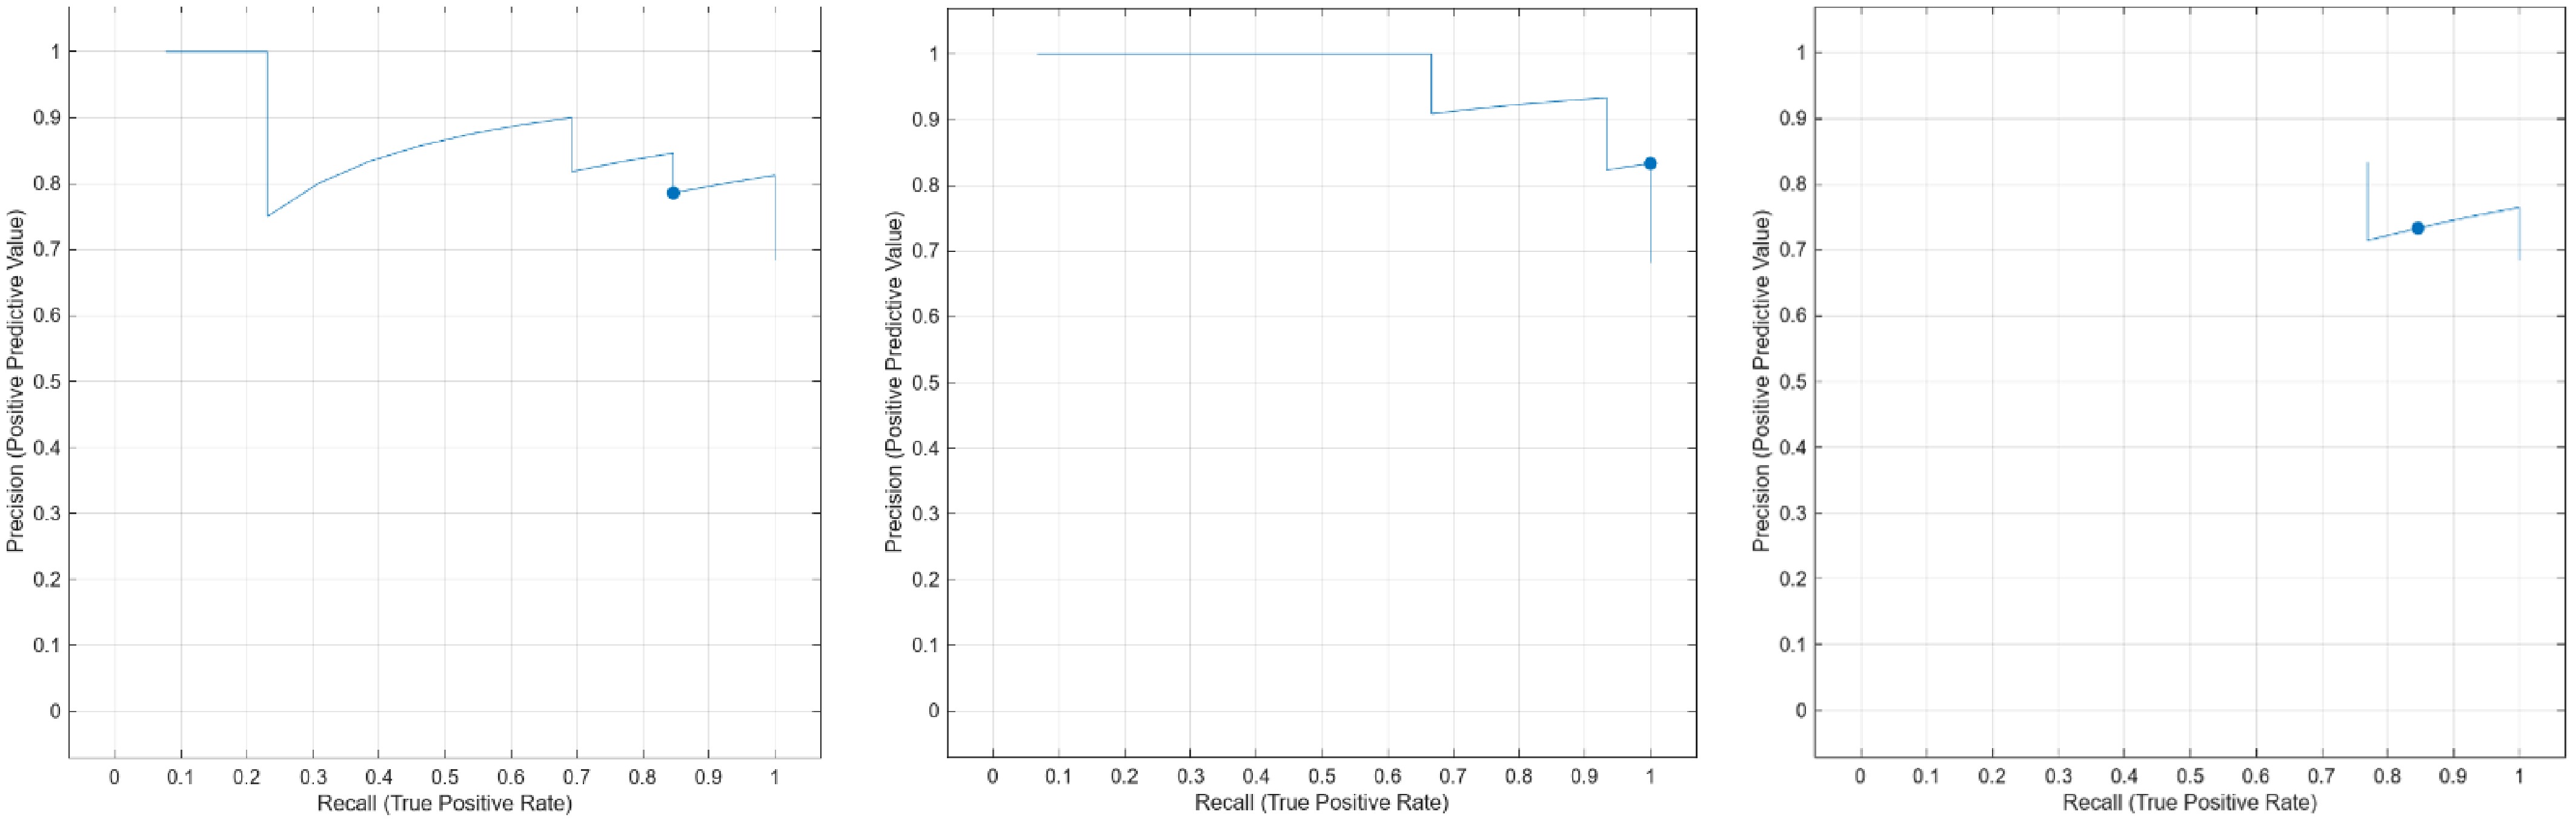
Figure 2.
Test Precision-Recall Curve for SVM, ET, NN.
This is further illustrated in the ROC curves of Fig. 3. The ET model has the best performance, followed by the SVM, and then the NN. The ROC curve of the ET model is closest to the optimal classifier in the top-left corner of the ROC space, indicating the best trade-off between true positive rate and false positive rate for maximizing sensitivity while controlling the false positive rate for different levels of accident severity.
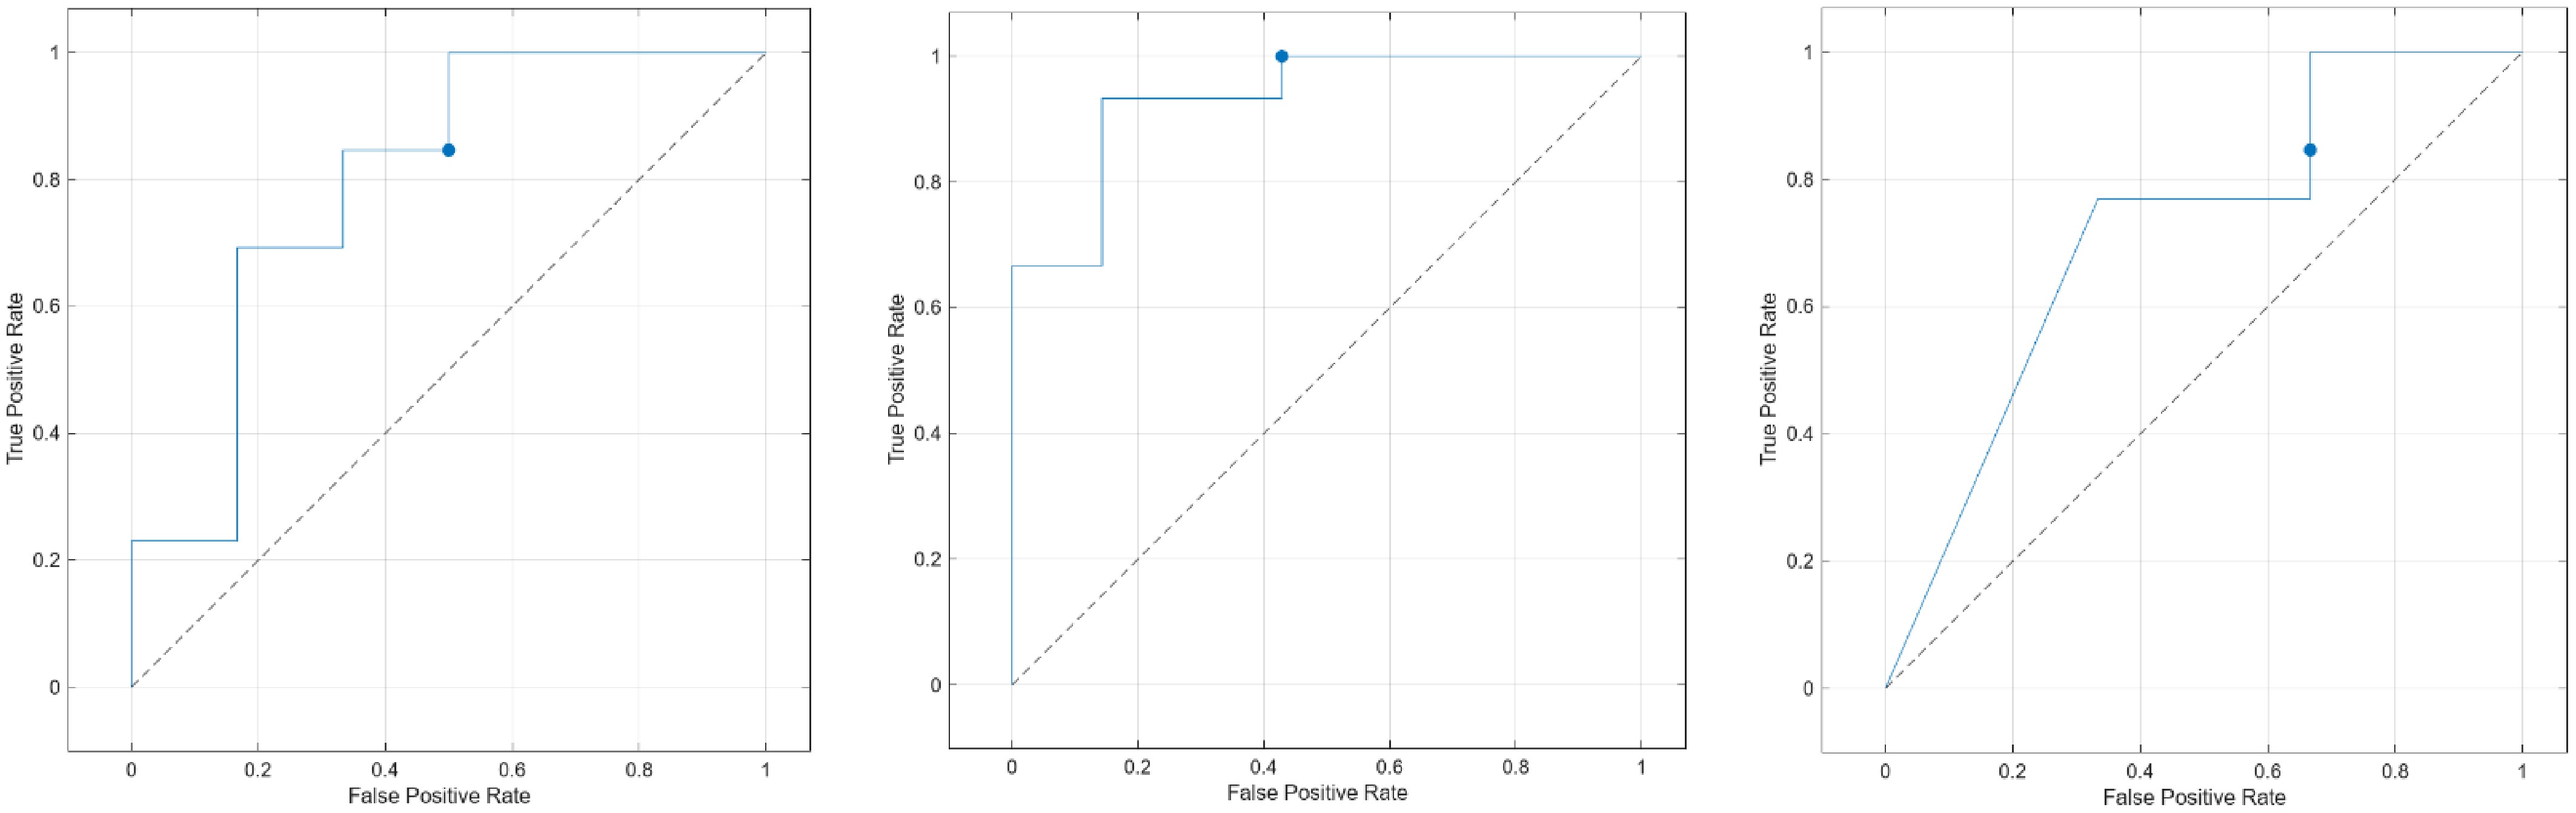
Figure 3.
Test ROC curve for SVM, ET, and NN.
The performance of different classifiers is presented in further detail (see Table 8), including both validation results and results obtained from an independent test set. While none of the models achieve almost perfect results, the performance of the Bagged Trees model is exceptionally good. It reached the highest score of 86.4% correct classifications and a very good precision of 91.7%, an even better recall of 78.6%, and an F1 score of 81.8%. In addition to the good results for severity classification, the scores deliver a good balance of precision and recall, which is important in this classification task. The scores of the Linear SVM model come close to and even surpass the results of the other SVM variations. While some drop below the baseline, others succeed with a higher score when using a different kernel. The results for the NN models vary, and only the Bilayered NN achieved results similar to the best baseline models, reaching an accuracy of 81.8% and an F1 score of 78.2%. The other models achieved moderate results, which, however, differ when changing their architecture and hyperparameters.
ET-based methods performed best in this study, with the bagging-based ET (Bagged Trees) achieving the highest average accuracy. Other methods, such as SVM and NN, require more careful selection of model parameters (e.g., the SVM kernel) or have limitations such as poor performance in imbalanced datasets. The best Bagged Trees model achieved an accuracy of 86.4%, outperforming the next best model by more than 5%.
Combining the evaluation of confusion matrices, precision-recall curves, ROC curves, and a set of standard statistical performance measures, ET-based approaches outperform other methods in maritime accident severity classification. These results show the effectiveness of ML methods when dealing with safety-related maritime data and provide a solid basis for the use of predictive models in risk and safety assessment and decision support systems.
Training and test datasets
-
This part presents the figures and percentages of the datasets being utilized for training and testing the applied ML algorithms. The results achieved are important to estimate the performance. For testing and training, the final dataset used in this study is split into a 90% training set and a 10% test set. The number and percentage of the training and testing datasets for ML algorithms are shown in Table 6.
Table 6. The count and percentage of observations for training and test datasets.
Observations Percentage Training data 201 90% Test data 22 10% Total 223 100% Performance optimization
-
In this study, various approaches are applied for enhancing the performance of classification-based ML models. They are k-fold cross-validation, principal component analysis (PCA), and feature selection (FS). k-fold cross-validation was used with k set to 5. Five-fold cross-validation is where the dataset is divided into five equal parts. One of these parts is treated as the test data set, and the other four parts are treated as the training data set. The model is then trained and tested, and this cross-validation process is repeated five times, with each fifth serving as the test set. The general performance of the model is constructed by averaging the values of the performance metrics extracted for each test run. The PCA was first conducted as a different approach. PCA analysis outcomes are also helpful to estimate the influence and overall importance of variables of interest in classification and regression models.
The FS technique was employed to simplify the model, to prevent overfitting, and to enhance the predictability. Also, based on the prediction model studies, it was found that FS analysis had an effect of 3%–5% on the prediction performance. The features, the tests run, and the features' scores under the FS analysis can be found in Table 7. In this study, MRMR, Kruskal-Wallis, ANOVA, and Chi2 scores were used. Accordingly, 18 different variables with scores greater than 0 were selected to be used in the training and testing of the models. The variables selected through the feature selection process were directly used as input features for all classification models, ensuring consistency across the comparative evaluation framework.
Table 7. Feature selection algorithms and importance scores of variables.
No. Features MRMR No. Features Kruskal-Wallis No. Features ANOVA No. Features Chi2 1 FlagState 0.1695 1 LivesLostTotal 37.2502 1 LivesLostTotal 12.4176 1 LivesLostTotal 35.2632 2 LivesLostTotal 0.1254 2 Pollution 4.3902 2 Pollution 4.4197 2 ShipCraftType 8.7494 3 Pollution 0.0125 3 OccurrenceWithShips 4.0363 3 OccurrenceWithShips 3.9258 3 OccurrenceWithShips 8.0179 4 OccurrenceWithShips 0.0100 4 Visibility 3.3583 4 Visibility 3.6051 4 Pollution 4.4079 5 AgeOnCasuality 0.0099 5 ShipCraftType 3.1645 5 ShipCraftType 3.1648 5 WeatherConditions 3.6584 6 WeatherConditions 0.0084 6 SeaState 2.9925 6 AgeOnCasullaty 2.9968 6 SeaAreaOfOccurrence 3.5726 7 ShipCraftType 0.0074 7 BadWeather 2.5277 7 SeaState 2.4333 7 AgeOnCasullaty 3.2206 8 SeaAreaOfOccurrence 0.0070 8 WindForce 2.2931 8 BadWeather 2.1908 8 LengthOverall 2.7646 9 SeaState 0.0056 9 SeaAreaOfOccurrence 2.2641 9 WindForce 1.7697 9 Flag State 2.6595 10 PeopleInjuredTotal 0.0056 10 AgeOnCasullaty 2.0993 10 NaturalLight 1.7167 10 Visibility 2.3193 11 Visibility 0.0049 11 NaturalLight 1.8143 11 InappropriateBehavior 1.4607 11 BadWeather 2.0783 12 Equipment 0.0027 12 WeatherConditions 1.5272 12 SeaAreaOfOccurrence 1.3792 12 SeaState 2.0251 13 InappropriateBehavior 0.0026 13 InappropriateBehavior 1.4646 13 Equipment 1.2943 13 InappropriateBehavior 1.4697 14 WindForce 0.0022 14 Equipment 1.2983 14 Education 0.8669 14 Equipment 1.3027 15 NaturalLight 0.0021 15 Education 0.8702 15 WeatherConditions 0.3633 15 NaturalLight 1.0221 16 BadWeather 0.0018 16 LengthOverall 0.8169 16 LengthOverall 0.3337 16 Education 0.8730 17 Education 0.0018 17 PeopleInjuredTotal 0.2213 17 PeopleInjuredTotal 0.0543 17 PeopleInjuredTotal 0.2649 18 LengthOverall 0.0000 18 FlagState 0.1792 18 Flag State 0.0482 18 WindForce 0.2359 Model performance comparison
-
This section presents a systematic comparison of the classification performance of the developed models. The analysis includes Boosted Trees, Bagged Trees, various kernel-based SVM models, and different architectures of NN, evaluated on both validation and test datasets. Performance is assessed using multiple metrics, including accuracy, total cost, error rate, precision, recall, and F1 score. In order to avoid misleading results, especially when there is an uneven number of instances in each class, a multi-metric approach was used to evaluate the performance of all methods. Comparative validation and test results of classification-learning ML algorithms are presented in Table 8.
Table 8. Comparative training and testing results.
Model
categoryModel type Validation Test Accuracy Total cost Error rate Precision Recall F1 score Accuracy Total cost Error rate Precision Recall F1 score ET Boosted Trees 66.7% 67 33.3% NaN NaN NaN 59.1% 9 40.9% 51.0% 51.0% 50.9% Bagged Trees 80.1% 40 19.9% 79.6% 73.9% 75.5% 86.4% 3 13.6% 91.7% 78.6% 81.8% SVM Linear SVM 70.6% 59 29.4% 69.3% 61.9% 62.5% 81.8% 4 18.2% 82.9% 79.5% 80.8% Quadratic SVM 74.6% 51 25.4% 74.4% 70.5% 71.7% 72.7% 6 27.3% 69.3% 67.3% 68.0% Cubic SVM 74.1% 52 25.9% 73.2% 72.0% 72.5% 72.7% 6 27.3% 69.3% 67.3% 68.0% Fine Gaussian SVM 66.7% 67 33.3% NaN 50.0% 40.5% 68.2% 7 31.8% NaN 50.0% 40.6% Medium Gaussian SVM 69.7% 61 30.3% 68.2% 59.2% 58.8% 81.8% 4 18.2% 90.6% 75.0% 78.2% Coarse Gaussian SVM 66.7% 67 33.3% NaN 50.0% 40.5% 68.2% 7 31.8% NaN 50.0% 40.6% NN Narrow NN 71.7% 58 28.9% 69.4% 69.9% 69.6% 77.3% 5 22.7% 75.6% 75.6% 75.6% Medium NN 70.6% 59 29.4% 68.9% 69.5% 69.1% 77.3% 5 22.7% 75.6% 75.6% 75.6% Wide NN 72.1% 56 27.9% 70.4% 69.8% 70.1% 72.7% 6 27.3% 69.3% 67.3% 68.0% Bilayered NN 68.2% 64 31.8% 65.0% 64.6% 64.8% 81.8% 4 18.2% 90.6% 75.0% 78.2% Trilayered NN 75.1% 50 24.9% 74.5% 74.2% 74.3% 68.2% 7 31.8% 61.7% 59.0% 59.3% The results are shown in Table 8. The best ensemble model to generate new instances is the Bagged Trees, which presents the most balanced results on the validation and test sets. In particular, the best model reaches an accuracy of 86.4% (error rate of 13.6%) and a precision of 91.7%. The other methods present considerably lower results. The Boosted Trees model, for instance, reaches only 66.7% of accuracy in the validation set. Furthermore, the precision, recall, and F1 score for the minority class present NaN values, which means that this model failed to capture this class, and it tends to overfit the majority class.
Linear SVM and Medium Gaussian SVM performed best among the SVMs, and in general had very good performance. It appears a linear boundary is sufficient for this data. While Fine and Coarse Gaussian SVM achieved recall levels close to 80%, they had NaN for their respective precision values, meaning they were unable to correctly classify one of the classes. Moving on to the NN models, the highest validation performance was reached by the Trilayered NN with an accuracy of 75.1%; however, it fell quite far on the test set at 68.2%. The narrow, medium, and bilayered NN's performed consistently well on both the validation and the test sets. Consequently, the results demonstrate that Bagged Trees is the best balanced generalizer, with linear SVM and certain NN models serving as viable alternatives. However, the prevalence of NaN values and variable performance levels clearly indicates that class imbalance heavily impacts model performance as well as how models are evaluated.
-
In this paper, a classification problem was constructed to predict the severity of maritime accidents (severe or light). A total of 223 maritime accidents from 2015 to 2020 were collected, and 18 features were extracted from these data, which were then treated as training samples for classification. It should be noted that direct comparison of performance metrics across different studies may be misleading due to variations in datasets, feature engineering processes, class distributions, and evaluation methodologies. Therefore, the comparisons presented in this section are intended to provide general context rather than definitive performance benchmarking.
Severity prediction is a critical task in the maritime industry, and a range of ML models (ET, SVM, and NN) were implemented within MATLAB Classification Learner to explore their predictive accuracy. Experimental results demonstrated that some models reached high accuracy. ML methods have great potential in maritime safety research. By shifting from frequency statistics to high-precision classification of severity, research findings indicate that ML methods are effective for severity prediction. Although conventional statistical analysis methods (such as logistic regression and time series analysis like ARIMA) have been widely used to model maritime accident data to understand its trend[15,32], some maritime accident data possess high dimensionality and non-linearity, which is more suitable for ML methods to analyze[2,18].
The Bagged Trees algorithm performed the best for overall performance, with an accuracy of 86.4%, an error rate 13.6%, and a balanced F1 score of 81.8%. This is consistent with the previous findings that ensemble-based methods, such as Bagging and Boosting, have been performing well in terms of predictive robustness in imbalanced maritime datasets. Among SVM models, the best performance was obtained by the Linear SVM (accuracy: 81.8%), followed by the Medium Gaussian SVM (accuracy: 81.8%), in terms of balance of precision and recall. Performances of other Gaussian and Cubic SVM models also reflect their potential to learn non-linear decision boundaries, where SMOTE-based oversampling helped improve the performance. In the case of NNs, the performance of the Bilayered NN was the most stable and achieved an accuracy of 81.8% with an F1 score of 78.2%. On the other hand, the Trilayered NN model, the first of its kind, performed better in terms of capturing slightly finer patterns and relationships within the data.
Vessel-specific factors have a significant impact on accident severity. Gross Tonnage and Engine Power have a strong predictive ability on the severity of the impact that an accident can have on a ship, determining whether or not it will develop into a severe incident. In previous studies, it has been identified that larger ships, due to their higher momentum and operational complexities, are more likely to suffer serious damage to their structure, and also to have a greater environmental impact[7,21,26,29]. Furthermore, the age of the vessel, particularly if the vessel is over 30 years old, is a significant risk factor, consistent with previous research, which identifies that the degradation of a ship's ageing hull and machinery systems poses a high risk of a catastrophic event occurring, such as sinking or total loss[7,44].
Compared to other factors, human factors are yet more vulnerable in affecting the severity of accidents[45]. It is difficult to quantify, but evidence suggests that human error is one of the main causes of maritime accidents, accounting for up to 96%, especially for operational negligence and violation of regulations. This paper further explores the application of the factors from a human aspect, which concludes that crew experience and theoretical knowledge should be introduced into the relevant models. Statistical results of accident data also indicated that less experienced seafarers were more likely to be involved in severe types of accidents. This was in accordance with severe consequences caused by personnel error, which can be avoided by strictly complying with international regulations and proven effective by current practices. By referring to relevant international regulations, such as the STCW Convention and the ISM Code, corresponding recommendations were proposed to minimize potential risks brought by human factors in marine environments.
The severity of accidents is influenced not only by environmental factors of the ships and the navigational conditions, but also by natural environmental factors. The research highlights the impact of weather conditions such as wind speed and sea state on collision risk. It is seen that as wind speed and sea state increase, the severity of accidents also increases. This is consistent with findings by Brandt et al. and Knapp et al.[10,46]. The results show that although visibility may be good, severe collisions can occur in high-risk areas, such as waterways, canals, and straits, including the Strait of Istanbul. This finding is supported by earlier studies that warn against overconfidence in apparently safe navigational circumstances[23,47].
The results of the presented research achieved competitive and, in some cases, superior performance compared to recent studies conducted on similar datasets. According to Brandt et al.[10], the highest reported accuracy for maritime accident risk prediction was 70.23% using logistic regression. Similarly, Passarella et al.[48] employed the XGBoost technique and achieved 74% accuracy, while the RF classifier yielded 69% accuracy. In another study, Zilci & Akyol[49] reported varying performance across different models, with the highest accuracy reaching 96% using an artificial NN, whereas other models, such as SVC, DT, NBC, and LR, achieved 58%, 57%, 52%, and 48% accuracy, respectively. In comparison, the Bagged Trees model used in this study produced accuracy values of 86.4%, 79.2%, 72%, 87.2%, 85%, 73.5%, 78.5%, and 85% across different classification scenarios. These results indicate that the proposed approach yields robust and competitive performance, suggesting that the dataset used in this study is both informative and well-structured for machine learning-based maritime accident analysis.
Since conventional forecasting-based models have already achieved very promising results in the domain of maritime safety management, there is now an increasingly acute need to further develop this research along an interpretable direction. The introduction of XAI techniques can assist in boosting the interpretability of the models and enhancing the decision-making capability of maritime safety management, where predictive results regarding maritime accident severity can be further explained using specific mechanisms[12,50].
This comparative modeling study, therefore, offers a sound scientific basis for the proactive management of maritime risk. By identifying the most effective algorithms to be used for maritime accident severity prediction, it is possible to move from a reactive, post-incident focus on accident investigation to the development of proactive, real-time decision support systems (DSS) for ship masters, coastal state authorities, and other maritime stakeholders[22,23]. The effective use of high-quality accident investigation data, assembled by authorities and national transport safety organizations such as the UK's MAIB, USA's NTSB, and Australia's ATSB, can facilitate improved risk assessment, strategic planning, and the more efficient deployment of resources to avoid maritime disasters, including groundings and oil spills[3,51,52].
-
Although this study establishes a comprehensive framework for classifying maritime accident severity, the limited sample size of 223 accidents and the absence of data on critical human and organizational factors, such as crew fatigue and stress levels, constitute primary research limitations. Future scholarly inquiry should incorporate more extensive international databases, such as the International Maritime Organization (IMO)'s Global Integrated Shipping Information System, to enhance model generalizability and predictive accuracy. Methodologically, the simplification of accident severity into a binary target (serious vs non-serious) may fail to capture the nuanced complexities of accident outcomes; therefore, future research should transition toward multi-class classification and the exploration of hybrid deep learning architectures.
Furthermore, because current models rely on historical accident reports, their utility in developing real-time Decision Support Systems during navigation is constrained. In this context, the integration of live automatic identification system data streams, vessel sensor data (e.g., engine performance), and high-resolution meteorological variables is identified as a critical area for advancement. Finally, to address the 'black-box' nature of complex ML algorithms, future studies should prioritize XAI techniques, such as SHAP and LIME, to ensure transparency for decision-makers. Ultimately, the proposed framework must be validated against completely independent, unseen datasets from disparate geographic regions to confirm its resilience in real-world operational contexts.
We would like to thank to the anonymous reviewers for their constructive feedback and comments.
-
The authors confirm contributions to the paper as follows: study conception and design: Kaymak M, Korkmaz H, Ozcelik S, Fidanoglu A; data collection: Kaymak M, Korkmaz H; analysis and interpretation of results: Korkmaz H, Ozcelik S, Fidanoglu A; draft manuscript preparation: Kaymak M, Korkmaz H. All authors reviewed the results and approved the final version of the manuscript.
-
The data that support the findings of this study are available in the Zenodo repository. These data were derived from the following resources available in the public domain: https://zenodo.org/records/5592999
-
The authors declare that they have no conflict of interest.
- Copyright: © 2026 by the author(s). Published by Maximum Academic Press, Fayetteville, GA. This article is an open access article distributed under Creative Commons Attribution License (CC BY 4.0), visit https://creativecommons.org/licenses/by/4.0/.
-
About this article
Cite this article
Korkmaz H, Kaymak M, Ozcelik S, Fidanoglu A. 2026. Machine learning-based classification of maritime accident severity: a comparative approach. Digital Transportation and Safety 5(2): 170−181 doi: 10.48130/dts-0026-0014 

Machine learning-based classification of maritime accident severity: a comparative approach
- Received: 18 April 2026
- Revised: 04 May 2026
- Accepted: 17 May 2026
- Published online: 29 June 2026
Abstract: The continuous growth of global trade has significantly increased maritime traffic density and navigational complexity, escalating the risk of maritime accidents and their catastrophic consequences. While traditional research has focused on accident frequency, accurately predicting accident severity is vital for enhancing safety protocols and optimizing emergency resource allocation. This study aims to predict the severity of maritime accidents by using classification-based machine learning algorithms. This study proposes a comprehensive comparative framework for classifying maritime accident severity using an open-access dataset containing 223 accidents recorded between 2015 and 2020, incorporating 18 risk-influential variables related to vessel characteristics and environmental conditions. The research evaluates three primary machine learning algorithm families: Ensemble Trees, Support Vector Machines, and Neural Networks. Model performance is rigorously compared using metrics such as accuracy, total cost, error rate, precision, recall, and F1-score to identify the most robust predictor. This comparative approach addresses the limitations of traditional statistical methods in handling non-linear, high-dimensional maritime data. As a result, the most successful algorithm was the Bagged Tree algorithm with an accuracy rate of 86.4%. The attributes that are effective in the decision mechanism of the model, especially the effect of variables such as the number of casualties, flag state, total length, sea area of occurrence, and visibility distance, are emphasized. The findings provide stakeholders with a robust scientific basis for proactive risk assessment and targeted accident prevention strategies, ultimately contributing to safer global maritime operations.