











-
Carbonization of biomass for carbon-rich materials is a technologically mature solution for achieving negative carbon emissions, which increases the soil carbon pool and crop yields[1]. The carbonization of biomass is commonly achieved through pyrolysis and hydrothermal carbonization. When the carbonization product (referred to as 'char') is added to soil, the readily degradable organic carbon in char stimulates the activity of soil microorganisms, leading to an increase in CO2 emissions from the soil[2]. Therefore, the thermal and chemical stability of char is crucial for effective soil carbon sequestration. Thermal stability is commonly characterized by the recalcitrance index (R50)[3], with higher R50 values indicating lower degradation rates and higher durability of char in environments with abiotic and biotic factors[4]. Aromatic moieties and a lower H/C ratio enhance the thermal stability of char[5,6]. Chemical stability is employed to simulate the natural oxidation process of char in the environment[7] and is defined by the rate of carbon loss following oxidation, with a lower carbon loss rate indicating greater chemical stability. Multiple factors influence the chemical stability of char, including the O/C and H/C atomic ratios and aromatic carbon content. As the O/C and H/C atomic ratios decrease and the aromatic carbon content increases, the chemical stability of char improves[6,8]. The specific surface area (SSA) also greatly influences the chemical stability, with a larger specific surface area leading to decreased chemical stability[9].
Hydrothermal carbonization involves the direct conversion from biomass to hydrochar in a subcritical state. Compared with pyrolysis, hydrothermal carbonization is not limited by the moisture content of biomass, eliminating the need for pre-drying and reducing energy consumption when processing biomass with high moisture content[10]. Compared with pyrolytic biochar, hydrochar has a lower aromatic content and is generally considered to be less stable[11,12]. Subcritical water has a relatively high solubility for hydrophobic organic compounds (HOCs). When hydrochar is prepared from plant aerial parts, such as palm leaves, the cuticle covering their surface dissolves and subsequently reprecipitates, forming a hydrophobic coating on the surface of hydrochar[13]. When there is a significant difference between the properties of the hydrophobic coating and the bulk hydrochar, the hydrophobic coating can greatly affect the stability of the hydrochar. For example, when calcium-rich invasive plants are used as feedstock, a calcium oxalate coating forms on the surface of hydrochar. The coating's barrier effect enhances the thermal and chemical stability of the hydrochar[14].
Because the cuticle includes cutin and waxes and has a complex composition, its content and composition vary across plant species, tissues, and organs[15]. The characteristics of a hydrophobic coating may vary due to the distinct properties of the cuticle. Leaves are the plant organs with the highest number of cuticles, and the surfaces of corn leaves, lotus leaves, palm leaves, and pine needles are all covered with cuticles. Our previous study demonstrated that hydrochar derived from palm leaves at 260 °C can form a hydrophobic coating on its surface[13], yet that work was limited to a single plant species and addressed only the coating's effects on specific surface area and oxygen-containing functional groups, without considering its implications for stability. The present study therefore expands the feedstock range to four distinct plant leaves—palm, corn, lotus, and pine—to compare the variations in hydrophobic coating properties among them, and more importantly, to investigate how these coating differences regulate the thermal and chemical stability of the resulting hydrochars. To this end, this study aimed to: (i) characterize the composition of the hydrophobic coating extracted from hydrochars derived from palm leaves, corn leaves, lotus leaves, and pine needles; (ii) analyze the physicochemical properties of hydrochars before and after removing the hydrophobic coating; (iii) assess the thermal and chemical stability of hydrochars before and after removing the hydrophobic coating; and (iv) elucidate the stabilization mechanism of hydrochar in relation to its physicochemical properties affected by the hydrophobic coating. The results of this study provide theoretical support for expanding the applications of hydrochar for soil carbon sequestration.
-
Biomass (corn leaves, lotus leaves, and pine needles) was collected from a village in Chongqing, China. The collected biomass was washed with tap water and dried in an oven (DHG-9240A, Shanghai Jing Hong Laboratory Instrument Co., Shanghai, China) at 60 °C before being ground into powder using a planetary ball mill (model QM-3SP4, Nanjing Nanda Instrument Co., Nanjing, China) and passed through a 0.15-mm mesh sieve. The sieved material was used as raw material to prepare hydrochar and labeled as CL, LL, and PN for corn leaves, lotus leaves, and pine needles, respectively. Hydrothermal carbonization experiments were carried out in a magnetically stirred miniature high-pressure reactor (WCGF-200 mL, Xi'an Taikang Biotechnology Co., Shaanxi, China). A mixture of 10 g biomass and 90 mL deionized water was placed into the 200 mL stainless steel reactor. The reactor was then heated using an external resistance heater, with its temperature monitored by a thermocouple inserted into the reactor. The reaction was maintained at 260 °C for 5 h. Upon completion, the heater was turned off, and the stainless steel reactor was removed and allowed to cool naturally to room temperature. A vacuum filter device was used to separate the solid (hydrochar) and liquid in the hydrothermal carbonization products through a Buchner funnel. The filtered solid was mixed with 450 mL of deionized water, and the residue on the surface of the hydrochar was washed and then filtered. The above procedure was repeated more than five times to minimize residue in the liquid-phase product until the pH of the filtrate was stable. The solid hydrochar was frozen in a −50 °C freezer (DW-86L80, Zhejiang Jiesheng Low-Temp Equipment Co., Huzhou, China) and dried in a vacuum freeze-dryer (model LGJ-12, Huayu Xiongdi, Zhengzhou, China) with a cold trap temperature lower than −56 °C and vacuum of less than 10 Pa. The dried hydrochar was passed through a 0.15-mm mesh sieve and stored in a sealed bag until future analysis. Hydrochar prepared from corn leaves, lotus leaves, and pine needles was labeled as CL-H, LL-H, and PN-H, respectively. The previously prepared palm leaves and palm leaf hydrochar were labeled as PL and PL-H, respectively. Previous studies have shown that cellulose hydrochar does not form a hydrophobic coating[13]. Therefore, in this study, cellulose hydrochar was used as a control, and cellulose and cellulose hydrochar were labeled as CE and CE-H, respectively. The basic physicochemical data of PL-H and CE-H were cited from our published work[13], while all stability-related data and contact angle results in this study were newly obtained through independent experiments.
In situ characterization of the hydrophobic coating
-
The formation of the hydrophobic coating was characterized in situ using X-ray photoelectron spectroscopy (XPS) in conjunction with an argon ion etching technique. By controlling the etching time, the samples were progressively exposed to different depths (35, 70, 105, 150, 200, and 300 nm), allowing for an examination of their internal structure. The XPS analysis employed Al Kα X-rays as the excitation source, and by analyzing the intensity of the characteristic peaks of C, O, and N at various depths, the atomic ratios of these elements were calculated.
Hydrophobic coating extraction and composition identification
-
During the hydrothermal carbonization process, the polarity of water decreased, leading to a reduction in its dielectric constant. At 200 °C, the dielectric constant of water is comparable to that of methanol, while at 300 °C, it resembles that of acetone. To ensure the extraction of the hydrophobic coating, acetone was used. The extraction experiment was carried out in 40-mL vials with Teflon-lined screwcaps, in which 0.15 g hydrochar was added first, followed by 30 mL acetone according to a 200:1 mL g−1 liquid-solid ratio. The vial was shaken at 120 r min−1 for 24 h at 25 ± 0.5 °C in a shaker incubator (model ZQWY-220ES, Shanghai Zhichu Instrument Co., Shanghai, China) and then centrifuged at 2,500 r min−1 for 20 min using a DD5 centrifuge (Hunan Herexi Instrument and Equipment Co., Changsha, China). The supernatant was the extraction product, while the solid residue constituted the hydrochar after acetone extraction.
The solid was dried in an oven (DHG-9240A, Shanghai Jing Hong Laboratory Instrument Co., Shanghai, China) at 60 °C, weighed, ground, passed through a 0.15-mm mesh sieve, and then stored until further analysis. The mass loss rate of hydrochar was calculated based on the mass difference before and after acetone extraction. After acetone extraction, the hydrochar samples obtained from CE-H, CL-H, LL-H, PL-H, and PN-H were labeled as CE-H-ex, CL-H-ex, LL-H-ex, PL-H-ex, and PN-H-ex, respectively.
The chemical compositions of the extraction products were determined by gas chromatography–mass spectrometry (GC–MS). Filtration and derivatization were required before testing. A nylon syringe filter (0.45 μm pore size) was used to filter the extraction product. A 1 mL aliquot of the filtered extract was then transferred to a 2.5 mL vial with a Teflon-lined screwcap and evaporated to dryness under a nitrogen stream. Anhydrous pyridine (100 µL) and BSTFA-TMCS (100 µL) were added to the vial, which was then wrapped in aluminum foil and heated in an oven at 80 °C for 2 h. After naturally cooling to room temperature, the vial was placed in a refrigerator (BCD-521WDPW, Haier, Qingdao, China) at 4 °C for 24 h.
The composition of the derived extraction product was determined using a 7890A GC system with a 5975C quadrupole mass-selective detector (Agilent, Santa Clara, California, USA). The injection volume was 1 µL with a split ratio of 20:1. High-purity helium was used as the carrier gas with a flow rate of 1.5 mL min−1. The heating program was as follows: an initial hold at 50 °C for 2 min, followed by heating at a rate of 5 °C min−1 to 150 °C, where it was held for 5 min. The temperature was then increased at the same rate to 200 °C and held for 5 min, followed by further heating to 250 °C with another 5 min hold. Finally, the temperature was raised to 300 °C at 5 °C min−1 and maintained for 5 min. The whole heating process took 72 min. The ionization mode was electron-impact ionization (EI) with an electron energy of 70 eV, inlet temperature of 280 °C, transfer line temperature of 280 °C, ion source temperature of 220 °C, quadrupole temperature of 150 °C, and scanning range of 10–500 amu. The detected components were searched in the National Institute of Standards and Technology (United States Department of Commerce) database (
www.nist.gov/srd/nist-standard-reference-database-1a ). The percentage of each component was calculated by the area normalization method[6].Characterization of physicochemical properties of hydrochar
-
The C, H, N, O, and S contents of hydrochar samples were determined using an elemental analyzer (Vario MicroCube, Elementar Company, Germany). The crystalline structure of the hydrochar was determined by a SmartLab3 XRD (Rigaku, Tokyo, Japan). The surface morphology of the hydrochar was observed via a GeminiSEM 300 field emission scanning electron microscope (Zeiss, Munich, Germany). Contact angles were determined with an LSA100 goniometer (LAUDA Scientific, Germany) via static water droplet measurement to evaluate the surface hydrophobicity of hydrochar samples. The surface functional groups of the hydrochar were determined using FTIR spectroscopy (iS50 FT-IR, Thermo Fisher Scientific, USA), and the Brunauer–Emmett–Teller (BET) surface area was determined using a surface area analyzer (Micromeritics, Norcross, Georgia, USA). The carbon structure of the hydrochar was determined using a solid-state 13C nuclear magnetic resonance (NMR) spectrometer (JNM-ECZ600R, JEOL, Tokyo, Japan) with a resonance frequency of 150.91 MHz, a magic angle spinning frequency of 8 kHz, a contact time of 27.2 ms, and a pulse delay of 3.0 s.
Determination of hydrochar thermal stability
-
The thermogravimetric (TG) curves of hydrochar samples were obtained by a simultaneous thermal analyzer (DSC/DTA-TG) (STA 449 F5 Jupiter®, NETZSCH, Germany). Samples (8–10 mg) were heated from 25 to 1,000 °C under an air atmosphere at a rate of 10 °C min−1. The TG curves were corrected by deducting the ash content from the samples. The thermal stability of the hydrochar was evaluated using the recalcitrance index, R50, proposed by Harvey et al.[3], which was calculated as:
$ \mathit{R}_{\mathrm{50}}\mathrm{\ =\ }\mathit{T}_{\mathrm{50x}}\mathrm{/}\mathit{T}_{\mathrm{50\; graphite}} $ (1) where, T50x and T50 graphite are the temperatures corresponding to 50% mass loss in the corrected TG curves for the sample and graphite, respectively. According to Harvey et al.[3], T50 graphite is 886 °C.
The TG curves were further processed by model-fitting kinetic analysis to quantify the thermal-decomposition behavior of the hydrochar. The Coats–Redfern integral method was applied because it allows the activation energy (E) and the pre-exponential factor (A) to be extracted from a single-heating-rate experiment[16]. The working equation is:
$ \mathrm{ln[} \mathit{g} \mathrm{(} \mathit{\alpha } \mathrm{)/} \mathit{T} ^{ \mathrm{2}} \mathrm{]=ln(} \mathit{AR} \mathrm{/} \mathit{\beta E} \mathrm{)}- \mathit{E} \mathrm{/(} \mathit{RT} \mathrm{)} $ (2) where, α = (m0−mt)/(m0−m∞) denotes the fractional conversion; m0, mt, and m∞ are the initial, instantaneous, and final sample masses (mg); β is the linear heating rate (K min−1); R is the universal gas constant (8.314 J mol−1 K−1); T is the absolute temperature (K); and g(α) is the integral form of the reaction model. Specifically, E represents the activation energy (J mol−1), and A refers to the pre-exponential factor (min−1). The most commonly used g(α) expressions are listed in Supplementary Table S1.
The kinetic analysis proceeded as follows. First, α was calculated from the TG curve at 10 K min−1 intervals. Referring to previous literature[17], data points within the conversion range α = 0.2–0.8 were adopted for subsequent fitting. For each g(α) model, ln[g(α)/T2] was plotted against 1/T and the data were fitted by ordinary least-squares regression. The model yielding the highest coefficient of determination (R2) was taken as the statistically most probable reaction mechanism. Subsequently, E and A were obtained from the slope k and intercept b of the best-fit line via:
$ \mathit{E} =- \mathit{kR} $ (3) $ \mathit{A}\mathrm{\ =(}\mathit{\beta E}\mathrm{/}\mathit{R}\mathrm{)exp(}\mathit{b}\mathrm{)} $ (4) To eliminate manual calculation deviations and ensure the accuracy and reproducibility of kinetic parameter results, all the above computational procedures were programmatically implemented via Python on the PyCharm platform, and the complete calculation code is provided in the Supplementary Text 1.
Measurement of chemical stability of hydrochar
-
The chemical stability of hydrochar was determined using the potassium dichromate (K2Cr2O7) oxidation method[9]. The hydrochar sample containing 0.04 g of organic carbon was placed into 40 mL vials with Teflon-lined screwcaps, and 30 mL of 0.1 M K2Cr2O7/2 M H2SO4 solution was added. All experiments were conducted in triplicate for repeatability. A blank control without a hydrochar sample was treated under the same conditions for blank correction. Theoretical calculations indicated that even with complete oxidation of the organic carbon in hydrochar, the residual Cr(VI) in the oxidation solution comprised 26.0% of the initial dosage.
The vials were shaken at 120 rpm for 60 h at 55 °C in a shaker incubator (model ZQWY-220ES, Shanghai Zhichu Instrument Co., Shanghai, China). During the reaction, the vials were opened multiple times to release the gas formed. After the reaction, the vials were centrifuged at 2,500 r min−1 for 10 min using a DD5 centrifuge (Hunan Herexi Instrument and Equipment Co., Changsha, China), and the supernatant was filtered through 0.45 μm Millipore filters. The Cr(VI) concentration in the filtrate was detected using the diphenyl-carbazide spectrophotometric method at 540 nm. A calibration curve was established with a series of Cr(VI) standard solutions (0–0.4 mg L−1) for quantitative analysis, and all test results were corrected with the blank control. The blank test verified that the Cr(VI) concentration remained constant in the blank group before and after the reaction, confirming no spontaneous reduction or loss of Cr(VI) in the absence of hydrochar, which guaranteed the accuracy of experimental data.
Carbon loss was determined by the consumption of Cr(VI) based on the following chemical equation:
$ \rm {2K}_{ {2}} {Cr}_{ {2}} {O}_{ {7}} +3C+8H_{ {2}} {SO}_{ {4}}\to {2K}_{ {2}} {SO}_{ {4}} +2Cr_{ {2}} {(SO}_{ {4}} {)}_{ {3}} +3CO_{ {2}}\uparrow +8H_{ {2}} {O} $ The carbon loss rate was calculated based on the ratio of the amount of carbon lost to that of organic carbon in hydrochar. Combined with the redox stoichiometric relationship and the consumed molar amount of Cr(VI), all calculation parameters were integrated into a unified formula. The mathematical expression for the carbon loss rate is presented as follows:
$ L\left(\text{C}\right)=\dfrac{3 \times\left({C}_{\text{initial}}-{C}_{\text{residual}}\right)\times V \times M\left(\text{C}\right)}{4 \times M\left({\text{C}}_{\text{r}}\right)\times m{\left(\text{C}\right)}_{\text{initial}}}\times 100{\text{%}} $ (5) where, L(C) is the carbon loss rate (%), Cinitial and Cresidual are the initial and residual mass concentrations of Cr(VI) (g L−1) in the reaction solution, V is the volume of the added oxidizing solution (L), M(Cr) is the molar mass of chromium (52.00 g mol−1), M(C) is the molar mass of carbon (12.01 g mol−1), and m(C)initial is the initial organic carbon mass of hydrochar (0.04 g).
The solid residues in the bottom of vials were frozen at −50 °C in a freezer (DW-86L80, Zhejiang Jiesheng Low-Temp Equipment Co., Huzhou, China) for a duration of 12 h. Following freezing, the samples were transferred to a vacuum freeze-dryer (model LGJ-12, Huayu Xiongdi, Zhengzhou, China) and dried for 24 h to obtain the dried solid residues. The solid residues obtained from the chemical oxidation of leaf-derived hydrochars were designated as CL-H-RS, LL-H-RS, PL-H-RS, and PN-H-RS, respectively.
Statistical analysis
-
One-way analysis of variance (ANOVA) was used to test the significance of differences between hydrochars obtained from different biomass sources (p < 0.05 was considered significant). Least Significant Difference (LSD) was used for multiple comparisons. A t-test was used to determine the significance of differences before and after acetone extraction. Pearson correlation was used for correlation analysis. All statistical analyses were performed using SPSS 20.0 (IBM, Armonk, NY, USA). Principal component analysis (PCA) was performed using CANOCO v5.0 (Microcomputer Power, Ithaca, NY, USA).
-
The (O + N)/C atomic ratio increased with increasing depths of leaf-derived hydrochar (Supplementary Fig. S1). This ratio at the same depth of the leaf-derived hydrochar was consistently lower than that of the raw biomass, preliminarily suggesting the potential formation of a hydrophobic surface layer on leaf-derived hydrochar. To substantiate this inference, we conducted direct morphological observations and static water contact angle measurements on hydrochar before and after acetone treatment. The pristine leaf-derived hydrochars exhibited intact and relatively smooth surface morphology, while distinct porous structures could be clearly observed after acetone treatment (Supplementary Fig. S2). The exposure of originally blocked pores strongly demonstrates the effective removal of the surface covering layer, and the relevant increase in specific surface area will be systematically discussed in the subsequent section. Contact angle tests further complement the structural evidence: the cellulose hydrochar (CE-H) showed a low contact angle of 59.3°, while the four leaf-derived hydrochars exhibited much higher contact angles ranging from 127.0° to 149.1° (Supplementary Fig. S3), verifying the strong surface hydrophobicity of pristine leaf-derived hydrochar. Notably, the contact angle showed no obvious change after extraction, which could be well explained by the Cassie–Baxter principle[18]. The removal of surface hydrophobic components weakened surface chemical hydrophobicity and tended to decrease the contact angle[19], whereas the newly exposed pores increased surface roughness and improved physical hydrophobicity via air entrapment, which tended to increase the contact angle. The counterbalance between these two opposite effects resulted in stable macroscopic wettability, further confirming the obvious surface structural alteration induced by acetone treatment. Combined with the above morphological and wettability results, it can be fully confirmed that a hydrophobic coating is formed on the surface of leaf-derived hydrochar, and acetone extraction can effectively remove this surface hydrophobic covering layer.
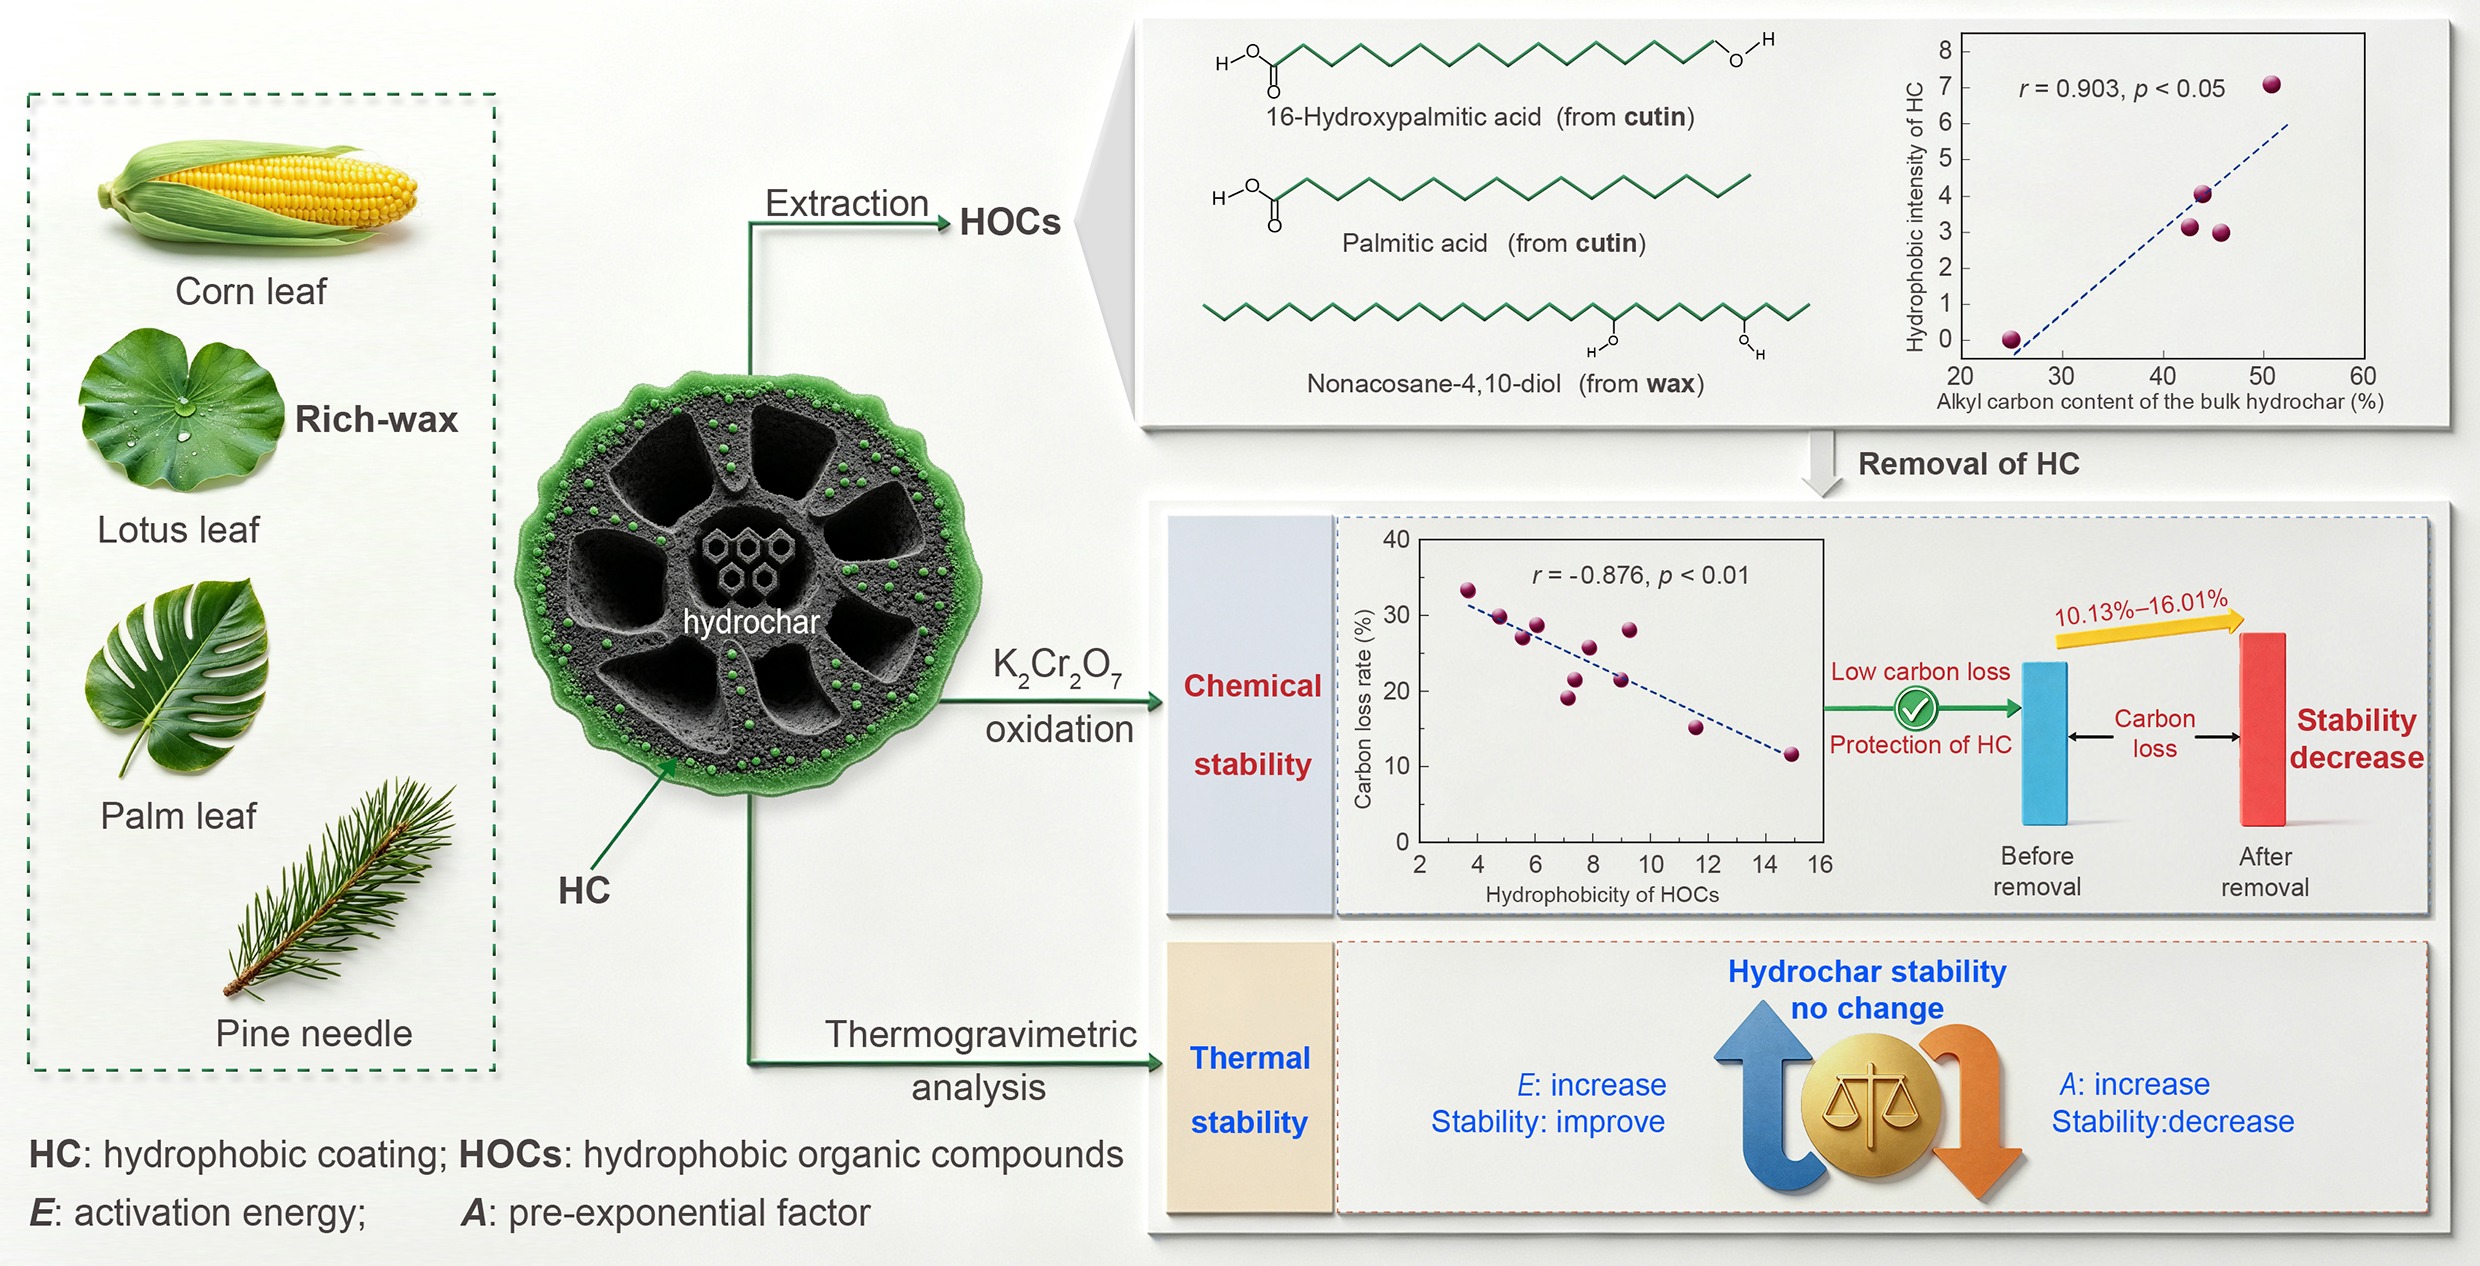
The hydrochar samples exhibited extraction yields of 13.70% (CE-H), 32.46% (CL-H), 29.48% (LL-H), 29.57% (PL-H), and 28.01% (PN-H). Despite the comparable coating loadings among the four leaf-derived hydrochars, their coating compositions differed markedly (Table 1). To trace this compositional divergence, we analyzed the acetone-extractable fractions and surface wettability of the raw leaves. Lotus leaves showed a high contact angle of 133.7°, consistent with their abundant extractable wax marker nonacosane-4,10-diol[20], which accounted for 62.63% of total hydrophobic organic compounds (HOCs). In contrast, the raw CL, PL, and PN leaves exhibited much lower contact angles and HOC contents of only 8.21%–12.63%, indicating negligible wax abundance. Given that cuticular waxes are structurally stable long-chain aliphatics while cutin is an ester-rich polyester susceptible to hydrothermal hydrolysis[21,22], these inherent differences govern the final hydrochar coating origins. Accordingly, during 260 °C carbonization, the robust wax skeletons of lotus leaves were largely preserved[23], resulting in LL-H coatings dominated by nonacosane-4,10-diol. Conversely, the ester-rich cutin in CL, PL, and PN underwent extensive depolymerization, releasing characteristic C16 monomers (palmitic acid and 16-hydroxypalmitic acid) that constituted the hydrophobic coatings on CL-H, PL-H, and PN-H. Collectively, these results confirmed that the hydrophobic coating of LL-H derived mainly from intrinsic leaf wax, while that of CL-H, PL-H, and PN-H originated from cutin degradation products.
Table 1. Hydrophobic organic compounds identified in the extraction products of hydrochar derived from different biomass
Number Compound name Molecular formula LogPa Peak area percentage (%) CE-H CL-H LL-H PL-H PN-H 1 Hexylmalonic acid C9H16O4 2.1 –b 2.21 – – – 2 3,5-Dimethylphenol C8H10O 2.4 – 1.05 – – – 3 12-Hydroxydodecanoic acid C12H24O3 3.6 – – – – 4.08 4 14-Hydroxymyristic acid C14H28O3 3.7 – – – – 7.76 5 Dehydrodiisoeugenol C20H22O4 4.4 – – – – 1.60 6 Dodecanoic acid C12H24O2 4.6 – 1.49 – – – 7 16-Hydroxy-9-Hexadecenoic acid C16H30O3 4.6 – – 3.00 – – 8 16-Hydroxypalmitic acid C16H32O3 4.8 – 1.53 – – 36.73 9 Dehydroabietic acid C20H28O2 5.6 – 1.07 – – 9.10 10 Myristic acid C14H28O2 6.11 – 1.36 – 1.32 – 11 Oleic acid C18H34O2 6.5 – 1.33 – – 1.46 12 Ergosterol peroxide C28H44O3 6.7 – 1.60 – – – 13 Palmitic acid C16H32O2 7.17 – 17.62 13.86 24.07 5.64 14 Stearic acid C18H36O2 7.4 – 4.17 1.45 8.31 – 15 3-Methoxycholest-7-en-6-ol C28H48O2 7.7 – 1.68 – – – 16 β-Sitosterol C29H50O 9.3 – 7.69 11.66 4.03 4.65 17 Nonacosane-4,10-diol C29H60O2 12.1 – – 20.78 – – 18 alpha-Tocopherol C29H50O2 12.2 – – – 2.74 – 19 Nonacosan-10-ol C29H60O 14 – – 14.66 – 2.40 20 17-Pentatriacontene C35H70 18.2 – – 1.02 – – Note: a P is the octanol-water partition coefficient; b – means non-detected. All data are derived from single GC–MS measurements without replicates. LogP values were retrieved from the PubChem database. CE-H, CL-H, LL-H, PL-H, and PN-H represent hydrochar prepared from cellulose, corn leaves, lotus leaves, palm leaves, and pine needles, respectively. Generally, a larger LogP value indicates a more hydrophobic organic compound, where P represents the octanol–water partition coefficient[24]. All LogP values used in this study were retrieved from the PubChem database. Experimentally measured LogP values were preferentially adopted when available, and the database-built semi-empirical XlogP3 values were used for compounds without experimental data. The LogP values of palmitic acid, 16-hydroxypalmitic acid, and nonacosane-4,10-diol varied greatly, with nonacosane-4,10-diol having the highest value of 12.1. Due to the different main compositions of HOCs in different hydrochar samples, it is essential to consider both the peak area percentage and the LogP value of each HOC when investigating the overall properties of the hydrophobic coating. This study introduced the concept of hydrophobic intensity of hydrophobic coating, which was defined as the sum of the products of the peak area percentage and the LogP value for all HOCs within a hydrophobic coating. The mathematical expression for this parameter was:
$ I=\sum\limits_{i=1}^n{F}_{i}{S}_{i} $ (6) where, I is the hydrophobic intensity of the hydrophobic coating; Fi is the LogP value of the i-th HOC; Si is the relative peak area percentage of the i-th HOC obtained from GC–MS total ion chromatograms (%).
It is noteworthy that the GC–MS-derived relative peak area percentage is used for semi-quantitative component analysis in this study. Due to varying EI detector response factors among organic compounds, peak area proportions cannot precisely represent molar or mass fractions. However, this method is commonly used for comparative analysis of organic component abundance in biomass-derived samples and is reliable for evaluating the relative hydrophobic contribution of individual HOCs in this work. The I values of CL-H, LL-H, PL-H, and PN-H were 2.97, 7.08, 3.13, and 4.05, respectively, with LL-H hydrophobic coating exhibiting the largest I value. Meanwhile, the I value of CE-H was zero. Correlation analysis between I values and contact angles was performed to verify the index. However, no significant correlation was observed. This is because the hydrophobic intensity index only reflects the intrinsic molecular hydrophobicity of organic components, while the contact angle represents the overall macroscopic wettability of materials affected by multiple factors beyond organic chemical properties. Thus, this empirical index was only suitable for qualitatively evaluating the relative hydrophobic contribution of organic coating components and cannot fully characterize the practical macroscopic hydrophobic performance of hydrochar materials. The difference in hydrophobic intensity among these samples was inherently determined by the distinct biochemical compositions of raw plant cuticles: the wax-dominated coating of LL-H contained abundant high-LogP components, whereas the cutin-based coatings of the other three samples relied on less hydrophobic substances.
Although the hydrophobic coating of CL-H and PL-H had the same main composition, they showed slight differences in their hydrophobic intensity. Palmitic acid, a saturated fatty acid, can form a crystalline structure by assembling into dimers through O–H…O hydrogen bonding under suitable conditions[25,26]. The XRD patterns showed that PL-H contained strong diffraction peaks of palmitic acid crystals, while CL-H did not (Fig. 1a, b). This indicated that the palmitic acid arrangement in PL-H was ordered, forming a crystalline coating, while the palmitic acid arrangement in CL-H was more disordered. This difference can be attributed to the presence of other HOCs, such as β-sitosterol, which serve as impurities and inhibit the crystallization of palmitic acid during the formation of the hydrophobic coating[27]. Impurities affect the crystallization process in a concentration-dependent manner, where higher concentrations are more likely to inhibit crystal formation[28,29]. Analyzing the ratio of the total peak percentage of non-palmitic acid HOCs to the peak area of palmitic acid within the hydrophobic coating showed that the ratios of CL-H and PL-H were 1.43 and 0.68, respectively. This indicated a higher content of other HOCs, excluding palmitic acid, in the CL-H hydrophobic coating, which significantly inhibited the crystallization of palmitic acid.
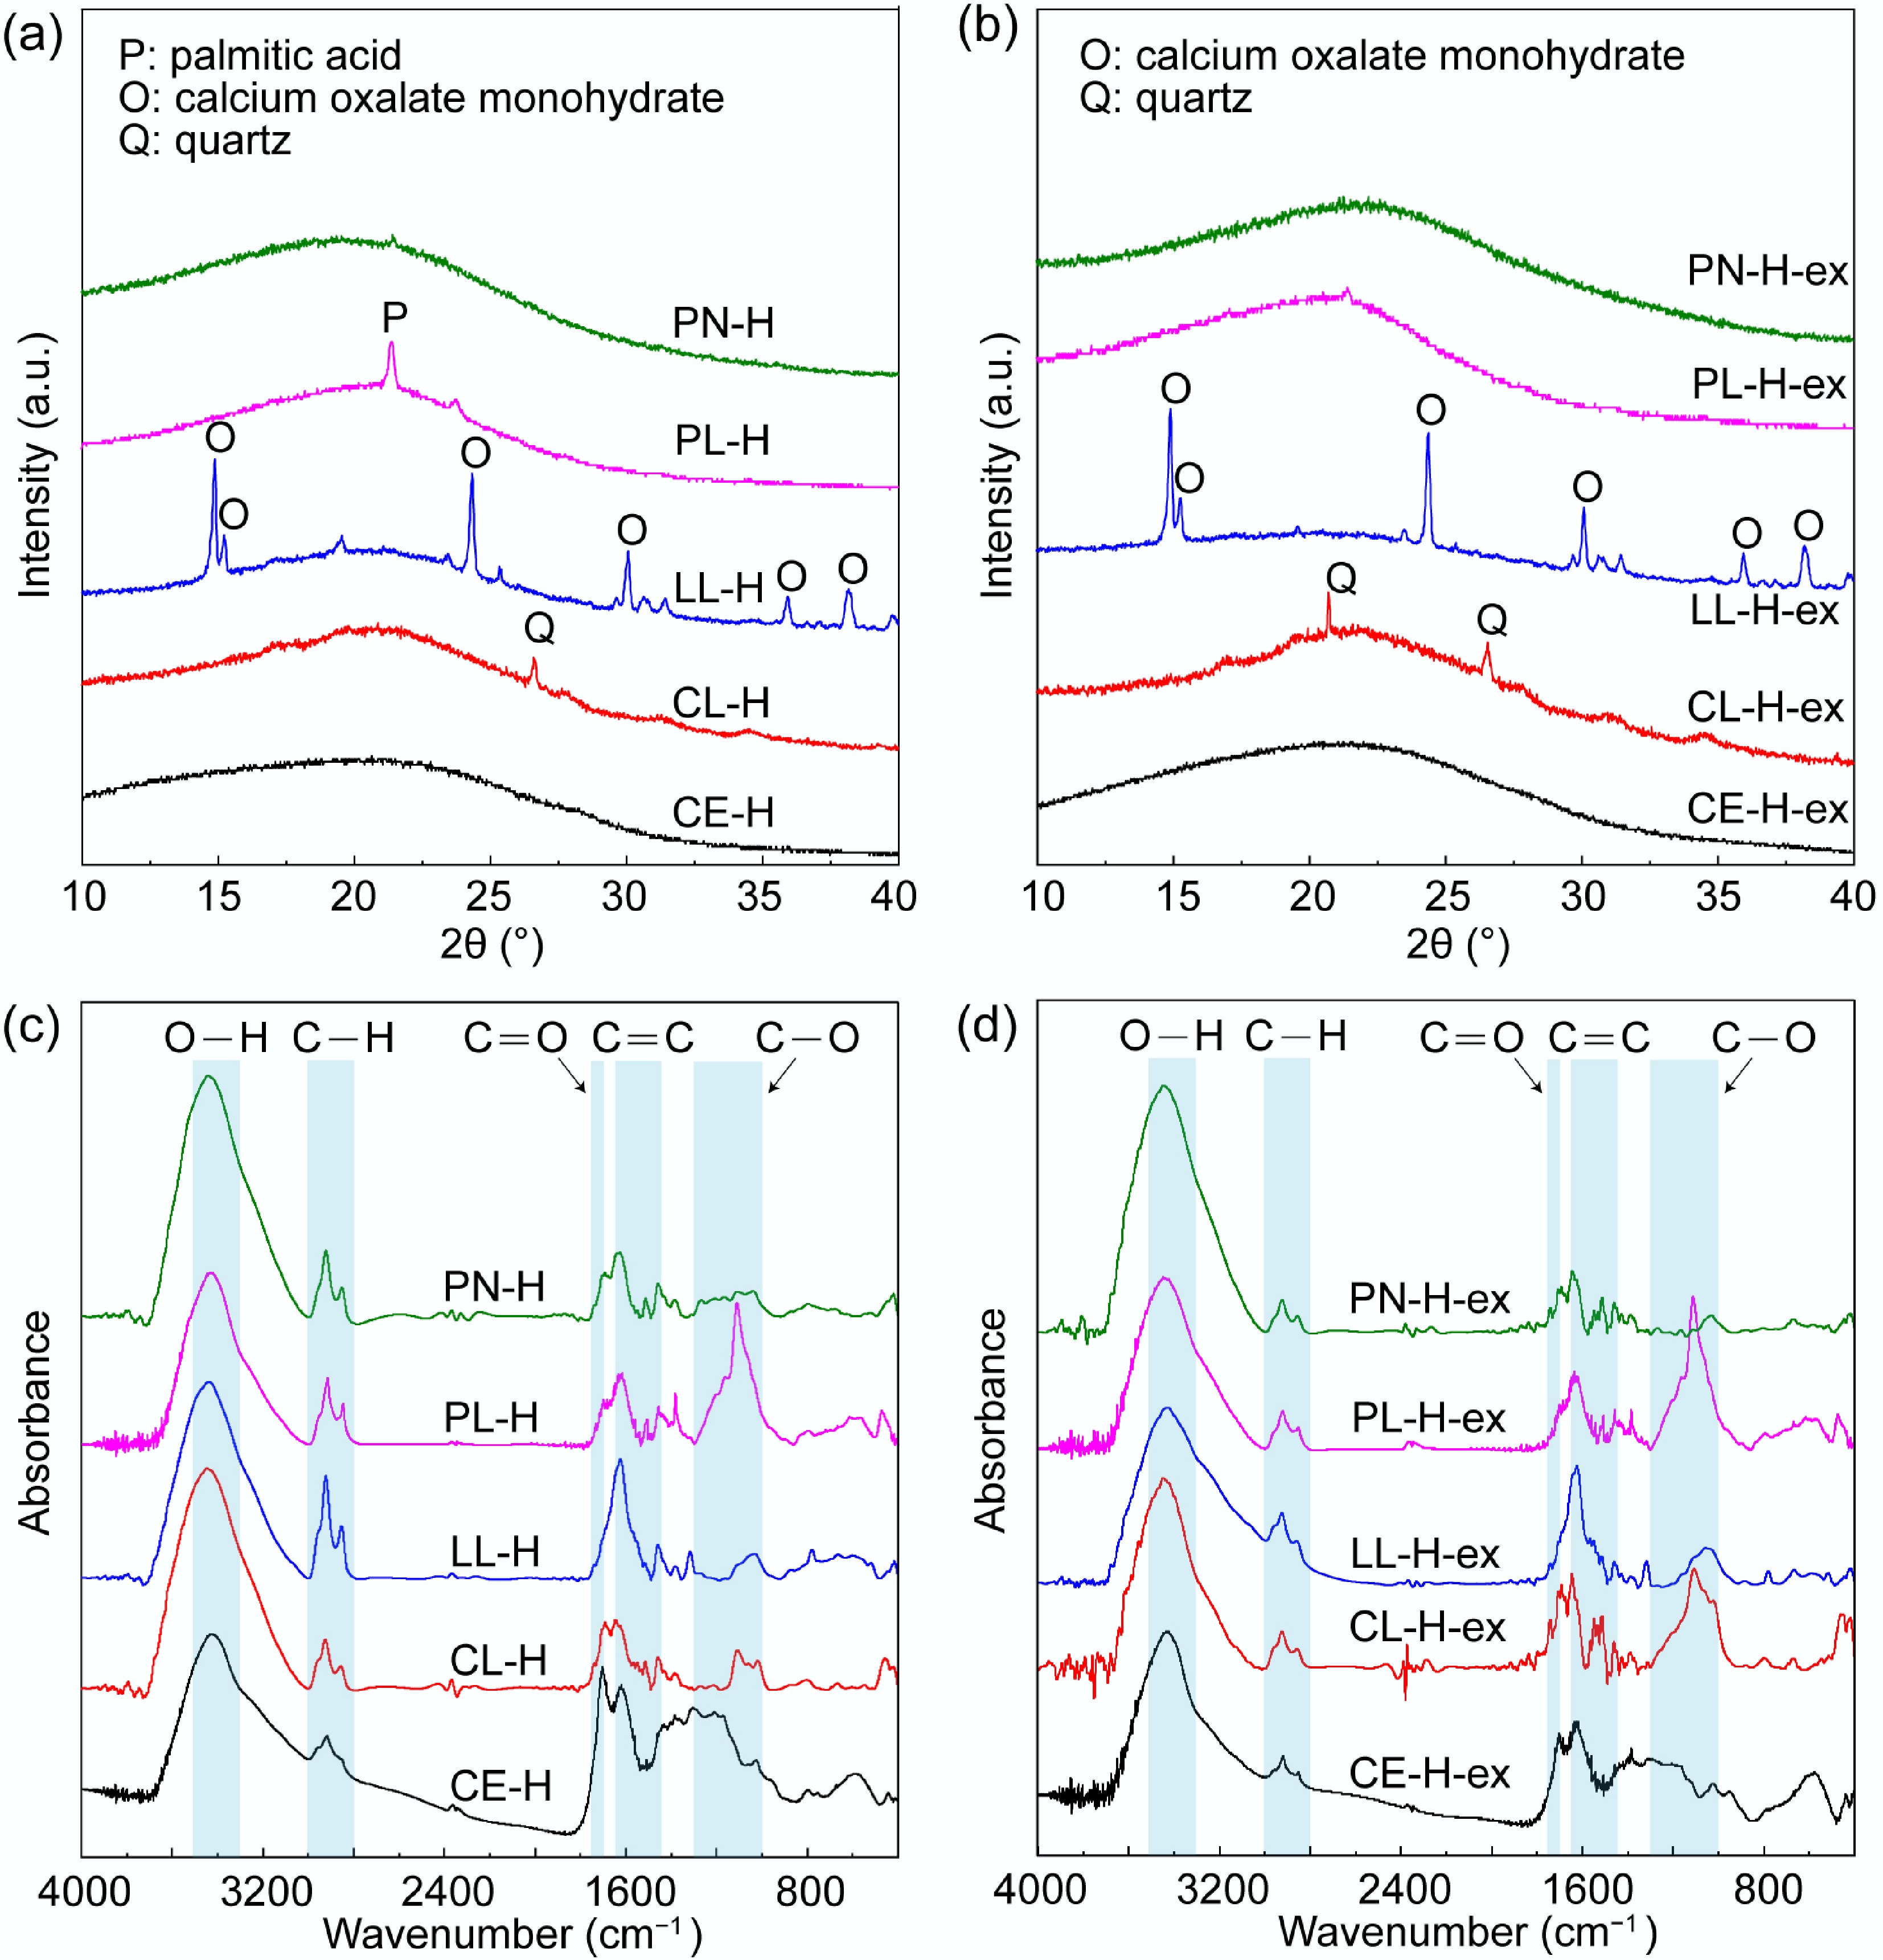
Figure 1.
(a), (b) XRD patterns and (c), (d) FTIR spectra of different hydrochar samples before (left column) and after (right column) acetone extraction. Abbreviation definitions: CE-H, CL-H, LL-H, PL-H, and PN-H represent unextracted hydrochar derived from cellulose, corn leaves, lotus leaves, palm leaves, and pine needles, respectively; CE-H-ex, CL-H-ex, LL-H-ex, PL-H-ex, and PN-H-ex correspond to acetone-extracted hydrochar samples.
Combining the elemental composition of hydrochar before and after acetone extraction (Table 2), we calculated the mass loss of hydrochar and of each element within the hydrochar. The ratio of the mass loss of each element to the overall mass loss of hydrochar represented the relative content of elements in the extraction product, which was mathematically expressed as:
$ \gamma =\dfrac{M{C}_{0}-(100{\text{%}}{\text-}\eta) M{C}_1}{{M\eta}} =\dfrac{{C}_0-(100{\text{%}}{\text-}\eta) {C}_1}{\eta} $ (7) where, γ is the relative content of an element in the extraction product (%); M is the mass (g) of the hydrochar before extraction; η is the mass loss rate of the hydrochar after extraction (%); C0 is the relative content of an element in hydrochar before extraction (%); C1 is the relative content of an element in the hydrochar after extraction (%).
Table 2. Elemental composition of hydrochar samples before and after acetone extraction
Sample C (%) H (%) O (%) N (%) S (%) H/C O/C CE 42.07 ± 0.24 6.41 ± 0.01 52.48 ± 2.32 –I – 1.83 0.94 CE-H 70.16 ± 0.40aII 4.76 ± 0.05a 25.54 ± 0.41b – – 0.81 0.27 CE-H-ex 68.04 ± 0.92a 4.65 ± 0.07a 26.86 ± 0.15a – – 0.82 0.30 CL 41.40 ± 0.35 5.59 ± 0.08 28.59 ± 0.47 1.59 ± 0.01 0.13 ± 0.01 1.62 0.52 CL-H 62.90 ± 1.15a 5.35 ± 0.11a 9.74 ± 0.49a 2.58 ± 0.05a 0.17 ± 0.01a 1.02 0.12 CL-H-ex 55.88 ± 0.77b 4.32 ± 0.10b 11.99 ± 2.47a 2.61 ± 0.04a 0.18 ± 0.01a 0.93 0.16 LL 44.53 ± 0.83 5.78 ± 0.11 30.49 ± 0.14 3.85 ± 0.07 0.21 ± 0.01 1.56 0.51 LL-H 63.76 ± 1.66a 6.05 ± 0.05a 14.10 ± 2.20a 3.41 ± 0.23a 0.08 ± 0.07a 1.14 0.17 LL-H-ex 58.48 ± 0.55b 4.80 ± 0.06b 17.22 ± 1.17a 3.60 ± 0.05a 0.15 ± 0.01a 0.99 0.22 PL 43.72 ± 0.81 6.13 ± 0.36 38.61 ± 0.87 1.62 ± 0.09 0.13 ± 0.08 1.68 0.66 PL-H 63.65 ± 0.93a 6.12 ± 0.26a 15.44 ± 0.37b 2.24 ± 0.04b 0.04 ± 0.02a 1.15 0.18 PL-H-ex 57.10 ± 0.83b 4.97 ± 0.21b 17.15 ± 0.49a 2.41 ± 0.05a 0.05 ± 0.04a 1.05 0.23 PN 49.72 ± 0.53 6.27 ± 0.07 36.20 ± 1.06 1.65 ± 0.01 0.11 ± 0.01 1.51 0.55 PN-H 74.14 ± 2.01a 6.14 ± 0.06a 14.82 ± 0.95a 2.28 ± 0.08a 0.08 ± 0.02 0.99 0.15 PN-H-ex 69.41 ± 0.80b 5.19 ± 0.07b 15.65 ± 0.85b 2.40 ± 0.03b – 0.90 0.17 Note: data are presented as mean ± standard deviation, n = 3 parallel replicates. I – means non-detected; II a and b indicate a significant difference in the bulk elemental composition of hydrochar before and after acetone extraction, and the same letter means no significant difference. CE, CL, LL, PL, and PN denote raw cellulose, corn leaves, lotus leaves, palm leaves, and pine needles; CE-H, CL-H, LL-H, PL-H, and PN-H are the corresponding hydrochar samples; CE-H-ex, CL-H-ex, LL-H-ex, PL-H-ex, and PN-H-ex refer to acetone-extracted hydrochar samples. Based on the relative contents of C, H, and O elements in the extraction products, the H/C atomic ratio and O/C atomic ratio were calculated (Supplementary Fig. S4). Compared with the CE-H extraction product, the H/C atomic ratios of the extraction products from leaf-derived hydrochar increased by 48.80% to 81.86%, while their O/C atomic ratios decreased by 28.98% to 68.48%. Compared with the bulk elemental composition of hydrochar, the H/C atomic ratios of the leaf-derived hydrochar extraction products increased by 13.66%–24.57%, and the O/C atomic ratios decreased by 26.49%–60.72%. These results indicated that the high H/C atom ratio and low O/C atom ratio of the hydrophobic coating were consistent with those of the hydrophobic alkyl carbon. Moreover, the H/C atomic ratio of the LL-H extraction product was the highest, and that of the CL-H extraction product was the lowest. The H/C atomic ratio of the extraction product was significantly positively correlated with the I value of the hydrophobic coating (n = 5, r = 0.884, p = 0.047). It should be noted that the correlation analyses were based on a small sample set (n = 5), making the results sensitive to individual variations. Thus, the observed trends are primarily applicable to the specific leaf-derived hydrochars studied, and extension to other biomass types requires further validation. Nonetheless, the high correlation coefficients and statistically significant p-values, alongside diverse characterization data, demonstrated that the conclusions drawn in this work were valid and reliable.
After removing the hydrophobic coating by acetone extraction, the C and H contents in leaf-derived hydrochar were significantly lower. The H/C atomic ratios of leaf-derived hydrochar were all reduced, with the largest reduction in LL-H-ex (15.5%). The magnitude of the reduction in the H/C atomic ratio was significantly positively correlated with the I value of the hydrophobic coating (n = 5, r = 0.927, p = 0.024). The C–H stretching vibrational peaks (2,800–3,000 cm−1) of methyl and methylene groups were substantially weaker after acetone extraction (Fig. 1c, d). Based on the solid-state 13C-NMR spectral analysis, the alkyl carbon content in leaf-derived hydrochars decreased by 15.27%–23.44% after acetone extraction (Table 3). Combined with the decrease in the H/C atomic ratio, this further indicated that acetone extraction removed a large amount of alkyl carbon. Thus, the composition and properties of the hydrophobic coating were mainly regulated by the fraction of hydrophobic alkyl carbon in the cuticle.
Table 3. Carbon structure of hydrochar before and after acetone extraction determined by solid-state 13 C-NMR spectroscopy
Sample Alkyl C/% O–alkyl C/% Aryl C/% O–aryl C/% Carboxyl C/% Carbonyl C/% Aromaticity/% CE 0.00 100.00 0.00 0.00 0.00 0.00 0.00 CE-H 25.00 12.27 45.00 8.64 2.27 6.82 59.00 CE-H-ex 26.29 12.68 42.25 8.92 2.35 7.51 56.77 CL 10.54 79.33 5.17 0.05 4.91 0.00 5.49 CL-H 45.75 9.48 36.71 2.70 0.47 4.89 41.64 CL-H-ex 35.83 11.90 37.74 4.78 1.89 7.86 47.11 LL 21.63 59.60 6.90 1.79 10.08 0.00 9.66 LL-H 50.83 8.48 32.38 3.14 2.56 2.60 37.45 LL-H-ex 38.91 12.65 33.63 4.52 5.18 5.10 42.52 PL 13.98 66.82 7.99 3.38 7.83 0.00 12.33 PL-H 42.65 13.50 29.27 8.96 2.75 2.87 40.51 PL-H-ex 36.14 15.76 33.84 8.34 2.60 3.31 44.84 PN 12.37 67.25 12.07 3.41 4.83 0.07 16.28 PN-H 43.97 10.18 34.72 4.56 1.57 5.00 42.05 PN-H-ex 36.50 14.14 37.23 5.25 1.70 5.19 45.61 Note: all values originate from single measurements without replicates. Aromaticity (%) = 100 × (Aryl C + O-aryl C)/(Alkyl C + O-alkyl C + Aryl C + O-aryl C). Sample abbreviations are consistent with Table 2. The physicochemical properties of hydrochar were altered by hydrophobic alkyl carbon coatings
-
Our previous work showed that removing a hydrophobic coating significantly increased the SSA and polarity of hydrochar[13]. Here, we further investigated its effect on the physicochemical properties of four kinds of leaf-derived hydrochar (Table 2). The polarity of all leaf-derived hydrochars increased after extraction, as shown by their higher O/C ratios. Thus, the presence of hydrophobic coatings reduced hydrochar polarity, which was consistent with our previous results. Other studies have shown that low H/C and O/C atomic ratios indicated a higher stability of hydrochar[30]. The removal of hydrophobic coating decreased the H/C atomic ratio and increased the O/C atomic ratio. This divergence hindered the understanding of the effect of the hydrophobic coating on hydrochar's stability. Notably, the H/C and O/C ratios of the hydrophobic coating differed markedly from those of the bulk hydrochar, highlighting the heterogeneity of leaf-derived hydrochar. Therefore, assessing the stability of hydrochar solely based on its bulk elemental atom ratio is not reasonable; the hydrophobic coating on its surface must also be taken into account.
It has been reported that the SSA of char also greatly affects its chemical stability[9,31]. After acetone extraction, the SSA of all leaf-derived hydrochars increased due to the removal of a hydrophobic coating that blocked their pores (Fig. 2a). This conclusion was further supported by SEM characterization. As shown in Supplementary Fig. S2, the surface pores of the four leaf-derived hydrochars were covered by the coating before extraction and clearly exposed after acetone treatment. Notably, among the four kinds of leaf-derived hydrochars, CL-H and PL-H had the largest and smallest SSA, respectively. The SSA of CL-H was 123.5% higher than that of PL-H due to the crystalline nature of the hydrophobic coating of PL-H. Crystalline coatings are typically dense and uniform, effectively sealing pores[32,33]. After removing the hydrophobic coating, the SSA of CL-H increased by 70.78%, while that of PL-H increased by 323.8%, significantly reducing the difference in SSA.
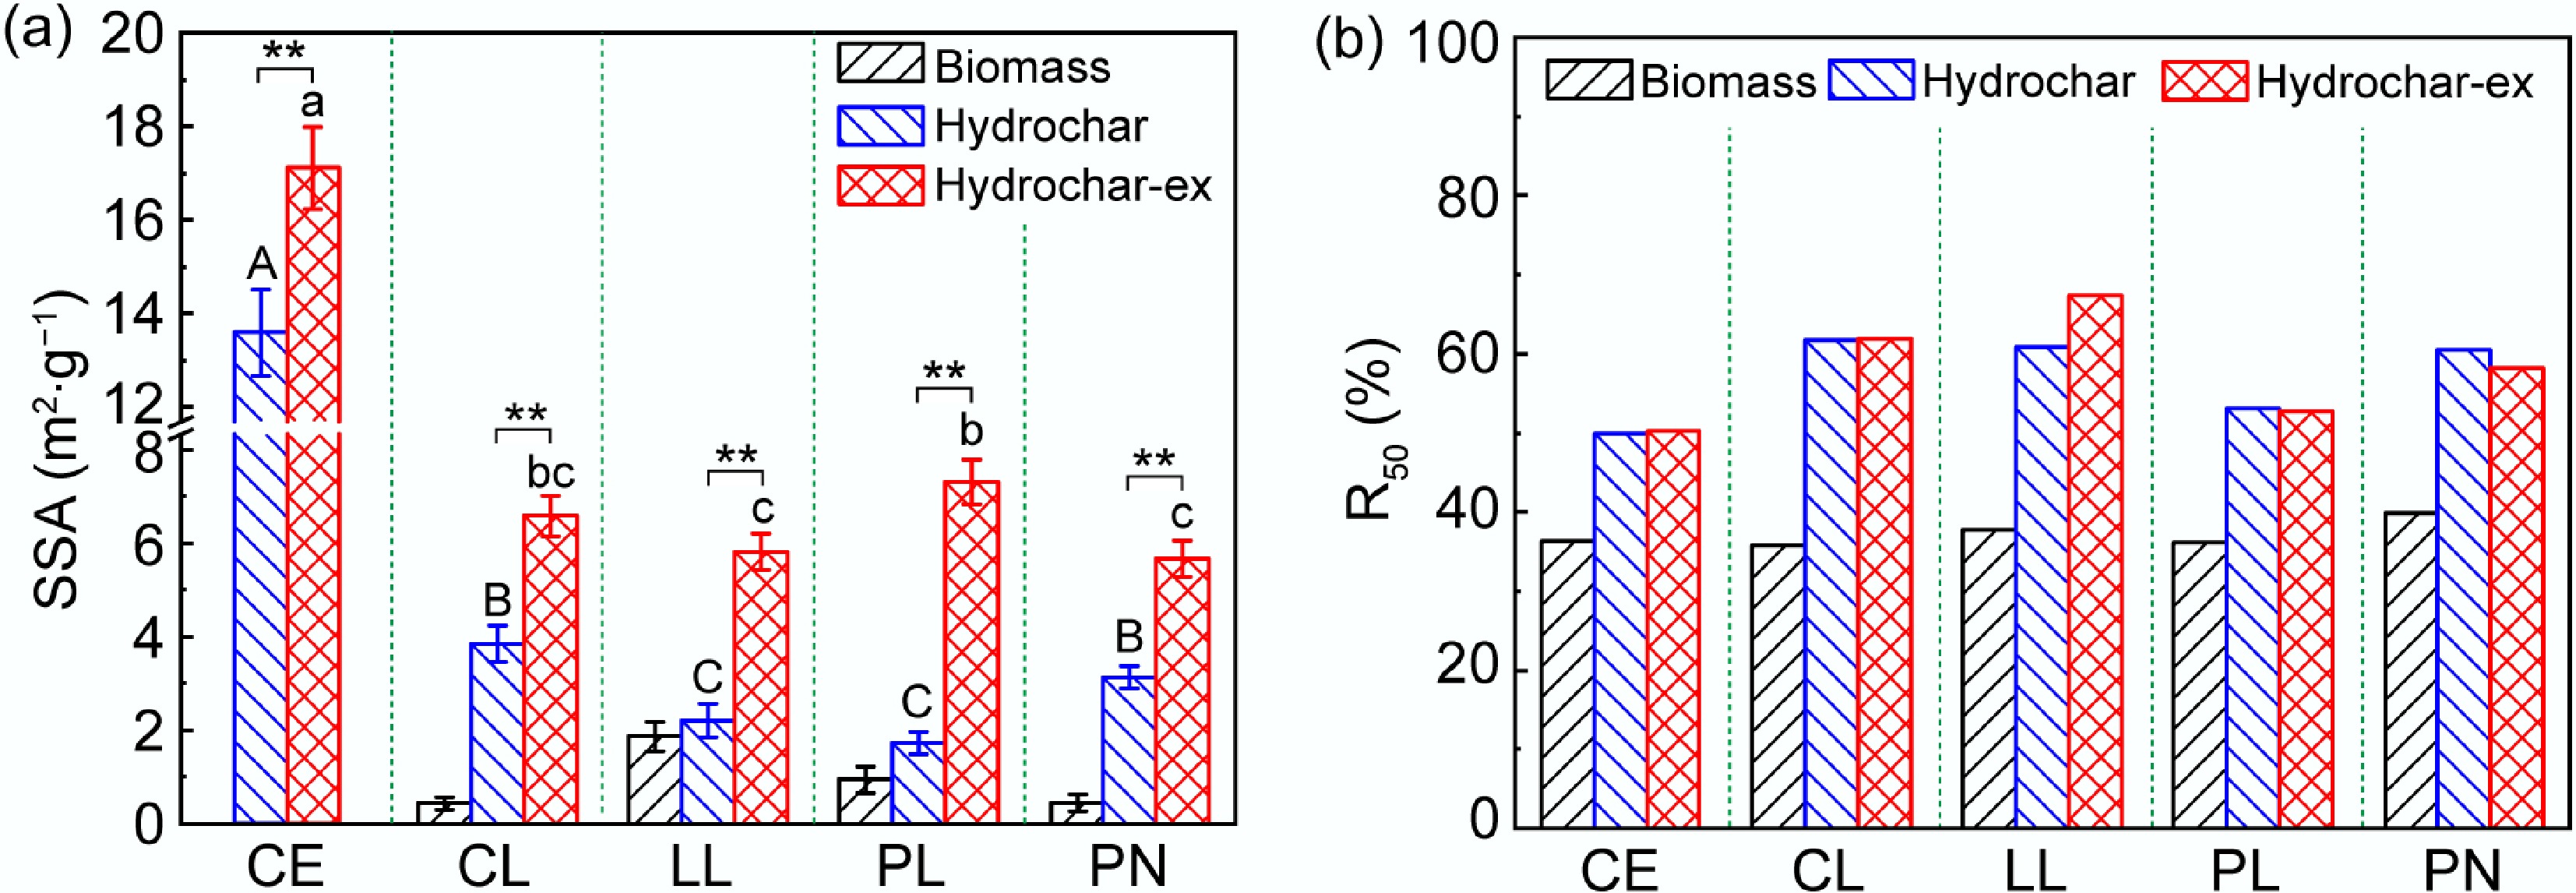
Figure 2.
(a) Specific surface area (SSA) of hydrochar derived from different biomass before and after acetone extraction. (b) Recalcitrance index (R50) of hydrochar before and after acetone extraction. SSA = specific surface area; R50 = recalcitrance index. CE, CL, LL, PL, and PN represent raw cellulose, corn leaves, lotus leaves, palm leaves, and pine needle biomass, respectively; Hydrochar denotes unextracted hydrochar, and Hydrochar-ex denotes acetone-extracted hydrochar. (A)–(C) compare the SSA of different hydrochar samples before extraction, and (a)–(c) represent the comparison of SSA of different hydrochar after extraction. ** represents a significant difference (p < 0.01) in the SSA of hydrochar before and after extraction.
After acetone extraction, the aromatic carbon content of leaf-derived hydrochar increased by 2.82%–15.62%, while its aromaticity rose by 8.49%–13.54% (Table 3). These results indicated an obvious reduction in alkyl carbon content following extraction, confirming that the interior of the hydrochar, previously covered by a hydrophobic coating, contained a higher proportion of aromatic carbon. The leaf-derived hydrochars before extraction all contained high alkyl carbon contents, which is inconsistent with previous literature[34,35]. Hydrochar prepared at higher temperatures usually has a higher content of aromatic carbon. In this study, the highest carbonaceous component of cellulose-derived hydrochar was aromatic carbon. This difference is due to the formation of a hydrophobic coating on the surface of all leaf-derived hydrochars. Before the extraction, LL-H had the highest alkyl carbon content, which was 19.18% higher than the minimum (PL-H). There was a significant positive correlation between the alkyl carbon and the I value of hydrophobic coating (n = 5, r = 0.903, p = 0.036), which confirmed that hydrophobic alkyl carbon of the hydrophobic coating significantly affected properties of leaf-derived hydrochars. Studies have shown that the carbon structure of hydrochar is a key factor affecting its stability[36]. Thus, hydrophobic alkyl carbon coatings changed the properties and structure of hydrochar, which in turn altered its chemical stability.
Hydrophobic coating reduces activation energy and pre-exponential factor without changing hydrochar thermal stability
-
The recalcitrance index (R50) of hydrochar before and after acetone extraction is shown in Fig. 2b. After acetone extraction, there was no significant change in the R50 values of CL-H, PL-H, and PN-H, except for an increase for LL-H, which indicated no significant change in the thermal stability of hydrochar after removing the hydrophobic coating. Thermal decomposition behaviors of hydrochars were analyzed using the Coats–Redfern kinetic model. The kinetic parameters of thermal decomposition are listed in Table 4, while the corresponding TG/DTG curves, fractional conversion α curves, and kinetic fitting plots of typical leaf-derived hydrochars (PL-H) before and after acetone extraction are displayed (Supplementary Fig. S5). Based on the above kinetic results, the E values of leaf-derived hydrochars exhibited a strong negative correlation with the I values of their hydrophobic coatings (n = 5, r = −0.971, p = 0.006). After acetone extraction, E values increased in all samples by 12.8% to 63.6%. Generally, a lower E value indicated a reduced energy barrier, which, in turn, facilitated the thermal decomposition[37].
Table 4. Kinetic parameters for thermal decomposition of hydrochar before and after acetone extraction
Sample Activation energy,
E (J mol−1)Pre-exponential factor, A (min−1) g(α) Coefficient of determination, R2 CE-H 57.51 347.88 (1–α)ln(1–α)+α 0.999 CE-H-ex 57.27 315.06 (1–α)ln(1–α)+α 0.999 CL-H 47.46 13.25 (1–α)ln(1–α)+α 0.992 CL-H-ex 55.83 595.50 [(1–α)−2–1]/2 0.981 LL-H 21.29 0.60 –ln(1–α) 0.987 LL-H-ex 33.43 8.47 [(1–α)−2–1]/2 0.978 PL-H 45.97 44.32 α2 0.999 PL-H-ex 52.28 145.55 α2 0.999 PN-H 43.87 13.71 α2 0.986 PN-H-ex 48.77 23.82 (1–α)ln(1–α)+α 0.994 Sample abbreviations are defined in Table 2. α = fractional conversion; g(α) = integral form of the reaction model. These results demonstrate that hydrophobic coatings reduce the activation energy. During thermal decomposition, alkyl carbons are more reactive than aromatic carbons[38]; thus, reactions dominated by alkyl species are characterized by lower E. Given that hydrophobic coatings were predominantly alkyl-rich, their presence decreases the overall E of the hydrochars. Upon removal of these coatings, the remaining aromatic framework exhibited greater thermal stability[39], increasing the energetic barrier and slowing the reaction.
The A value characterizes the frequency of molecular collisions occurring in the correct orientation for reaction[40]. A values below 109 s−1 signify surface-controlled kinetics, in which the reaction rate is governed by the SSA[41]. All leaf-derived hydrochars were below this threshold. After extraction, the SSA increased, and A rose correspondingly, thereby enhancing surface reactivity. This increase in A values offset the higher E, resulting in no significant change in the overall thermal stability of the hydrochars after the removal of hydrophobic alkyl carbon coatings.
Hydrophobic alkyl carbon coating determines the chemical stability of hydrochar
-
To investigate the effect of hydrophobic alkyl carbon coatings with different properties on the chemical stability of hydrochars, the carbon loss rates of hydrochars oxidized by K2Cr2O7 before and after acetone extraction are shown in Fig. 3a. Before extraction, the carbon loss rates of leaf-derived hydrochars were markedly lower than those of CE-H, indicating that leaf-derived hydrochars exhibited greater chemical stability than CE-H. Principal component analysis (PCA) of the carbon loss rate and aromaticity, SSA, and I value of hydrophobic coating revealed a significant positive correlation between the carbon loss rate and aromaticity (n = 5, r = 0.931, p = 0.021) (Supplementary Fig. S6). This positive trend is primarily governed by the protective performance of the surface hydrophobic coating itself: higher aromaticity in the coating corresponds to poorer barrier properties, thereby accelerating the carbon loss. This intrinsic surface effect, often overlooked in previous studies, became a critical factor here. In contrast, Han et al.[42] reported a significant negative correlation between the carbon loss rate and aromaticity, attributing higher aromaticity to greater chemical stability. This discrepancy highlighted that the role of aromaticity in carbon stability was highly dependent on the specific material system—specifically, whether the surface coating's protective function is taken into account.
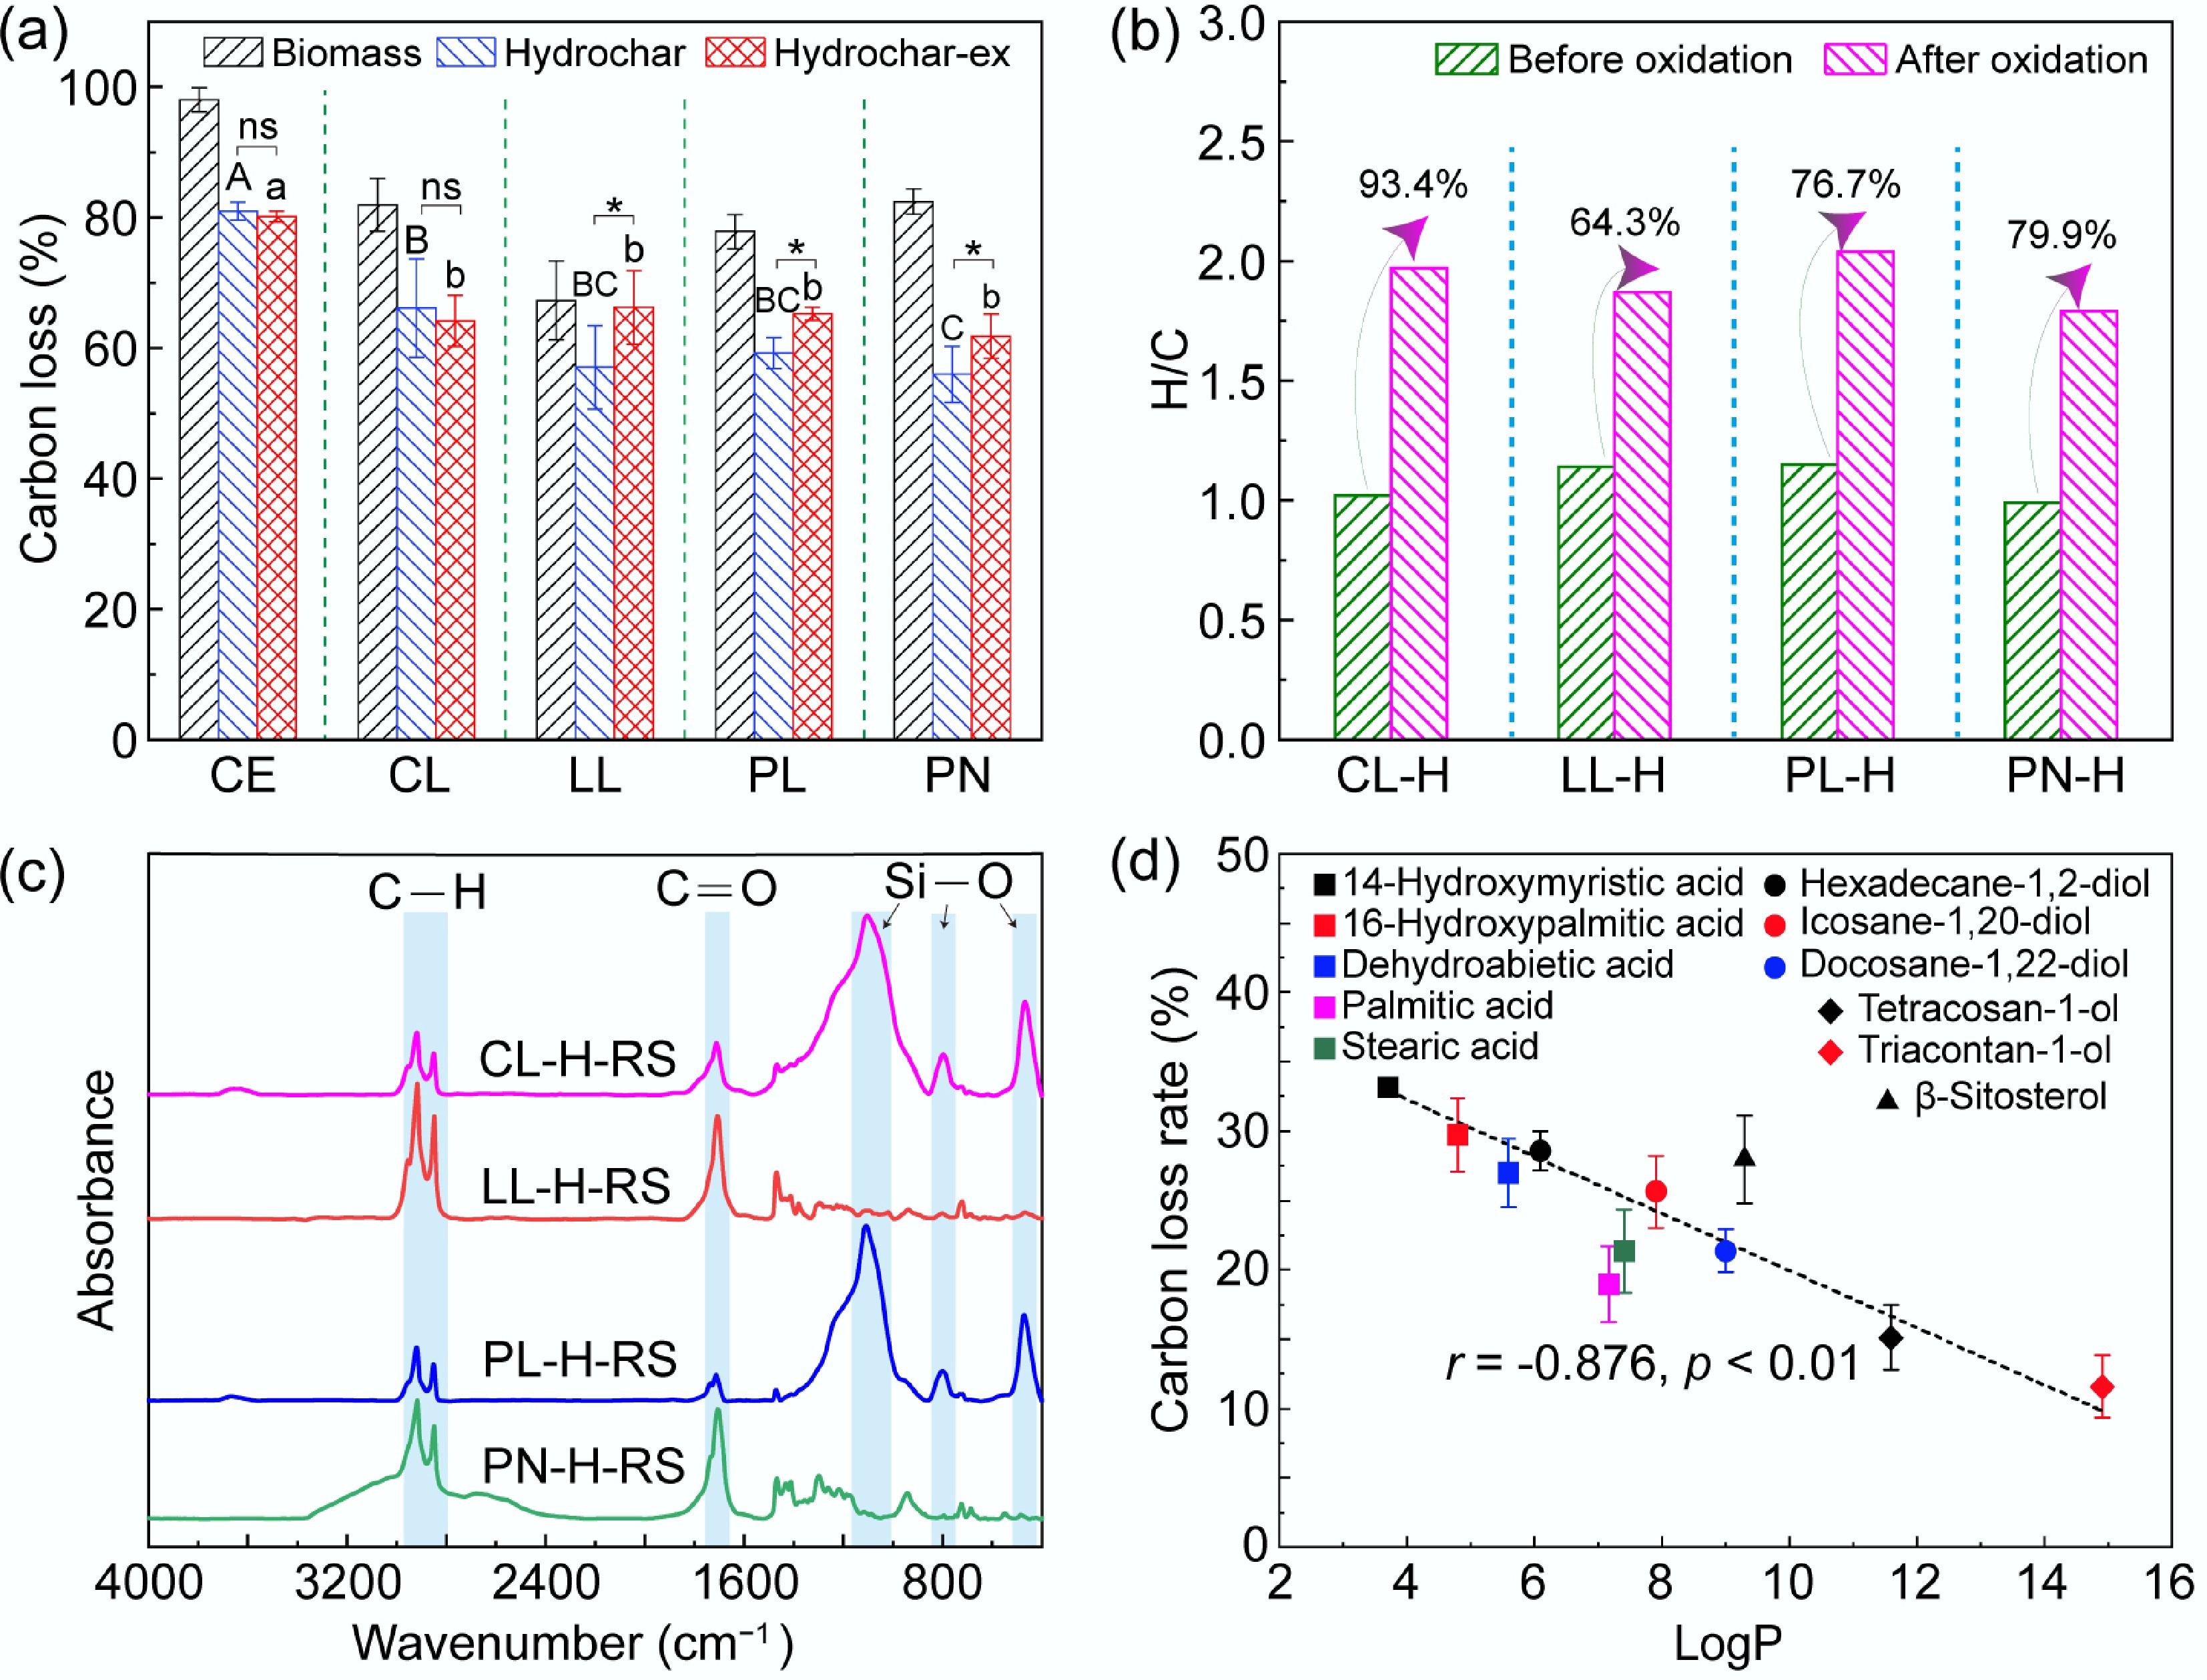
Figure 3.
(a) Carbon loss rate of hydrochar oxidized by K2Cr2O7 before and after acetone extraction. (b) H/C atomic ratio of leaf-derived hydrochar before and after oxidation by K2Cr2O7. (c) FTIR spectra of solid residues obtained from the chemical oxidation of leaf-derived hydrochar. (d) Correlation between LogP values of hydrophobic organics and their carbon loss rate after oxidation by K2Cr2O7. Sample abbreviations CE, CL, LL, PL, and PN are consistent with Fig. 2; hydrochar-related labels CE-H, CL-H, LL-H, PL-H, and PN-H follow the definitions provided in Fig. 1, and the labels Hydrochar and Hydrochar-ex are defined in Fig. 2. CL-H-RS, LL-H-RS, PL-H-RS, and PN-H-RS denote solid residues obtained from chemical oxidation of CL-H, LL-H, PL-H, and PN-H hydrochar, respectively. LogP is the logarithmic value of the octanol-water partition coefficient P. (A)–(C) present a comparison of the carbon loss rates of different hydrochars before extraction, and (a)–(c) present a comparison of carbon loss rates of different hydrochars after extraction. ns indicates no significant difference in the carbon loss rate of hydrochar before and after extraction, and * indicates a significant difference in the carbon loss rate of hydrochar before and after extraction (p < 0.05).
Compared with the hydrochars before oxidation, the H/C atomic ratios of oxidized hydrochars increased by 64.3% to 93.4% (Fig. 3b). Furthermore, the C–H stretching vibration peaks of alkyl carbon (2,850–2,925 cm−1) showed significant enhancement (Fig. 3c). These results indicated a higher content of alkyl carbon in the oxidized hydrochars, confirming that the alkyl carbon in hydrochar possessed a strong resistance to chemical oxidation. To further support this viewpoint, fatty acids, alkanols, and alkanediols were chosen as typical HOCs, and their chemical stability was determined by the K2Cr2O7 oxidation method. The carbon loss rate of HOCs was significantly negatively correlated with the LogP value (n = 11, r = −0.867, p = 0.001) (Fig. 3d), indicating that the greater the LogP value of HOCs, the stronger their chemical stability. Because the I value of the hydrophobic coating was calculated based on the LogP value, a higher hydrophobic intensity implies that the coating had greater stability and provided greater protection. Among the four kinds of leaf-derived hydrochars, the carbon loss rate differed significantly between CL-H and PN-H. The carbon loss rate of PN-H was 15.50% lower than that of CL-H, indicating that the chemical stability of PN-H was higher than that of CL-H. Because the difference in SSA between CL-H and PN-H was not obvious, and their aromaticity was similar, the difference in chemical stability between these two hydrochars was attributed mainly to the hydrophobic coating of PN-H exhibiting a 36.35% higher hydrophobic intensity than that of CL-H.
After acetone extraction, the carbon loss rate of CL-H did not significantly change, whereas those of LL-H, PL-H, and PN-H increased significantly, ranging from 10.13% to 16.01%, indicating a significant decrease in chemical stability. LL-H exhibited the greatest increase in carbon loss rate, as its hydrophobic coating had the highest hydrophobic intensity and provided the greatest protection. Consequently, when the hydrophobic coating was removed, the reduction in chemical stability of LL-H was the most pronounced. It is important to note that while the difference in hydrophobic intensity between the hydrophobic coatings of CL-H and PL-H was minor, the chemical stability of CL-H remained unchanged after acetone extraction, whereas that of PL-H decreased significantly. This discrepancy may be attributed to the greater increase in SSA of PL-H (323.8%) compared with CL-H (70.78%) after the removal of the hydrophobic coating, both relative to their respective pre-extraction values. An increase in SSA made more reactive sites accessible to oxidizing agents, thereby reducing the chemical stability of hydrochar. In comparison, the coating constructed a continuous protective film over hydrochar particles. It blocked surface pores and covered exposed reactive sites, restricting the diffusion of oxidizing agents[9,31]. This effect reduced reactant collision frequency and weakened chemical reactivity, thus enhancing hydrochar stability. Notably, when the four kinds of leaf-derived hydrochars were compared after acetone extraction, no significant difference was found in their carbon loss rates. This suggests that, after the removal of the hydrophobic coating, the chemical stability of hydrochars tended to converge. Therefore, the variations in the chemical stability of hydrochars derived from different biomasses were primarily attributed to the protective effect of the hydrophobic coating.
-
The hydrophobic coating of LL-H exhibited the highest hydrophobic intensity, with its main component being nonacosane-4,10-diol derived from the wax. The main components of the hydrophobic coatings in CL-H, PL-H, and PN-H were palmitic acid or 16-hydroxypalmitic acid, which were degradation products of cutin. A significant positive correlation was observed between the hydrophobic intensity of the hydrophobic coating and the alkyl carbon content in the bulk hydrochar. The hydrophobic alkyl carbon coating reduced the activation energy and pre-exponential factor of thermal decomposition without changing the hydrochar's thermal stability. The protective effect on the hydrochar's chemical stability increased with the hydrophobic intensity of the coating. After losing the barrier effect of the hydrophobic coatings, the carbon loss rate of hydrochar oxidized by K2Cr2O7 increased by 10.13%–16.01%. Therefore, the hydrophobic alkyl carbon coating may strengthen hydrochar stability in soil, which is expected to promote its capacity for soil carbon sequestration.
Not applicable.
-
It accompanies this paper at: https://doi.org/10.48130/ebp-0026-0012.
-
Not applicable.
-
The authors confirm their contributions to the paper as follows: Jianping Fan: conceptualization, methodology, investigation, data curation, writing – original draft, funding acquisition; Fangfang Li: conceptualization, methodology, writing – review & editing, funding acquisition; Qingkong Chen: validation, formal analysis, writing – original draft; Peiwen Zeng: investigation, writing – original draft; Yanlin Li: data curation, visualization, funding acquisition; Wei Chen: resources, funding acquisition; Qiangbin Yang: resources, funding acquisition; Hong Yang: conceptualization, supervision, writing – review & editing. All authors reviewed the results and approved the final version of the manuscript.
-
The datasets generated during and/or analyzed in the current study are available from the corresponding author on reasonable request.
-
The authors declare that they have no conflict of interest.
-
Full list of author information is available at the end of the article.
- The supplementary files can be downloaded from here.
- Copyright: © 2026 by the author(s). Published by Maximum Academic Press, Fayetteville, GA. This article is an open access article distributed under Creative Commons Attribution License (CC BY 4.0), visit https://creativecommons.org/licenses/by/4.0/.
-
About this article
Cite this article
Fan J, Li F, Chen Q, Zeng P, Li Y, et al. 2026. Alkyl carbon in a hydrophobic coating enhances the chemical stability of hydrochar. Environmental and Biogeochemical Processes 2: e016 doi: 10.48130/ebp-0026-0012 

Alkyl carbon in a hydrophobic coating enhances the chemical stability of hydrochar
- Received: 22 April 2026
- Revised: 27 June 2026
- Accepted: 13 July 2026
- Published online: 17 August 2026
Abstract: Hydrochar has great potential in soil remediation, pollution control, and carbon sequestration. The hydrophobic coating formed on the surface of hydrochar may alter its function. For example, it is unclear how the formation and composition of this coating affect hydrochar stability. Here, hydrochar was produced from different plant leaves, and the difference in the composition of the hydrophobic coating and its effect on the thermal and chemical stability of hydrochar were investigated. Results showed that the hydrophobic coating on hydrochar derived from lotus leaves exhibited the greatest hydrophobic intensity, and its main composition was nonacosane-4,10-diol. The main composition of the hydrophobic coating on hydrochar derived from corn leaves, palm leaves, and pine needles was either palmitic acid or 16-hydroxypalmitic acid. The hydrophobic intensity of the coating was positively correlated with the alkyl carbon content of the bulk hydrochar. The removal of the coating did not alter the hydrochar's thermal stability, as this effect was counterbalanced by the concomitant increase in both activation energy and pre-exponential factor during thermal decomposition. Carbon loss of hydrochar oxidized by K2Cr2O7 increased by 10.13%–16.01% after removing the hydrophobic coating. Therefore, the alkyl carbon contained in the hydrophobic coating could improve hydrochar stability in soil and raise its carbon sequestration potential.
-
Key words:
- Hydrochar /
- Hydrophobic alkyl carbon /
- Hydrophobic coating /
- Stability /
- Plant cuticle