


-
Earthquakes, as sudden and highly destructive natural events, have a profound impact on human society. In recent years, frequent seismic activities worldwide have not only caused significant casualties and property damage but have also triggered large-scale population migrations and environmental changes. Especially in the context of accelerating urbanization, the destructive effects of earthquakes on urban infrastructure, economic development, and residents' livelihoods have become more pronounced. As global climate change intensifies, the frequency and intensity of natural disasters, in addition to earthquakes, may further increase, posing higher demands on cities' disaster response capabilities. Simultaneously, globalization and urbanization have led to greater concentrations of the population and economic activities, making cities increasingly vulnerable to natural disasters. Earthquakes not only directly damage urban infrastructure and economic activities, but may also lead to large-scale population migration, thereby exerting profound impacts on the socioeconomic structures of both origin and destination regions[1]. For example, the 2008 Wenchuan Earthquake led to significant population migration, which not only affected the recovery and reconstruction of the disaster-stricken areas, but also had ripple effects on the economy, society, and environment of the surrounding regions[2]. Against this backdrop, examining how natural disasters such as earthquakes shape population migration is essential for understanding their long-term social and urban impacts and for informing evidence-based recovery policies and planning. In the current era of climate change and escalating disaster risks, assessing urban vulnerability, anticipating post-disaster migration, and developing targeted response strategies have become central concerns for both researchers and policymakers. Accordingly, this study investigates the effects of earthquakes on population migration, identifies the key driving mechanisms, and offers theoretical and practical insights to support future disaster-risk management.
-
Regarding the issue of post-earthquake population migration, Demirchyan et al.[3] conducted a study on the survivors of the 1988 Spitak Earthquake in Armenia to explore the factors influencing long-term emigration. The results showed that emigrants were predominantly younger, male, better educated, and more socially active, indicating a phenomenon of selective migration. This selective migration led to the potential loss of human capital and economic stagnation in the affected areas. Additionally, unemployment and loss of housing were identified as key push factors driving migration. Therefore, the authors suggested that improving housing conditions and employment opportunities in disaster-stricken areas could mitigate large-scale emigration and its negative consequences. They also emphasized that, beyond short-term relief, governments should incorporate migration-prevention strategies into the long-term reconstruction and rehabilitation plans for earthquake-affected regions[3]. He et al.[4] studied the changes in population size and urban land area in earthquake-prone regions from 1990 to 2015, and their impact on earthquake-related fatalities. The study found that in areas with a lower urbanization rate, the number of deaths increased, but once the urbanization rate reached 40%–50%, the number of earthquake-related deaths decreased. The study emphasized the need to pay attention to population changes in earthquake-prone areas to better address earthquake risks[4]. Huang et al.[5] investigated residents' willingness to migrate in the Wenchuan Earthquake disaster area, where secondary disasters frequently occurred. The study found that 45.2% of residents were willing to migrate. However, the improvements in living conditions and the optimization of economic conditions brought about by the successful post-disaster reconstruction gave most people greater confidence in the future of the disaster area, leading the majority to choose to stay[5]. Mayer et al. collected data via telephone surveys of residents affected by the 2013 tornadoes in Moore, Oklahoma, and Hattiesburg, Mississippi. Using conditional inference trees, they revealed the importance of factors such as the extent of damage, homeownership before and after the disaster, and housing type in influencing decisions regarding household relocation[6]. Guadagno Lorenzo et al.[7] explored housing changes in two villages in the southern Apennines of Italy caused by population outflows in the latter half of the 20th century and their impact on disaster risks, analyzing how remittances, population decline, and land-use changes influenced disaster risks through housing construction and management, and proposed risk management recommendations for areas experiencing emigration. Shishir Shakya et al. used the 2015 Nepal Earthquake as a quasi-natural experiment and found, through a difference-in-differences approach, that the earthquake significantly reduced the number of male international migrant workers from severely affected areas but had no significant impact on female international migrant workers, indicating that natural disasters significantly affect labor market outcomes in developing countries[8]. Jessie Colbert et al. employed a multi-scale geographically weighted regression (MGWR) approach to study population changes and their driving factors following the Canterbury Earthquake Sequence (CES) in New Zealand, revealing significant spatial heterogeneity in post-earthquake population changes related to socioeconomic, demographic, land-use, and earthquake-related factors, and highlighting the profound impact of government policies on the post-disaster population distribution[9]. Lyn Wei et al. reviewed research on population mobility under the influence of earthquake disasters in China, summarizing progress in the study of emergency evacuation management, psychological and behavioral analysis in disaster contexts, and post-earthquake population distribution, and pointed out that future research should focus on multiple temporal and spatial scales, cascading disaster analysis, and post-disaster infrastructure reconstruction[10].
Post-disaster population migration is primarily influenced by urban economic development, urban reconstruction, and other factors. Regarding urban resilience and vulnerability issues following disasters, Cutter et al. studied social vulnerability in US counties, constructing a social vulnerability index based on socioeconomic and demographic data from 1990, and found that social vulnerability exhibited distinct spatial distribution characteristics, emphasizing that social vulnerability is a multidimensional concept influenced by factors such as personal wealth, age, the built environment's density, single economic dependency, housing conditions, race, ethnicity, occupation, and infrastructure dependency[11]. Thiri[12] studied the relationship between social vulnerability and environmental migration based on the Miyagi Prefecture and municipalities affected by the Great East Japan Earthquake and tsunami. The study revealed that factors such as evacuation, temporary housing, policies and planning, collective relocation, rural lifestyles, and beliefs all contributed to social vulnerability, and these factors were interconnected in influencing the disaster's outcomes[12]. Bronfman et al. conducted an empirical and geographic spatial analysis to study the relationship between community resilience and social vulnerability in Chile. They found that the districts with the highest levels of resilience and the lowest levels of vulnerability were located in the main cities of the country, and emphasized the need to explore the complex relationship between social vulnerability and disaster resilience[13]. Aránguiz et al. studied the reconstruction process in Llico, Chile, following the 2010 tsunami and its impact on earthquake risks, finding that although the reconstruction process improved material conditions, the neglect of social cohesion and community organization led to the creation of new risk zones, highlighting the importance of incorporating social capital and social resilience in disaster reconstruction[14]. Zhao et al. conducted an empirical study on rural residents' choice of resettlement mode following three major earthquakes in Sichuan, finding that factors such as length of residence, housing construction time, access to employment and public services, and previous resettlement experiences significantly influenced their decisions to resettle in situ or relocate, providing empirical evidence for human-centered resettlement planning in post-disaster rural areas[15].
In previous studies, the gravity model has been widely used in research related to population mobility. Song et al. used one-year nationwide location-based service (LBS) data and applied five human mobility models, including the gravity model, to analyze population movement patterns in China across different dates. The fitting results of the gravity model indicated that the trade-off between the destination's attractiveness and the cost of travel distance varied by date[16]. Ton et al. used US Internal Revenue Service (IRS) tax data and applied multiple forms of the gravity model to analyze the impact of natural disasters on inter-county migration in the United States. The results show that disaster-affected counties experienced significant increases in emigration, and that during floods and severe storms, people tended to relocate to nearby counties[17]. Goswami et al. applied a gravity model to analyze the main factors influencing international tourist arrivals in Australia, incorporating variables such as gross domestic product (GDP), distance, population size, migration ties, and cultural similarity. The results show that GDP, migration ties, and cultural similarity have significant positive effects on tourist inflows, wheres the impacts of distance and cost of living are relatively weak[18]. Zhang et al.[19] used data from the 2017 China Migrants' Dynamic Survey and an extended gravity model combined with least absolute shrinkage and selection operator (LASSO)-penalized Poisson regression to analyze inter-provincial migration patterns and driving factors across different age groups. The study found significant heterogeneity among age groups: the working-age population mainly migrated short distances from densely populated provinces to economically developed areas, whereas the elderly predominantly moved from northern regions to Beijing and from southern regions to Shanghai. Regarding the influencing factors, economic opportunities drove migration across all age groups, but had a stronger effect on the working-age population, whereas the elderly prioritized environmental comfort at their destinations and were less constrained by distance[19]. Brakman Steven et al. used the gravity model to analyze the impact of demographic changes on global trade patterns in the 21st century, concluding that as global population aging intensifies, the global trade dominance of North America and Europe will gradually be replaced by South Asia and sub-Saharan Africa, with China's trade share peaking around 2060 through demographic drag before declining significantly[20].
To adapt the gravity model to different research contexts, some scholars have proposed combining other theories with the traditional gravity model and modifying the model to improve its performance. Wang revised the constrained gravity model, proposing three modified models with standardized migration rates as the dependent variable: origin-constrained, destination-constrained, and origin–destination-constrained models, and used the Newton–Raphson method for parameter estimation, overcoming the limitations of the traditional model where the dependent variable was influenced by the administrative region's size[21]. Li et al. proposed an improved population migration gravity model based on system dynamics and push–pull theory, incorporating factors such as expected income, employment opportunities, transportation resistance, and housing prices, and empirically tested the model using Suzhou Industrial Park and Shenzhen as case studies. The results showed that lower transportation resistance, higher expected income ratios, and smaller increases in housing prices led to higher population inflows[22]. Wang et al. proposed an improved gravity model by considering the relationship between urban industrial structures, enhancing the traditional gravity model's performance in predicting inter-city population migration patterns. The analysis showed that the improved model outperformed the baseline model in predicting high-intensity and long-distance migration flows, particularly in eastern China, by introducing characteristics of the urban industrial structure into the gravity model, thereby broadening existing research and deepening our understanding of the relationship between population migration and distance[23]. Yu et al. proposed an inverse gravity model using genetic algorithms to reconstruct complex international migration network interaction patterns with high precision, finding that node attractiveness was highly correlated with socioeconomic factors and network metrics, and that the calculated node locations outperformed geometric centers in reflecting migration patterns related to the economy and population[24]. Coimbra Vieira Carolina et al. used Facebook data to construct a proxy indicator for cultural similarity based on users' interests in food and beverages, incorporating it into the traditional gravity model to predict international migration flows. The results showed that the cultural similarity indicator based on food and beverage interests significantly improved the model's predictive power, with its predictive efficacy similar to classical variables such as shared language and history, and captured dynamic changes in cultural dimensions, providing new perspectives for understanding the determinants of migration[25]. Baldwin Andrew et al. analyzed the application of the gravity model in quantifying "climate migration", exploring the statistical logic and power restructuring mechanisms behind it, revealing an emerging power topology based on intuition and inference that calculates and optimizes population flows to address uncertainties brought by climate change. The conclusions emphasized the gravity model's role as a political tool in shaping climate migration issues and governance strategies[26].
Existing studies offer substantial theoretical and empirical insights into post-earthquake migration, urban resilience, vulnerability, and migration drivers, providing valuable references for post-disaster reconstruction and population management. However, a systematic integration of these dimensions, particularly the mechanisms connecting social vulnerability with urban development, remains limited. To address this gap, this study constructed a social vulnerability index (SVI) to quantify pre-earthquake urban vulnerability and applied a modified gravity model incorporating urban development indicators to analyze post-earthquake population flows. This approach provides an innovative quantitative framework for evaluating post-disaster recovery and strengthening urban resilience.
-
In the mid-19th century, the theory of universal gravitation from natural sciences was applied to the study of socioeconomic spatial flow phenomena, leading to the development of the social gravity model. Because of the importance of population migration and the availability of related statistical data, this field became a focus of gravity model-based research. The gravity model is one of the earliest models proposed for migration, based on the premise that most migrations occur over short distances, and as the distance between origin and destination increases, migration numbers decrease rapidly because of various barriers, with each migration flow generating a reverse flow[27]. The gravity model's formula is:
$ {M_{ij}} = K\dfrac{{{P_i}{P_j}}}{{{D_{ij}}}}, $ (1) where, Mij is the total population migration from region i to region j, K is a constant, Pi and Pj are the population sizes of regions i and j, and Dij is the distance between regions i and j. This model is an unconstrained gravity model, as it does not satisfy either of the following conservation constraints:
$ \sum\limits_j {{q_{ij}}} = \alpha {P_i}\sum\limits_j {{P_j}d_{ij}^{ - 2}} = {O_i} $ (2) $ \sum\limits_i {{q_{ij}}} = \alpha {P_j}\sum\limits_i {{P_i}d_{ij}^{ - 2}} = {D_j} $ (3) Because it mimics Newton's law of universal gravitation in a highly simplified manner, the traditional gravity model faces several limitations in practical applications. First, measuring transport-related resistance solely by spatial distance overlooks travelers' time costs, reducing the model's ability to capture variations in migration flows across regions. Second, using the total population as a proxy for the scale of migration imposes no realistic constraints on migration capacity, resulting in conceptual inconsistencies; standardized migration rates provide a more appropriate measure. Finally, the model excludes key economic determinants of migration, such as regional development levels and income, which should be incorporated to improve the explanatory power.
The modified gravity model
-
Integrating the SVI into the gravity model effectively addresses the limitations of the traditional formulation and substantially enhances its explanatory and predictive performance. First, the SVI captures a region's socioeconomic structure and residents' adaptive capacity, offering a more accurate representation of the time costs and actual resistance faced by migrants. Second, by assessing vulnerability levels in both the origin and destination, the index helps constrain feasible migration flows and yields more realistic migration rates, thereby avoiding the logical inconsistencies inherent in population-based measures. Moreover, the SVI indirectly incorporates key economic dimensions, such as income, employment, and educational conditions, which strongly influence migration-related decisions. By embedding these socioeconomic attributes, the improved model more comprehensively reflects the combined effects of economic and social factors on migration, resulting in enhanced predictive accuracy.
Furthermore, the modified model replaces the population variable in the traditional gravity model with city-level GDP. As a key measure of regional economic scale and vitality, GDP better reflects employment opportunities, income, and development potential, which are major drivers of migration. In contrast, relying on population alone cannot capture economic attractiveness, limiting the explanatory power. GDP also highlights inter-regional disparities: lower GDP per capita and larger populations in the origin areas act as push factors, whereas higher GDP and larger populations in destination areas serve as pull factors. Incorporating these differences allows the model to more accurately predict both the direction and magnitude of population flows.
Therefore, this study modifies the gravity model by incorporating the SVI and replacing the population indicator with the GDP of the origin and destination cities. The modified model is as follows:
$ {M_{ij}} = k\dfrac{{GDP_i^\alpha GDP_j^\beta SVI_i^\gamma }}{{d_{ij}^b}} $ (4) where, GDPi and GDPj are the GDP of regions i and j; SVIi is the social vulnerability index score of the origin region; and k, α, β, γ, and b are parameters to be estimated. The next step is to calculate the SVI.
-
Drawing on Cutter's research, factors such as population size, age structure, gender composition, urban–rural population distribution, and levels of urban economic and educational development are recognized as key determinants of population migration and differences in social resilience following disaster events[11]. Accordingly, when collecting data from statistical yearbooks, this study primarily focused on indicators related to demographic characteristics, economic development, and social resources. The data for this chapter are sourced from the Statistical Yearbooks for 2005−2010, primarily including core indicators such as population size, age structure, gender composition, urban–rural population distribution, and urban economic and educational development. Given the focus on analyzing the dynamic changes in urban social vulnerability indices before and after the Wenchuan Earthquake of 2008, the study period is limited to 2005–2010 to ensure the data's continuity and relevance to the research question.
The data contain no missing values. To facilitate subsequent calculations, all indicators except for the year are standardized. Moreover, we apply a year-by-year normalization procedure within each region. Specifically, for each year, all variables are standardized within their respective regional scope to eliminate inter-annual and intra-regional differences in scale, ensuring that the subsequent principal component analysis (PCA) extracts the structural characteristics of social vulnerability on a consistent basis across both years and regions. To explore linear relationships among indicators, a heatmap is plotted as shown in Fig. 1.
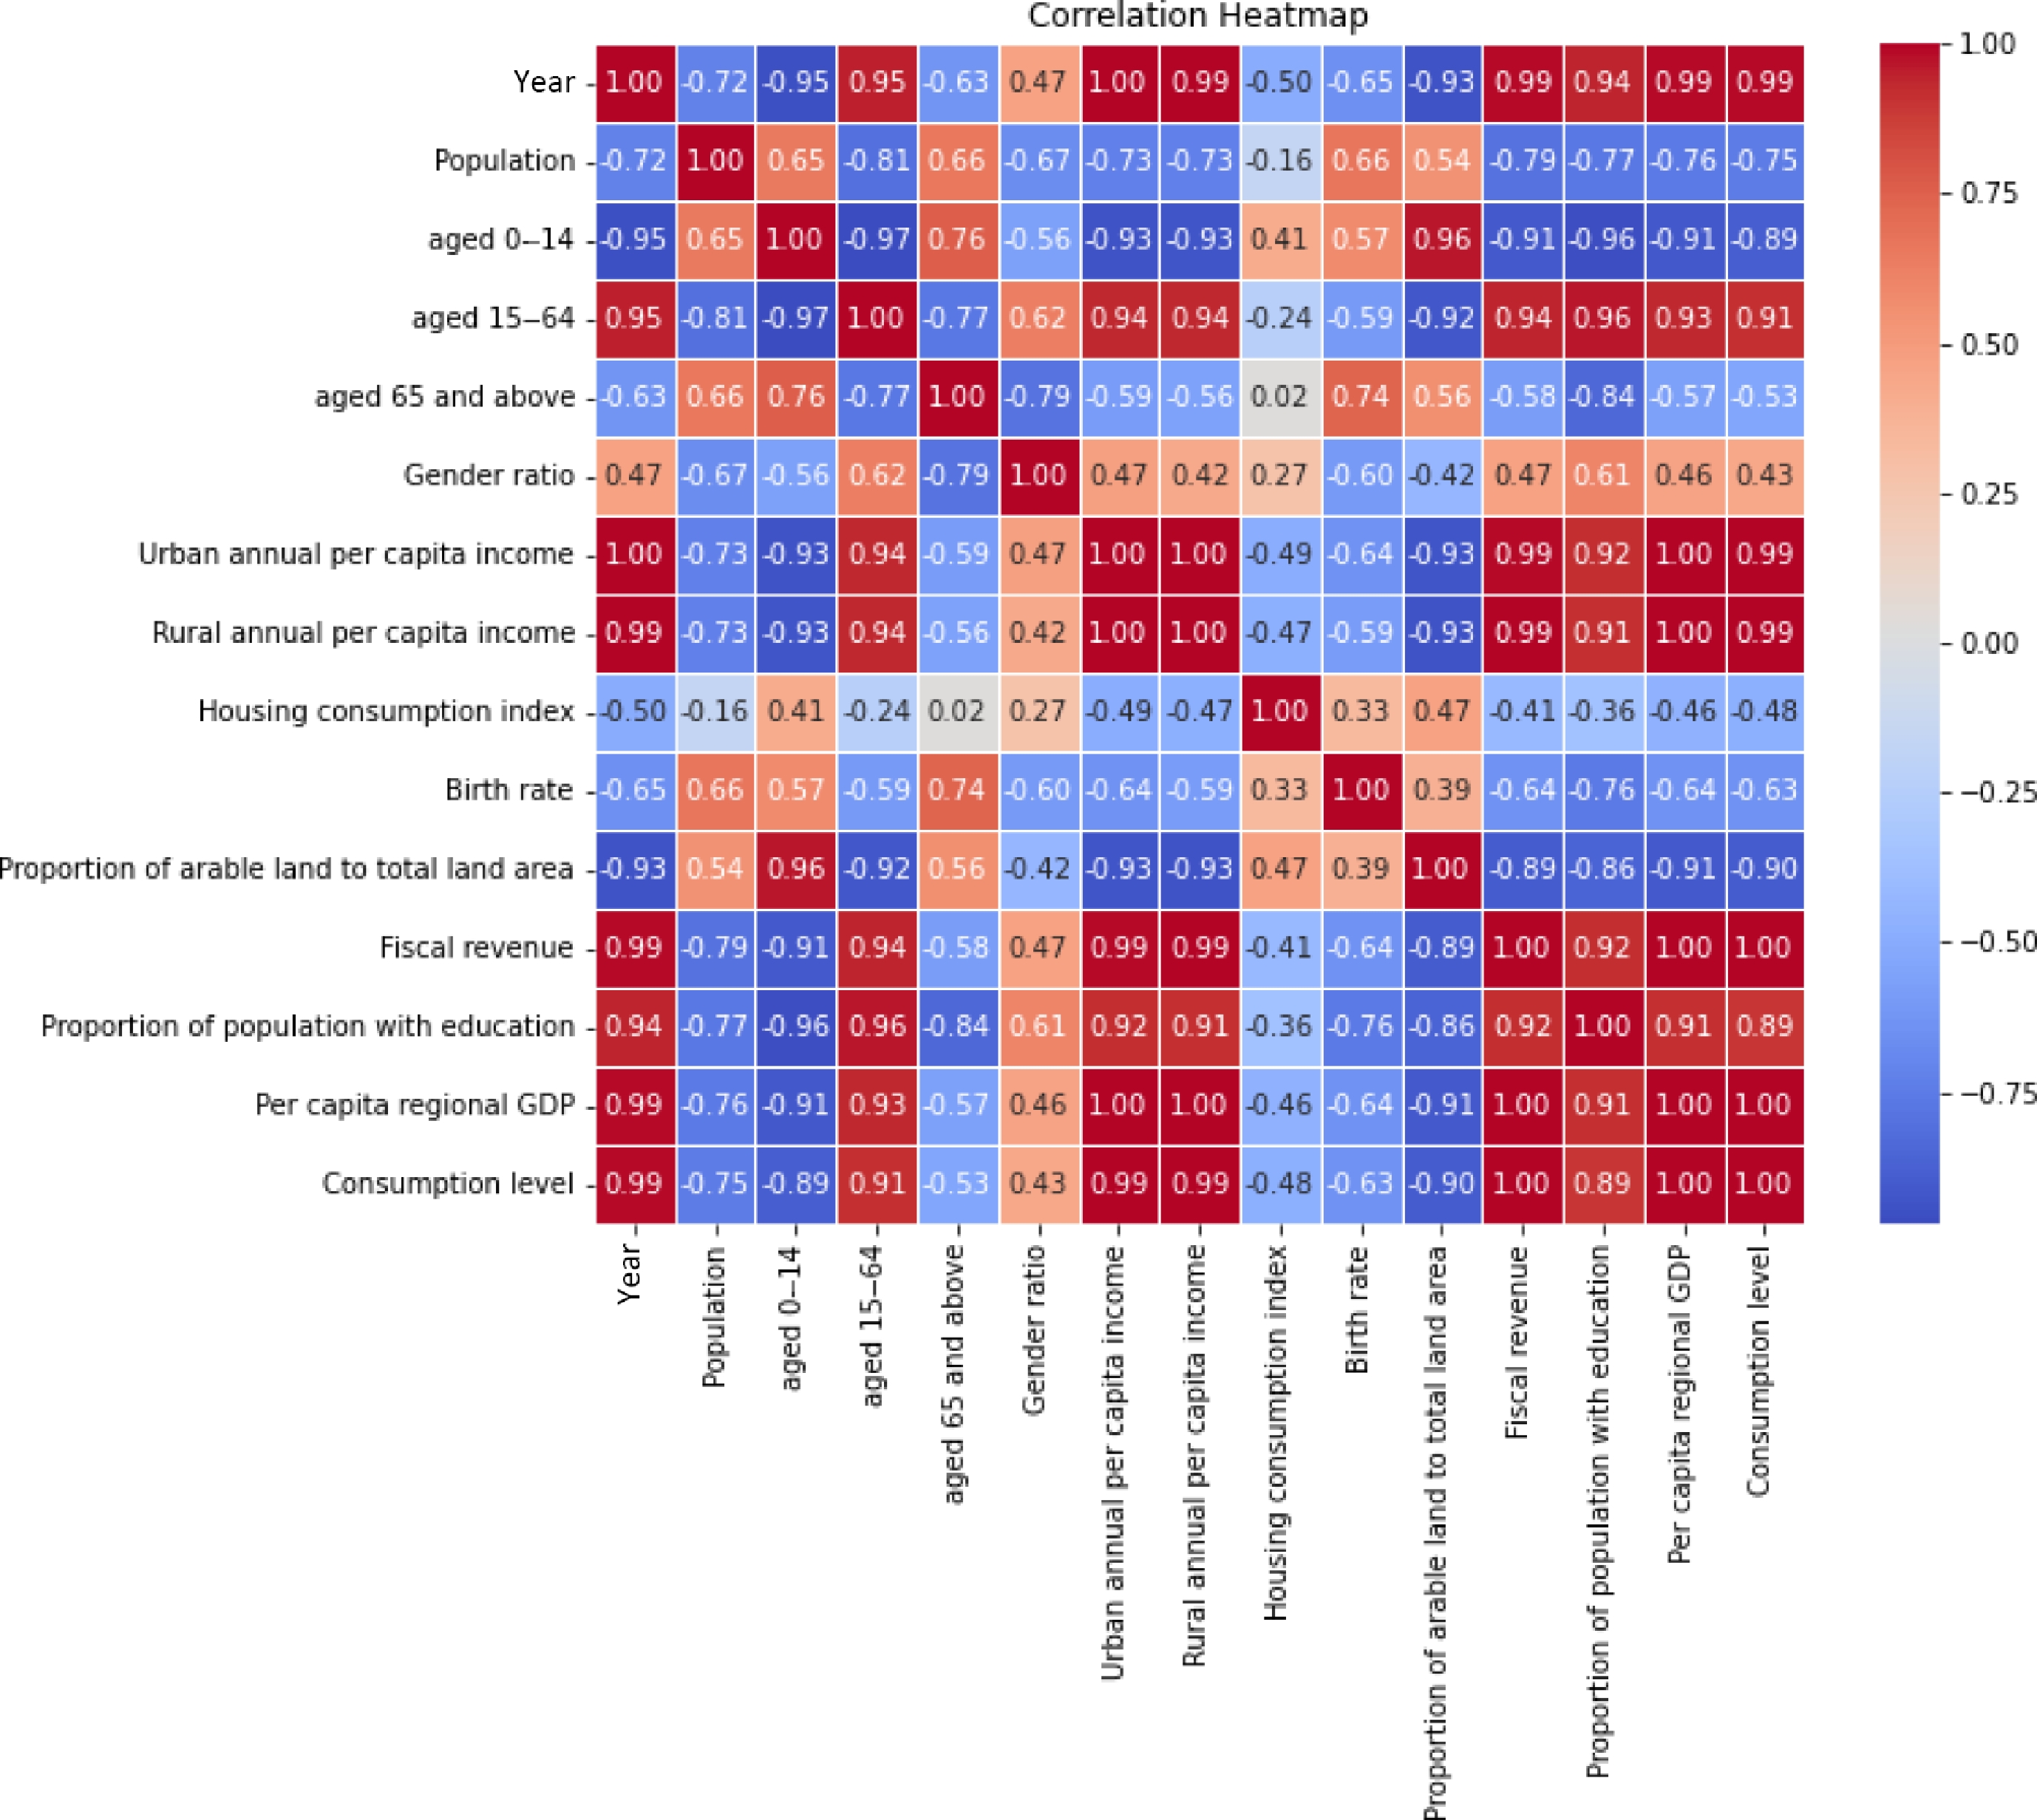
Figure 1.
Heat map of correlations between indicators.
The heatmap in Fig. 1 shows the linear correlations between multiple socioeconomic indicators, with different colors and numerical values indicating the strength and direction of the correlations. Red represents positive correlations, blue represents negative correlations, and darker colors indicate stronger correlations. The correlation coefficient ranges from −1 to 1, with positive values indicating positive correlations and negative values indicating negative correlations.
The heatmap reveals strong positive correlations between some indicators. For example, urban and rural annual per capita incomes are nearly perfectly correlated, indicating synchronized growth in urban and rural incomes, likely driven by overall economic development. GDP per capita and consumption levels are also highly correlated, approaching 1, suggesting that increased economic output significantly enhances the residents' consumption capacity. Additionally, the positive correlation between the proportion of the educated population and government fiscal revenue indicates that higher education levels are closely linked to economic development, possibly because education improves labor productivity, thereby increasing government tax revenues.
Additionally, some significant negative correlations can be observed. For example, the proportion of the population aged 0−14 shows a strong negative correlation with the proportion of the population aged 15−64, reflecting the trend that when the working-age population is relatively high, the proportion of young people is often lower. The negative correlation between the proportion of agricultural land and per capita regional GDP may indicate that regions that are primarily dependent on agriculture tend to have lower economic output. Furthermore, the negative correlation between years and birth rate suggests that birth rates have gradually declined over time, which may be related to socioeconomic development, urbanization, and population policies. Moreover, some indicators exhibit weaker correlations. For instance, the gender ratio has low correlations with most other indicators, possibly indicating that changes in the gender ratio are influenced more by independent factors and are less associated with economic or demographic variables. Similarly, the housing consumption index shows no significant correlation with most other indicators, which may suggest that changes in housing consumption are influenced by more complex market and policy factors.
Calculation of the SVI
-
Referring to Cutter's indicator calculation method, the dimensionality of all indicators was reduced. In this study, PCA was used to reduce dimensionality alongside the Kaiser normalization varimax rotation method. The rotated component matrix is shown in Table 1.
Table 1. Rotated component matrix.
Feature PC1 PC2 Population −0.419 −0.798 Population aged 0−14 −0.826 −0.492 Population aged 15−64 0.762 0.614 Population aged 64 and above −0.331 −0.832 Gender ratio 0.103 0.916 Urban per capita annual income 0.910 0.402 Rural per capita annual income 0.917 0.373 Housing consumption index compared with the
previous year−0.760 0.443 Birth rate −0.451 −0.608 Government fiscal revenue 0.880 0.438 Population education ratio 0.767 0.609 GDP per capita 0.900 0.407 Consumption level 0.907 0.377 Agricultural land as a percentage of total land area −0.887 −0.305 According to Table 1, after performing PCA and Kaiser-normalized varimax rotation, two principal components were extracted, revealing the underlying structural patterns in the data. By analyzing the loadings of these components, we can assign specific names to them for better interpretation of their socioeconomic significance.
Principal Component (PC) 1 mainly reflects factors related to economic development. Its variables with strong positive loads include annual per capita income in urban areas, government fiscal revenue, and per capita regional GDP, which are directly related to the economic level of a region. In addition, variables with large negative loads in PC1, such as the proportion of cultivated land to total land area and birth rate, indicate that economically developed regions are usually associated with a lower proportion of agriculture and a lower birth rate. Therefore, PC1 can be named the "economic development level", which represents the degree of regional economic modernization and industrialization.
PC2 mainly reveals changes in the population structure, especially social characteristics such as the population's age distribution and gender ratio. Variables with strong positive loads in this component include the population aged 0−14, the population aged 64 and above, and the gender ratio, which reflect issues such as rejuvenation and aging of the population and gender imbalance. Variables with large negative loads in PC2, such as the proportion of the aging population, indicate that changes in population structure will bring certain challenges to society. Therefore, PC2 can be named "population structure changes", which reflects the impact of changes in population age levels and gender ratio on the social structure.
PC1 explains 75.42% of the variance, making it the most significant component, whereas PC2 explains 13.21% of the variance. Together, they explain 88.63% of the variance.
Using the derived principal component calculation formulas, we computed the scores for each year, as shown in Table 2.
Table 2. Principal component scores for each year.
Year PC1 score PC2 score 2005 −12.520 −10.386 2006 −6.203 −1.458 2007 −2.0747 −0.175 2008 2.503 2.436 2009 6.644 1.121 2010 11.650 8.464 Table 2 shows significant changes in economic development levels and demographic structures between 2005 and 2010. From 2005 to 2006, PC1's values are negative, indicating lower economic development. However, after 2008, PC1 turns positive and reaches its peak in 2010 (11.650), suggesting economic recovery and growth after the disaster. Similarly, PC2's values rise from −10.386 in 2005 to 8.464 in 2010, reflecting notable demographic adjustments after then disaster. The 2008 Wenchuan Earthquake was a pivotal event, impacting both economic development and the population's mobility. However, the data indicate a rapid economic recovery, with continuous population adjustments, reflecting society's resilience and adaptation after the disaster.
Based on the two PCs obtained, the formula for the SVI was constructed by using an additive model as follows:
$ SVI=0.7542\times PC1+0.1321\times PC2 $ (5) where, SVI is the social vulnerability score, and the contributions (weights) of PC1 and PC2 are the explained variances of each principal component. By inputting the data, the SVI scores for 2005–2010 are obtained, as shown in Table 3.
Table 3. SVI scores by year.
Year SVI score 2005 −10.815 2006 −4.871 2007 −1.588 2008 2.209 2009 5.159 2010 9.905 Table 3 shows the SVI scores from 2005 to 2010, in which the level of economic development has a greater impact on SVI. According to the data, the SVI was negative from 2005 to 2007, and the lowest point occurred in 2005, with an SVI value of −10.815, indicating that social vulnerability was low and the economic level was weak but the population structure was relatively stable. However, after 2008, the SVI turned from negative to positive and continued to rise, reaching a maximum value of 9.905 in 2010, reflecting the rising trend of social vulnerability after the Wenchuan Earthquake. This change may be related to the post-earthquake economic recovery, increased population mobility, and accelerated urbanization, indicating that although the economy had gradually grown after the earthquake, social adaptation still faced challenges. Overall, the Wenchuan Earthquake is a key node in the change in SVI. Social vulnerability after the earthquake did not decrease immediately, but it continued to rise with economic development and population changes, indicating that even when the economy recovers, society still needs time to adapt to the new structural changes.
Determination of the model's parameters
-
After standardizing the abovementioned indicators, the data were reorganized to match origin–destination migration pairs. The parameters of the modified gravity model were then estimated using the ordinary least squares (OLS) method, followed by significance testing, residual analysis, and visualization to verify the robustness and explanatory power of the model. The resulting model is as follows:
$ \begin{split} &\rm{Floating\ population} \\ & =1.331\times 10^{-6}\times \frac{GDP_i^{-0.1033}\times GDP_j^{1.159}\times SVI_i^{0.002228}}{D_{ij}^{0.01489}} \end{split} $ (6) The GDP of the origin region has a negative impact on population migration, meaning that the larger the economic scale of the origin, the fewer people emigrate. In contrast, the GDP of the destination region has a positive impact, indicating that the larger the economic scale of the destination, the more people migrate in; moreover, the p-values of parameter GDPi, GDPj are all less than 0.05, indicating that GDPi, GDPj has a significant impact on population mobility. However, the SVI of the origin region and migration distance do not have a significant impact on migration volume. This is because the study focuses on migration within Sichuan Province, where migration distances are relatively short, making their effect on the choice of origin region negligible. The insignificant effect of the SVI can be mainly attributed to the study's temporal scope, which spans the period before and after the Wenchuan Earthquake. During this time, the most critical factor influencing the choice of migration destinations was the extent of the disaster's impact. Furthermore, it can be observed that more developed cities (e.g., Chengdu) tended to have higher SVIs. This may have been caused by the larger populations in these cities, leading to their urban carrying capacities being closer to their thresholds.
-
The data used in this section were sourced from the China Earthquake Administration, which collected information on earthquakes of magnitude 5.0 and above that occurred in China and the surrounding regions from 2011 to 2023. The aim was to identify the areas that are the most vulnerable to earthquake events on the basis of the collected data. In total, 403 earthquake monitoring records were analyzed, with indicators including magnitude, time, latitude, longitude, depth, and the city where the earthquake occurred. The world map in ArcGIS was used as the canvas, with the map of China imported. Python programming was then used to generate an interactive web-based visualization of earthquake timelines, as shown in Fig. 2.
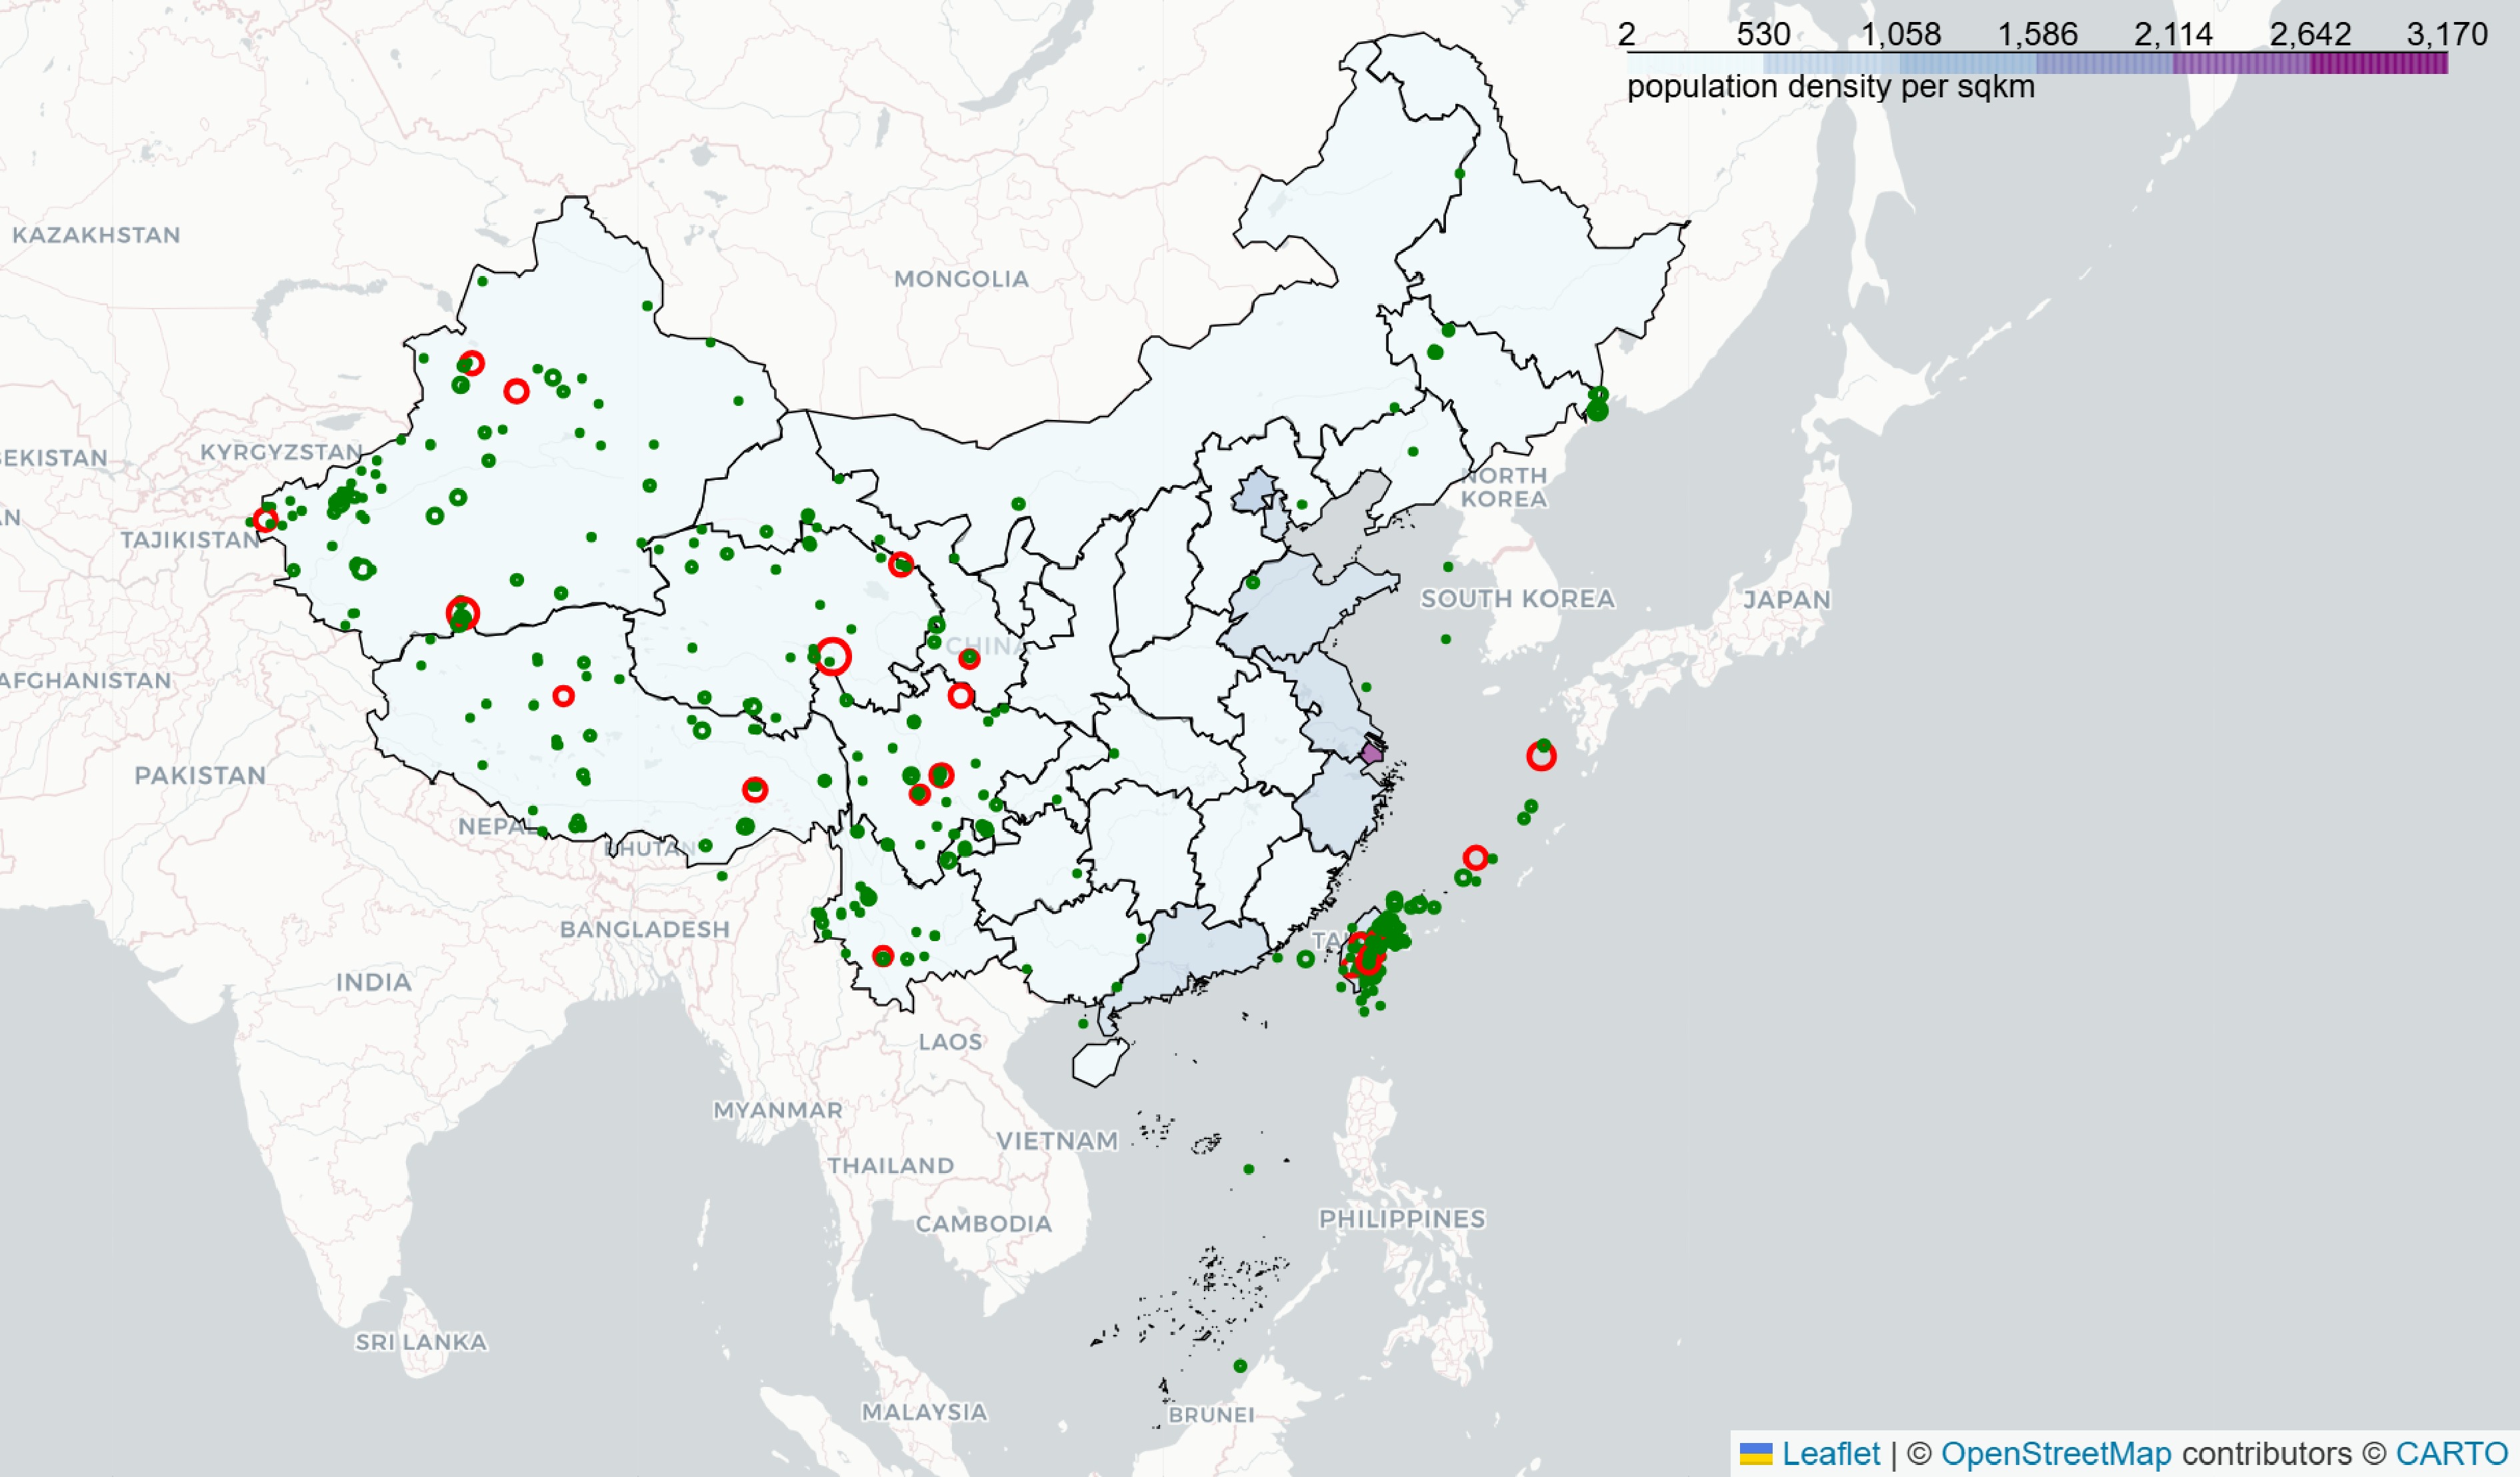
Figure 2.
Visualization of earthquake events from 2011 to 2023.
Figure 2 illustrates the distribution of seismic events in China and its surrounding regions, incorporating population density information to visually represent the spatial distribution of earthquake activity and its potential impact. In the top right corner of the map, a population density label is provided for each square kilometer, with the background color of the map representing the population density. The darker the color, the higher the population density, with densely populated areas located along the eastern coastal regions (e.g., the Yangtze River Delta, Pearl River Delta, Beijing–Tianjin–Hebei) and sparsely populated areas in the western and northern regions (e.g., Xinjiang, Tibet, and Inner Mongolia).
The green and red circles on the map denote earthquake events of different magnitudes. Earthquakes with a magnitude greater than 6.5 are represented by red circles; those with a magnitude of 6.5 or less are represented by green circles. The size of the circles is proportional to the magnitude of the earthquake: the larger the circle, the stronger the earthquake. Geographically, the southwestern region (including Sichuan, Yunnan, and Tibet) is one of the most seismically active areas in China, with frequent and sometimes high-magnitude earthquakes. The western regions (such as Xinjiang and Qinghai) also experience a significant number of seismic events, some of which are of considerable magnitude, indicating substantial tectonic activity. The southeastern coastal areas (including Taiwan, Fujian, and Guangdong) are also earthquake-prone, particularly Taiwan, which exhibits very frequent seismic activity, indicating a higher earthquake risk. In contrast, the densely populated eastern regions (such as Beijing–Tianjin–Hebei and the Yangtze River Delta) experience fewer earthquakes but because of their high level of urbanization, any seismic event in these areas could result in significant consequences.
This indicates that even if highly destructive earthquakes are rare, moderate earthquakes make up a significant part of seismic activity and can still cause substantial damage to buildings and infrastructure, and pose a threat to public safety, especially in densely populated areas. Therefore, studying the impact of seismic disasters on populations is crucial, as it can help governments and the relevant departments make informed decisions in planning post-earthquake urban recovery.
Among all the seismic events listed, the Wenchuan Earthquake stands as one of the most severe earthquakes in China in recent decades. It caused immense loss of life and property and resulted in the displacement of millions of people. This disaster forced large numbers of people to leave their original homes and migrate to less affected areas nearby or economically prosperous cities, exemplifying the phenomenon of post-earthquake population migration. The scale of migration following the Wenchuan Earthquake was enormous, involving millions of affected individuals. Analyzing this event allows for the study of various migration patterns, such as short-term emergency migration, long-term economic migration, and government-led resettlement initiatives. Furthermore, it offers an opportunity to explore the migration paths of different social groups after the earthquake, as well as the adaptation challenges they face upon relocating to new areas.
The mass population movement after the earthquake not only affected the social structure of the affected regions but also had a profound impact on the economy, culture, and infrastructure of the receiving areas. For instance, some displaced individuals permanently migrated to large cities such as Chengdu and Chongqing, contributing to labor mobility and urban expansion, whereas others who remained in the affected areas helped drive the reconstruction process. The study of the Wenchuan Earthquake provides an opportunity to examine how population migration influences changes in urban–rural structures, community restructuring, labor markets, and social integration.
After the Wenchuan Earthquake, the Chinese government, research institutions, and various social organizations conducted detailed surveys on post-earthquake migration. These investigations generated a wealth of data, including the scale of migration, migration directions, resettlement methods, the implementation of government aid policies, and the economic and social adaptation of the migrants. These abundant data sources provide a solid foundation for further research and enable comparative analyses, such as assessing the effectiveness of different migration patterns and the impact of various resettlement measures on the subsequent developments.
In conclusion, the Wenchuan Earthquake offers a rich case study and data support for understanding large-scale population migration patterns, the socioeconomic factors influencing migration, and the long-term effects of social reconstruction after a disaster. By thoroughly analyzing this event, valuable insights can be gained for formulating response strategies for future similar disasters and for providing guidance on managing post-disaster population migration on a global scale. As a result, this study selected the Wenchuan Earthquake as the case study for examining the impact of earthquakes on population migration.
Basic data on population migration
-
This study used various prefecture-level cities in Sichuan Province as case studies, with data from 2003 to 2013. The key factors influencing population migration included the resident population; registered population; migration population ratio; GDP; value-added of the primary, secondary, and tertiary industries; per capita regional GDP; the natural growth rate; the average wage of employees; and administrative land area. Among these, the migration population ratio was calculated by using the following formula:
$ \mathrm{\rm{T}he\; migration\; population\; ratio=\dfrac{Resident\; population}{Registered\; population}} $ (7) The remaining data are sourced from the National Bureau of Statistics and the Sichuan Provincial Bureau of Statistics. The SVI for each prefecture-level city in Sichuan Province from 2003 to 2013 was calculated using the methodology outlined earlier. Additionally, latitude and longitude information for each prefecture-level city was included in the dataset used for this analysis.
Figure 3 illustrates the temporal evolution of the SVI across various prefecture-level cities in Sichuan Province from 2003 to 2013. The flow lines in the diagram represent the relationship between the years and the cities in terms of the SVI, with the thickness of the lines indicating the intensity of the index. The chords emanate from the year nodes and flow towards the city nodes; a thicker chord signifies a higher SVI for that particular city in the given year. Notably, Chengdu consistently exhibited the highest SVI among all cities throughout the period from 2003 to 2013.
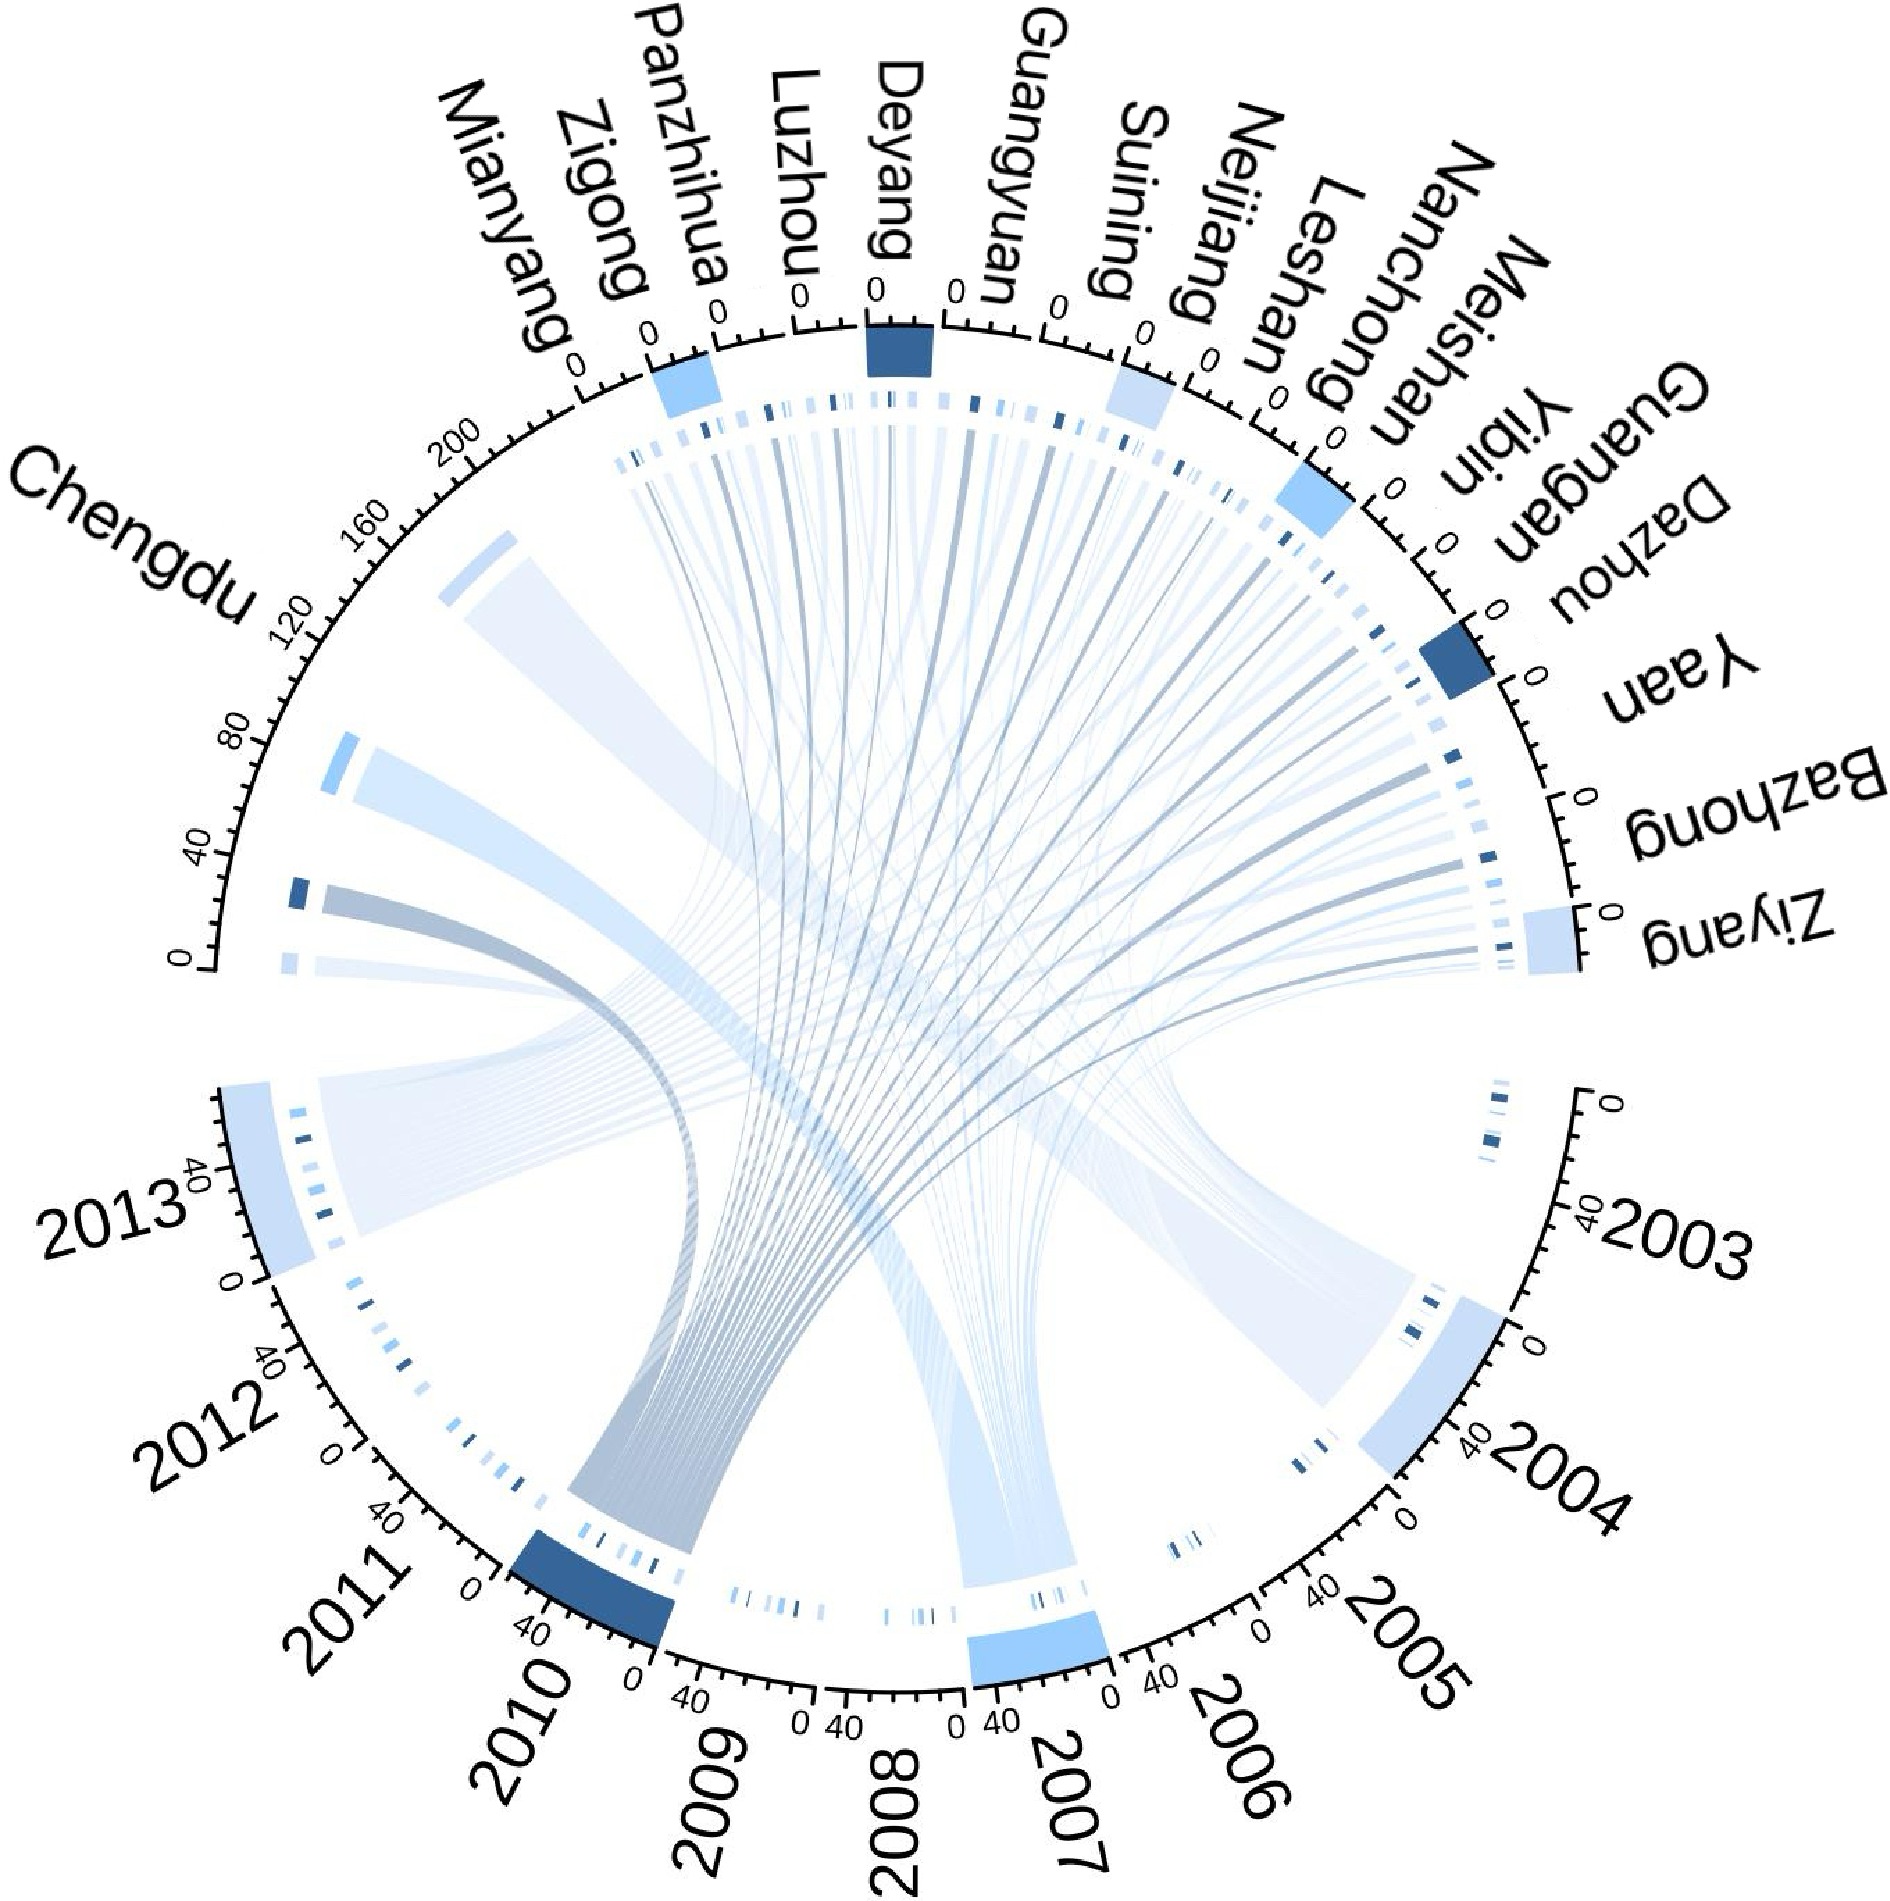
Figure 3.
Changes in SVI of prefecture-level cities in Sichuan Province from 2003 to 2013.
Model validation
-
Next, the relationships among the floating population, the SVI, and inter-city distance were analyzed to validate the rationality of the proposed model.
In Fig. 4, the blue and dark blue points represent different data samples, illustrating the floating population under varying SVI values. The black line denotes the fitted trend line, reflecting the overall relationship between SVI and the floating population. The gray shaded area represents the confidence interval, indicating the uncertainty range of the trend line. As the SVI increases, the floating population exhibits a declining trend, suggesting that regions with higher social vulnerability may experience reduced population mobility. This figure demonstrates a negative correlation between SVI and the floating population, implying that areas with elevated social vulnerability, potentially caused by economic, social, or other factors, tend to have less population movement.
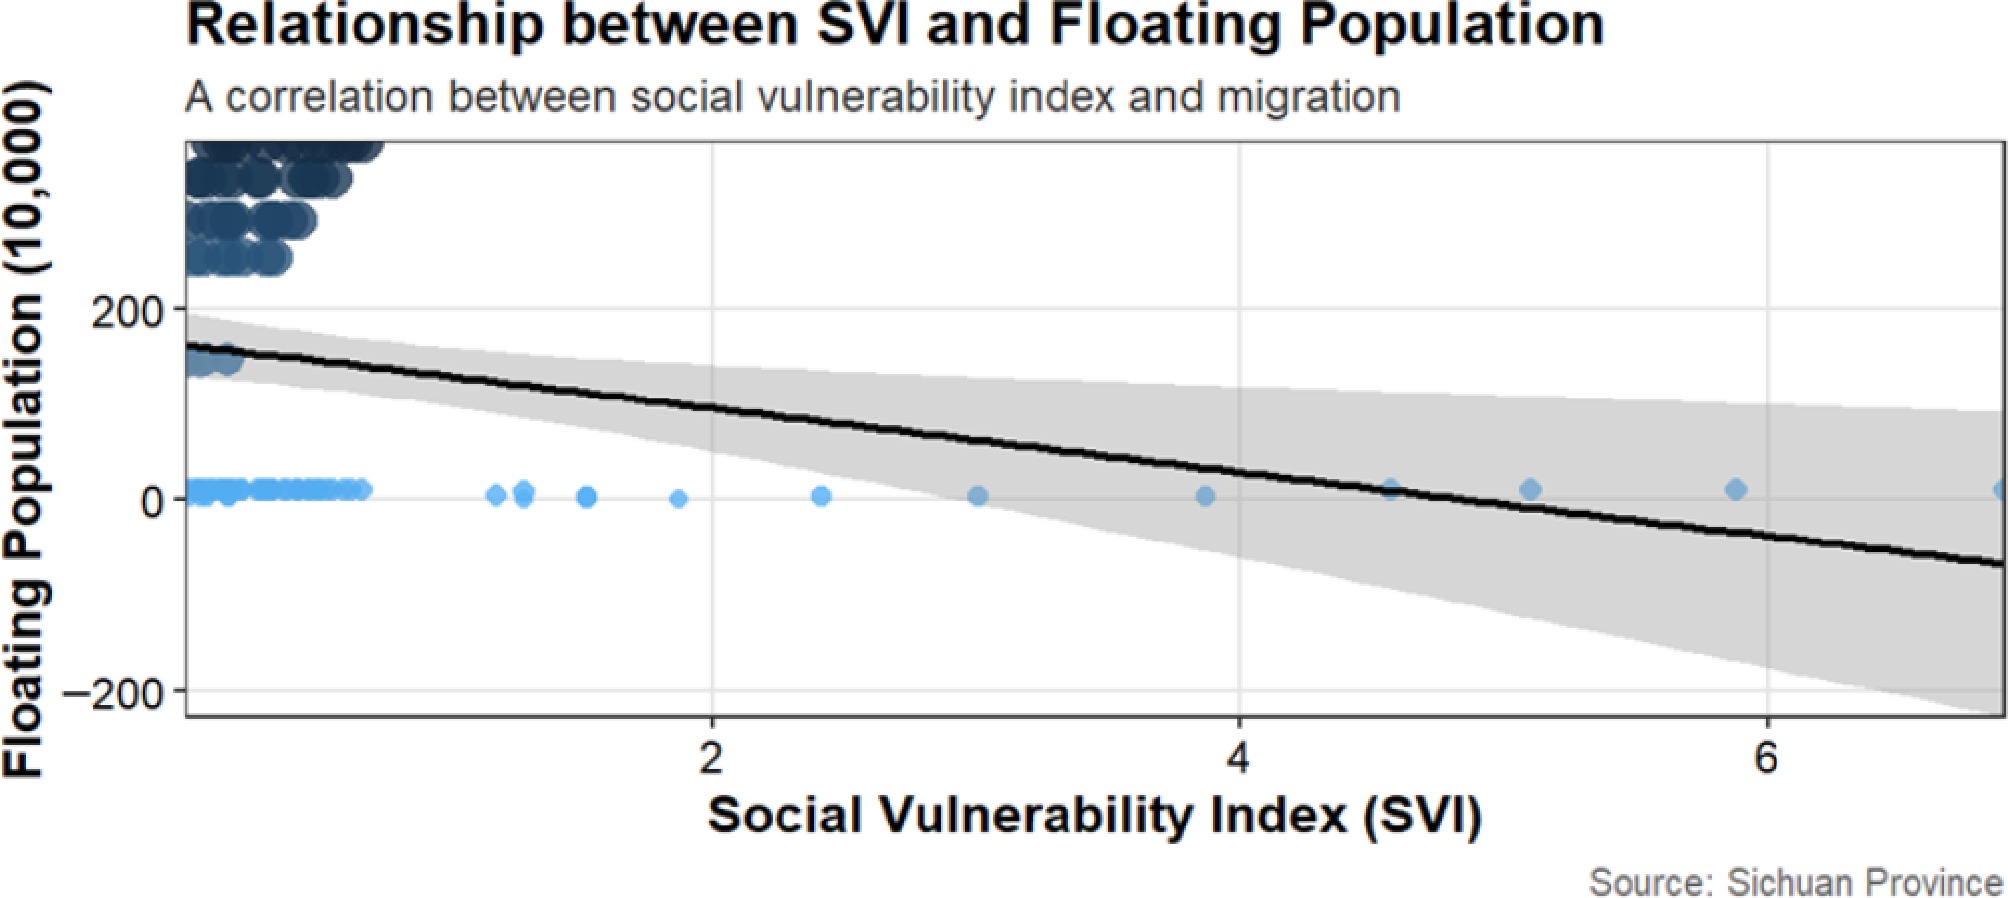
Figure 4.
Relationship between SVI and the floating population.
In Fig. 5, the blue points represent different data samples, showing the floating population at varying distances. The black line represents the trend line fitted by the gravity model, illustrating the overall relationship between distance and the floating population. The figure reveals that the floating population is higher at shorter distances and gradually decreases as the distance increases, aligning with the expectations of the gravity model, which posits that migration decreases with greater distance. Within shorter distances (0–200 km), the floating population exhibits significant fluctuations, whereas at longer distances (beyond 400 km), the floating population stabilizes with minimal variation.
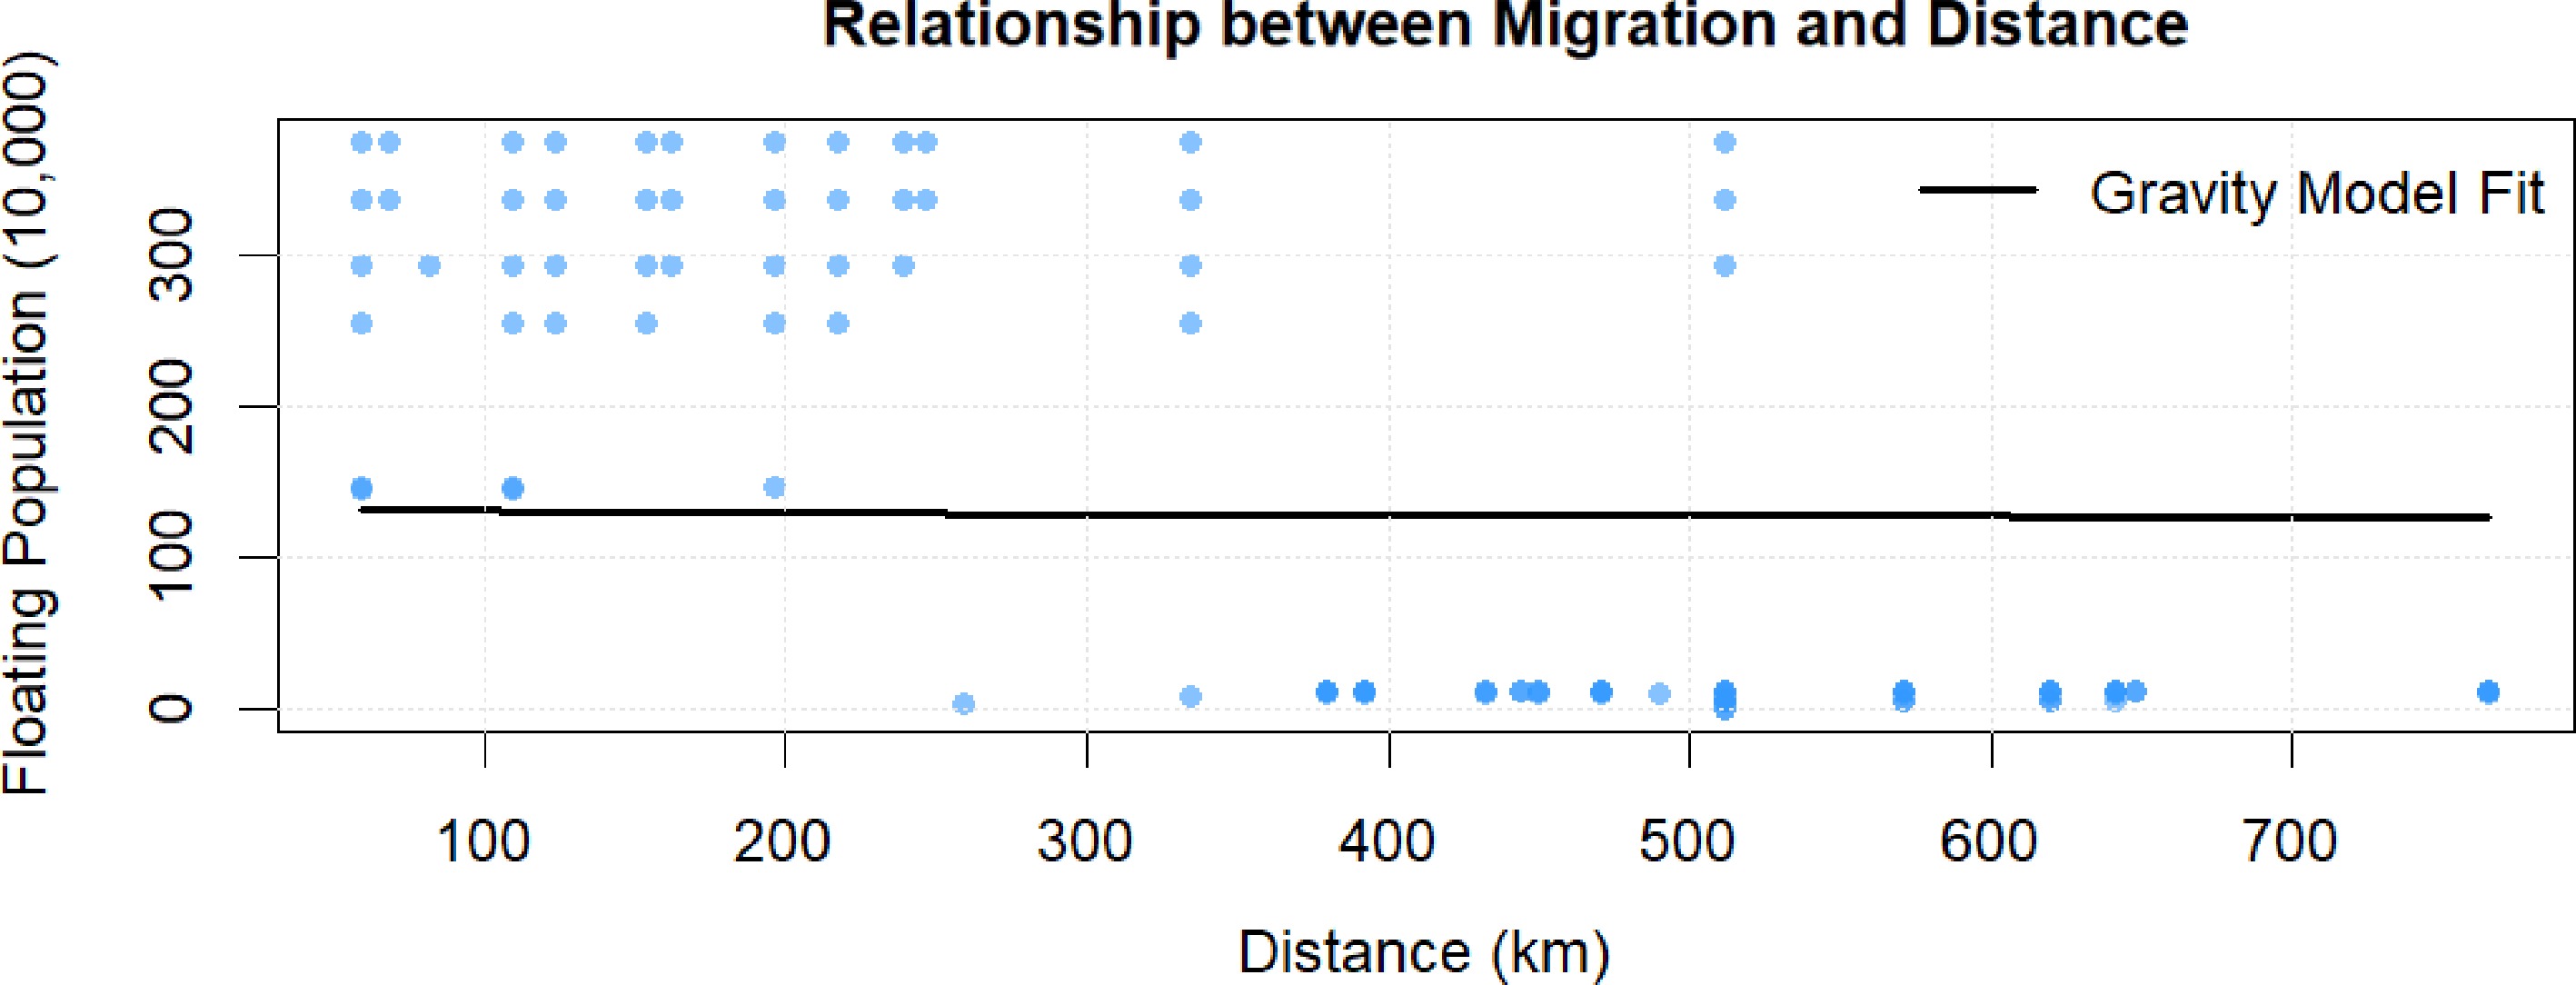
Figure 5.
Relationship between migration and distance.
The goodness of fit was used to evaluate the model's performance. The residual matrix was first calculated, followed by computation of the total sum of squares and the residual sum of squares. The results are presented in Table 4.
Table 4. Results of model evaluation.
Index Sum of squares
for error (SSE)Sum of squares
for total (SST)Goodness of fit Value 18,056.63 2,472,279 0.9927 As shown in Table 4, the model's goodness of fit is approximately 0.9927, indicating that the modified gravity model can explain approximately 99.27% of the variability in the data. This suggests that the model exhibits excellent fit and predictive capability. Next, a five-fold cross-validation was performed, in which the model was refitted on the training set and evaluated on the test set in each fold. The average R2 across the five folds was 0.8898, indicating that the model exhibits strong overall robustness and generalizability.
Consequently, the model was used to predict the floating population from 2014 to 2022. The results indicate that Chengdu and Panzhihua are the primary cities with population inflows, whereas other prefecture-level cities within the province are characterized by population outflows, consistent with real-world observations.
-
Building on the traditional gravity model, this study incorporated GDP and the SVI to analyze the determinants of intra-provincial population migration in Sichuan following the 2008 Wenchuan Earthquake. The model's results indicate that GDP exerts a significant positive effect on migration, whereas the impacts of distance and SVI are relatively weak. This finding aligns with the classical logic of the gravity model, namely that regions with higher levels of economic development and shorter distances exert stronger migratory attraction. However, within the post-disaster context, such results suggest the presence of more complex mechanisms shaped by the joint influences of economic, social, and policy factors.
The insignificant effect of the SVI does not imply that social factors were irrelevant to post-earthquake migration; rather, it indicates that their influence was likely overshadowed by strong policy interventions. In the aftermath of the Wenchuan Earthquake, the Chinese government rapidly implemented large-scale housing reconstruction and pairing assistance programs, along with fiscal subsidies, employment support, and resettlement policies. These top-down institutional measures largely guided migration flows, shifting migration behavior from individual-driven to policy-driven patterns. Consequently, the structural disparities originally captured by the SVI, such as differences in education, income, and housing conditions, were substantially mitigated through governmental intervention, leading to their statistical insignificance in the model. This finding echoes evidence from international cases such as the Great East Japan Earthquake and the 2010 Chilean tsunami, both of which demonstrated the moderating role of institutional intervention in shaping post-disaster migration.
Moreover, the rapid pace of economic recovery following the Wenchuan Earthquake further strengthened the dominance of GDP as a determinant of migration. Cities such as Chengdu, Deyang, and Mianyang experienced robust economic rebounds through infrastructure reconstruction and industrial revitalization. The sustained growth in regional GDP enhanced the attractiveness of the destination areas while narrowing inter-regional gaps in social vulnerability. The observation that economic recovery outpaced social reconstruction highlights the staged nature of post-disaster migration: in the early recovery period, migration was primarily driven by government policies and restoration of the infrastructure, whereas in later stages, as the markets stabilized, economic opportunities and market forces gradually replaced policy interventions as the main drivers of population movements.
Theoretically, this study contributes to the literature by extending the gravity model's analytical boundaries by including the SVI. Although traditional gravity models primarily focus on the effects of economic development and spatial distance, this study integrates social vulnerability as an additional explanatory dimension, constructing a comprehensive analytical framework that accounts for economic, spatial, and institutional factors simultaneously. This theoretical expansion bridges the gap between quantitative migration modeling and social vulnerability research, providing a new perspective for understanding the socioeconomic mechanisms underlying post-disaster migration.
-
This study began by visualizing earthquakes of magnitude 5.0 and above that occurred in China from 2011 to 2023, integrating them with the regional population density. From the visualization, the Wenchuan Earthquake was selected as the case study. Building upon the traditional gravity model of population mobility, a modified gravity model was developed by incorporating the SVI. The SVI was based on Cutter's methodology, with optimized indicator selection, to derive the SVI for Sichuan Province's prefecture-level cities from 2003 to 2013. The model was validated using socioeconomic data from Sichuan's prefecture-level cities, yielding a goodness of fit of 0.9927, indicating robust model performance. Finally, the model was used to predict population mobility within Sichuan's prefecture-level cities from 2014 to 2022. The results identified Chengdu and Panzhihua as the primary cities with population outflows, consistent with empirical observations.
The study's innovations are threefold. First, it calculated the SVIs for Sichuan's prefecture-level cities over the five years before and after the Wenchuan Earthquake, quantifying the socioeconomic impacts of the earthquake on these regions, with optimized indicator selection. Second, it used the GDP and SVI of the origin and destination cities to modify the traditional gravity model, successfully explaining the primary factors influencing the choice of migration destination. Third, it dynamically visualized the frequency and magnitude of earthquakes of magnitude 5.0 and above in China and its border regions from 2011 to 2023, providing a foundation for studying the relationship between population density and seismic activity.
From a policy and practical standpoint, the findings suggest that post-disaster population management should not rely solely on economic stimulus or infrastructure reconstruction. Although economic growth can attract population inflows in the short term, persistently high levels of social vulnerability may still lead to social instability and the risk of secondary migration. Therefore, post-disaster recovery should adhere to a balanced approach that emphasizes both economic revitalization and social restoration. On one hand, industrial revitalization and job creation are essential for sustaining economic growth; on the other, improving the equity and accessibility of public services, education, and healthcare can help reduce social vulnerability and strengthen community resilience. For local governments, incorporating social vulnerability assessments into disaster risk management frameworks can help identify cities with strong economic dynamism but fragile social foundations, thereby enabling the design of differentiated recovery strategies that enhance the coherence and long-term stability of post-disaster reconstruction.
Finally, it is important to note the study's limitations. The data used to construct the SVI and modify the gravity model were derived from the socioeconomic data of Sichuan's prefecture-level cities over the five years before and after the Wenchuan Earthquake. Consequently, the results are significantly influenced by the earthquake's impact, and the study is limited to intra-provincial migration. Thus, the conclusions are more applicable to intra-provincial migration phenomena in cities affected by major natural disasters. Moreover, the analysis is based on a single historical case, which constrains the generalizability of the findings across different disaster contexts and temporal settings. Future studies will explicitly address this limitation by applying the proposed framework to more recent disaster events to test its broader applicability and enhance its contemporary relevance. Additionally, factors influencing population migration extend beyond those examined in this study. Future research could expand the scope to inter-provincial migration and incorporate the emotional factors of migrants to further refine the model.
This research was supported by the National Natural Science Foundation of China (No. 72204130), the Social Science Planning Project of Shandong Province (No. 25CLJJ36), the Science and Technology Support Plan for Youth Innovation of Colleges and Universities of Shandong Province of China (No. 2023RW028), and Social Science Planning Project of Qingdao (No. QDSKL2401132).
-
The authors confirm contributions to the paper as follows: study conception and design: Zhu XX; data collection: Ran MH; analysis and interpretation of results: Zhu XX, Ran MH; draft manuscript preparation: Ran MH, Zhu XX, and Regan D. All authors reviewed the results and approved the final version of the manuscript.
-
The datasets generated during and/or analyzed during the current study are available from the corresponding author on reasonable request.
-
The authors declare that they have no conflict of interest.
- Copyright: © 2025 by the author(s). Published by Maximum Academic Press on behalf of Nanjing Tech University. This article is an open access article distributed under Creative Commons Attribution License (CC BY 4.0), visit https://creativecommons.org/licenses/by/4.0/.
-
About this article
Cite this article
Zhu XX, Ran MH, Regan D. 2025. A modified gravity model integrated with a social vulnerability index: a case study of the 2008 Wenchuan Earthquake. Emergency Management Science and Technology 5: e021 doi: 10.48130/emst-0025-0019 

A modified gravity model integrated with a social vulnerability index: a case study of the 2008 Wenchuan Earthquake
- Received: 02 September 2025
- Revised: 12 November 2025
- Accepted: 26 November 2025
- Published online: 22 December 2025
Abstract: In the context of global climate change and frequent natural disasters, the impact of sudden disasters such as earthquakes on population migration is becoming increasingly significant. Taking the 2008 Wenchuan Earthquake as a case study, this study explores the impact mechanism of earthquake disasters on population migration by combining the modified gravity model and the social vulnerability index. By collecting seismic data for earthquakes of of magnitude 5 or higher in China and its surrounding areas from 2011 to 2023, combined with population density information, this study first visualized the seismic events and revealed the spatial distribution characteristics and potential impacts of seismic activities. Subsequently, based on the socioeconomic data before and after the Wenchuan Earthquake, the social vulnerability index was constructed to quantify the impact of the earthquake on population migration. Finally, a model based on the traditional gravity model, social vulnerability, the gross domestic product (GDP) of the place of migration, and the place of migration is introduced. The results show that the GDP of the place of migration and the places of migration have a significant impact on population migration, while the social vulnerability index has a relatively small impact on intraprovincial migration. The goodness-of-fit of the model reached 0.9927, indicating that the modified gravity model could effectively explain the variability of population migration. This study provides a new quantitative evaluation method for managing post-disaster population migration, and provides a scientific basis for future disaster risk management and urban planning.