


-
Climate change has emerged as a critical global challenge for crop production and food security[1−3]. Rising temperatures can disrupt crop growth patterns, alter flowering time, affect pollinator activity, alter pest pressures, and affect crop yields and nutritional quality[4−7]. Warming also increases crop water use and soil water loss, which heightens water deficits[8−11]. Additionally, climate change, through both rising temperatures and enhanced water deficits, can affect plant nutrient absorption and crop quality, raising concerns about the future adequacy of human nutrition[12−13]. As greenhouse gas emissions and global warming continue, the effect of warming on fruit chemistry and food quality needs to be quantified, while effective mitigation strategies are increasingly urgent to ensure a nutritious and sustainable food supply[14−16].
Soil amendments, such as applications of wood mulch, biochar, and compost, can enhance soil water holding and reduce evaporation, potentially mitigating the increased water and nutrient deficits caused by warming. Wood-based products like paper and sawdust can be used as mulch, offering a sustainable and cost-effective way to suppress weeds, reduce soil compaction, and enhance soil mineralization[17−21]. Pine bark mulch, in particular, has been shown to alleviate water stress in wild blueberry fields[22], whose fruit productivity is sensitive to water deficits[9]. Similarly, biochar and biochar-compost mixes can improve soil water retention and nutrient availability[23,24], especially for sandy soils of wild blueberry fields[25,26]. Biochar has demonstrated its potential to mitigate drought effects and significantly enhance the biochemical composition of crops[27,28]. Biochar application has led to increased uptake of nutrients like potassium and magnesium in peas and barley[24,28]. Biochar amendments have also been associated with higher phenolic content and antioxidant activity in tomatoes[29]. However, limited positive effects of biochar on annual crop production have also been reported[28,30]. The potential use of mulching and wood-based biochar to improve the nutrition of perennial crops under elevated temperatures requires testing.
Wild lowbush blueberry (Vaccinium angustifolium Aiton; Ericaceae) is a perennial fruit crop of significant importance in North America. Wild blueberries are sweet and offer consumers valuable nutritional and health benefits through antioxidant phenolic properties[31,32]. Maine, one of the largest commercial producers of wild blueberries, has experienced accelerated climate warming and frequent droughts[9,10]. Wild blueberry farms, typically with gravelly sandy loam soils, show low water and nutrient-holding capacity. Although irrigation can help alleviate drought and improve water demand, most wild blueberry fields are not irrigated[33]. Small growers often lack access to sufficient water and affordable irrigation systems, causing significant challenges in managing wild blueberry farms and maintaining sustainable livelihoods. Recent research showed that elevated temperatures reduced the nutritional value of berries, including a decrease in total soluble sugars, anthocyanin content, and antioxidant capacity[4]. Reduced fruit nutritional quality may have a potential negative impact on marketability, as consumer preference studies indicate that nutrition and quality are key purchasing drivers, alongside price and origin[34,35]. In light of these challenges and limited access to irrigation systems, it is imperative to investigate whether soil amendments like mulching and biochar-compost applications – known for their potential to improve water retention and soil health[25−27,36] – can effectively mitigate the negative impact of warming on the nutritional quality of wild blueberries under field conditions.
The objectives of the present study were to: (1) confirm the negative impact of warming on the nutritional quality of wild blueberries; (2) assess the influence of mulching and biochar-compost application on wild blueberry fruit chemistry and quality under warming conditions; and (3) test the relationships among fruit chemistry and fruit size under climate warming. To this end, field warming experiments using open-top chambers were carried out, and it was tested whether minimal rates of these soil amendments could mitigate the negative impacts of warming on fruit quality by comparing treated plots to unamended ambient control plots. It was hypothesized that warming would reduce the nutritional quality of wild blueberries, while mulching and biochar-compost mix as soil amendments would mitigate these effects as they can improve soil water and nutrient retention[25−27,36]. It was also hypothesized that the changes in fruit chemical composition under warming were related to changes in berry size.
-
This experiment was conducted at two sites in Washington County, Maine, USA. One is Blueberry Hill Research Farm (44.6° N, 67.6° W) in Jonesboro, and the other is Wyman's Farm (44.7° N, 68.0° W) in Deblois. In 2021, the average temperature was 8.1 °C, with 1,152.65 mm of precipitation. In 2022, the average temperature was 7.7 °C, with 1,352.29 mm precipitation[37]. The experiment spanned two years (2021–2022), with no irrigation or fertilizer applied. Wild blueberry plants in commercial fields are naturally growing plants (not cultivated) with hundreds of unnamed clones (also called genotypes) coexisting in a single field (Fig. 1a and b). A clone originates from a seed, spreading through clonal growth with rhizomes to form a patch of genetically identical stems (connected with rhizomes). Six morphologically distinct wild blueberry clones (C1–C6) were selected (three per site), based on observable variations in characteristics such as leaf color (green to red), stem color (green to brownish-red), growth habit, and leaf morphology. Hexagonal open-top chambers were constructed using transparent polycarbonate sheets (100 cm base, 70 cm top, 55 cm height, base area 2.6 m2) and equipped with heating tape systems (Briskheat, Columbus, OH, USA) to elevate temperatures (Fig. 1c). Five treatment conditions were applied to each clone in the field on the original clone: ambient control conditions with biochar-compost mix (CON_BCM), ambient without biochar-compost mix (CON), warming only (AH), warming with softwood bark mulch (AH_M), and warming with biochar-compost mix (AH_BCM). The influence of different treatments on each other were avoided by placing different treatments as far away as possible from each other (at least 1.5 m away), but effects on each other could still exist as they were connected with rhizomes. The experimental design followed a randomized block layout, with blocks being clones. Softwood bark mulch was applied at a thickness of 1.3 cm (0.5 in). Biochar and compost were mixed at a 1:1 ratio by volume and applied at a rate of 14.2 m3/ha (7.5 cubic yards per acre) on top of the original soil. Microclimatic conditions, including air temperature and relative humidity, were monitored using HOBO weather stations (Onset Computer Corp., Bourne, MA, USA) placed 10 cm above the soil surface within each chamber. Data were recorded every 30 min. The active heating chamber system elevated the atmospheric temperatures by 3–5 °C during the day, and 1 to 2 °C at night, while it decreased the relative humidity by 6% to 10%, compared to the ambient controls (for details see Chen et al.[6] and Tasnim[38]). Notably, this study investigates the short-term response (acclimation) of this two-year crop to warming, while long-term monitoring could reveal long-term responses. However, long-term observations sometimes could not distinguish the effects of multiple environmental factors, as warming is accompanied by elevated CO2 and changed rainfall patterns in the long term. In contrast, short-term controlled experiments can ensure that other environmental factors are the same for different treatments.
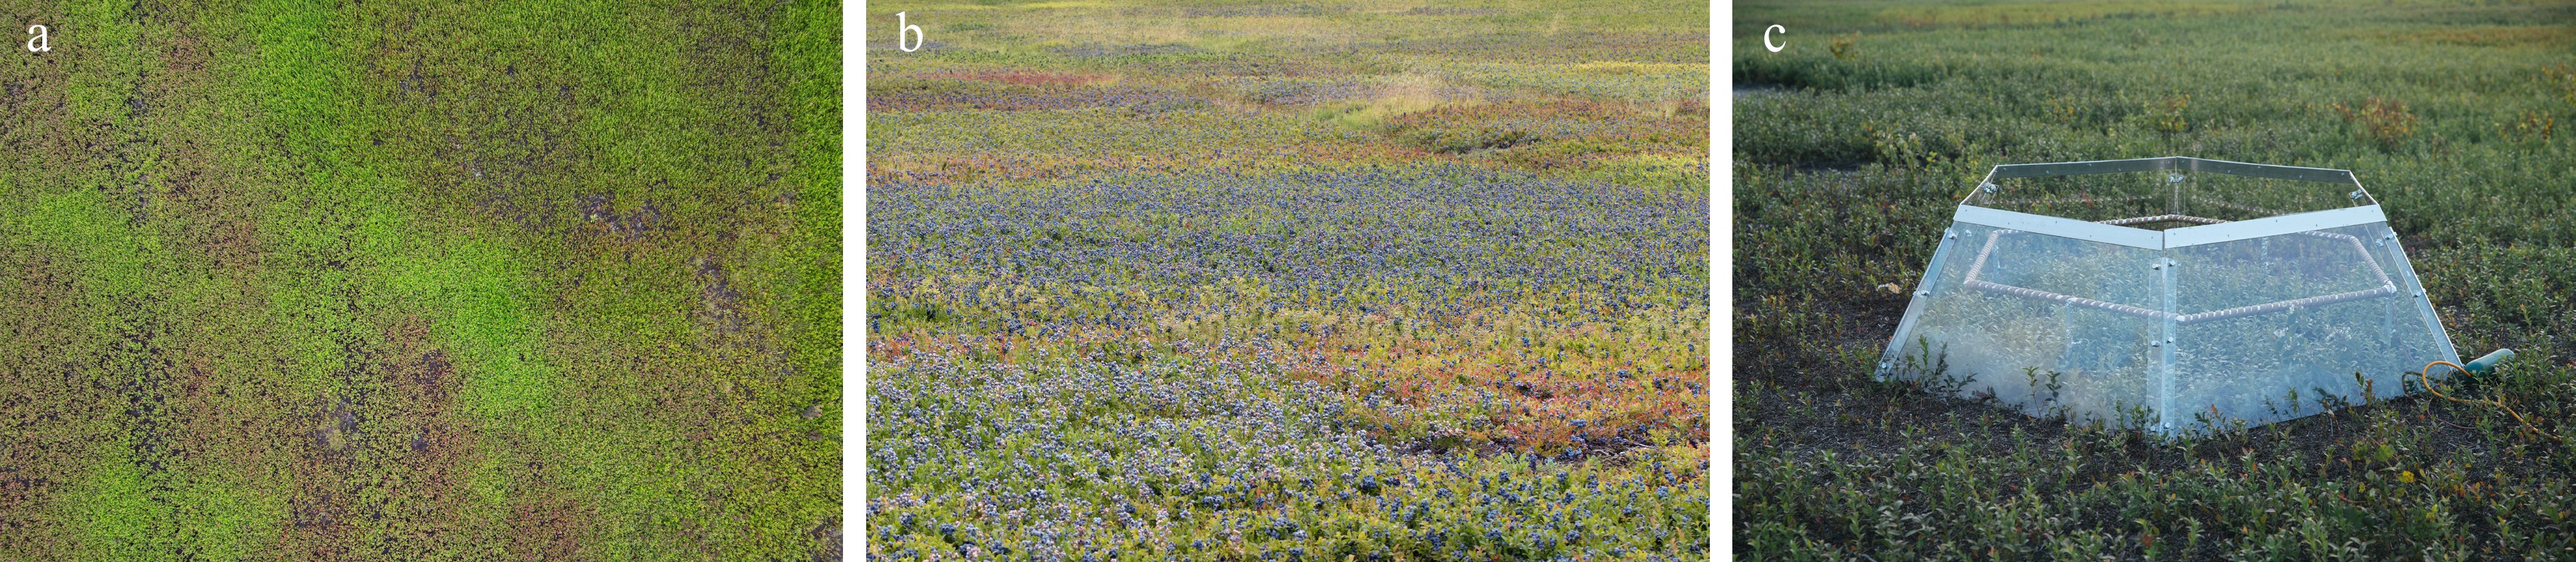
Figure 1.
Images of the wild blueberry fields and the open-top warming chamber used in this study. (a) UAV image showing the mixture of different clones in a wild blueberry field; (b) a close-up image showing different colors of different clones; (c) an image showing the open-top warming chamber with the active heating system used in the present study. Photo credit: Xiaoxue Mo.
Berry dry weight, moisture content, diameter, pH, and titratable acidity determination
-
Fruit quality sampling was performed on July 20, 2022, by hand-picking berries at approximately 90% ripeness, characterized by a dark blue coloration. Fresh weight (FW) was recorded for 100 ripe berries, and dry weight (DW) was determined following drying at 70 °C for 36 h. Twenty individual berries from each treatment across six clones were randomly selected, weighed, and measured for diameter (mm) using ImageJ software[39]. Berry moisture content was assessed by drying 100 g samples at 70 °C for 48 h, following the methodology outlined by Canet[40]. Moisture content was expressed as a percentage of fresh weight.
For pH and titratable acidity assay, 5 g of wet wild blueberry samples from each clone and treatment were macerated in 60 mL of deionized water using a Waring blender (Waring Laboratory, Torrington, CT, USA) for 1 min. The filtered juice was analyzed for pH using a pH meter (Accumet® AB150, Fisher Scientific, Hampton, NH, USA), and titratable acidity (TA) was determined by titrating to pH 8.2 with 0.1 N NaOH, expressed as a percentage of citric acid[41]. Total soluble solids (TSS) were quantified using a refractometer (Atago, PAL-Plato, Bellevue, WA, USA) and reported as °Brix[42,43]. The ripening index (RI) was calculated as the ratio of TSS to TA[4]. The remaining berries were promptly stored at −80 °C for subsequent analyses.
Organic acid and soluble sugar determination
-
Whole wild blueberry samples (200 g) from each clone and treatment were blended using a Robot Coupe R401B food processor (Ridgeland, MS). A 5 g aliquot of the blended samples was homogenized for 1 min using a Polytron® tissue homogenizer in 25 mL of 10 mM K2HPO4 (pH 2.6, adjusted with H3PO4) for organic acid extraction, and in 25 mL of acetonitrile : water (50:50, v/v) for soluble sugar extraction. The homogenates were centrifuged at 7,800 rpm for 10 min, and 1 mL aliquots of the supernatant was transferred to HPLC sample vials.
High-performance liquid chromatography (HPLC) was used to identify and quantify organic acids and soluble sugars. Analysis was performed on an Agilent 1100 series HPLC system with Chemstation® software. Organic acids were separated using a Restek Allure Organic Acids® column (300 mm × 4.6 mm I.D., 5 μm), and soluble sugars were analyzed using a Shodex NH2P-40 3E column (250 mm × 4.6 mm I.D., 3 μm). The organic acid column was maintained at ambient temperature, while the sugar column was set to 35 °C. The mobile phases were 10 mM K2HPO4 (pH 2.6) for organic acids and acetonitrile : water (65:35, v/v) for soluble sugars. Organic acids were separated at a flow rate of 0.80 mL/min with a 1 μL injection volume and detected using a diode array detector (DAD) at 210 and 226 nm. Soluble sugars were separated at a flow rate of 0.40 mL/min with a 5 μL injection volume and detected using a refractive index detector set to positive mode and maintained at 35 °C. Analytical standards were used to identify and quantify target analytes. Retention times and peak areas from these standards were used to quantify peaks in the samples, with peak areas determined by manual integration of chromatograms using Agilent Chemstation® software.
Total anthocyanin content (TAC), and total phenolic content (TPC) assays
-
Frozen blended samples (5 g) from each clone and treatment were homogenized in 10 mL of methanol : formic acid (99.9:0.1, v/v) using a Polytron® tissue homogenizer (Kinematica, Switzerland) for 1 min. The mixtures were sonicated three times at 10-min intervals and then centrifuged at 7,000 rpm for 5 min. After each sonication and centrifugation, the supernatant was transferred to a new 50-mL Falcon tube, and 10 mL of methanol : formic acid solution was added. The final supernatant was filtered through Whatman®0.45 μm folded filter paper (Thermo Fisher Scientific, Waltham, MA, USA) and dried using a Turbo-Vac II nitrogen evaporator (Zymar, Hopkinton, MA, USA). Once completely dried, the extract was reconstituted in 25 mL of deionized water and stored at −20 °C until analysis. Total anthocyanin content (TAC) was measured in triplicate using the pH differential method described by Lee et al.[44]. Total phenolic content (TPC) was quantified in triplicate using the Folin-Ciocalteu reagent described by You et al.[45].
Ferric-reducing antioxidant power (FRAP) assay
-
The FRAP assay was conducted using Benzie and Strain's method[46]. Fresh FRAP reagent was prepared by mixing 300 mM sodium acetate buffer (pH 3.6), 10 mM 2,4,6-tripyridyl-s-triazine (TPTZ), and 20 mM FeCl3·6H2O in a ratio of 10:1:1 (v/v/v). To determine antioxidant capacity, 3 mL of the FRAP reagent was added to 100 µL of the sample extract and incubated at 37 °C for 4 min. Absorbance was measured at 593 nm using a spectrophotometer (Accuris MR9600-E, SmartReader, 230V), with water as the blank. Trolox (250 µM) served as an internal control. Results were expressed as μmol of ferrous sulfate equivalents (FSE) per gram of sample, based on a linear standard curve generated with FeSO4·7H2O concentrations ranging from 50 to 750 µM. Measurements were performed in triplicate.
Total soluble protein determination
-
Frozen samples (5 g) from each clone and treatment were pulverized for 1 min using a metal roller (Waring Laboratory, Torrington, CT, USA) in 45 mL of freshly prepared phosphate-buffered saline (pH 7.4). The homogenate was stirred for 30 min and then centrifuged at 15,000 rpm for 15 min. The supernatant was collected and analyzed for soluble protein content using Lowry's method[47]. Absorbance was measured at 700 nm with a spectrophotometer (BioTek Instruments, Winooski, VT, USA) against a BSA standard curve after 60 min incubation at room temperature (~25 °C). Soluble protein content was expressed as milligrams of Bovine Serum Albumin (BSAE) per gram of fresh weight. Each sample was analyzed in triplicate.
Nutrient quantification
-
Wild blueberry samples from each clone and treatment were dried at 70 °C for 72 h, ground with a Wiley mill, and submitted to the Plant and Soil Testing Laboratory at the University of Maine, Orono, for mineral nutrient analysis. The ashed samples were dissolved in 50% hydrochloric acid (HCl) on a hotplate and then diluted to volume with deionized water. Mineral nutrients, including nitrogen (N), calcium (Ca), potassium (K), magnesium (Mg), aluminum (Al), boron (B), copper (Cu), iron (Fe), zinc (Zn), phosphorus (P), and manganese (Mn), were quantified using an inductively coupled plasma optical emission spectrometer (ICP-OES; Thermo-Jarrell Ash Model IRIS 1000 Dual-View, Franklin, MA, USA). The analysis followed the procedures outlined by Kaltra & Maynard[48].
Statistical analyses
-
Statistical analyses were conducted using the corrplot[49], and lme4 functions[50] in the R software environment[51]. Location and clones were treated as random factors, while treatments were considered fixed effects. Data were first tested for normality using the Shapiro-Wilk test, and where necessary, transformations (e.g., log transformation for non-normally distributed variables (glucose and soluble sugar) were applied. The non-parametric Kruskal-Wallis test was used for variables that did not meet normality assumptions. ANOVA was performed to assess the effects of treatments using the following expression: fit = aov(trait ~ Treatment + Error(LocClone), data = dataframe).
Post-hoc comparisons between treatment means were conducted using Tukey's HSD test at a significance level of p < 0.05. Spearman's Rank correlation was conducted to analyze relationships between fruit quality traits. These traits included berry pH, total soluble solids, titratable acidity (TA), ripening index, berry size, weight, water content, phenolics, total soluble protein (TSP), organic acids, and antioxidant activities (FRAP).
-
No significant differences in berry diameter or weight were found between the control plots (CON) and the ambient plots treated with a biochar-compost mix (CON_BCM) (Fig. 2a, b). Similarly, there were no significant differences in these parameters among the warming plots, including those without amendment (AH), with mulching (AH_M), or with biochar-compost treatment (AH_BCM) (Fig. 2a, b). However, the berry diameter in the AH_M and AH_BCM treatments was significantly greater (p < 0.05) than in CON_BCM (Fig. 2a). Additionally, berries from AH, AH_M, and AH_BCM plots exhibited significantly higher weights (p < 0.05) compared with those from CON_BCM (Fig. 2b). The water content of berries from AH_M and AH_BCM treatments was also significantly higher (p < 0.05) than that of CON_BCM (Fig. 2c).
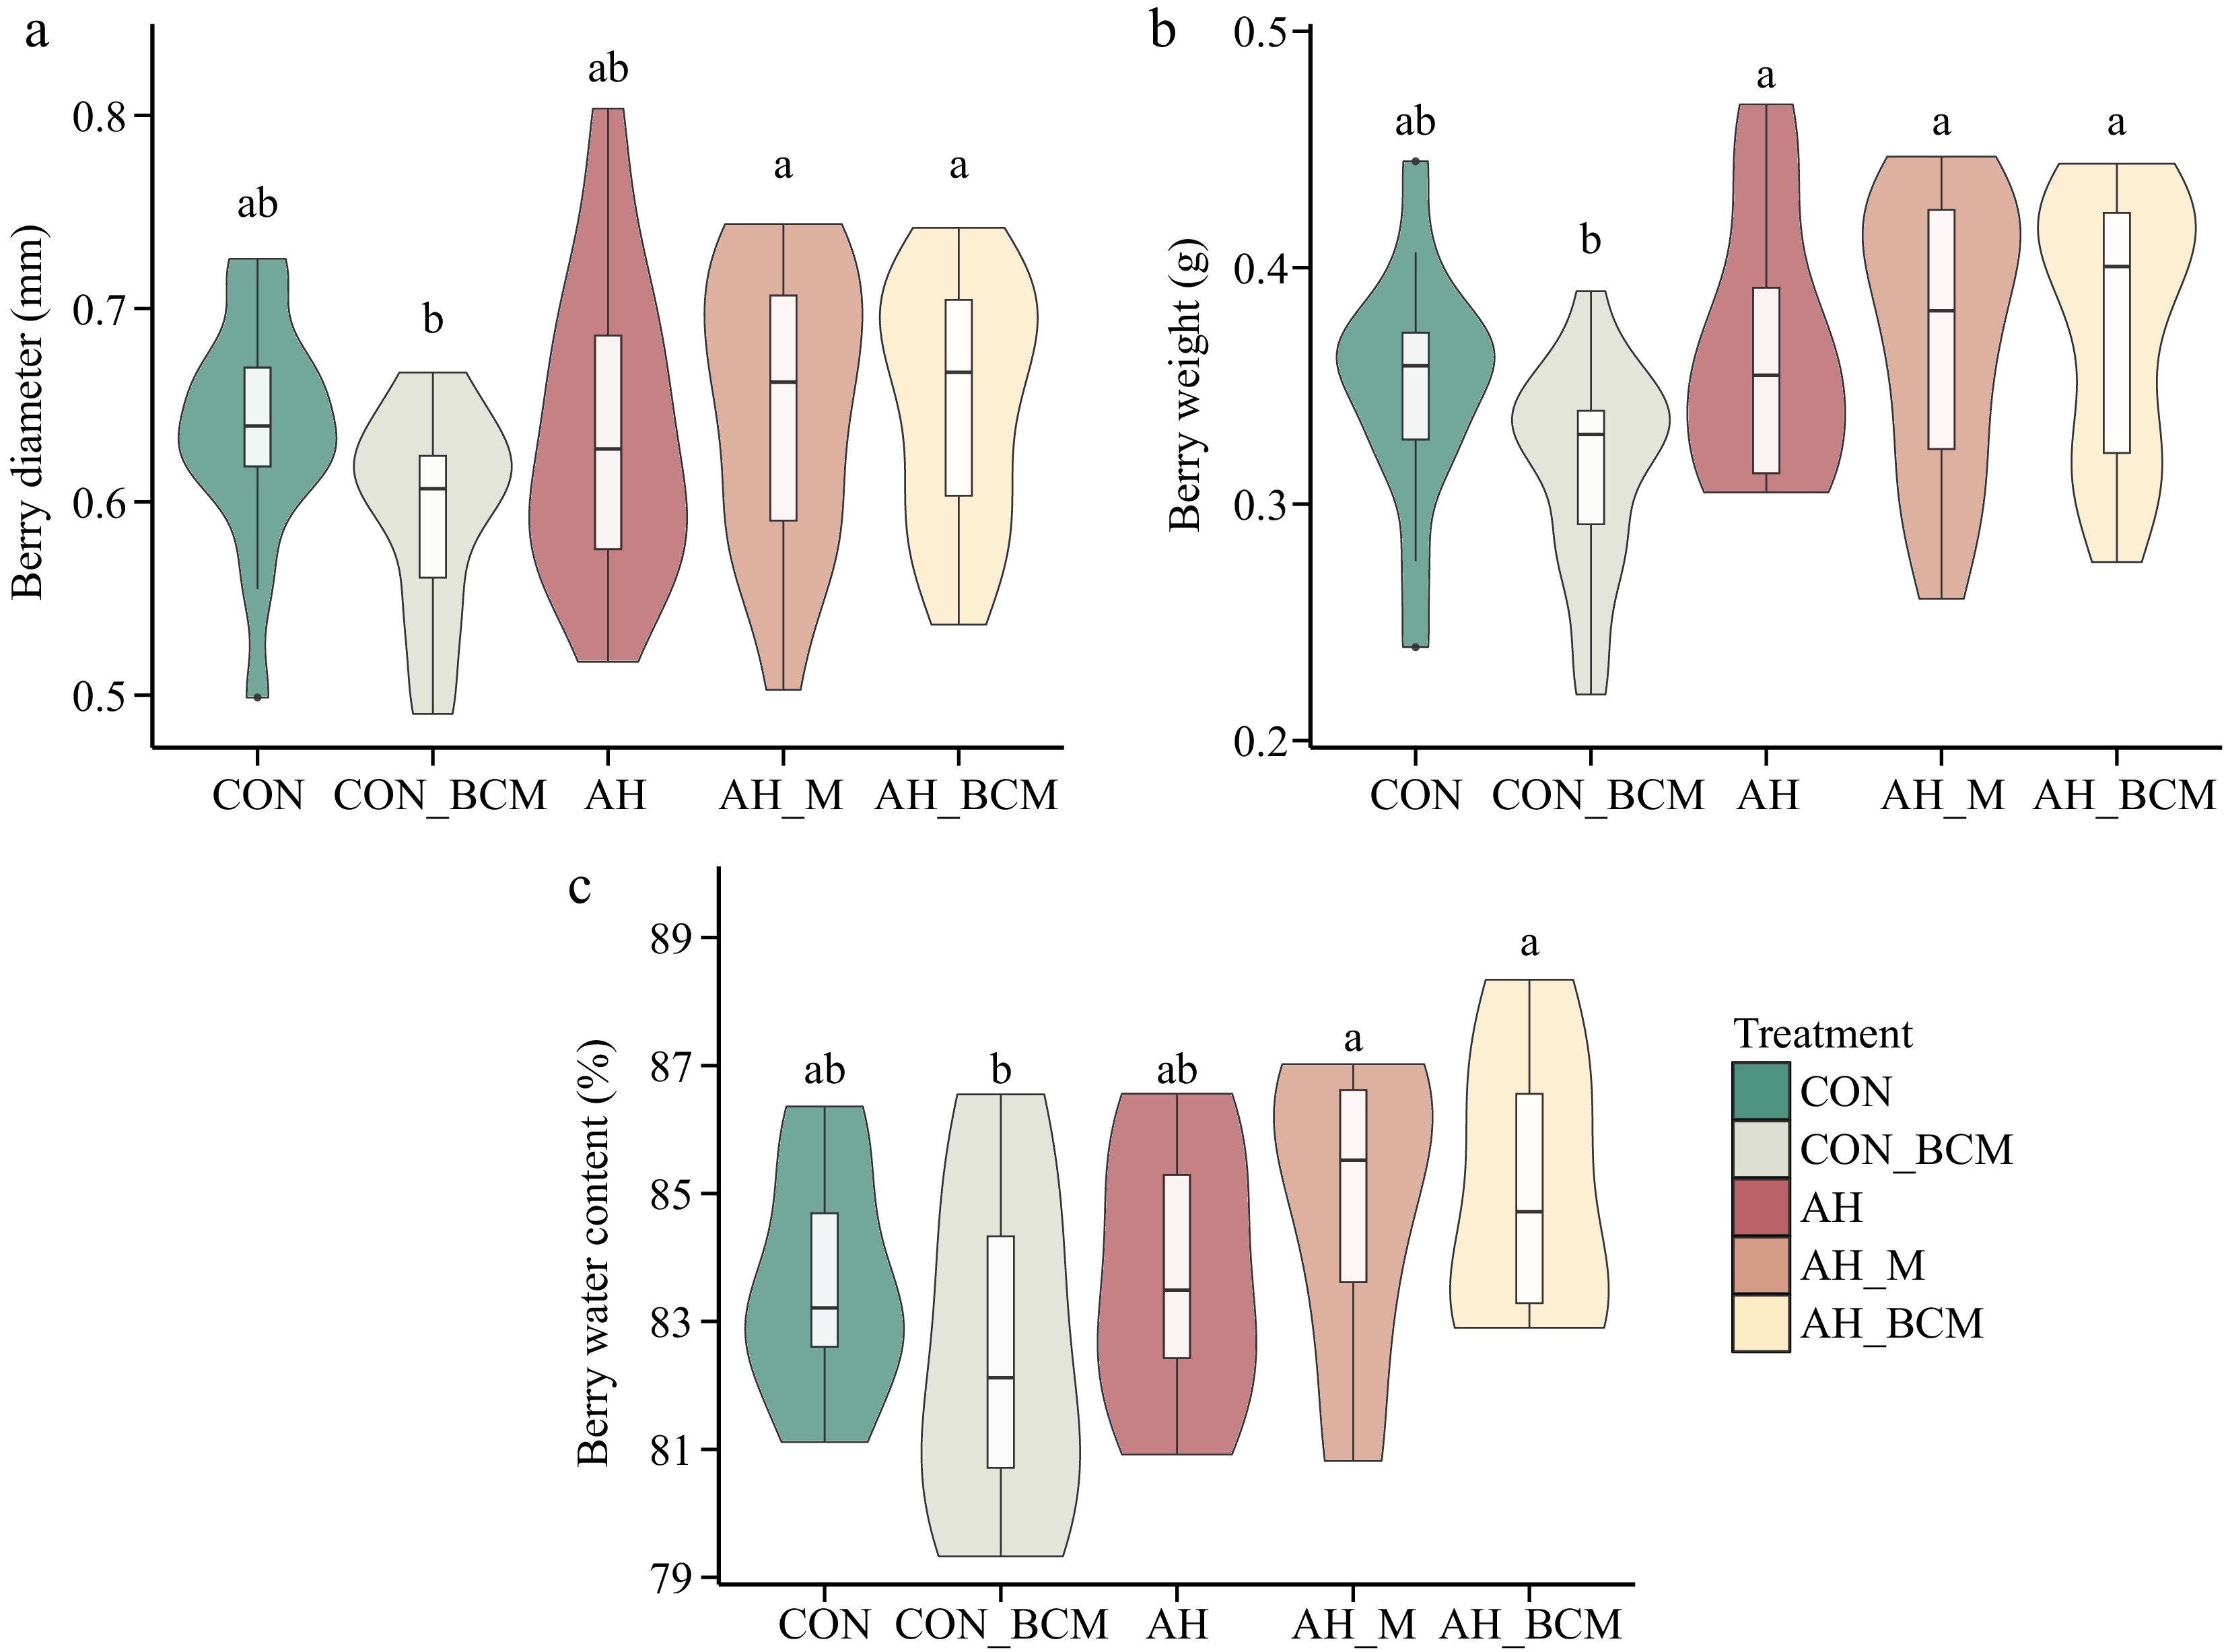
Figure 2.
Physical properties of wild blueberries. (a) Berry diameter (mm), (b) berry weight (g), and (c) berry water content (%), under different climate warming and mitigation treatments. The treatments include warming without amendment (AH), warming with mulching (AH_M), and warming with biochar-compost mix (AH_BCM), compared with control plots without (CON) and with biochar-compost mix (CON_BCM). The bar within each violin plot represents the average value across 20 berries. Letters above the boxes indicate significant differences based on Tukey's HSD post hoc test following two-way ANOVA (p < 0.05).
Berry pH, titratable acidity, and total soluble solids
-
Berry pH did not significantly differ among the CON, CON_BCM, and AH treatments (p > 0.05) (Fig. 3a). However, pH was significantly higher (p < 0.05) in berries from warming treatments with amendments (AH_M and AH_BCM) compared with CON (Fig. 3a). The titratable acidity (TA) of berries under all warming treatments, regardless of soil amendments (AH, AH_M, AH_BCM), was significantly lower (p < 0.05) than in the control (CON) (Fig. 3b).
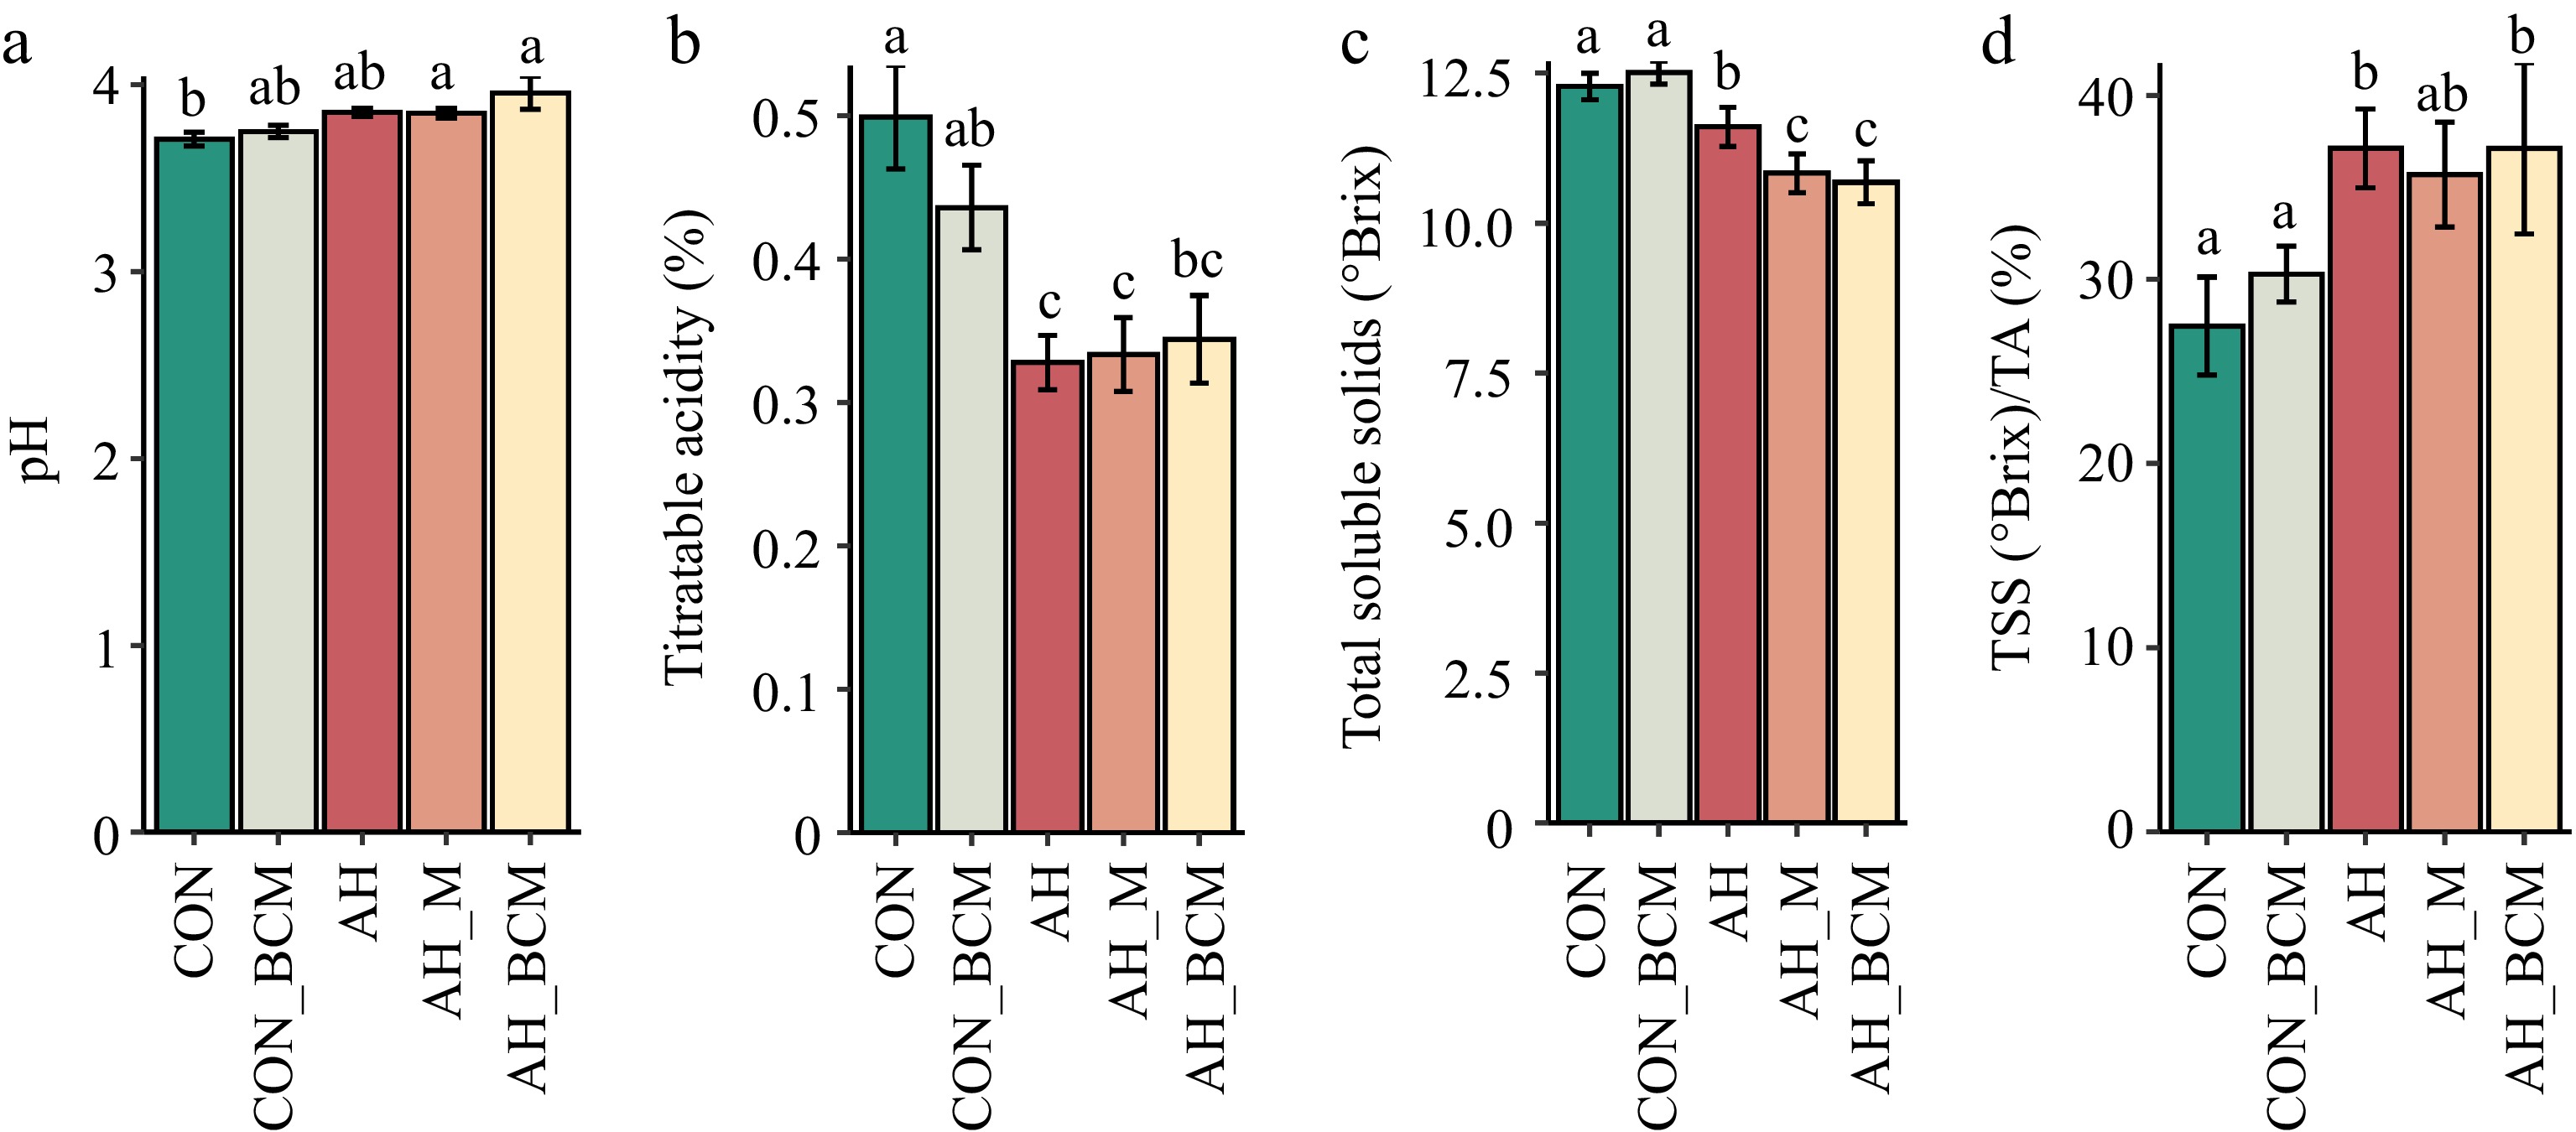
Figure 3.
Fruit chemistry of wild blueberries. (a) pH, (b) titratable acidity (TA), (c) total soluble solids (TSS), and (d) ripening index (TSS/TA) under various warming and mitigation treatments. Treatments include control without amendment (CON), control with biochar-compost mix (CON_BCM), active heating without amendment (AH), active heating with mulching (AH_M), and active heating with biochar-compost mix (AH_BCM). Bars represent the means and standard errors of six replicated clones. Clones and locations were treated as random effects and treatments as fixed effects. Bars with different letters indicate significant differences.
Total soluble solids (TSS) in the CON_BCM plots (12.5 °Brix) did not differ significantly from those in CON (12.3 °Brix) (p > 0.05; Fig. 3c). However, TSS levels were significantly lower in all warming treatments compared with CON and CON_BCM. Additionally, berries from the AH_M and AH_BCM treatments had significantly lower TSS (p < 0.05) than those from AH (Fig. 3c). The ripening index (TSS/TA) in warming treatments (AH and AH_BCM) was significantly higher (p < 0.05) than in the ambient controls (CON and CON_BCM) (Fig. 3d).
Organic acid composition
-
Citric, quinic, gluconic, and shikimic acids were the primary organic acids detected in wild blueberries, while isocitric and malic acids were below detectable levels and excluded from further analysis. Among the organic acids, citric, gluconic, and quinic acids were the most abundant (Table 1). Total organic acid concentration was significantly reduced (p < 0.05) in all warming treatments compared with the CON and CON_BCM plots (Table 1). Quinic acid concentrations in all warming treatments (AH, AH_M, and AH_BCM) were significantly lower (p < 0.05) than in the CON and CON_BCM plots (Table 1). Citric acid levels were significantly lower (p < 0.05) in berries from AH plots compared with CON, while no significant differences were observed in AH_M, AH_BCM, and CON_BCM plots (Table 1). No significant differences were found for gluconic and shikimic acids across treatments (Table 1).
Table 1. Mean concentrations (mg·g-1) of total organic, quinic, citric, shikimic, and gluconic acids in wild blueberries under different warming and mitigation treatments.
Treatment Total organic acids Quinic acid Citric acid Shikimic acid Gluconic acid CON 14.10(0.636)a 8.55(0.548)a 1.87(0.16)a 0.043(0.004)a 3.64(0.21)a CON_BCM 14.00(0.888)a 8.60(0.749)a 1.70(0.13)ab 0.05(0.008)a 3.62(0.19)a AH 10.50(0.463)b 5.24(0.256)b 1.24(0.06)b 0.044(0.009)a 3.99(0.27)a AH_M 10.80(0.502)b 5.85(0.304)b 1.68(0.12)ab 0.036(0.006)a 3.20(0.18)a AH_BCM 10.90(0.773)b 5.80(0.495)b 1.41(0.17)ab 0.037(0.006)a 3.69(0.3)a CON: control without amendment; CON_BCM: control with the biochar-compost mix; AH: active heating without amendment; AH_M: active heating with mulching; AH_BCM: active heating with the biochar-compost mix. Total organic acid concentration represents the sum of quinic, citric, shikimic, and gluconic acids. Values are means from six replicated clones, with clones and locations treated as random effects and treatments as fixed effects. Standard errors are in parentheses, and different letters indicate significant differences according to Tukey's HSD test (p < 0.05). Soluble sugars
-
Berry fructose concentration did not significantly differ between the AH and CON plots (Fig. 4a). However, fructose levels were significantly lower (p < 0.05) in AH_M and AH_BCM plots compared with AH. Berry glucose concentration was significantly lower (p < 0.05) in AH_BCM plots than in AH_M plots, but there were no significant differences among CON, CON_BCM, AH, and AH_BCM plots (Fig. 4b). Total soluble sugar concentration did not differ significantly (p > 0.05) among CON, CON_BCM, AH, and AH_BCM plots, but was significantly lower (p < 0.05) in AH_BCM plots compared with AH_M plots (Fig. 4c).
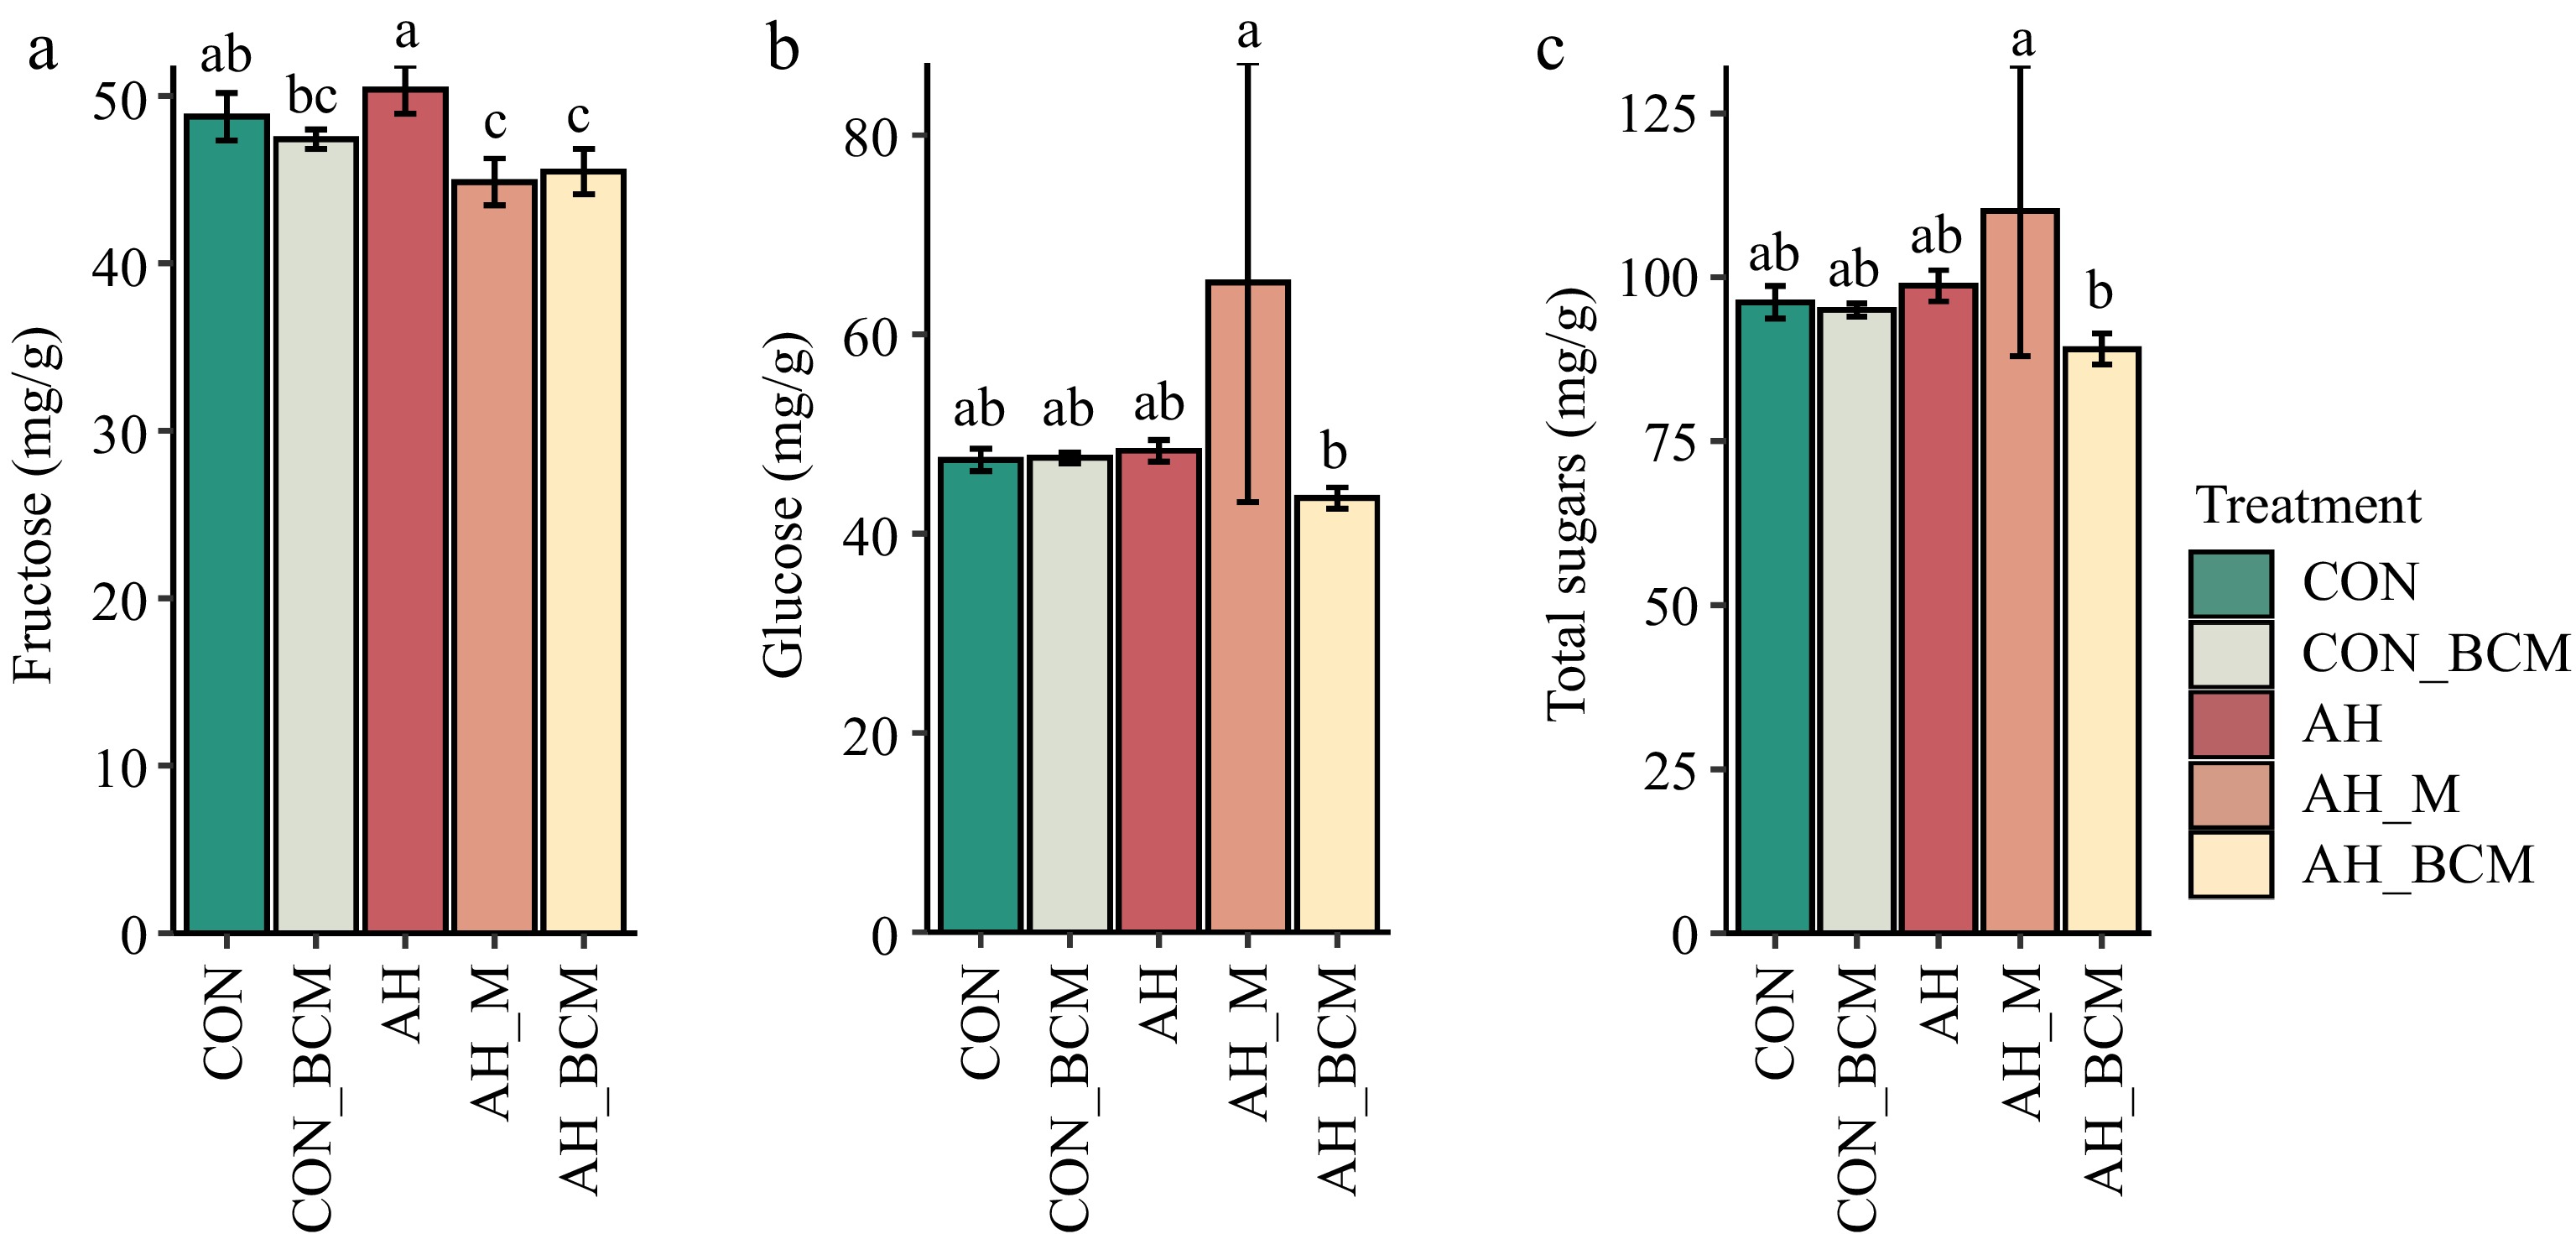
Figure 4.
Wild blueberry sugars. (a) Fructose, (b) glucose, and (c) total soluble sugars under different warming and mitigation treatments. Treatments include control without amendment (CON), control with biochar-compost mix (CON_BCM), active heating without amendment (AH), active heating with mulching (AH_M), and active heating with biochar-compost mix (AH_BCM). Bars represent the means and standard errors of six replicated clones. Clones and locations were treated as random effects and treatments as fixed effects. Bars with different letters indicate significant differences (p < 0.05).
Secondary metabolites and antioxidant properties
-
Total soluble protein (TSP) was significantly higher (p < 0.05) in CON_BCM compared with CON (Fig. 5a). TSP was significantly lower (p < 0.05) in AH, AH_M, and AH_BCM compared with CON_BCM, and also significantly reduced in AH_BCM compared with CON (Fig. 5a). No significant differences in total anthocyanins (TAC), phenolic acids (TPC), or antioxidant activities (FRAP) were observed between CON and CON_BCM plots (Fig. 5b–d). However, TAC, TPC, and FRAP were significantly lower (p < 0.05) in all warming-treated plots (AH, AH_M, and AH_BCM) compared with CON and CON_BCM (Fig. 5b–d).
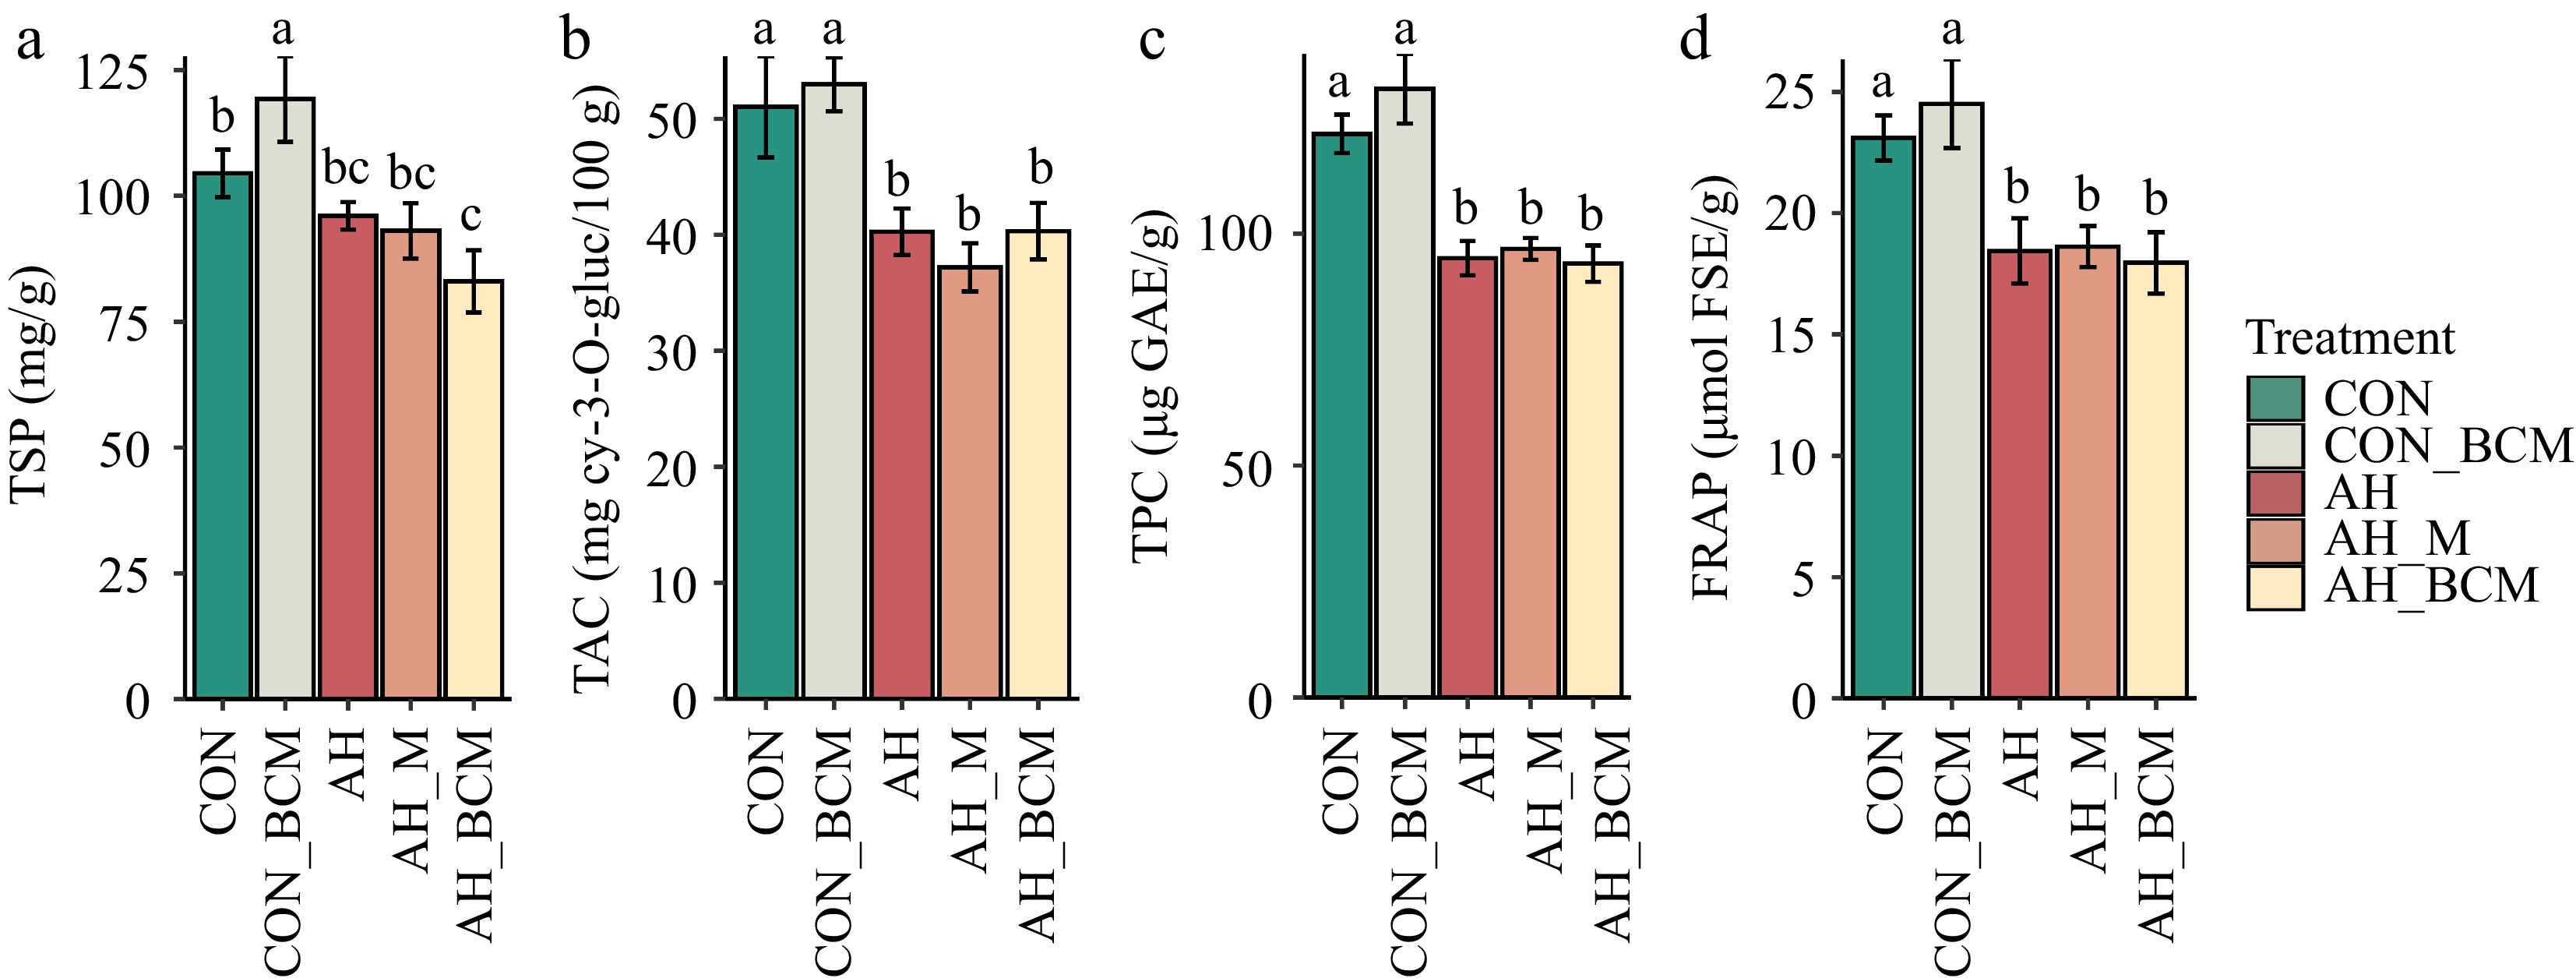
Figure 5.
(a) Total soluble protein (TSP), (b) total anthocyanins, (c) total phenolic concentration, (d) and ferric-reducing antioxidant power (FRAP) in wild blueberries under different warming and mitigation treatments. Treatments include control without amendment (CON), control with biochar-compost mix (CON_BCM), active heating without amendment (AH), active heating with mulching (AH_M), and active heating with biochar-compost mix (AH_BCM). Bars represent means and standard errors of six replicated clones. Clones and locations were treated as random effects, and treatments as fixed effects. Bars with different letters indicate significant differences (p < 0.05).
Macro and micronutrients
-
No significant differences were observed among treatments for boron, copper, iron, manganese, and zinc concentrations (Table 2). Aluminum concentration was significantly higher (p < 0.05) in CON_BCM (23.5 ppm) compared with AH_M (11 ppm) (Table 2). Berry calcium and nitrogen concentrations did not differ significantly among treatments (Table 2). Potassium concentration was lowest in AH plots and significantly lower (p < 0.05) compared with AH_BCM plots (Table 2). Magnesium concentration was significantly higher (p < 0.05) in AH_M (0.045%) than in AH plots (0.038%) (Table 2). Berry phosphorus concentration was significantly higher (p < 0.05) in CON and CON_BCM plots compared with AH plots.
Table 2. Mean macro and micronutrient concentrations in mature wild blueberries under different warming and mitigation treatments.
Treatment N (%) P (%) K (%) Mg (%) Ca (%) Al (ppm) B (ppm) Cu (ppm) Fe (ppm) Mn (ppm) Zn (ppm) CON 0.65(0.02)a 0.10(0.004)a 0.46(0.017)ab 0.04(0.002)ab 0.09(0.007)a 14.1(3)ab 5.78(0.36)a 3.06(0.31)a 15.8(1.51)a 166(23.1)a 6.4(0.3)a CON_BCM 0.65(0.016)a 0.10(0.002)a 0.51(0.012)a 0.04(0.002)ab 0.09(0.009)a 23.7(2)a 5.98(0.32)a 3.02(0.21)a 16.9(1.77)a 148(10.8)a 6.81(0.4)a AH 0.59(0.018)a 0.09(0.003)b 0.43(0.015)b 0.04(0.003)a 0.09(0.005)a 16.3(3.9)ab 5.79(0.21)a 3.16(0.21)a 15.8(1.89)a 152(16.7)a 6.44(0.36)a AH_M 0.63(0.026)a 0.10(0.004)ab 0.47(0.022)ab 0.05(0.003)b 0.11(0.007)a 11(1.8)b 5.96(0.22)a 3.17(0.18)a 14.6(1.42) a 185(15.4)a 7.38(0.3)a AH_BCM 0.64(0.018)a 0.10(0.003)ab 0.51(0.028)a 0.04(0.002)ab 0.10(0.005)a 15.7(3.5)ab 6.08(0.2)a 3.5(0.1)a 16(1.99)a 142(7.61)a 6.58(0.4)a Treatments include control without amendment (CON), control with biochar-compost mix (CON_BCM), active heating without amendment (AH), active heating with mulching (AH_M), and active heating with biochar-compost mix (AH_BCM). Values are means of six replicated clones, with clones and locations treated as random effects and treatments as fixed effects. Standard errors are in parentheses, and different letters indicate significant differences based on Tukey's HSD test (p < 0.05). Correlation between wild blueberry quality traits, metabolites, and antioxidant activities
-
Berry pH was positively correlated with berry ripeness (TSS/TA) (Fig. 6). However, pH and berry ripeness were negatively correlated with titratable acidity (TA). Berry size and weight were positively correlated with water content but negatively correlated with total organic acids, total soluble protein, total sugars, TSS, total anthocyanins, and phenolic acid concentrations (Fig. 6). TSS showed positive correlations with total sugars, total organic acids, and phenolic acids, but no significant correlation with total anthocyanins (Fig. 6).
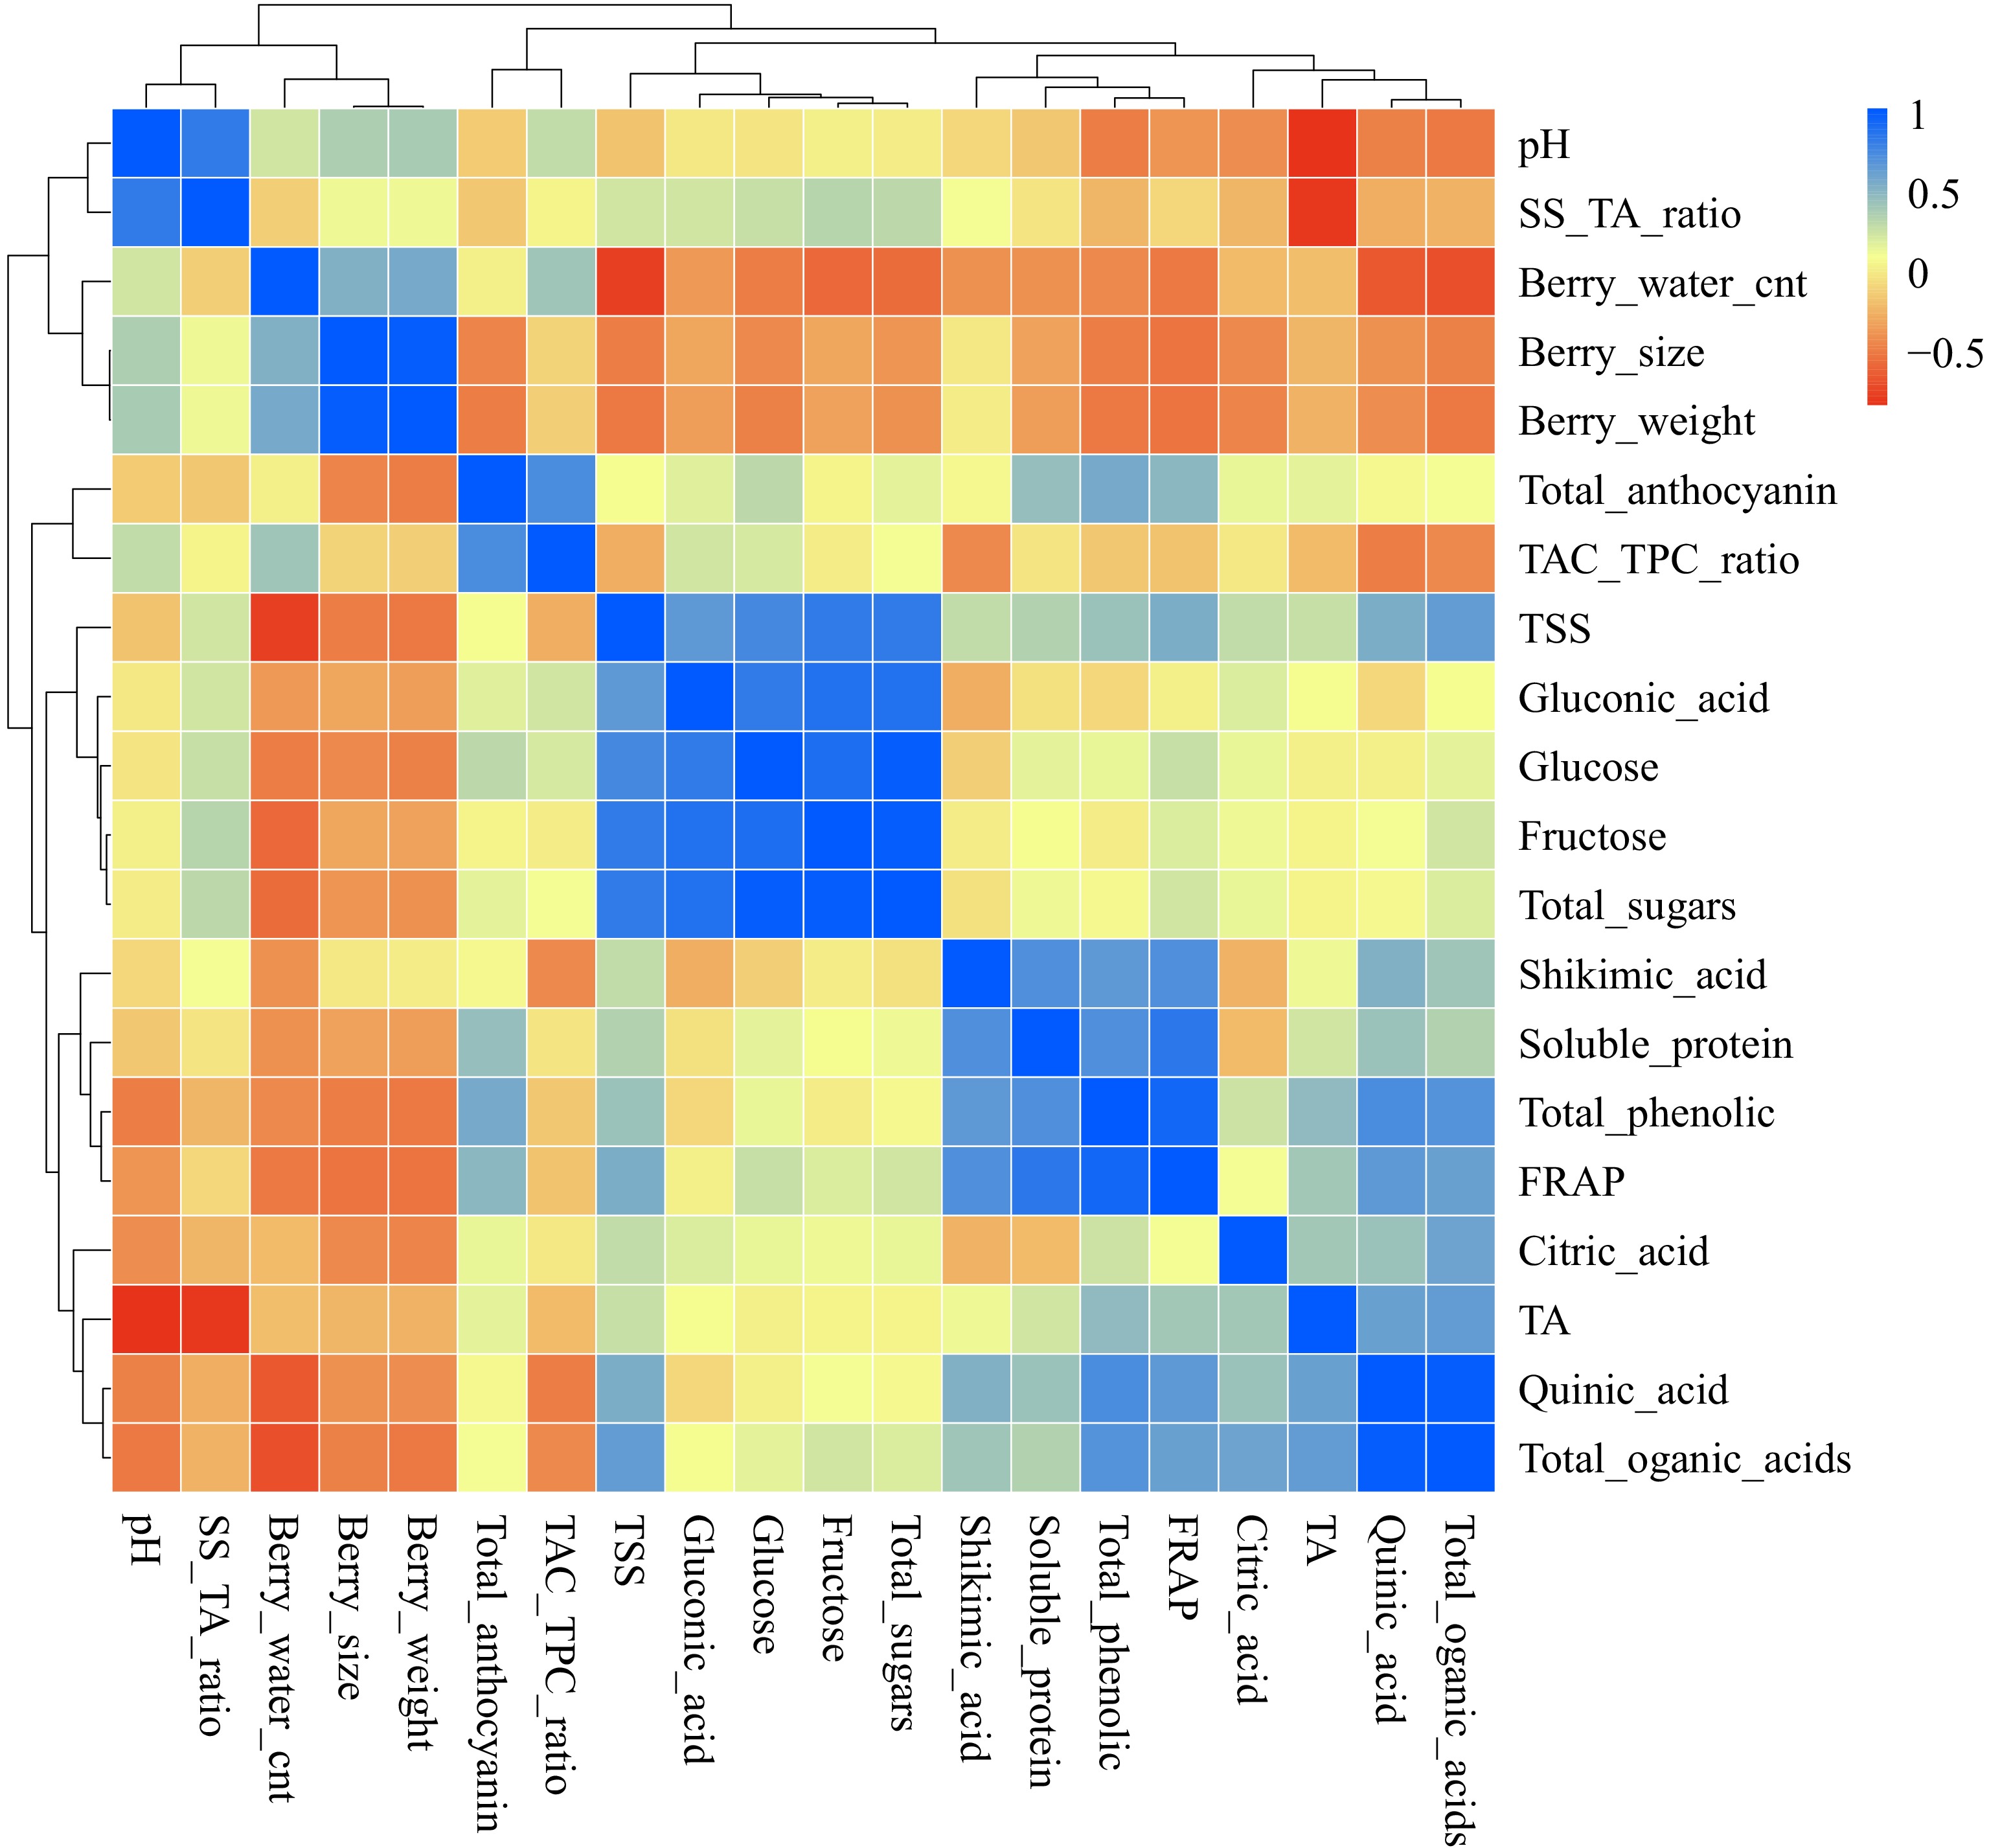
Figure 6.
Correlation analysis of nutritional quality traits, metabolites, and antioxidant activities in wild blueberries. Light-yellow boxes indicate traits with no correlations. Traits with cyan to blue colors represent positive correlations, while yellow to red indicate negative correlations. Groupings are as follows: berry pH and ripeness index (TSS/TA ratio); berry water content, size, and weight; anthocyanins and TAC/TPC; total soluble solids, fructose, glucose, and sugar-related compounds; and phenolic acids, antioxidant activities (FRAP), soluble proteins, titratable acidity, total organic acids, citric acids, and quinic acids.
Gluconic acids did not correlate significantly with total organic acids, but were positively correlated with glucose (Fig. 6). Soluble protein was positively associated with shikimic acid, phenolic acids, and antioxidant activities (FRAP). Notably, antioxidant activities (FRAP) showed a strong positive correlation with phenolic acids and a weak positive correlation with anthocyanins (Fig. 6).
-
The present study confirms the detrimental impact of warming on the nutritional quality of wild blueberries[4], which are known for their health benefits. While growers are primarily compensated based on fruit yield (weight or volume), the high concentration of health-promoting compounds, such as anthocyanins and phenolic acids, significantly contributes to the market value and consumer appeal of wild blueberries. Therefore, understanding the shifts in these quality attributes under future climate scenarios is crucial. Despite increases in berry potassium and magnesium concentrations due to biochar and mulching, our hypothesis that mulching and biochar-compost amendments would mitigate the negative effects of warming on fruit quality was not supported. The major organic acids and soluble sugars identified align with previous research. Citric, quinic, gluconic, and shikimic acids were the predominant organic acids in wild blueberries, while malic and isocitric acids were undetectable, consistent with earlier findings[4,32,52]. Fructose and glucose were also detected, but no sucrose in wild blueberries, in agreement with prior studies[4,32,52].
Warming has negative effects on the nutritional quality of wild blueberries
-
This study demonstrated a consistent reduction in total soluble protein and soluble solids in wild blueberries under warming, consistent with findings from our previous research[4]. Specifically, elevated temperatures decreased total soluble protein compared with ambient conditions, aligning with similar reductions observed in rice and wheat[53,54]. This reduction is likely due to the sensitivity of proteins, including enzymes, to heat stress[55]. In the context of global climate change, CO2 enrichment exacerbates this effect, lowering protein concentrations[56,57]. The decrease in total soluble solids under elevated temperatures in wild blueberries is also consistent with previous studies in other crops[4,58−61]. Elevated temperatures may accelerate fruit maturation, reducing total soluble solids[61,62]. Furthermore, an alternative or potentially contributing factor to the observed reduction in TSS, protein, and other metabolites could be a dilution effect stemming from changes in berry size and water content under warming. As noted in the initial hypotheses and supported by negative correlations observed between berry size and concentrations of TSS, anthocyanins, and phenolics, if warming leads to larger berries potentially through increased water uptake or altered assimilate partitioning[63], this could result in lower concentrations of key quality compounds per unit fresh weight if synthesis of these compounds did not increase. In contrast, TSS in apples showed no change or increased under elevated temperatures[64]. Fructose concentration did not significantly change in warming plots without amendment (AH), compared with the ambient control (CON), contradicting our previous findings where fructose was reduced[4].
Phosphorus mineral concentrations, essential for metabolic processes, were significantly lower under elevated temperatures than in ambient conditions. This decrease is likely due to the correlation between total soluble solids and phosphorus levels[65]. High temperatures negatively affect macrominerals and microminerals, possibly through induced water stress[66,67], which was also detected in the present study system[63].
Elevated temperatures also reduced total anthocyanin and phenolic acid concentrations, thus decreasing antioxidant activity in wild blueberries. Gene expression analysis has shown that many genes involved in flavonoid biosynthesis are down-regulated under heat stress, leading to lower anthocyanin and flavonoid levels in fruits like grapes, kiwifruit, and strawberries[68−72]. In contrast, increased anthocyanin, flavonoid, and antioxidant properties under elevated temperatures were also found in strawberries[73], while our previous study carried out in 2019 and 2020 did not find significant changes in anthocyanin, phenolic acids, and flavonoids of wild blueberries under elevated temperatures[4]. These discrepancies may be due to variations in environmental conditions.
Limited impact of soil amendments on berry nutritional quality
-
Over two years, mulching and biochar-compost mix treatments did not significantly mitigate the adverse effects of warming on the nutritional quality of wild blueberries. Biochar-compost mix and mulching slightly alleviated the warming impact on phosphorus, potassium, and magnesium, which is consistent with previous findings that biochar increases these macronutrients in soil[24]. However, the present results showed that these amendments did not affect citric, quinic, or total organic acid levels, contrary to studies suggesting that biochar aids in organic acid storage in berries[74,75]. Additionally, biochar-compost mix and mulching did not significantly influence fructose content, aligning with research indicating that wood-based biochar does not affect total soluble sugars in grapes and tomatoes[23,29].
Under ambient conditions, the biochar-compost mix significantly increased total soluble protein compared with the control, suggesting potential benefits. However, the amount of biochar-compost mix used in the warming plots was insufficient to counteract the adverse effects of elevated temperatures on soluble protein. Neither biochar-compost mix nor mulching mitigated the adverse effects of high temperatures on secondary metabolites, including anthocyanins, potentially reducing the health benefits of wild blueberries[76]. These amendments also did not affect micromineral concentrations, which remained adequate under warming conditions.
Contrary to findings that biochar has a positive impact on total acidity (TA) and total soluble solids (TSS) in field-grown tomatoes[77], biochar and mulching did not significantly mitigate warming effects on titratable acidity (TA) and total soluble solids (TSS), thus impacting the sweetness indicators of wild blueberries. However, the biochar-compost mix maintained the ripeness index under warming, suggesting it may help preserve ripeness and flavor qualities in stressful conditions. Similarly, biochar maintained the ripeness index in drought-stressed tomatoes[78]. The ripeness index is commonly assessed as the ratio of TSS to TA in various fruit crops, including blackberries and blueberries[43,79].
Berry size and pH in relation to berry nutritional quality
-
A positive correlation was observed between berry pH and the TSS/TA ratio, indicating that pH may be linked to berry ripeness and maturity. This finding aligns with a previous study on highbush blueberries, which suggested that ripeness could be pH-dependent[43]. Similarly, ripe desert melon exhibits reduced acidity due to genetic traits, leading to a sweeter taste[80].
Additionally, berry size was negatively correlated with total anthocyanin and phenolic acid concentrations, suggesting that smaller berries contain higher levels of these antioxidants. This relationship may be attributed to the fruit skin of small berries having a higher surface area-to-volume ratio[81]. Larger berries also showed lower total soluble solids. These findings suggest that a dilution effect may contribute to the reduced concentrations of quality attributes observed under warming, particularly if warming conditions promoted larger berry size as previously reported in this system[63,82], while nutrient uptake and the synthesis of anthocyanin and phenolic acid did not increase. Soil amendments like biochar-compost mix (BCM) and mulching did not significantly affect average berry size under warming, consistent with findings that biochar amendments do not alter tomato size[29].
Berry size and weight were positively correlated with water content in wild blueberries, which is also found in grapes[83]. Increased berry size might be a water conservation strategy under warming stress. A previous study reported that elevated temperatures can increase wild blueberry size and weight, potentially due to enhanced plant-level carbon assimilation and extended growing seasons[63]. Such an increase in berry size could plausibly lead to the dilution of accumulated sugars, acids, and secondary metabolites if the other processes, like nutrient uptake and the synthesis of sugars and proteins, did not increase.
-
To conclude, this study underscores the adverse effects of elevated temperatures on the nutritional quality of the superfood wild blueberries. Soil amendments, including biochar-compost mix and mulching, did not significantly mitigate these effects, except for minor improvements in potassium and magnesium concentrations. The detrimental impact of warming is probably primarily due to temperature-induced changes in metabolic processes, which cannot be fully countered by enhancing soil water and nutrient availability. Further research is needed to explore higher application rates of biochar-compost mix or foliar fertilizers to mitigate the warming-induced decreases in P and K, and to gain a deeper understanding of the physiological and biochemical mechanisms underlying the observed warming effects. This understanding is essential for developing effective techniques to preserve the nutritional value of wild blueberries in a warmer climate.
We extend our gratitude to Joshua Stubbs, Christopher McManus, and Rafa Tasnim for their work in constructing the chambers and overseeing farm management. We also appreciate the assistance of Philippe Nzarama, Cole Alexander, and Ali Bello with sample collection and field measurements. Through the Maine Agricultural and Forest Experiment Station, this project received support from the USDA National Institute of Food and Agriculture, Hatch Project Number ME0-22021 and ME0-22502. Additional funding was provided by the USDA NRCS (NR221218XXXXG003), University of Maine Faculty Summer Research Award, the Wild Blueberry Commission of Maine, Jasper Wyman & Son Inc., and the Maine Department of Agriculture, Conservation, and Forestry (SCBGP).
-
The authors confirm their contributions to the paper as follows: study conception and design: Zhang YJ, Alaba OA; experiments conduction, data curating, analysis and visualization: Alaba OA, Pierce A, and Perkins B; project supervision: Zhang YJ; original manuscript writing: Alaba OA. All authors reviewed the results and approved the final version of the manuscript.
-
The datasets generated during and/or analyzed in the current study are available from the corresponding author on reasonable request.
-
The authors declare that they have no conflict of interest.
- Copyright: © 2025 by the author(s). Published by Maximum Academic Press, Fayetteville, GA. This article is an open access article distributed under Creative Commons Attribution License (CC BY 4.0), visit https://creativecommons.org/licenses/by/4.0/.
-
About this article
Cite this article
Alaba OA, Pierce A, Perkins B, Zhang YJ. 2025. Negative impacts of warming on the nutritional quality of wild blueberries: mulch and biochar-compost mix as mitigation techniques. Fruit Research 5: e041 doi: 10.48130/frures-0025-0032 

Negative impacts of warming on the nutritional quality of wild blueberries: mulch and biochar-compost mix as mitigation techniques
- Received: 27 February 2025
- Revised: 15 September 2025
- Accepted: 19 September 2025
- Published online: 27 November 2025
Abstract: Climate change poses threats to the yield and nutritional quality of crops, and effective mitigation strategies are needed. Management practices such as mulching, biochar, and compost offer potential solutions. The objectives of this study were to characterize the effect of warming on the fruit chemistry and nutritional quality of wild blueberry (Vaccinium angustifolium Aiton), as well as to determine the efficacy of biochar-compost mix and mulching in mitigating the warming effect. Thus, six wild blueberry clones were subjected to five treatments: ambient control, ambient control with biochar-compost mix, warming, warming with softwood bark mulch, and warming with biochar-compost mix. Warming negatively impacted fruit nutritional quality, resulting in significant decreases in total soluble solids (~5%), total anthocyanin content (~23%), total phenolic content (~20%), and FRAP antioxidant activity (~19%) under active heating compared to the control. Total soluble protein levels were significantly reduced (~30%) when warming combined with biochar was compared with the biochar control. Neither the biochar-compost mix nor mulching substantially alleviated these adverse effects, except for modest improvements in potassium and magnesium concentrations. Additionally, berry size was negatively associated with total soluble solids, organic acids, and secondary metabolites. Our findings confirm the negative effect of warming on the nutritional quality of these nutrient-dense berries and suggest that the soil amendments of softwood mulch and biochar-compost mix (at the rates tested) were insufficient to counteract the detrimental effects of warming. Future research could explore higher application rates and alternative techniques, such as foliar fertilizers, to enhance the resilience of wild blueberries under global warming.
-
Key words:
- Soil amendments /
- Global warming /
- Fruit biochemistry /
- Perennial crops /
- Wild blueberry