











-
During the 19th century, the majority of Americans lived in rural areas, and small-scale fruit cultivation was the norm. These cultural practices promoted seed-raised fruit and cross-pollination, which, as a result, led to a global increase in the number of fruit cultivars. In response to this remarkable proliferation of fruit cultivars in the United States, the US Department of Agriculture (USDA) commissioned a series of watercolor illustrations to ensure accurate documentation and reliable identification of these cultivars[1]. Created between 1886 and 1942 by 21 artists, this collection of over 7,000 watercolors—including 3,807 apple illustrations—represents one of the most extensive visual archives of historic apple diversity[1,2]. While artistically striking, the primary goal of these works was scientific: to faithfully capture the characteristics of fruit cultivars for reference and classification[2]. Moreover, this collection highlights the changes in American fruit production and documents the heirloom cultivars found during the time the watercolors were commissioned.
The USDA National Plant Germplasm System (NPGS) apple collection is among the largest and most diverse collections in the world, with over 6,000 unique apple (Malus spp.) cultivars[3,4]. It preserves genetic diversity from wild crabapple relatives and historical and modern apple cultivars, which reflect regional adaptation and cultural practices in apple production. This collection not only serves as a resource for breeding programs and conservation efforts but also provides a living record of apple diversity worldwide. In 2020, a major Fire Blight (Erwinia amylovora) outbreak decimated part of the collection[5]. This unfortunate event highlights the importance of continuing to accurately document the phenotypic diversity of this collection in case living specimens are lost. For this purpose, the Germplasm Resources Information Network (GRIN) database is an important source of documentation for morphological, phenological, and agronomic traits across the collection, as well as a database for storing genotypic information[6]. GRIN also provides photographs of many accessions, which are an invaluable resource for cultivar characterization.
Misidentification, mislabeling, and synonyms (one genotype with multiple names) are common among apple cultivars. Traditional methods of identification, such as morphological and taxonomic traits, can be unreliable due to the high phenotypic variability within a single cultivar grown under different environmental or horticultural conditions[7]. Moreover, many 19th-century apple cultivars are morphologically similar to each other, and the loss of cultivar identity documentation over time has further complicated accurate identification, making conventional identification methods difficult, if not impossible, for these century-old cultivars[7,8]. For example, in the USDA-ARS NPGS apple collection, DNA fingerprinting revealed that several accessions previously thought to be distinct cultivars were genetically identical, indicating mislabeling or duplicates within the collection[9], as well as among wild crabapple accessions[10].
Digital phenotyping has been increasingly used in fruit species to estimate key traits, such as fruit color in grapes[11] and fruit weight and size in blueberries[12]. In apples, several image analysis methods have been developed[13−15] and successfully used to investigate the genetic basis of important visual traits, including leaf morphology[16], fruit shape[17], skin color[17], and flesh color[18]. Digital phenotyping has been deployed on large datasets, comprising thousands of apple cultivars, for studying phenotypic diversity of complex traits such as leaf morphology, fruit size, and fruit shape[16,19]. More recently, object detection models such as You Only Look Once (YOLO), which are based on convolutional neural networks (CNNs), have demonstrated strong performance in object detection tasks. These models have been adapted to apple research for segmentation tasks, such as tree segmentation[20], flower detection[21], and fruit segmentation[12,22−24]. The application of deep learning for complex segmentation tasks, together with robust image analysis protocols, is a prerequisite for deploying digital phenotyping directly in orchards and for advancing the use of phenomics in horticulture[25].
In this study, we applied digital phenotyping to assess the consistency between the USDA watercolor pomological collection and photographs of the NPGS apple collection. Using a YOLOv8 model, we extracted fruit images from the watercolors and photographs stored in the GRIN database and then estimated color and texture features for 114 photographs and 487 watercolors to identify potential mislabeling. This work highlights both the historical significance of the USDA collection and the importance of preserving apple diversity.
-
Red-Green-Blue (RGB) scans of apple watercolors from the USDA Pomological Collection were obtained from the USDA National Agricultural Library website (US Department of Agriculture, National Agricultural Library [2015]). The original paintings were digitized using a flatbed scanner at 600 DPI and are available as JPEG images encoded in the sRGB color space at 8-bit color depth. A total of 3,233 images depicting both apple skin and flesh sections were selected for further analysis and designated as the 'watercolor' dataset. No additional post-processing was applied to the downloaded images.
Additionally, 1,472 photographs of apple cultivars from the USDA Apple Collection were retrieved from the GRIN-Global database and designated as the 'photograph' dataset (Fig. 1a). These images were acquired using a camera and are provided as JPEG files in the sRGB color space at 8-bit color depth. No additional post-processing was applied to the downloaded images.
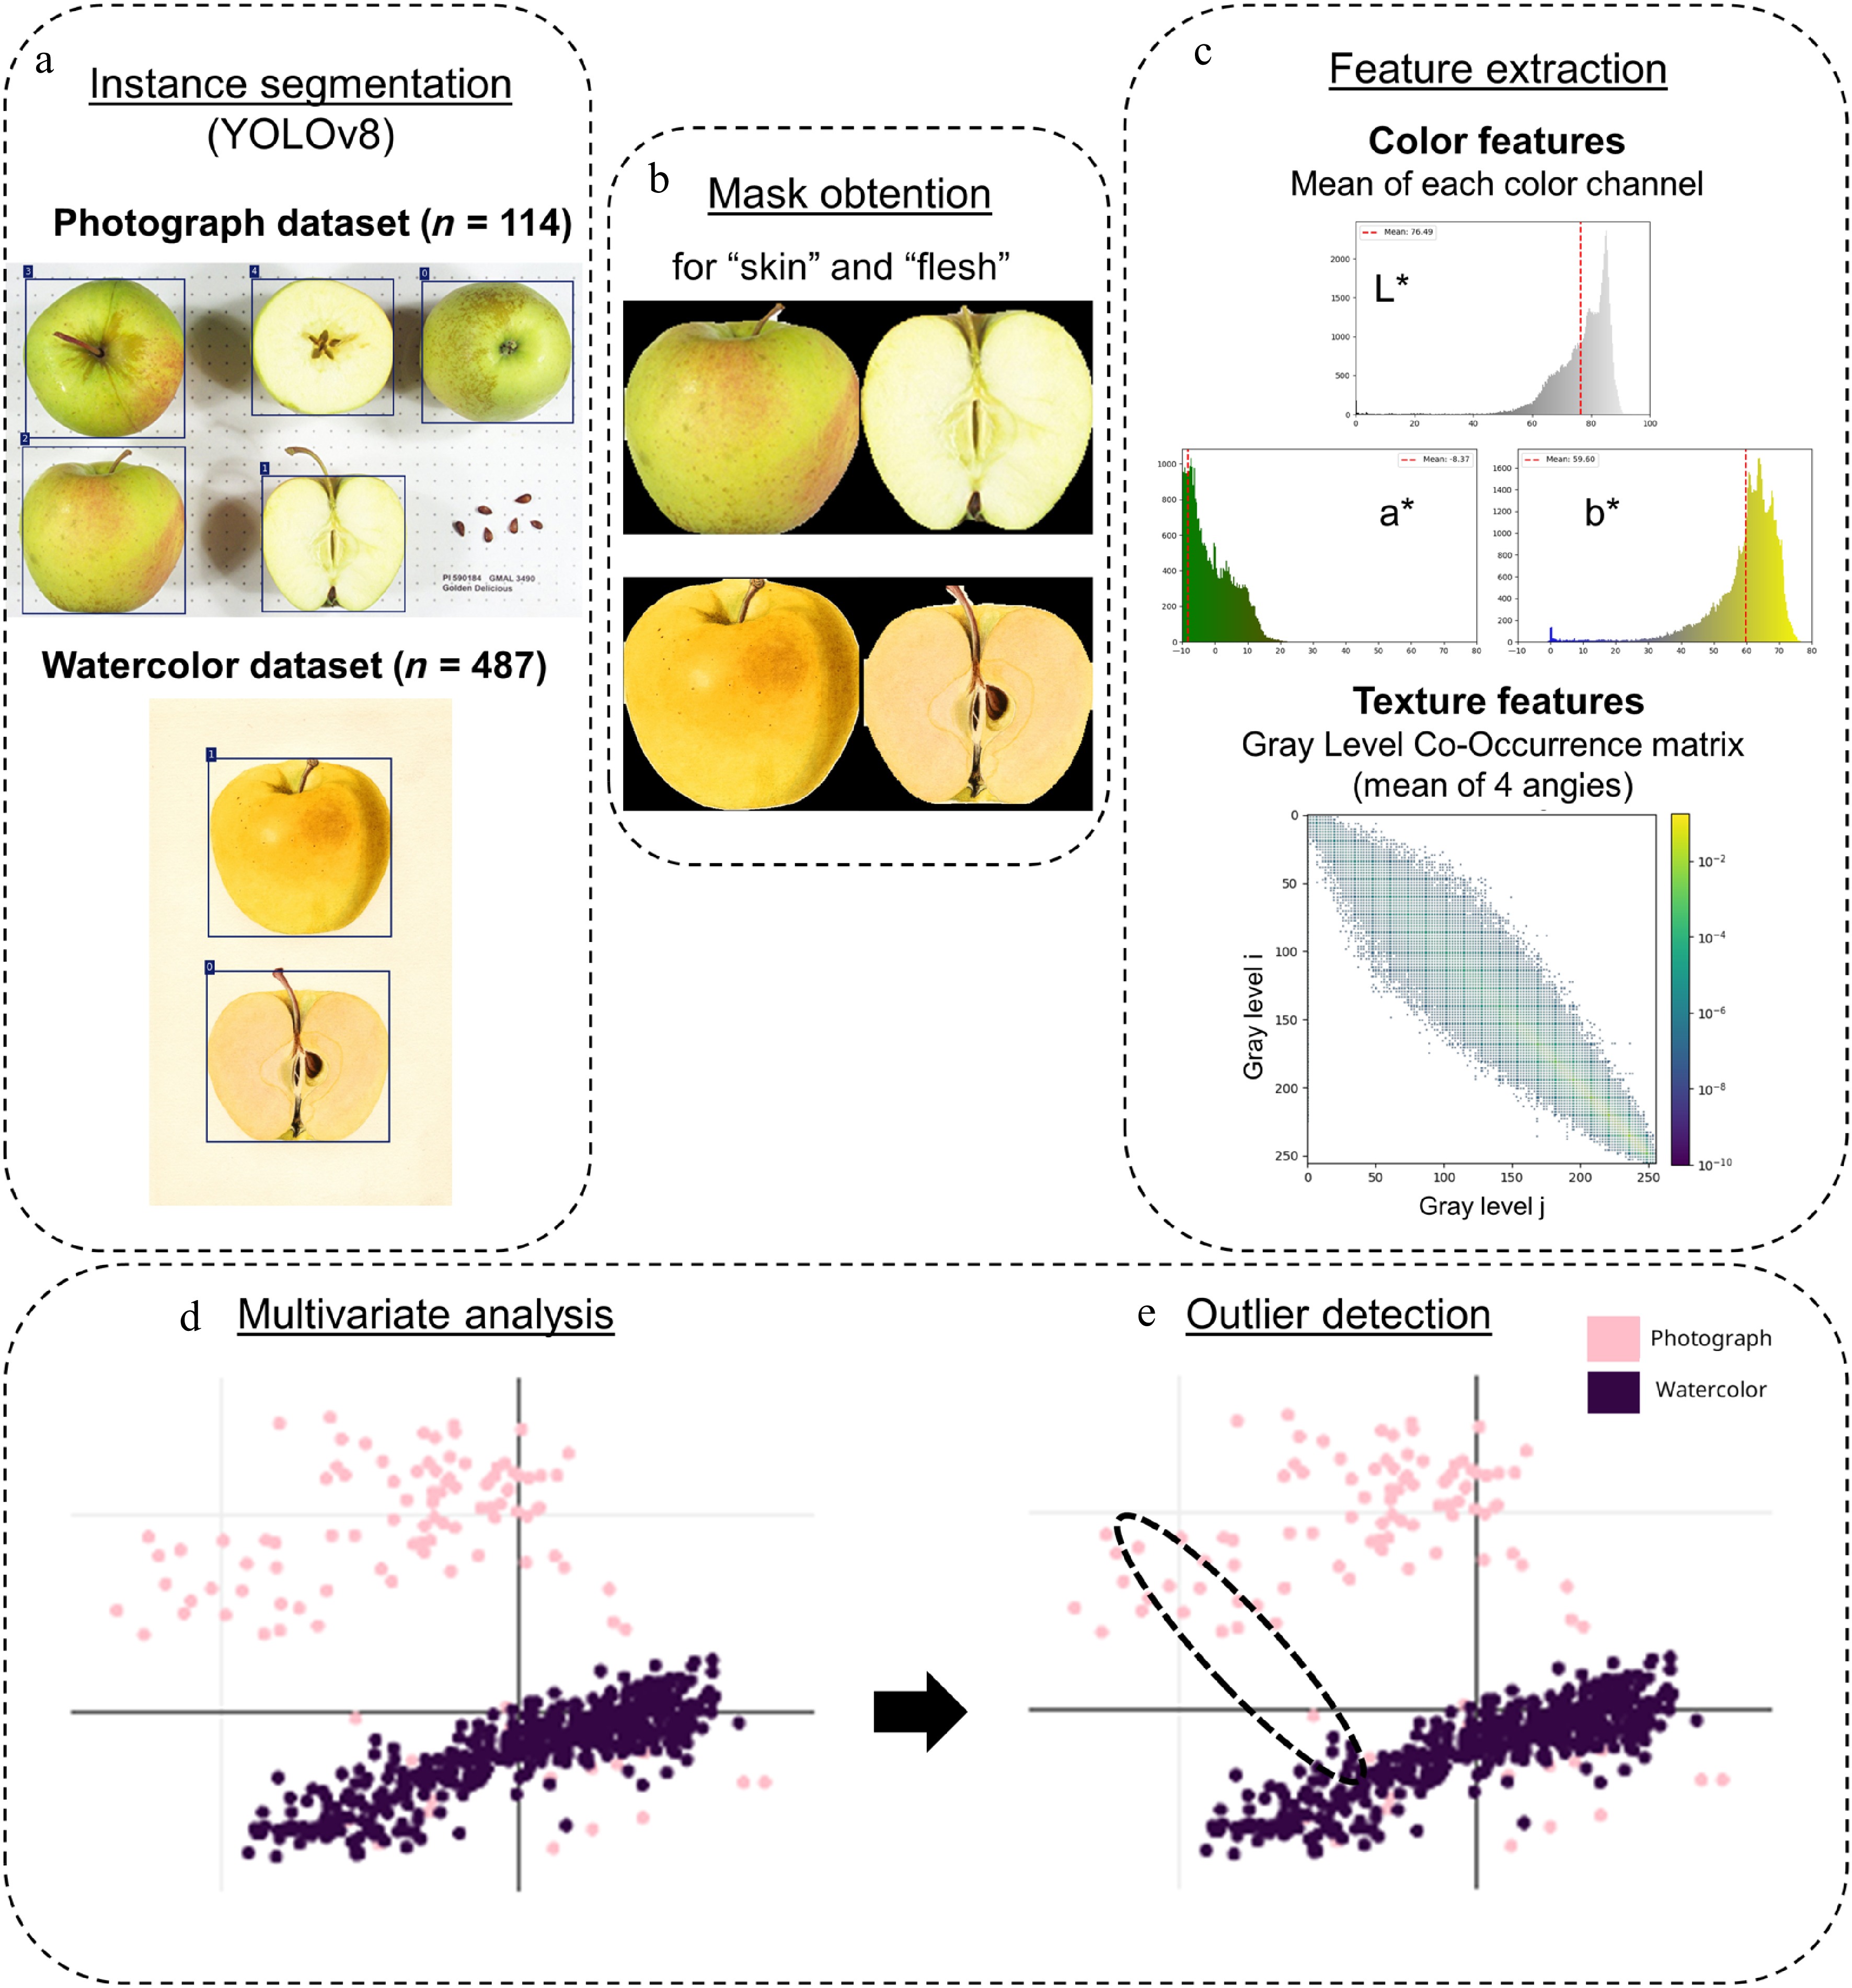
Figure 1.
Workflow for image segmentation and analysis. (a) Example images from GRIN photographs and USDA watercolors. (b) YOLOv8 segmentation masks for apple skin and flesh. (c) Extraction of color features in CIELab* space and texture features using gray-level co-occurrence matrices (GLCMs). (d) Principal component analysis was performed using these 14 features on both photographs and watercolors. (e) Outliers were detected using watercolor-photograph distance in the multivariate space. Euclidean distances of each photograph-watercolor pair of a same accession were calculated as $ d=\sqrt{{\left({x}_{1P}-{x}_{1W}\right)}^{2}+{\left({x}_{2P}-{x}_{2W}\right)}^{2}} $ where $ {x}_{1P},{x}_{2P} $ are the coordinates of the photograph and $ {x}_{1W},{x}_{2W} $ are those of the watercolor.
Fruit segmentation using YOLOv8
-
Annotated datasets were created using the Roboflow application[26]. For the watercolor dataset, 200 images were manually annotated by tracing object boundaries, with two classes: 'Skin' and 'Flesh'. For the photograph dataset, 100 images were manually annotated by tracing object boundaries, with five classes: 'Overall', 'Frontal Section Flesh', 'Transverse Section Flesh', 'Stem Cavity', and 'Calyx'. In this dataset, the classes 'Overall' and 'Frontal Section Flesh' corresponded to the 'Skin' and 'Flesh' sections, respectively (Fig. 1b).
Instance segmentation was performed using YOLOv8. Datasets were imported from Roboflow, and training was conducted in Google Colab using a Tesla T4 GPU with the following settings: 'model' = yolov8n-seg.pt, 'epochs' = 500, 'batch' = 4. The watercolor dataset model and photograph dataset were trained on image sizes of 800 × 800 and 1,800 × 1,800 pixels, respectively. The segmentation models were then used to predict and extract object masks corresponding to the annotated classes.
Segmented objects were extracted from images using a custom Python pipeline (
https://github.com/pibouillon/pictura_pomologica ). Masks generated by the YOLOv8 model were post-processed by morphological closing and contour filling to ensure clean segmentation (Fig. 1b). Segmented image dimensions varied across both datasets. For the watercolor dataset, image dimensions ranged from 523 × 523 to 1,786 × 1,786 pixels, with a mean of 1,208 × 1,208 pixels (N = 3,233). For the photograph dataset, image dimensions ranged from 67 × 67 to 1,528 × 1,528 pixels, with a mean of 306 × 306 pixels (N = 1,472).Quantification of features
Color features extraction
-
Color features were extracted from the segmented object regions as described in[15]. Each image was converted to CIEL*a*b* color space where L* represents lightness (L* = 0 corresponds to black and L* = 100 to white). The a* channel typically ranges from −128 (green) to +127 (red), and the b* channel from −128 (blue) to +127 (yellow). For every segmented region, the mean and standard deviation were computed for each channel across all color spaces (Fig. 1c; Supplementary Fig. S1). These color features were extracted separately for the 'Flesh' and the 'Skin' annotated classes in both datasets.
Due to limitations in the image acquisition setup and to minimize biases caused by different exposure settings and cameras, the mean color feature was ranked using k-means clustering (k = 5) to correspond with the visual notation scale commonly used by experts for assessing fruit color[15]. These ranks were then used as color features in the downstream analyses.
Texture features extraction
-
Texture features were quantified using Haralick features[27] derived from the gray-level co-occurrence matrix (GLCM)—which capture spatial relationships between pairs of pixel intensities—of the segmented regions (Supplementary Fig. S2). Images were converted to CIELab* color space, and a composite channel was created from the a* and b* components. The a* (green–red) and b* (blue–yellow) channels were extracted, centered by subtracting 128, and normalized to the range [−1, 1]. A grayscale texture representation was generated by averaging the normalized a* and b* channels, rescaling the result to the range [0, 1], and converting to 8-bit intensity values (Fig. 1c). This grayscale image served as the input for texture feature extraction. Foreground regions corresponding to the apple surface were identified by masking out black background pixels.
For each image, GLCMs were computed using the graycomatrix function from scikit-image[28] with a pixel pair distance of 1 and four directions (0°, 45°, 90°, and 135°)[29]. The matrices were computed symmetrically and normalized so that their elements summed to 1. Four Haralick texture features—contrast, energy, homogeneity, and correlation—were extracted using the graycoprops function[27] and averaged across directions to yield a single value per image. These features quantify local gray-level variation (contrast), textural uniformity (energy), smoothness of gray-level transitions (homogeneity), and linear dependencies of neighboring intensities (correlation).
• Contrast describes local variations in gray-level intensities:
$ \text{Contrast} = \sum\limits_{i=1}^{N}\sum\limits_{j=1}^{N}{\left(i-j\right)}^{2}\cdot P\left(i,j\right) $ • Energy describes the textural uniformity:
$ \text{Energy}=\sqrt{\sum\limits_{i=1}^N\sum\limits_{j=1}^NP\left(i,j\right)^2} $ • Homogeneity describes how smoothly the gray-level intensities vary across the image:
$ \text{Homogeneity}=\sum\limits_{i=1}^N\sum\limits_{j=1}^N\frac{P\left(i,j\right)}{1+\left(i-j\right)^2} $ • Correlation describes the linear dependency of gray-level intensities in neighboring pixels:
$ \text{Correlation}=\sum\limits_{i=1}^N\sum\limits_{j=1}^NP\left(i,j\right)\left[\frac{\left(i-\mu_i\right)\left(j-\mu_j\right)}{\sqrt{\left(\sigma_i^2\right)\left(\sigma_j^2\right)}}\right] $ where,
$ P(i,j) $ $ i $ $ j $ $ N $ $ {\mu }_{i},{\mu }_{j},{\sigma }_{i},{\sigma }_{j} $ Statistical analysis
-
From the initial datasets, a subset of 114 accessions was selected because they were represented in both photographs and watercolors. This resulted in the selection of 598 files, comprising 114 photographs and 487 watercolors. A principal component analysis (PCA) was performed on this dataset, including 598 individuals × 14 features corresponding to the color and texture descriptors of both skin and flesh (Fig. 1d). The features were normalized prior to PCA. The first two principal components were then considered, given that they explained the highest proportion of total variance and performed the best discrimination between watercolor and photograph datasets. Euclidean distances on the two dimensions were calculated for each photograph-watercolor pair of the same accession (Fig. 1e) following the formula:
$ d=\sqrt{{\left({x}_{1P}-{x}_{1W}\right)}^{2}+{\left({x}_{2P}-{x}_{2W}\right)}^{2}} $ where,
$ {x}_{1P},{x}_{2P} $ $ {x}_{1W},{x}_{2W} $ To identify photograph–watercolor pairs that were outliers in the dataset, we applied the standard deviation (SD) method. Distances that fell outside the interval defined by the mean ± 1.5 SD were considered outliers and visually examined.
-
Color features were extracted for the 114 photographs and 487 watercolors (Supplementary Table S1). k-means clustering (k = 5) was performed on the mean values for the L*, a*, and b* color channels to correspond with the visual notation scale. Overall, rank distributions were consistent among the two datasets (Supplementary Fig. S3). For skin color, the mean ranks for photographs and watercolors were 2.67 and 2.89 for L*, 3.18 and 3.46 for a*, and 2.63 and 3.06 for b*, respectively. For flesh color, the corresponding mean ranks were 3.78 and 3.38 for L*, 2.94 and 2.54 for a*, and 2.97 and 3.04 for b*.
Texture features were extracted for both photographs and watercolors (Supplementary Table S1). For skin texture features, the mean values for photographs and watercolors were 0.966 and 0.995 for correlation, 0.641 and 0.755 for homogeneity, 0.217 and 0.216 for energy, and 256.71 and 45.22 for contrast. For flesh texture features, the mean values were 0.962 and 0.992 for correlation, 0.747 and 0.829 for homogeneity, 0.273 and 0.273 for energy, and 227.75 and 45.92 for contrast.
Pairwise comparisons of texture features for flesh and skin were performed across all datasets (Supplementary Fig. S4). For both skin and flesh, correlation and homogeneity were significantly higher in watercolors than in photographs (Supplementary Fig. S4), reflecting smoother and more uniform textures in the painted fruit. This is partly due to the use of the original paper color for representing flesh in watercolors and the fact that some textures—such as russeting, lenticels, or complex stripe patterns—are more challenging to reproduce. In contrast, photographs displayed markedly higher contrast (Supplementary Fig. S4), capturing small defects, natural variations, and local intensity changes that are typically idealized or absent in watercolors. No significant differences were observed for energy. Overall, these findings suggest that watercolors tend to emphasize idealized, homogeneous fruit surfaces, while photographs preserve detailed, heterogeneous textures.
Principal component analysis and outlier detection
-
PCA was performed on the combined features to explore overall variation and identify potential outliers. The first three principal components (Supplementary Fig. S5) explained 70.1% of the variance (PC1: 38.2%, PC2: 20.3%, and PC3: 11.6%). PCA score plots (Supplementary Fig. S5) showed that most samples clustered according to dataset type (photographs vs watercolors) along dimensions 1 and 2. Consequently, these first two axes were considered for further study. Correlation, homogeneity, and contrast contributed mostly to dimension 1, while the mean and variance of L* and the mean of a* contributed to dimension 2 (Fig. 2). These results confirmed the accuracy of texture features in discriminating between photographs and watercolors. The Euclidean distance between each photograph–watercolor pair for the same accession was calculated to identify outliers. Ten photograph–watercolor pairs were identified as outliers and reported in Table 1 and Supplementary Table S2.
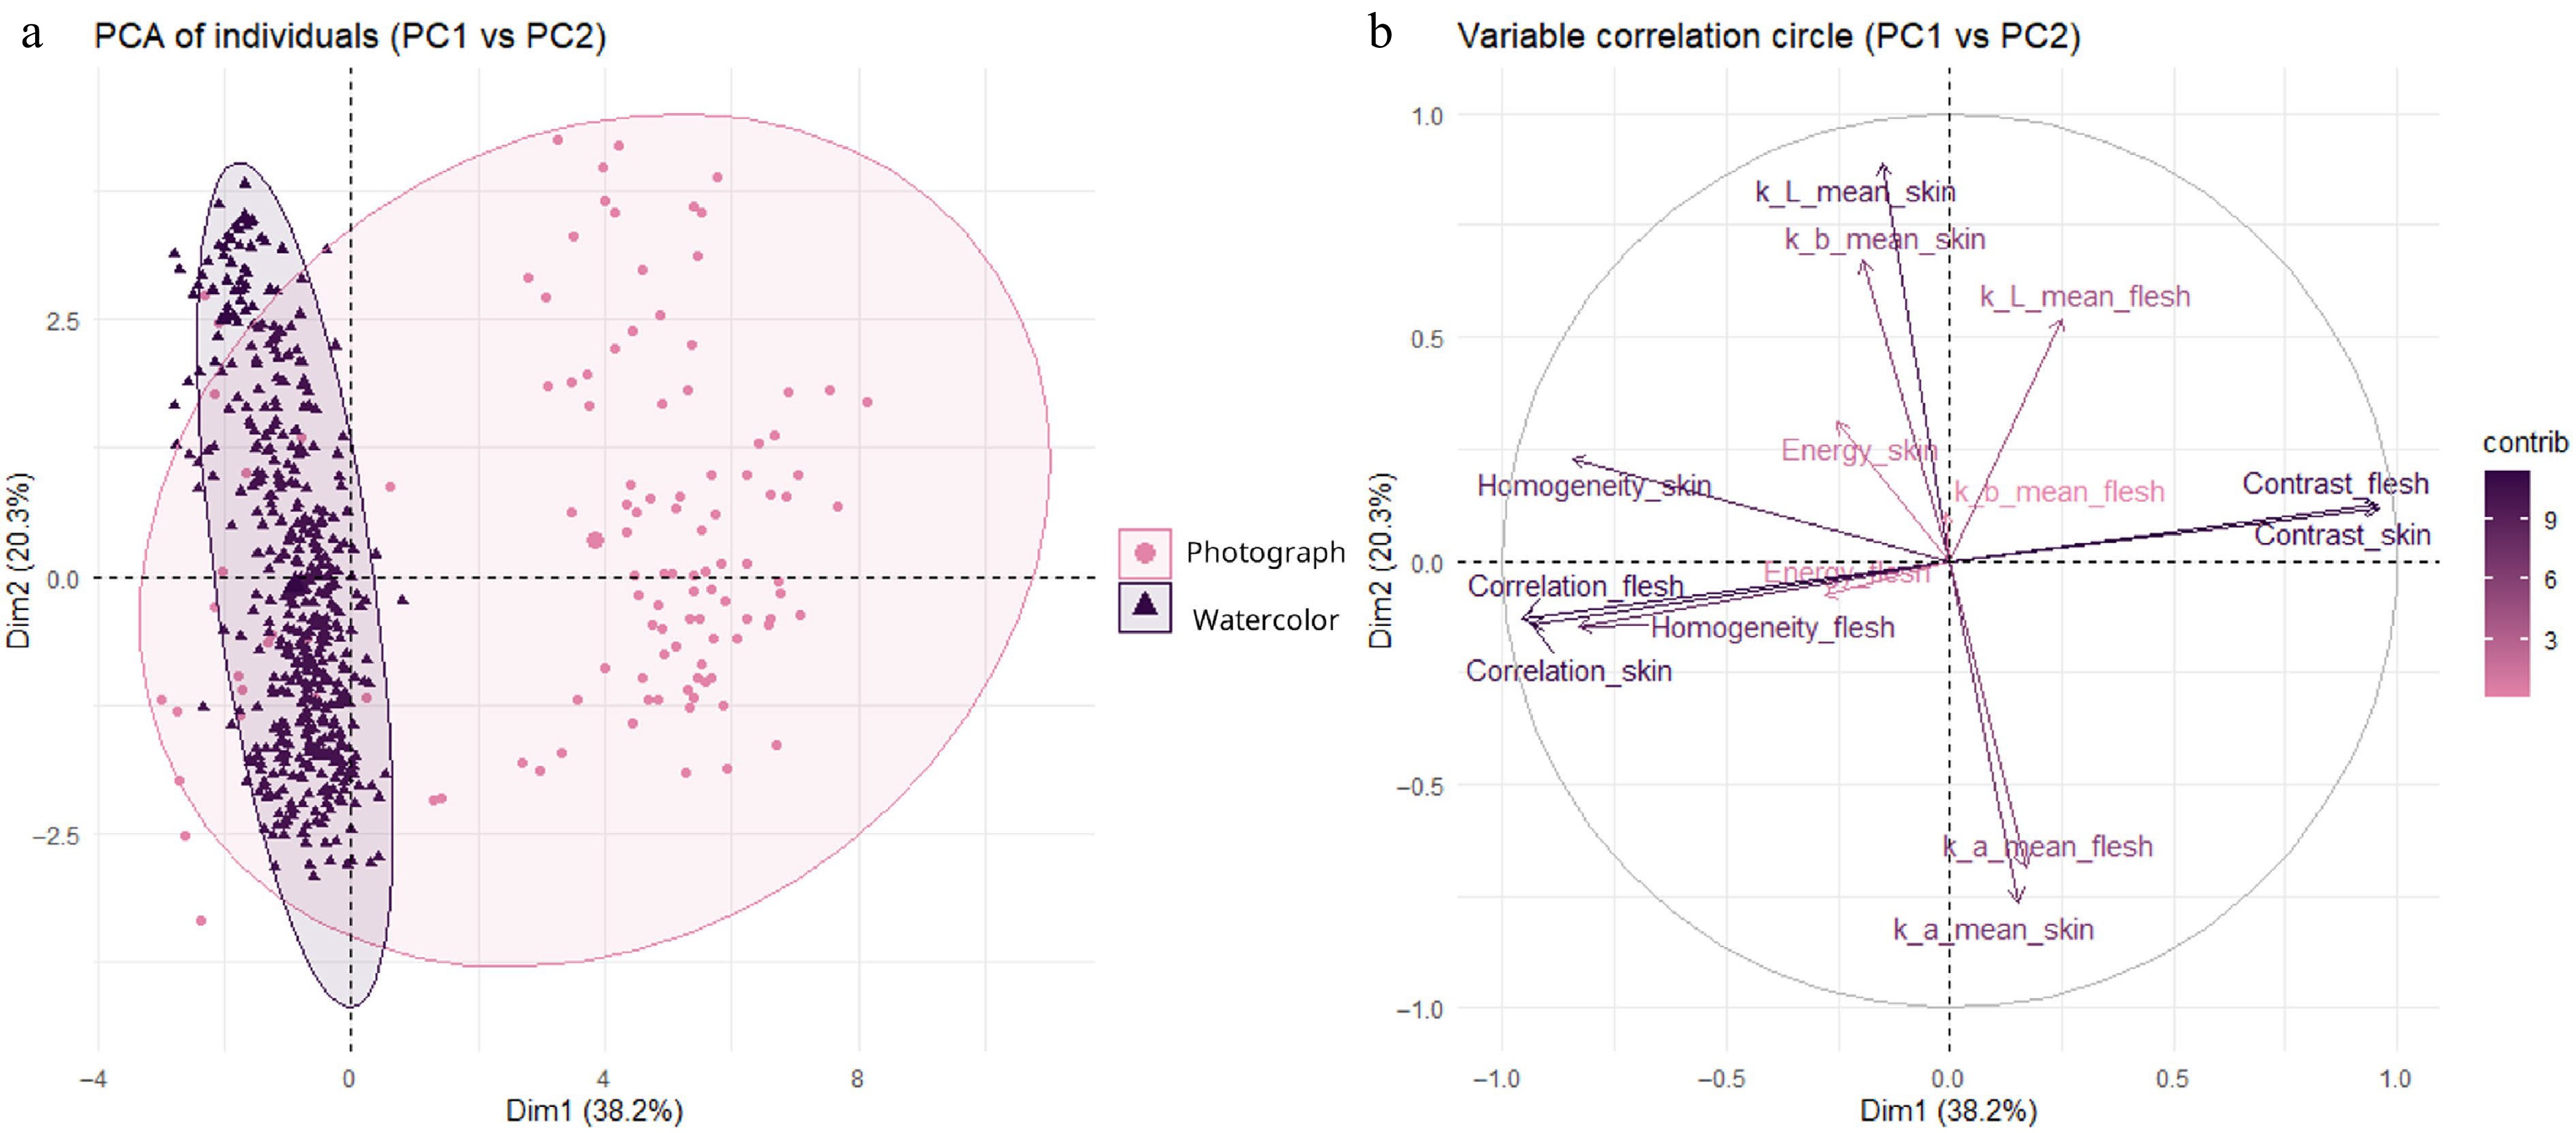
Figure 2.
Principal component analysis (PCA) of color and texture features for apple watercolors and photographs. Watercolors and photographs are projected onto the first two principal components, with (a) a scores plot showing photographic (pink) and watercolor (blue) individuals, and (b) a variable correlation circle indicating the contribution and direction of color and texture features to PC1 and PC2.
Table 1. Photograph–watercolor pairs identified as outliers based on PCA distance analysis. Notes indicate possible causes of inconsistency.
Photograph–Watercolor pair Notes 
Hawkeye
PI 590026
POM00002281 (1938)
'Hawkeye' is a synonym for Delicious, which was later renamed as 'Red Delicious' to distinguish it from 'Golden Delicious'. The Red Delicious is known as a large, round to conic apple with smooth skin, washed red, and often ranging to dark red in many mutations and seedlings.
Photograph and watercolor depict two fruits with different skin colors and shapes.
Strong probability that the watercolor represents a different genotype.
Clarke
PI 392306
POM00001705 (1921)
Photograph does not match watercolor or written description. Watercolor (1921, Mary Daisy Clarke; Arlington Farm, VA) matches historical descriptions recorded in GRIN and contemporary pomological sources.
Mismatch is likely due to homonymy (two cultivars named 'Clarke'), possibly NY origin vs Tasmanian re-donation (GRIN Passport data and HP Gould[30] do not resolve this).
Milton
PI 588956
POM00002637 (1933)
HP Gould[30] does not list 'Milton', limiting historical cross-validation.
Five watercolors exist; four are consistent with each other and with the photograph. This watercolor differs strongly in color but shares a similar shape with the photograph.
Mismatch explained by a non-representative watercolor specimen rather than misidentification.
Lodi
PI 588878
POM00002719 (1937)
POM00002720 (1935)
Photograph and watercolor differences likely due to fruit maturity.
No strong evidence for cultivar mismatch; differences attributable to fruit maturity and watercolor technique rather than identity error.
Bedford Red
PI 589121
POM00001466 (1913)
HP Gould[30] does not include this cultivar (likely not observed at Arlington Farm).
Photograph shows underripe, poorly colored fruit. Watercolor shows red, striped fruit consistent with GRIN Passport description.
Mismatch explained by fruit maturity, not mislabeling.
Barry
PI 589428
POM00001203 (1901)
HP Gould[30] explicitly states 'Checks with painting #22549 very well' and cross-references[31]. Historical descriptions[31] match the watercolor closely.
GRIN pedigree data indicates a McIntosh × Cox's Orange Pippin cross (released 1957), incompatible with the 1901 watercolor.
Mismatch is a clear case of homonymy: same name, different genotypes.
Margil
PI 264558
POM00000475 (1913)
HP Gould[30] does not list Margil or its synonym 'Reinette Musquée'.
Photograph is overexposed, particularly for flesh color. Watercolor likely depicts slightly yellow/cream flesh.
Mismatch driven by photographic exposure artifacts.
Tom Putt
PI 125271
POM00004235
Morphology of GRIN photograph and USDA watercolor matches historical descriptions and modern imagery[32].
Photograph and watercolor differences are likely due to environment and fruit maturity.
Mismatch explained by phenological stage, not mislabeling.
French Crab
PI 588908
POM00001901 (1905)
Photograph from an accession donated in 1984 and classified as Malus sylvestris.
Watercolor notes indicate material from England (Garcia Jacobs & Co., London), likely not grown at Arlington Farm (explaining absence from[30]).
Mismatch is uninformative, as 'French Crab' may not represent a stable cultivar name.Identification of outliers
-
Comparison of GRIN photographs to watercolor images is discussed in Table 1.
-
The USDA pomological watercolor collection represents an impressive catalog of heirloom apples that were found in the US at the time. But, even when constrained by a scientific purpose, it is biased by artistic signature and the perceptual imprint of the artist's mind. Indeed, the watercolor dataset was characterized by significantly higher correlation and homogeneity in pixel values compared to photographs (Supplementary Fig. S4), indicating the more uniform textures of painted fruits. This can be explained by the use of the original paper color to represent flesh ('preserving white' technique) and by the difficulty of reproducing specific textures, such as russeting, lenticels, or complex stripe patterns (Table 1). Photographs exhibited significantly higher contrast (Supplementary Fig. S4), capturing small defects and natural variations that are often idealized or omitted in watercolors (Table 1). Some of the heterogeneous textures recorded in photographs may also reflect experimental variation—introduced by camera settings, lighting conditions, dirt, or physical damages on the fruit—that botanical artists would likely have smoothed or omitted in favor of a typifying depiction. Multivariate analysis showed that the watercolor cluster was more tightly grouped in the multivariate space, whereas the photograph cluster displayed higher variance (Fig. 2). This greater dispersion likely reflects a combination of phenotypic variance within accessions, and the important variation in image resolution within the photograph dataset (67 to 1,528 px), which may have introduced additional variance in texture-based features. However, despite the watercolor dataset having a higher mean image resolution (1,208 vs 306 px), photographs exhibited greater contrast, suggesting that the observed differences are not driven by resolution alone. Taken together, these results indicate that watercolors tend to emphasize homogeneous fruit surfaces, while photographs capture the detailed, heterogeneous textures found in biological objects.
The identification of outliers highlights two main issues. First, as noted in previous studies[33], the collection contains numerous unknown cultivars, cultivar synonyms, and mislabeled accessions. In the present study, we identified four potential mislabelings between watercolors and photographs ('Hawkeye', 'Clarke', 'Barry', and 'French Crab'). These findings emphasize the importance of linking recorded accessions with accurate genotyping data to ensure proper preservation and interpretation of the collection. Second, the use of a single image to phenotype and represent an accession—whether in watercolors or photographs—is often insufficient due to inherent phenotypic variability. Botanical artists are generally understood to aim for a representative depiction rather than a strict record of a single fruit, meaning that some surface heterogeneity visible in photographs may have been intentionally smoothed or omitted as unrepresentative. Conversely, a single photograph does not necessarily capture the full phenotypic variation within an accession either, as it may reflect one particular fruit under specific growing conditions. As with most fruit species, many apple traits are strongly influenced by environmental growing conditions, which complicates visual identification[33]. Advances in image acquisition and phenotyping methods, particularly three-dimensional representations with multiple replicates[14], could improve the characterization of apple traits associated with each accession. Integrating these approaches into the development of a comprehensive phenotypic database could facilitate accession identification based on visual traits extraction and deep learning models from RGB images.
The use of image analysis for germplasm characterization
-
North American orchards containing heirloom cultivars, many over a century old, are disappearing due to tree aging, high maintenance costs, and real-estate development[34]. In this context, accurate documentation of cultivars is a cornerstone of conservation efforts, ensuring that unique genetic resources and cultural heritage are not lost due to misnaming or neglect. Traditional methods of identification, relying on morphological and taxonomic traits, are time-consuming and often ambiguous due to high phenotypic variability among cultivars under different environmental conditions[7].
The documentation of apple diversity through visual records remains an invaluable resource for historical cultivar identification and germplasm curation. Watercolors, although often idealized, provide a historical archive of cultivars that might otherwise have been lost. Photographs now offer reproducible, high-resolution records of phenotypic variation. Numerous illustrated pomological collections documenting fruit diversity exist worldwide, including Pomona Herefordiensis, The Herefordshire Pomona, The Apples of New York, American Pomology, Pomologie Française: Recueil des plus beaux fruits cultivés en France, and Deutsche Pomologie. Many of these collections have been digitized and are now publicly accessible through resources such as the Biodiversity Heritage Library[35]. Applying image analysis to these extensive historical collections could further extend this work by quantitatively capturing traits and facilitating comparisons across cultivars, time periods, and collections.
With ongoing improvements in phenotyping methods, integrating digital imaging into germplasm collections promises to enhance the accuracy and reproducibility of fruit characterization. Recent studies have successfully applied high-throughput phenotyping approaches to characterize extensive germplasm[17,19,36]. These approaches enable capturing phenotypic features at larger scales and with greater reproducibility than traditional pomological depictions. Integrating image-based phenotyping can strengthen the characterization of germplasm, but it must account for the wide variability of fruit appearance even within a single cultivar. Factors such as maturity stage (e.g., background color from green to yellow, blush coverage), growing location, fruit position on the tree (e.g., sun exposure, microclimate), and year-to-year variation driven by environmental, physiological (heat and water stress), and horticultural (e.g., crop load) factors all influence fruit traits. Combining these phenotypic approaches with genotyping data and sound conservation practices[37] will strengthen cultivar identification, facilitate the detection of mislabeling or synonyms, and ultimately support the conservation of apple genetic resources along with the cultural heritage embedded in their diversity.
-
The authors confirm their contributions to the paper as follows: Bouillon P performed the analyses, interpreted the results, and drafted the manuscript. Li M and Bouillon P designed and carried out image analyses. Zakalik D contributed to data interpretation. Bouillon P, Li M, Zakalik D, and Peck G provided feedback on the analyses and contributed to reviewing and refining the manuscript. Peck G supervised the project. All authors reviewed the results and approved the final version of the manuscript.
-
Watercolors from USDA Watercolor Collection are publicly available on USDA National Agricultural Library Website and can be accessed through: https://search.nal.usda.gov/discovery/collectionDiscovery?vid=01NAL_INST:MAIN&collectionId=81279629860007426. Photographs from USDA apple are publicly available and stored on the GRIN-global database: https://npgsweb.ars-grin.gov/gringlobal/search. The image analysis code and workflow are available at https://github.com/pibouillon/pictura_pomologica. The data underlying this article are available in the article and its supplementary material.
-
The authors declare that they have no conflict of interest.
-
accompanies this paper online at: https://doi.org/10.48130/frures-0026-0035.
- Supplementary Table S1 Phenotypic dataset for GRIN photographs and USDA watercolor images.
- Supplementary Table S2 Outlier pairs identified by Euclidean distance analysis in PCA space.
- Supplementary Fig. S1 Overview of the color-feature extraction pipeline.
- Supplementary Fig. S2 Overview of the texture-feature extraction pipeline.
- Supplementary Fig. S3 Distribution of color ranks for watercolors and photographs.
- Supplementary Fig. S4 Comparison of texture traits between photographs and watercolors.
- Supplementary Fig. S5 Principal component analysis (PCA): coefficient circles and score plots.
- Copyright: © 2026 by the author(s). Published by Maximum Academic Press, Fayetteville, GA. This article is an open access article distributed under Creative Commons Attribution License (CC BY 4.0), visit https://creativecommons.org/licenses/by/4.0/.
-
About this article
Cite this article
Bouillon P, Li M, Zakalik D, Peck G. 2026. Digital comparison of historic apple watercolors and recent photographs reveals how the art and science of fruit documentation can improve germplasm curation. Fruit Research 6: e044 doi: 10.48130/frures-0026-0035 

Digital comparison of historic apple watercolors and recent photographs reveals how the art and science of fruit documentation can improve germplasm curation
- Received: 23 February 2026
- Revised: 16 June 2026
- Accepted: 11 August 2026
- Published online: 15 October 2026
Abstract: Between 1886 and 1942, the US Department of Agriculture (USDA) commissioned thousands of watercolor paintings to document fruit diversity, including more than 3,800 apple illustrations. Today, these historic artworks coexist with modern photographic records of apple accessions in the USDA National Plant Germplasm System (NPGS). In this study, we applied digital phenotyping methods to assess the consistency between apple watercolors and photographs. Using YOLOv8-based segmentation models, we extracted fruit images from 3,233 watercolors and 1,472 photographs and estimated color and texture features for fruit skin and flesh. A subset of 114 accessions represented in both image types (487 watercolors and 114 photographs) was compared. Watercolors showed significantly higher pixel homogeneity and correlation values, while photographs exhibited greater contrast, capturing natural variation and defects absent from painted representations. Principal component analysis revealed distinct clustering of watercolors vs photographs, with 10 photograph–watercolor pairs identified as outliers, suggesting misidentification or non-representative reference fruits. Our results highlight both the strengths and limitations of historical watercolors for documenting apple diversity. We demonstrate that integrating digital image analysis with historical and contemporary visual resources offers new opportunities to validate cultivar identity, improve germplasm documentation, and safeguard cultural heritage.
-
Key words:
- Malus domestica /
- Image analysis /
- Germplasm /
- Texture features /
- Color features