


-
Choriocarcinoma is an aggressive type of germ cell tumor that predominantly originates in the uterus, typically linked to pregnancy. In rare instances, extragonadal choriocarcinoma can develop in non-reproductive tissues[1]. Primary gastric choriocarcinoma (PGC) is an infrequent malignancy, accounting for a mere 0.08% of all gastric cancers[2]. Most patients with PGC survive no more than 1 year[3].
Alpha-fetoprotein-producing gastric cancer (AFPGC) is a specific and rare subtype of stomach cancer, constituting 2.7%−8.0% of all gastric malignancies[4]. AFPGC is notably associated with a high incidence of liver metastasis and a grim prognosis[5]. Among its subtypes, the intestinal fibroblast differentiation type, initially described in 1994, represents a prominent category of AFPGC[6].
In this report, we present a case involving liver metastasis in a 69-year-old male diagnosed with PGC concomitant with intestinal fibroblast-differentiated AFPGC. The patient was treated with chemotherapy designed for gastric cancer following cytoreductive surgery. The treatment's efficacy was assessed as CR, and the patient has surpassed 2 years of survival since the initial diagnosis.
-
On September 7th, 2022, a 69-year-old male patient was referred to our gastroenterology department due to upper abdominal discomfort starting one month earlier. The patient had a 30-year history of alcohol consumption and no family history of hereditary diseases. During gastroscopy, infiltrative lesions in the cardia gastric body were observed without biopsy (Fig. 1). Subsequent chest and abdominal contrast-enhanced CT scans revealed a space-occupying lesion in the gastric cardia, suggesting the possibility of cardiac carcinoma. Multiple enlarged lymph nodes beneath the cardia, with a maximum size of 3.3 cm × 2.3 cm, indicated lymph node metastasis associated with the tumor (Fig. 2a). Additionally, multiple abnormally enhanced nodules in the right lobe of the liver, with a maximum size of 1.6 cm × 2.1 cm, were suspected as hemangiomas (Fig. 2b). Combining the gastroscopy and CT scan results, the preoperative diagnosis suggested gastric cancer and a possible hepatic hemangioma. On September 14th, 2022, the patient underwent a radical total gastrectomy with Roux-en-Y esophagojejunostomy. In line with the intraoperative exploration findings, the patient was staged as T2N2Mx per the 8th - edition pathological staging of the American Joint Committee on Cancer (AJCC). Post - operative pathology demonstrated a malignant tumor in the gastric cardia. Immunohistochemical results were as follows: (gastric) tumor cells CK pan (+), CK-L (+), AFP (focal +), SALL4 (+), PLAP (scattered +), HCG (scattered +), Hepatocyte-1 (−), Glypican-3 (partial +), CD30 (focal +), Villin (partial +), CK7 (+), CD20 (−), CDX-2 (partial +), Ki67 (hot spot about 90% +), S-100 (−), combined with HE section, this case was identified as an AFP-producing carcinoma with differentiation towards intestinal fibroblasts and choriocarcinoma (Fig. 3). Further evaluation of β-HCG showed abnormally high levels (17,901 U/ml). After the surgery, a follow-up CT scan of the chest and abdomen revealed no enlarged lymph nodes in the area of the original cardia (Fig. 2c). Two nodules with abnormal enhancement were detected in the right lobe of the liver, which were larger than before (measuring 3.1 cm × 2.8 cm). These nodules indicate the possibility of liver metastasis originating from PGC (Fig. 2d). Based on the patient's medical history and comprehensive evaluation, the final diagnosis was PGC combined with intestinal fibroblast differentiation AFPGC with liver metastasis.
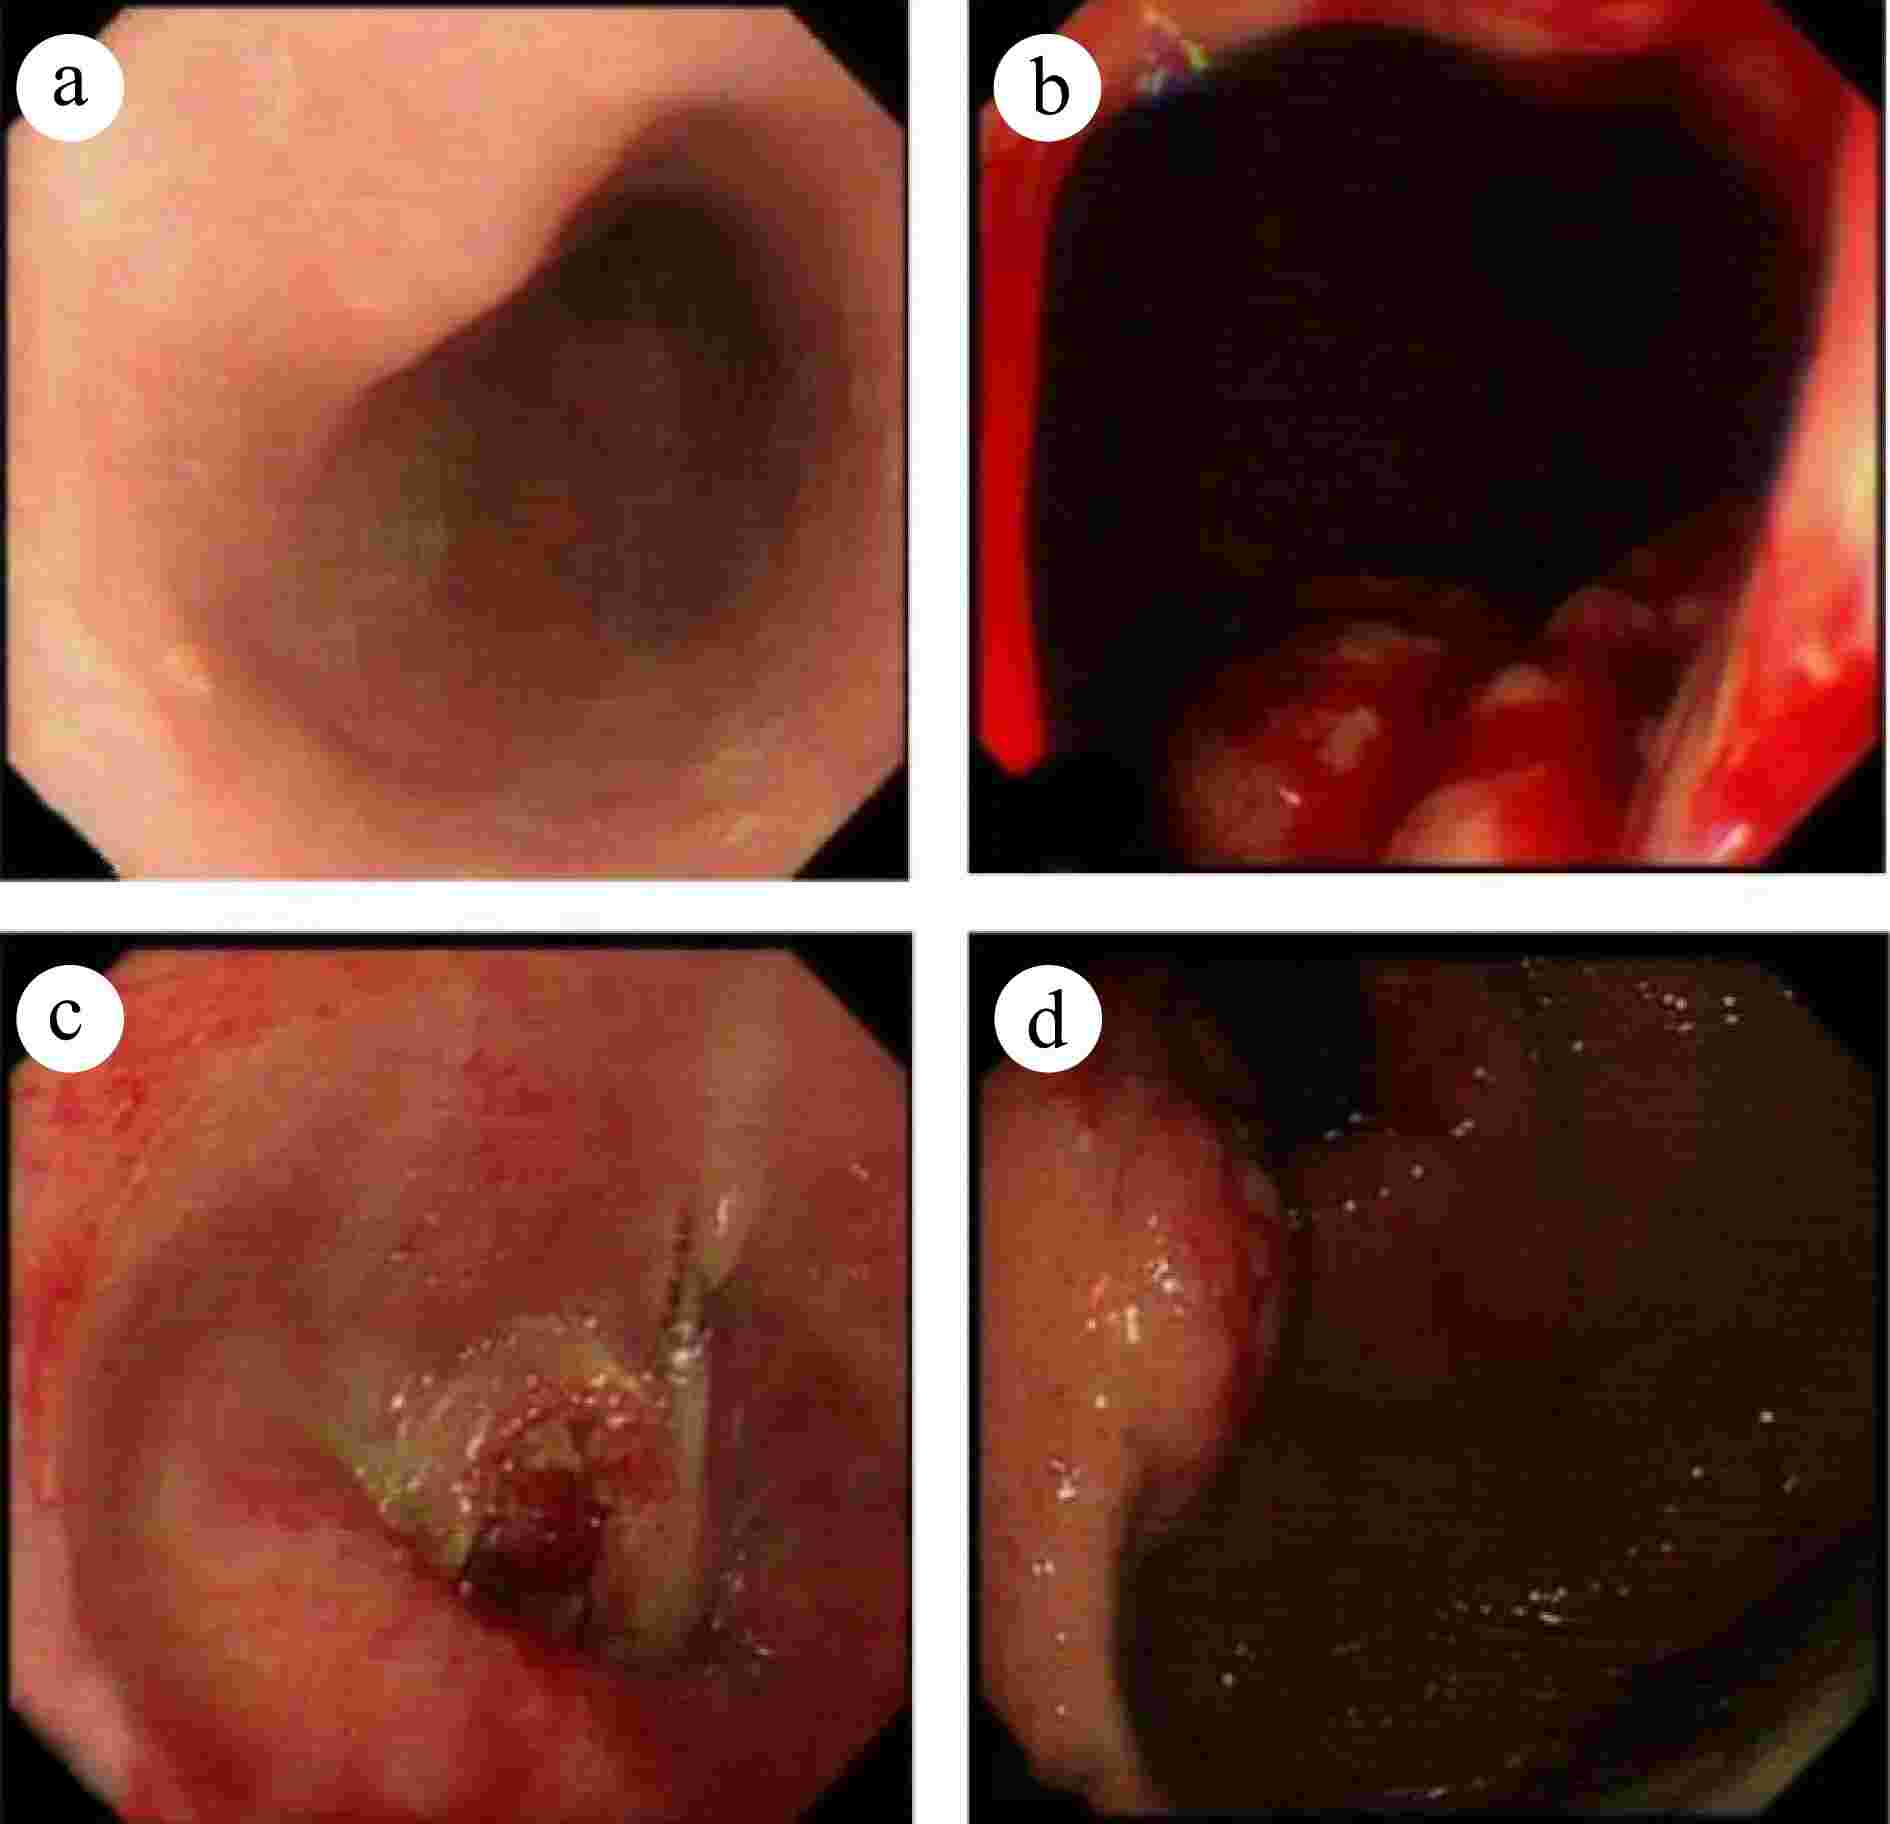
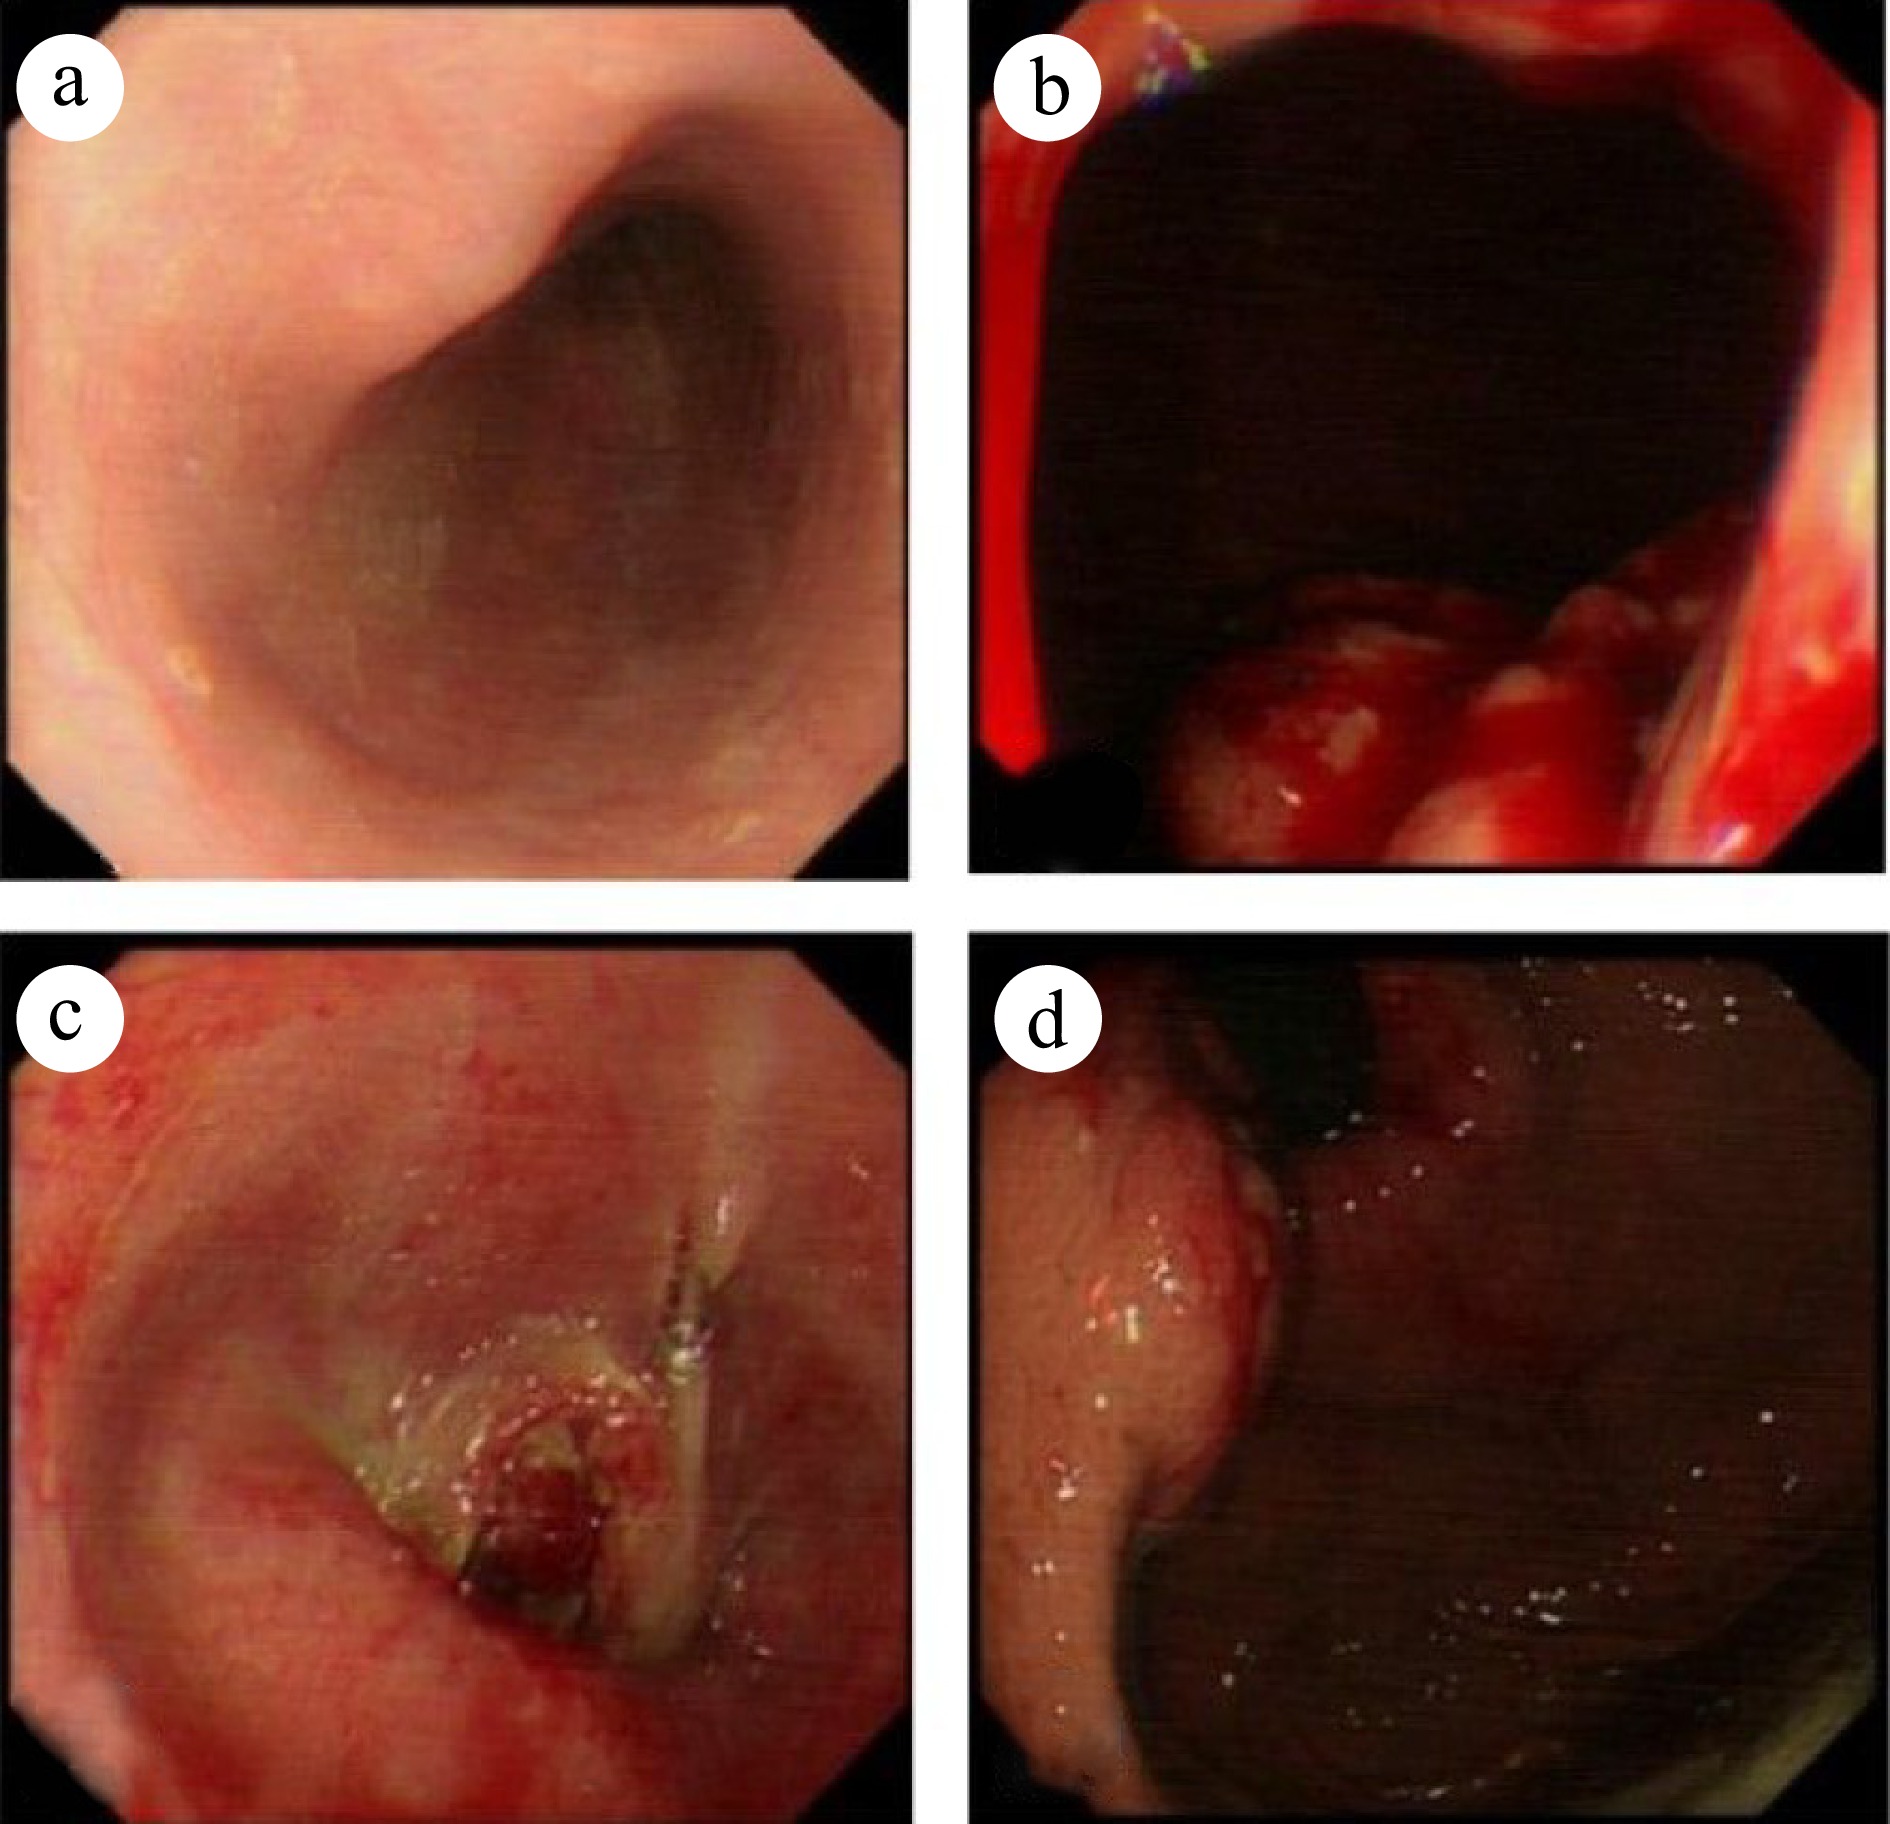
Figure 1.
Gastroscopy reveals an unobstructed esophagus with smooth mucosa. The dentate line is indistinct, and infiltrative lesions are evident in the cardia gastric body. The gastric fundus mucosa appears smooth and displays a normal coloration. (a) Esophagus. (b) Inferior cardia. (c) Esophagogastric junction. (d) Fundus of the stomach.
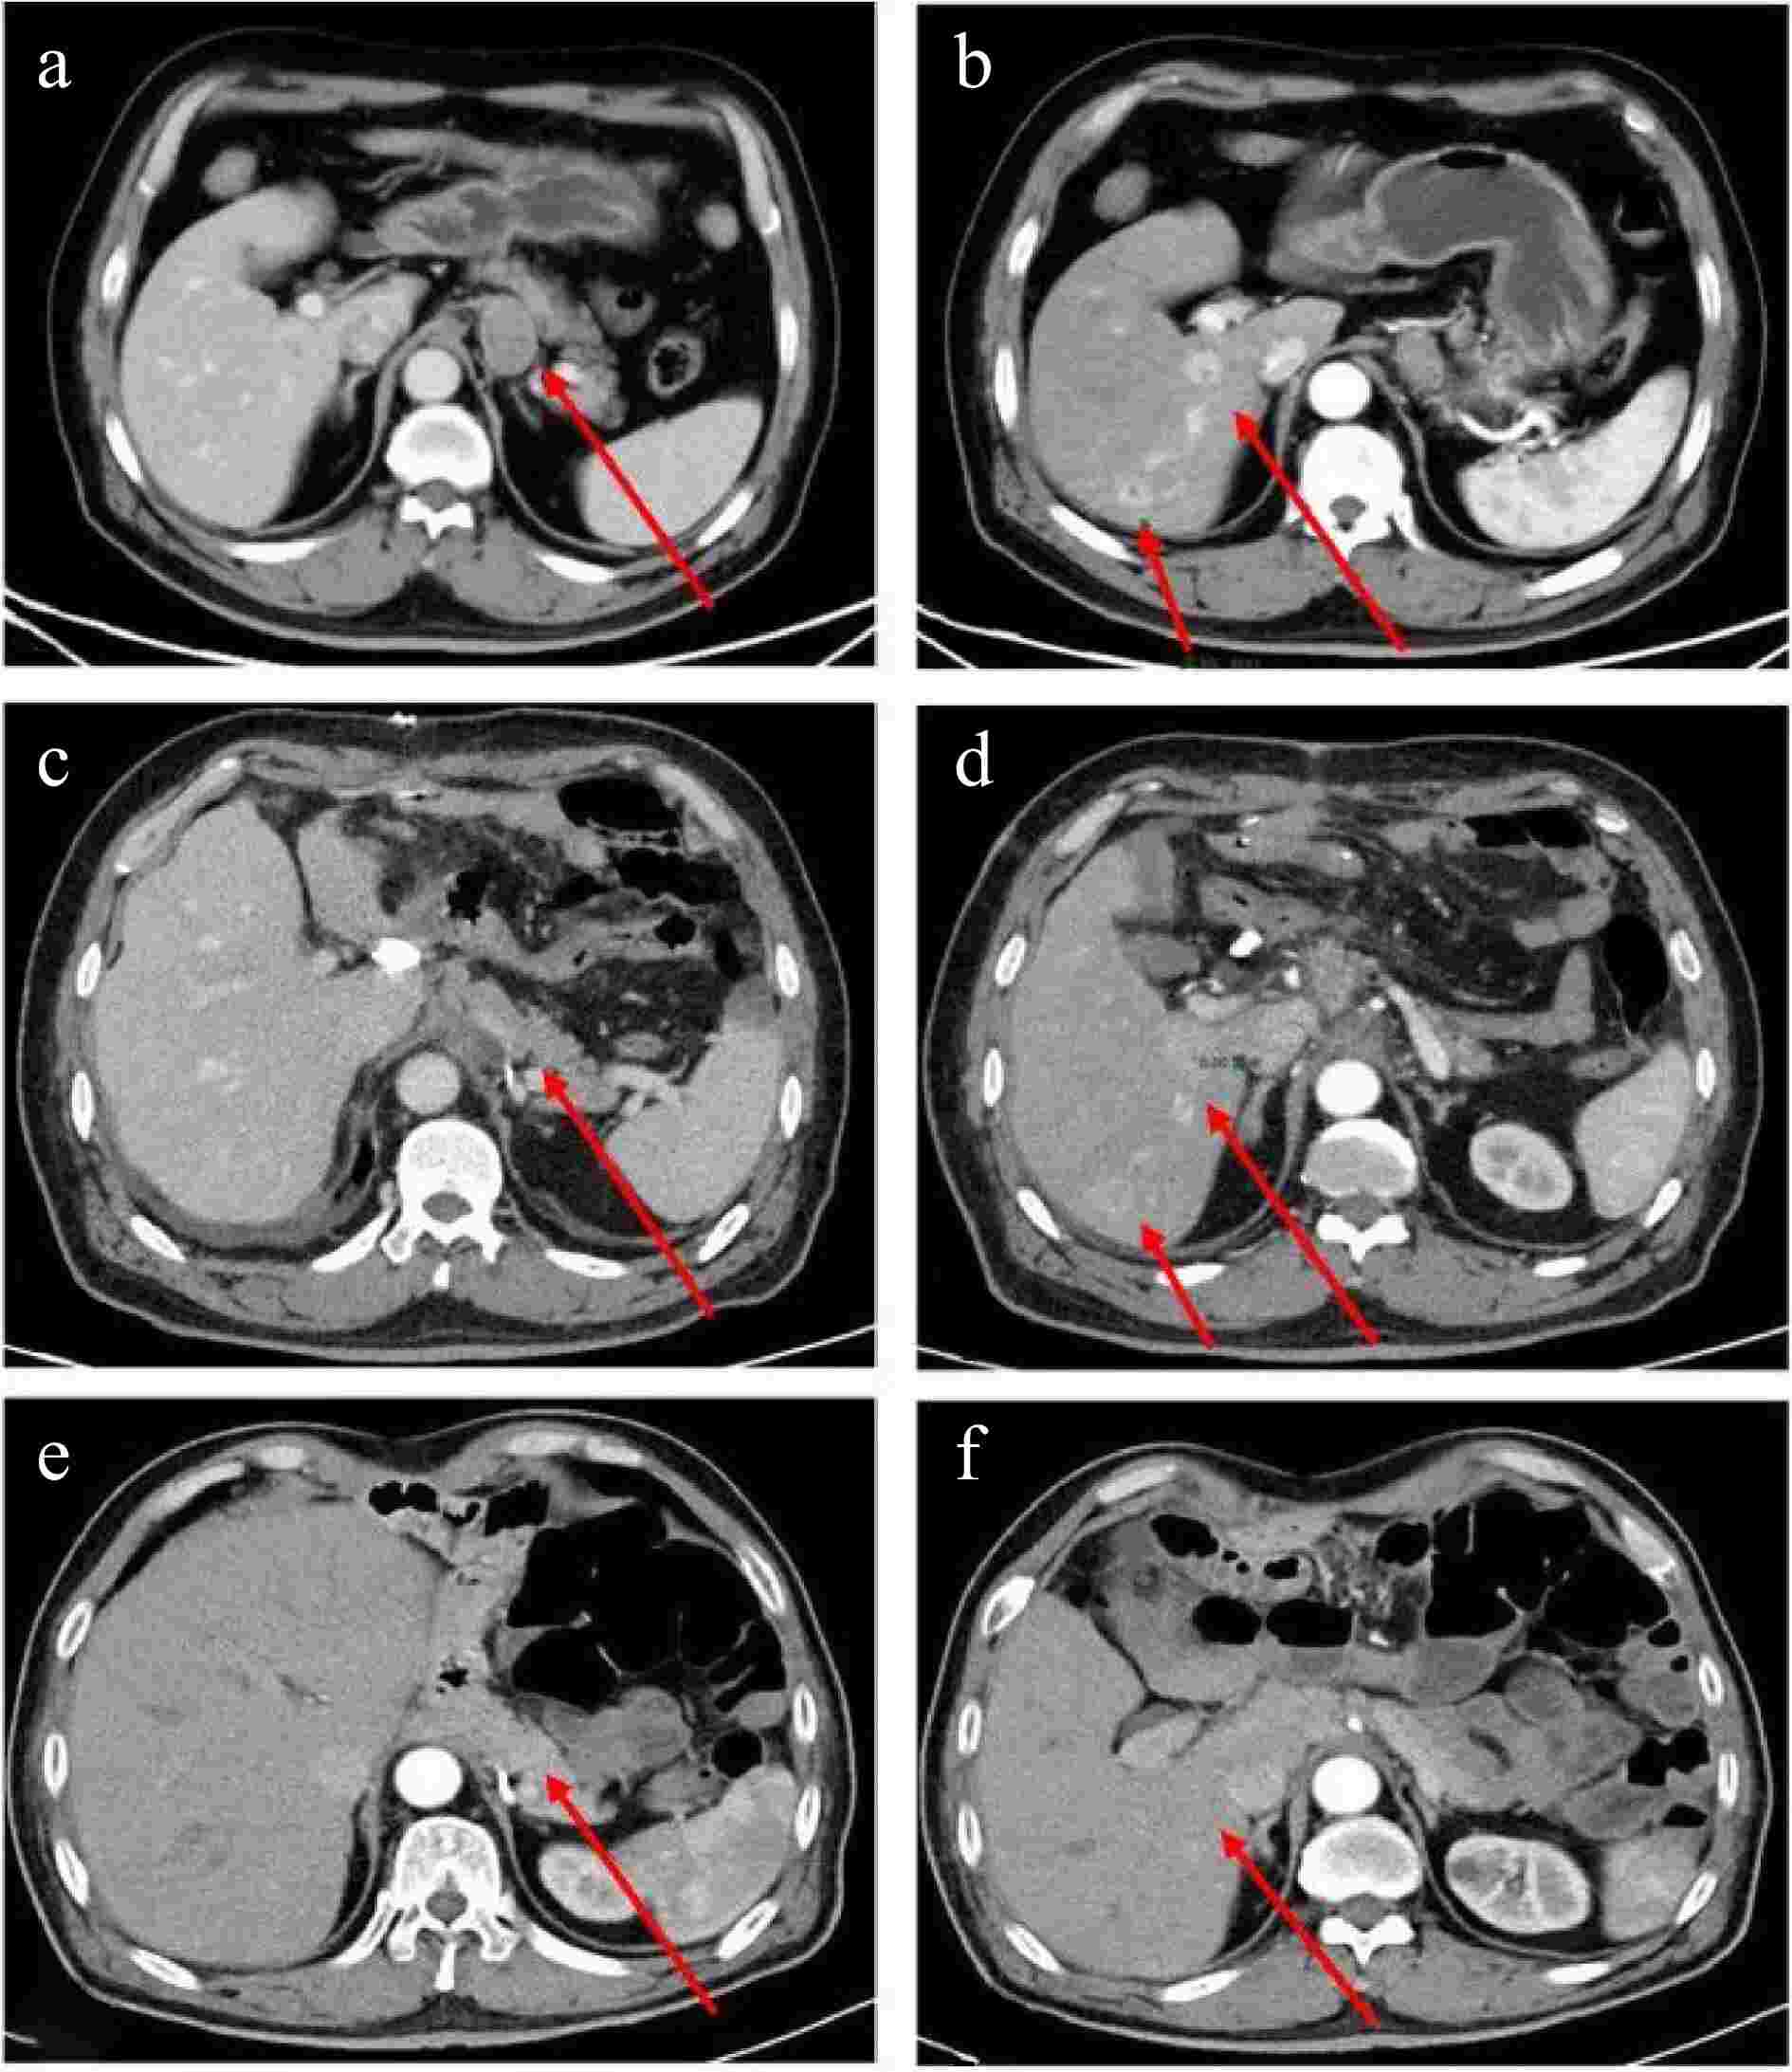
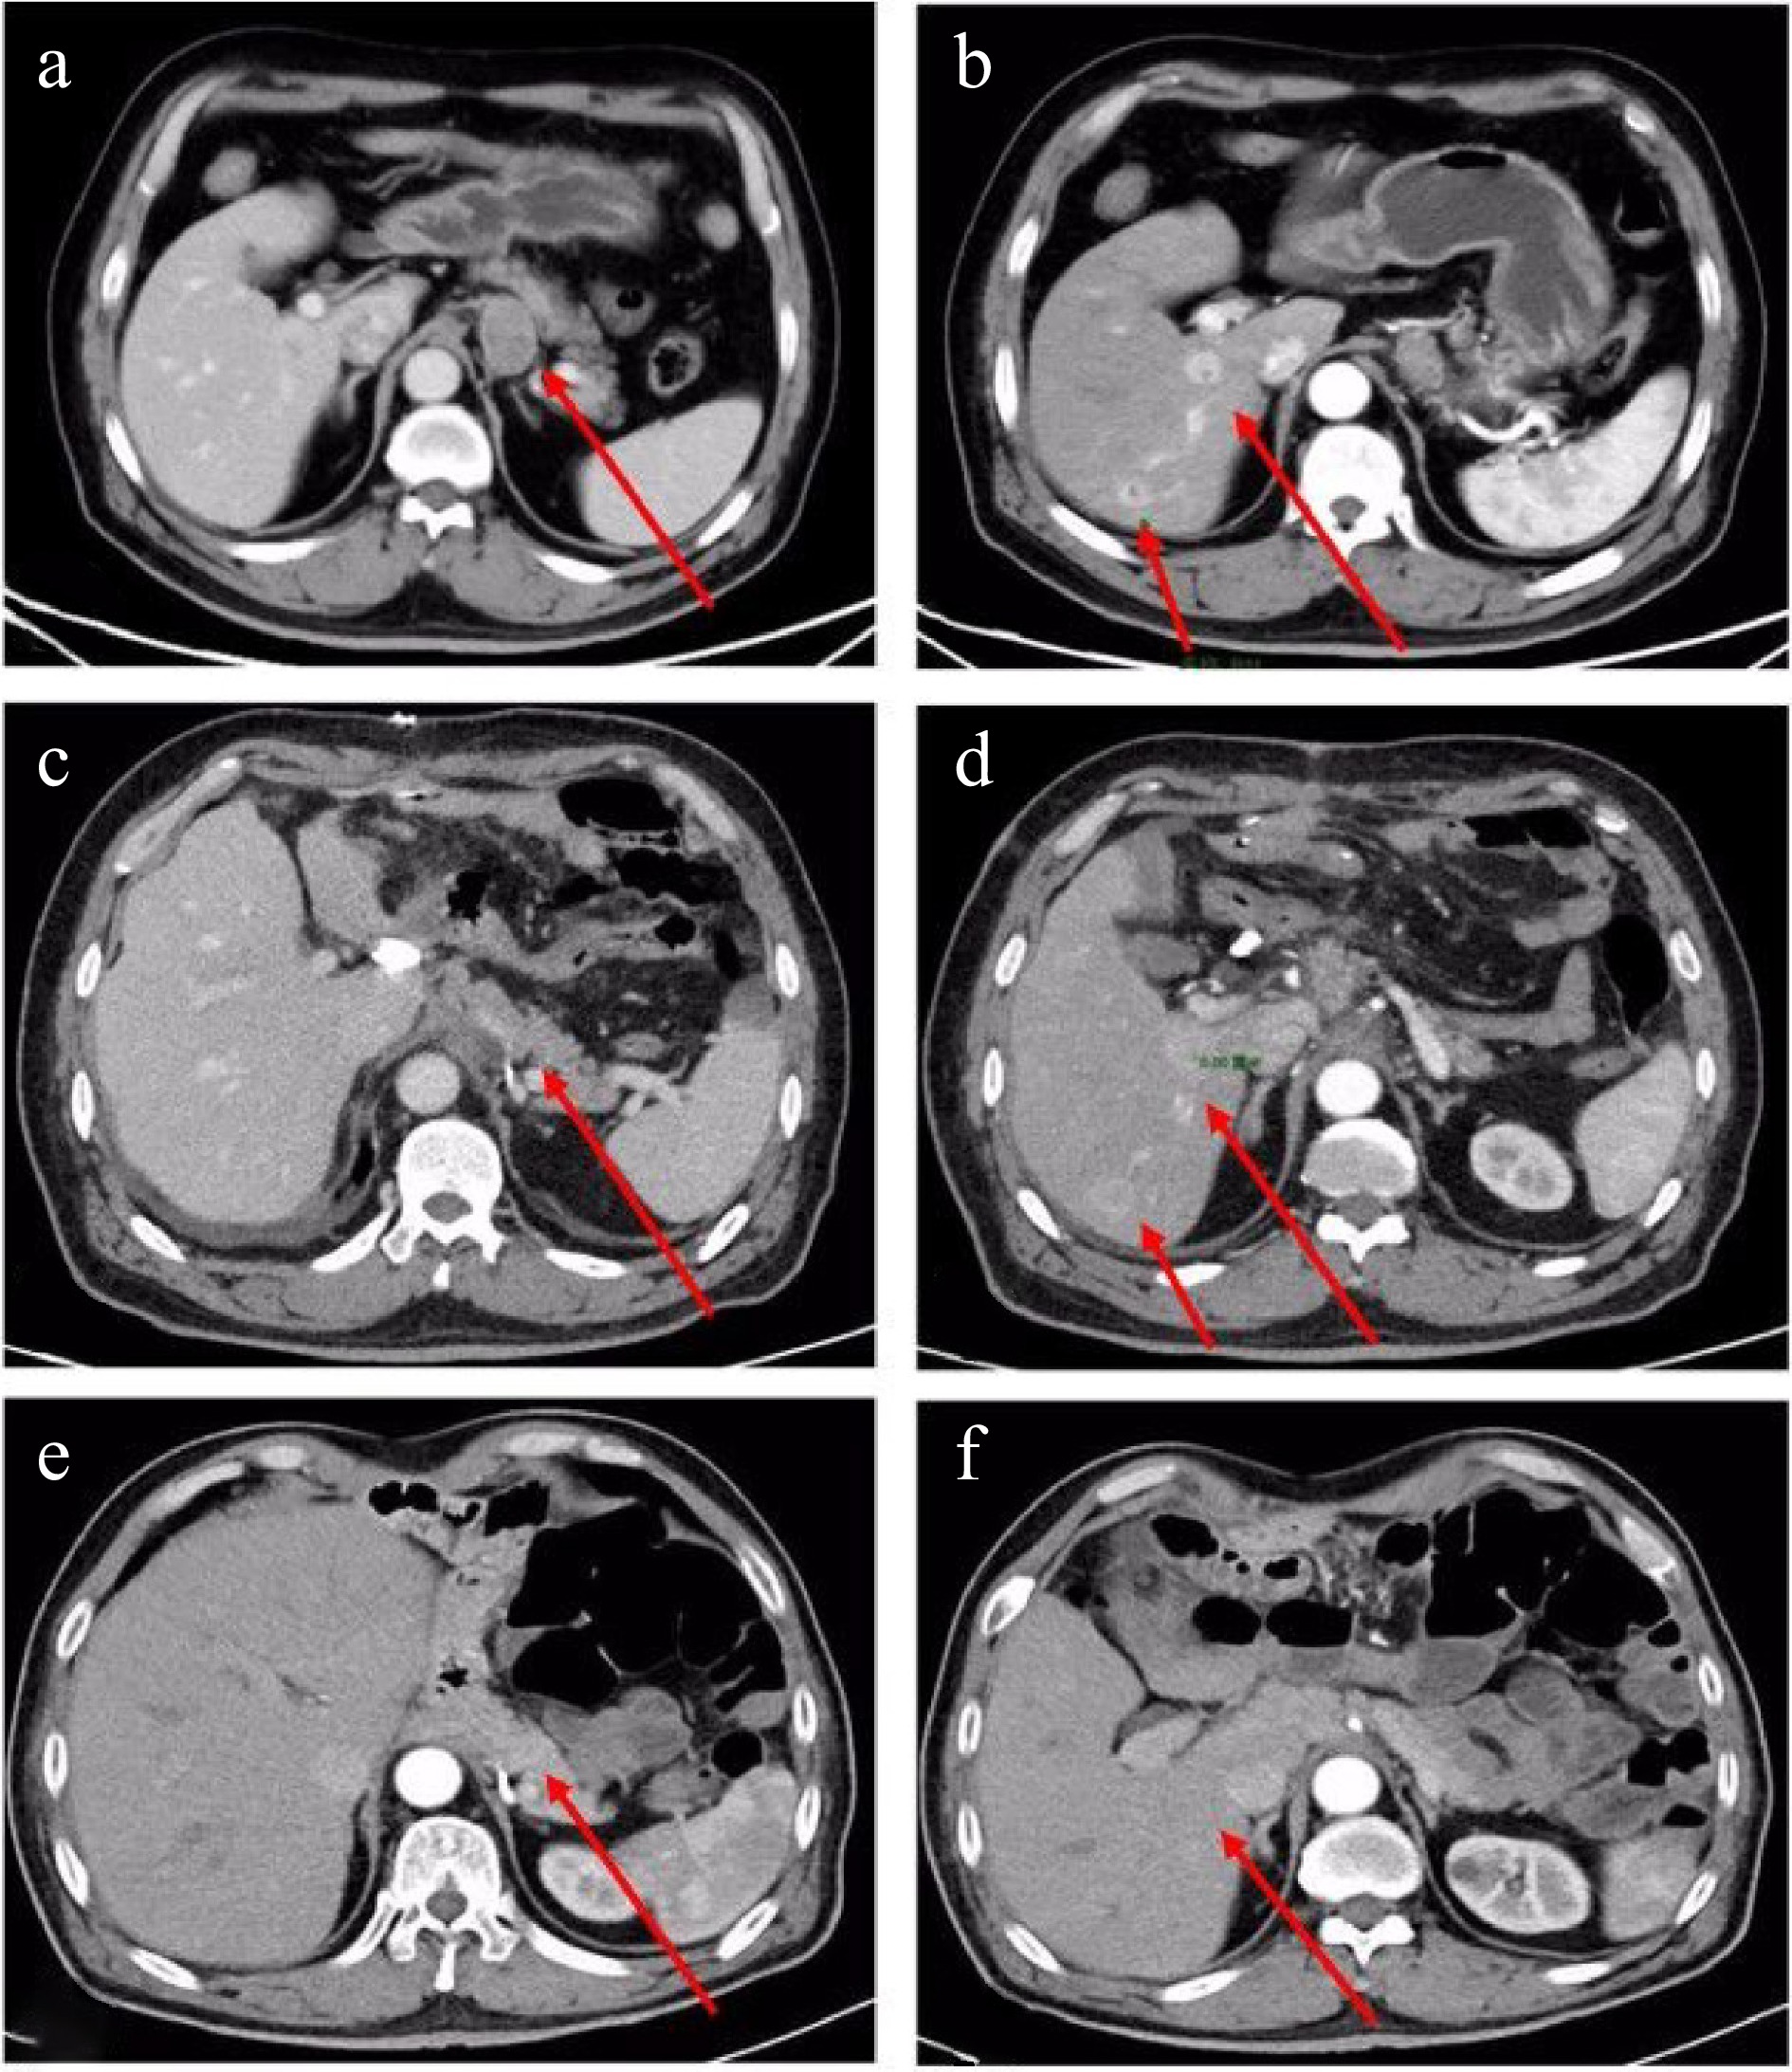
Figure 2.
Enhanced CT scan of the chest and abdomen: Preoperative: (a) Enlarged lymph nodes below the cardia (maximum size 3.3 cm × 2.3 cm) (indicated by an arrow); (b) Multiple abnormally enhanced nodules (maximum size 1.6 cm × 2.1 cm) in the right lobe of the liver (indicated by an arrow). Postoperative: (c) No enlarged lymph nodes are observed at the approximate position of the original cardia (indicated by an arrow); (d) Two abnormally enhanced nodules in the right lobe of the liver, larger than before (3.1 cm × 2.8 cm) (indicated by an arrow). The latest images: (e) No enlarged lymph nodes detected at the approximate position of the original cardia; (f) No abnormal enhancement nodules in the right lobe of the liver.
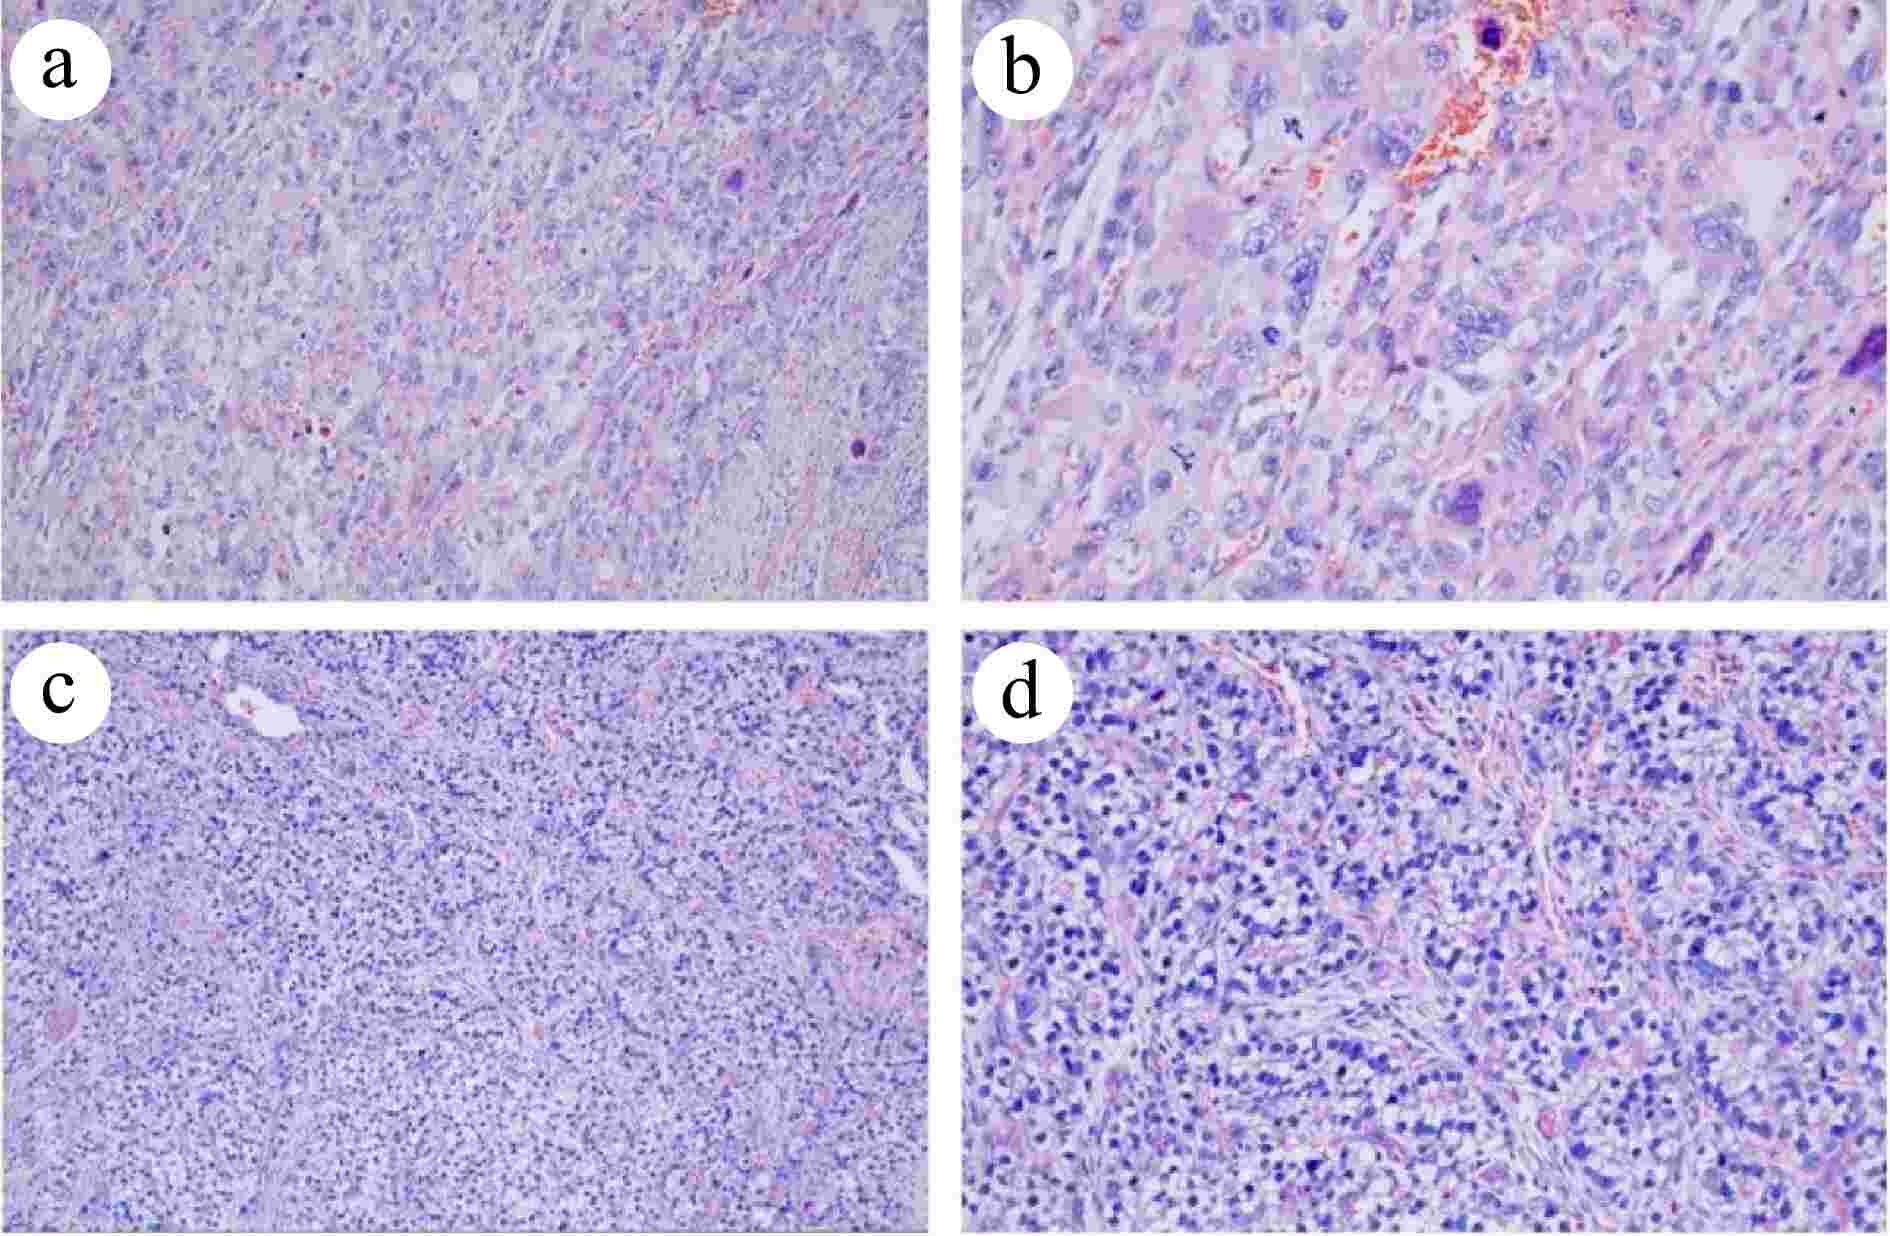
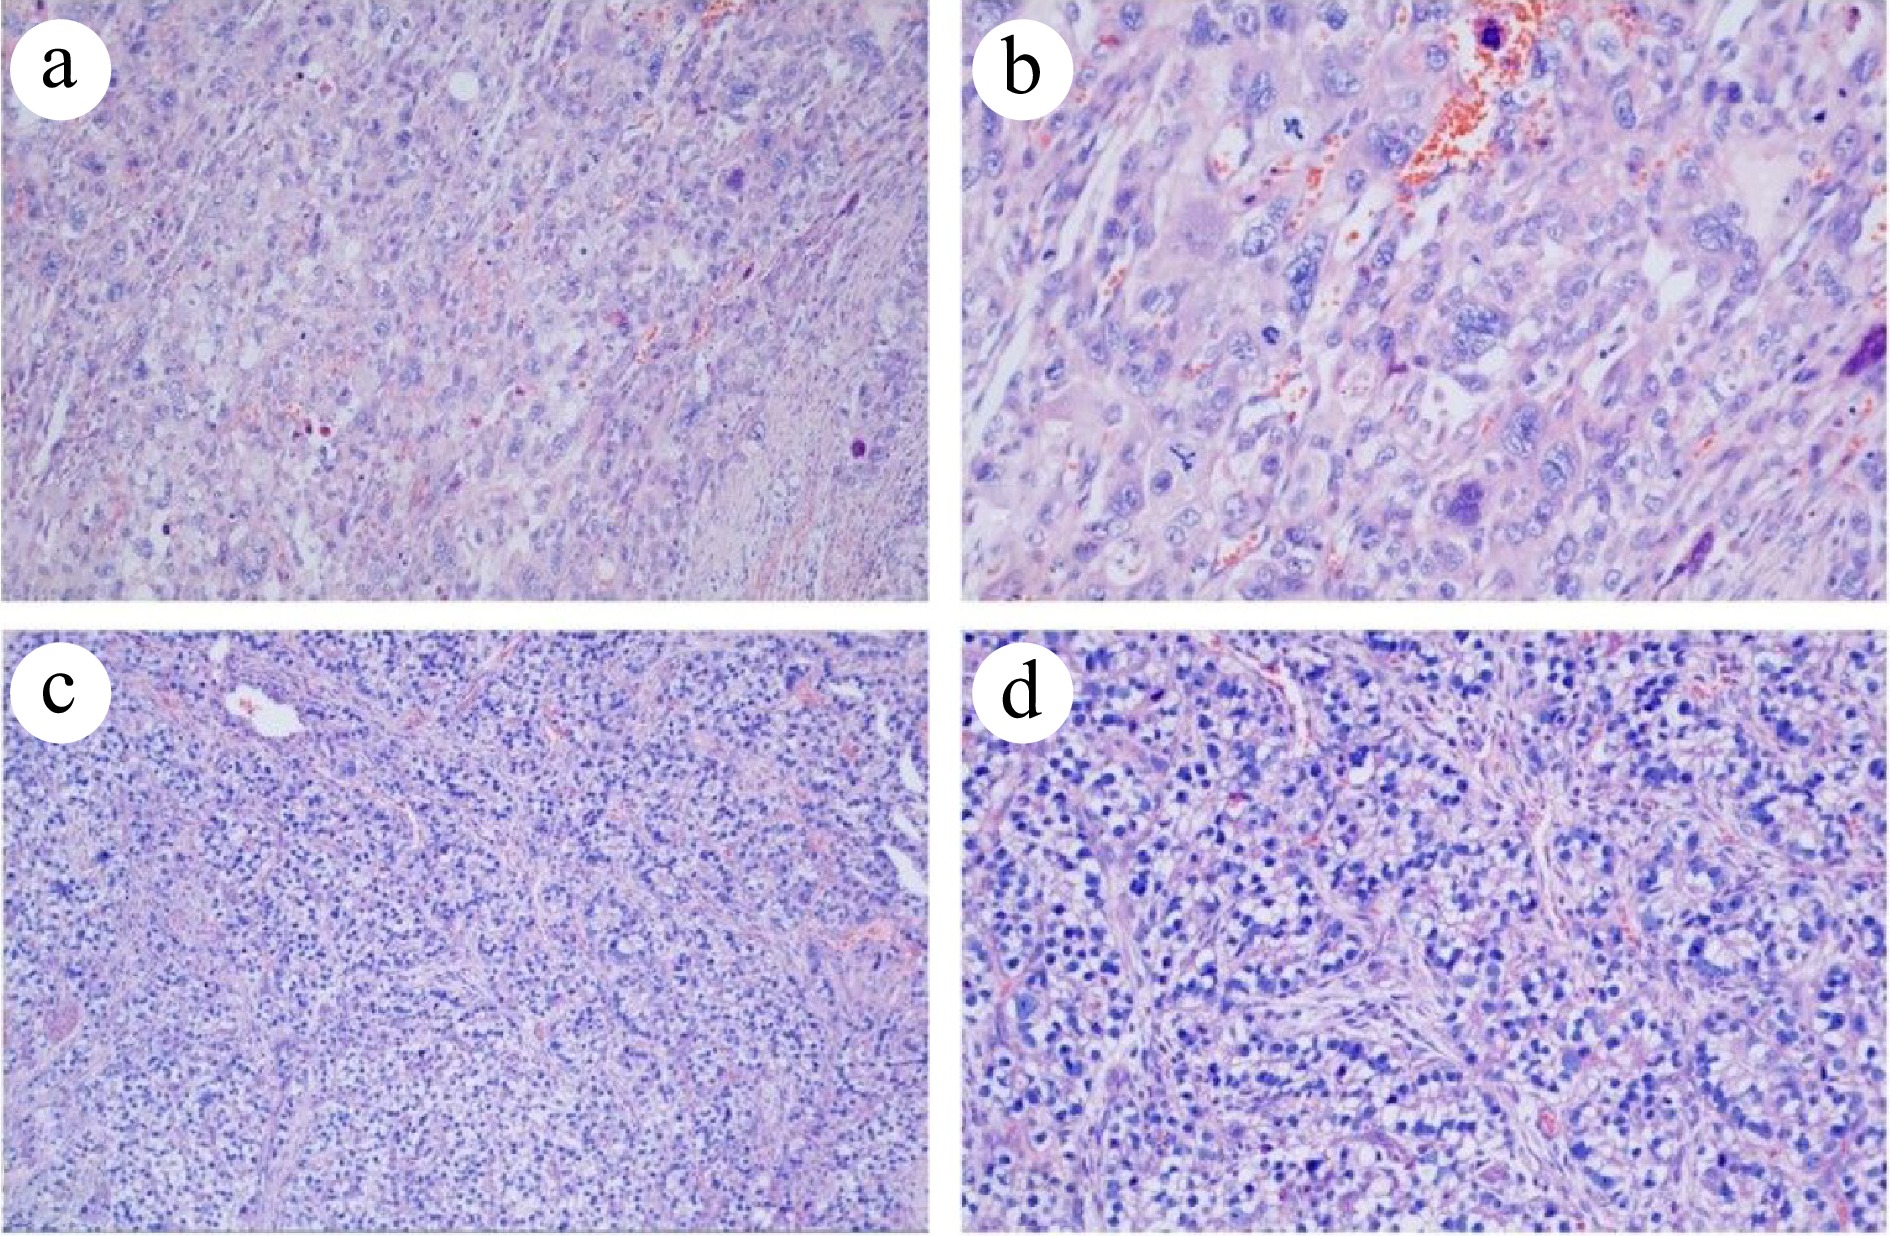
Figure 3.
Histopathological analysis of the resected specimen (HE staining). (a) PGC at 100× magnification. (b) PGC at 200× magnification. (c) Intestinal fibroblast-differentiated AFPGC at 100× magnification. (d) Intestinal fibroblast- differentiated AFPGC at 200× magnification.
On October 22nd, 2022, the patient's Next-Generation Sequencing Technologies (NGS) report revealed mutations in TP53 and PALB2. The patient exhibited a TPS < 1%, CPS < 1, TMB of 8.94 mutations per megabase (lower than 31% of gastric cancer patients), MSS, and EBV (−). As genetic testing did not reveal any benefits from immunotherapy or targeted therapy, and the tumor originated in the stomach, a conventional chemotherapy regimen for gastric cancer was chosen. The patient commenced chemotherapy (albumin paclitaxel, oxaliplatin combined with capecitabine) one month after surgery. After six cycles of combination therapy, the patient was put on oral maintenance therapy with capecitabine for one year. Serum HCG significantly decreased after the second cycle of treatment, from 17,091.0 to 8.7 IU/L, which remained within the normal range during subsequent cycles. The most recent chest and abdominal contrast-enhanced CT scan revealed the absence of previously enlarged lymph nodes near the cardia and the disappearance of two abnormally enhanced nodules in the right liver lobe (Fig. 2e, f). All tumor markers returned to normal levels. Since the initial diagnosis, the patient has survived for more than two years, and the best overall response assessment indicates CR.
-
Choriocarcinoma occurring in males, known as non-gestational or primary choriocarcinoma, is exceedingly rare. It is typically found in locations such as the mediastinum, retroperitoneum, gastrointestinal tract, and other areas. Notably, the stomach is the most prevalent site of onset[7]. Since its initial report by Davidsohn in 1905, the medical literature has documented nearly 140 cases of primary gastric choriocarcinoma, with 16 cases reported in China[8].
The exact pathogenesis of primary choriocarcinoma remains unclear, with three prevailing hypotheses: (1) The hypothesis of abnormal migration of primordial germ cells: During embryonic development, primordial germ cells fail to migrate from the yolk sac along the urogenital tract. Ectopic primordial germ cells subsequently undergo tumorigenic differentiation, resulting in chorionic epithelial carcinoma[9]. (2) The theory of metastasis from primary reproductive gland tumors that spontaneously regress: Choriocarcinoma possesses a propensity to invade blood vessels and may disseminate hematogenously. Patients often present with metastatic tumors as their initial symptoms, while the primary lesions within reproductive organs may have already regressed spontaneously after relocating to the stomach[10]. (3) The theory of reverse differentiation in primary tumors within non-genital tissues: Non-trophoblastic tumor cells in non-reproductive system tissues undergo reverse differentiation, causing the secretion of β-HCG in numerous tissues outside the reproductive system. Primary choriocarcinoma of the stomach may stem from the reverse differentiation of adenocarcinoma components or the development of normal HCG-secreting cells in the mucosa itself[11]. In the case of the patient under consideration, no primary genital tumors or midline lesions were identified through various diagnostic tests. However, it cannot be ruled out that the primary lesion is either small or has spontaneously regressed. The pathological biopsy, in this case, indicated AFP-producing cancer with differentiation of enterocytes and choriocarcinoma. This suggests the possibility of a source of reverse differentiation in gastric cancer.
Diagnosing primary gastric choriocarcinoma can be challenging and is prone to misdiagnosis or oversight, which may be attributed to the following factors: (1) The low incidence of PGC, which predominantly affects elderly males, while choriocarcinoma is more commonly observed in young women. This demographic difference may lead to healthcare providers not giving adequate consideration. (2) Patients often present with non-specific gastrointestinal symptoms such as abdominal pain and loss of appetite, which can overlap with various other conditions, making diagnosis challenging. (3) These tumors are often mixed, featuring adenocarcinoma at the periphery and choriocarcinoma at the core. Consequently, during gastroscopic biopsies, it can be difficult to obtain samples representing all tumor components. (4) In clinical practice, routine markers like CEA and CA199 are screened for gastrointestinal tumors, whereas specific markers for choriocarcinoma include β-HCG. The presence of β-HCG elevation may be overlooked or misdiagnosed. In the case of the patient described here, an elderly male presented with initial gastrointestinal symptoms. Preoperative assessments, including gastroscopy and CT scans, initially led to the consideration of gastric cancer. Abnormal liver perfusion raised the suspicion of hemangioma. In retrospect, for the hypervascular liver lesion in this patient, further investigations such as liver MRI or liver ultrasound could have been conducted for differential diagnosis, which might have contributed to an earlier and more accurate diagnosis. Postoperative pathology, immunohistochemistry results, and the abnormally elevated β-HCG levels revised the diagnosis of primary choriocarcinoma of the stomach with associated intestinal fibroblast-differentiated AFP-producing carcinoma. Subsequent CT examination showed that the abnormally enhanced nodules of the liver had increased in size compared to preoperative imaging. Given that choriocarcinoma is a highly vascular tumor, the diagnosis was subsequently revised to encompass PGC in conjunction with intestinal fibroblast differentiation-type AFPGC with liver metastasis.
Given the limited number of cases and insufficient research on PGC, there is currently no established standard treatment protocol. Reported chemotherapy agents include etoposide, methotrexate, cyclophosphamide, vincristine, and streptomycin[2,3] . PGC is characterized by high malignancy and the majority of patients die within 1 year of diagnosis[3]. Early-stage primary choriocarcinoma of the stomach can metastasize to the liver through hematogenous spread, and the prognosis for PGC with liver metastasis is grim, typically with a survival period of no more than 1 month[2]. In this particular case, based on the patient's medical history and comprehensive evaluation, the final diagnosis was PGC combined with intestinal fibroblast differentiation AFPGC with liver metastasis. Notably, NGS results did not suggest any benefits from immune or targeted drugs. An earlier study by Noguchi et al. demonstrated a case of PGC treated with the 5-Fu and CDDP regimen, resulting in a survival period of 54 months[3]. In this instance, the tumor originated in the stomach. The patient opted for a chemotherapy regimen designed for gastric cancer, consisting of albumin paclitaxel, oxaliplatin, and capecitabine, without specific treatment for liver metastases. Following diagnosis, the patient's blood HCG level was 17,091.0 IU/L. Subsequent β-HCG measurements showed a gradual decline (374.1 IU/L at the end of the first chemotherapy, 8.7 IU/L at the end of the second chemotherapy), ultimately returning to normal levels. Concurrently, in conjunction with imaging assessments, the best overall response assessment for the patient indicated CR. Remarkably, the patient has survived for over two years since the initial diagnosis, displaying no signs of recurrence or metastasis. Nevertheless, it is essential to critically evaluate the limitations encountered in this case. The early liver lesions were misdiagnosed as hemangiomas, which resulted in gastric surgical resection being selected as the primary treatment option, followed by adjunctive chemotherapy. This sequence of events necessitates a careful reconsideration of our approach. Had an accurate and timely diagnosis been made, a potentially more beneficial strategy might have been to initiate chemotherapy as the first step. The underlying rationale for this approach would be to reduce tumor volume, thereby increasing the likelihood of achieving an R0 resection during subsequent surgical interventions. While this alternative strategy theoretically holds promise for prolonging survival in patients with this aggressive disease, it remains speculative and requires further comprehensive investigation in future studies. Such research efforts may lead to more effective treatment regimens and improved survival outcomes for patients with primary gastric choriocarcinoma accompanied by liver metastases.
In conclusion, this case represents a successful treatment of a patient with PGC combined with enteroblastic-differentiated AFPGC. Based on this experience, we advocate for cytoreductive surgery in patients with distant metastasis of immature differentiated tumors originating in the stomach, followed by chemotherapy employing paclitaxel, oxaliplatin, and capecitabine as the preferred regimens.
-
Written informed consent was obtained from the patient for publication of this case report and any accompanying images. The article is exempt from Ethical Committee approval as it is a case report that does not include data collection and analysis.
-
The authors confirm contribution to the paper as follows: literature conception and design: Hao W, Li P; medical records collection, cases follow-up, draft manuscript and figure preparation: Meng E. All authors contributed to literature review and case presentation, and approved the final version of the manuscript.
-
All the data are available in the patient’s clinical chart. Further enquiries can be directed to the corresponding author on reasonable request.
-
We extend our gratitude to the dedicated members of the pathology laboratories at the First Affiliated Hospital of Nanjing Medical University for their invaluable support and assistance.
-
The authors declare that they have no conflict of interest.
- Copyright: © 2025 by the author(s). Published by Maximum Academic Press, Fayetteville, GA. This article is an open access article distributed under Creative Commons Attribution License (CC BY 4.0), visit https://creativecommons.org/licenses/by/4.0/.
-
About this article
Cite this article
Meng E, Li P, Cheng X, Wu X, Wu H. 2025. Primary Gastric Choriocarcinoma (PGC) combined with intestinal fibroblast differentiation-type Alpha-fetoprotein Producing Gastric Cancer (AFPGC) and liver metastasis: a case report. Gastrointestinal Tumors 12: e002 doi: 10.48130/git-0025-0003 

| Sample number | Grape wine varieties | Country of origin | Alcohol content (V/V %) |
| 1 | Cabernet Sauvignon-A | China | 12.0 |
| 2 | Cabernet Sauvignon-B | China | 13.0 |
| 3 | Cabernet Sauvignon-C | China | 12.5 |
| 4 | Cabernet Sauvignon-D | China | 12.0 |
| 5 | Cabernet Sauvignon-E | France | 12.0 |
| 6 | Cabernet Gernischt-A | China | 12.5 |
| 7 | Cabernet Gernischt-B | China | 12.5 |
| 8 | Shiraz-A | China | 13.0 |
| 9 | Shiraz-B | Australia | 14.5 |
| 10 | Pinot Noir-A | China | 13.0 |
| 11 | Pinot Noir-B | China | 12.0 |
| 12 | Merlot-A | Australia | 13.5 |
| 13 | Merlot-B | Australia | 14.0 |
| 14 | Merlot-C | Australia | 13.8 |
| 15 | Merlot-D | China | 12.5 |
| 16 | Tempranillo | Spain | 13.0 |
| 17 | Chardonnay | Australia | 13.0 |