-
Maintaining turf quality requires large amounts of water to be applied through irrigation systems[1]. Water conservation is one of the biggest challenges that turfgrass management faces, especially in semi-arid and arid regions. Over the past few decades, many studies showed that deficit irrigation could reduce turfgrass water requirements while maintaining turf quality[2,3]. Predictably, transpiration rates (Tr) will increase as the climate warms, and deficit irrigation may become necessary, especially during periods of water restriction and drought stress[4,5]. In addition to regular irrigation, turfgrass also need frequent fertilization, especially nitrogen fertilizer. However, irrational fertilization of turf leads to environmental degradation, such as non-point source pollution[6,7]. The high water and nitrogen requirements of turfgrass often result in high nitrogen losses from the soil[8,9]. There is no doubt that the use of chemical fertilizer contributes to increasing turf quality. However, over-fertilisation not only fails to improve nitrogen utilization efficiency, but also results in the deterioration of water and soil quality[6,10] and increased greenhouse gas emissions[11]. It is clear that improving the efficiency of water and nitrogen utilization in agricultural systems is particularly important to mitigate the conflict between increasing water and nitrogen demand and a deteriorating environment[12,13]. Therefore, it's particularly important to understand how to improve the efficiency of water and nitrogen utilization efficiency in plants through soil management practices to protect the ecosystem under conditions of limited water and fertilizer resources.
As one of the most common abiotic stresses, drought can lead to stunted plant growth and reduced productivity[14]. Drought stress could affect plant growth by damaging photosynthesis-related structures, decreasing nutrient uptake, and disrupting metabolic processes, such as water balance and hormone production[15]. Moreover, drought stress could also disrupt the dynamic balance of reactive oxygen species (ROS) in plants[16]. High accumulation of ROS can induce a series of oxidative reactions including breaking cell membranes, denaturing various enzymes in the cell membrane, and damaging nucleic acids, that finally increase membrane permeability and cause chlorophyll degradation leading to severe plant injury or death[17,18]. Mitigating the negative effects of drought stress under limited water resources is particularly important. Plants have developed various strategies to reduce ROS damage under drought stress by altering the activity of a number of antioxidant enzymes such as catalase (CAT), peroxidase (POD), superoxide dismutase (SOD) and ascorbate peroxidase (APX), or by increasing the content of related osmoregulatory substances such as Ca2+, free amino acids, K+, etc.[19,20], or by increasing the abscisic acid (ABA) content in leaves to promote stomatal closure and reduce water loss[21].
Biochar, a carbon-containing complex produced under anoxic conditions, has received widespread attention for its benefits in improving soil performance, promoting plant growth, reducing nutrient loss, and increasing water and nitrogen utilization efficiency[22,23]. In agronomic crops, for example, maize (Zea mays L.) yield and water productivity were significantly improved by the addition of biochar[24]. In Inner Mongolia, China, as the optimal application rate to reduce costs and increase tomato (Lycopersicon esculentum Mill.) yield, 30 t·ha−1 of biochar could maximize soil water content (SWC) and nutrients[25]. In Ningxia, China, biochar addition improved soil quality, yield, and water and nitrogen utilization efficiency in cucumber (Cucumis sativus L.)[26]. Similarly, in turfgrass, the addition of biochar improves the nutrient availability of the soil and the dry matter of Kentucky Bluegrass (Poa pratensis L.) increases proportionally with the amount of biochar added[27]. Biochar addition improves the quality of tall fescue (Festuca elata) under deficit irrigation conditions[28]. In summary, biochar combined with chemical fertilizer application on deficit irrigated soils was effective in improving soil nutrient availability and water use efficiency, as well as plant growth[27−31]. A previous study evaluated the effectiveness of biochar in mitigating independent drought stress in perennial ryegrass (Lolium perenne L.)[32], however, the effects of biochar on topsoil nutrient availability and plant water and nitrogen utilization efficiency under different fertilization regimes in perennial ryegrass are still unclear.
Perennial ryegrass is not only one of the forage grasses with high nutritional value as well as a groundcover, but is also often used for urban landscaping and sports fields as turfgrass species[33,34]. The objectives of our experiment were to: (i) determine the effects of biochar on soil moisture content, nutrient availability, and plant growth under different irrigation and fertilization regimes; (ii) explore the interrelationships between plants and soil through principal component analysis (PCA); and (iii) develop management practices to reduce water and nitrogen use and prevent environmental pollution.
-
Perennial ryegrass (cv. 'sunbrust') seeds were purchased from Shanghai Tiancheng Grass Service Co. Ltd (Shanghai, China). Biochar was purchased from Zhenjiang Zedi Agricultural Biotechnology Co. Ltd (Zhenjiang, China). The experimental soil was a sandy loam, collected from the turf base of the teaching and research base of Nanjing Agricultural University (Nanjing, China). The physicochemical parameters of the soils and biochar are listed in Table 1.
Table 1. Physicochemical parameters of experiment materials.
Material pH EC
(μS·cm−1)Total N
(g·kg−1)Total P
(g·kg−1)Total K
(g·kg−1)Available N
(mg·kg−1)Available P
(mg·kg−1)Available K
(mg·kg−1)Soil 6.61 152.63 1.19 0.81 3.25 30.58 18.21 50.85 Biochar 8.32 − − − − 85.36 316.59 653.86 Note: '−' represents no data; EC, electrical conductivity. Experiment design
-
This experiment was conducted in a glass greenhouse at Nanjing Agricultural University (118°80' E, 32°06' N) from November 2022 to January 2023. Greenhouse conditions were set at 25/17 °C (day/night temperature), 50% relative humidity, and 900 µmol·m−2·s−1 photosynthetic photon flux density, with a 12 h photoperiod. A completely randomized design with three factors including irrigation (I), biochar (B), and nitrogen (N) was used for this experiment. There were two irrigation (I) levels (deficit irrigation, D = 60%; well-watered irrigation W = 90% maximum water holding capacity), two biochar (B) levels (B0 = non-biochar and B1 = 5% biochar), and three N levels (N0 = 0 g, N1 = 0.22 g, 200 kg·N·ha−1; and N2 = 0.33 g, 300 kg·N·ha−1). Urea was used as the N in this experiment. Biochar was applied to the soil at a 5% (w/w) ratio. The soil and biochar were thoroughly mixed before being filled into plastic pots (diameter 10 cm, height 25 cm). There were four pots as four replicates for each treatment.
To measure the maximum water holding capacity, pots were weighed after full irrigation (water draining from the bottom). Then, soil was dried in an oven at 105 °C to a constant weight. Based on the ratio of 60.00 g of seed per square meter[32], and considering the percentage of seed germination, each pot was sown with 2.00 g of seed. The pots were fully watered immediately after sowing. Deficit irrigation was applied after seed germination. The experiment lasted a total of 50 d after the seeds were sown in pots. Samples of soil and plant were analyzed at the end of the experiment.
Soil sample collection
-
Soil samples without roots were collected and mixed well. A portion of the homogeneously mixed soil was taken and divided into two parts. The fresh soil was used to determine soil water content (SWC),
${\text{NH}^+_4} $ ${\text{NO}^-_3} $ Soil and plant physicochemical parameters
-
Soil EC and pH (soil:water = 1:5, w/v) were determined by soil EC Meter (DDSJ-308F, LeiCi, China) and pH Meter (FieldScout pH400, SPECTRUM, USA), respectively. Gravimetric SWC was determined as SWC = (weight before drying − weight after drying)/weight after drying. One mol·L−1 CH3COONH4 leaching followed by flame photometry (BWB Technologies Ltd., UK) was used to determine soil available K (AK). Soil available P (AP) was measured by extraction-molybdenum antimony colorimetric method after leaching with 0.50 mol·L−1 NaHCO3[35]. Soil available N (
${\text{NH}^+_4} $ ${\text{NO}^-_3} $ Plant photosynthetic parameters
-
Four mature leaves were used to measure photosynthetic rate (Pn), stomatal conductance (gs), and Tr through a portable photosynthesis system (Li-6400, LICOR, Inc., Lincoln, NB, USA) from 9:30−11:30 a.m. with chamber temperature at 25 °C, light intensity of 1,000 μmol·m−2·s−1, and an airflow velocity of 400 μm·s−1. Photochemical efficiency (Fv/Fm) was measured using by advanced continuous excitation total chlorophyll fluorimeter (Handy-PEA; Hansatech Instruments, UK). Plant instantaneous water use efficiency (WUEins) = Pn/Tr.
Plant growth and biochemical parameters
-
The above-ground parts of perennial ryegrass were dried to constant weight in an oven at 80 °C and the total dry biomass weight (DW) was measured. Total chlorophyll content was determined using an ethanol-acetone-water mixture extraction method[36]. Malondialdehyde (MDA) content and peroxidase (POD) activity were analyzed with assay kits (Shanghai Yuanye Bio-Technology, Shanghai, China) (MDA assay kit, R21874-50T; POD assay kit, R30312-50T). Superoxide dismutase (SOD) activity was measured by SOD assay kit (Bestbio Biotechnology, Nanjing, China) (BB-51053-50T). Abscisic acid (ABA) was determined by ABA assay kit (ANG-E55019P) (Njaoqing Biotechnology, Nanjing, China).
Plant water and nitrogen utilization efficiency
-
When the water deficit treatment was initiated, the pots were weighed and supplemented with irrigation every other day. Plant water use (PWU) was calculated as the sum of the supplemental irrigation water during the treatment period[37]. Plant water use efficiency (WUEp) was the ratio of PWU to DW[38]. Nitrogen agronomic efficiency (NAE, kg·kg−1 N) = (yield in N addition area − yield in N-free area)/nitrogen addition[39]. The yield in this experiment is DW. WN0B0 and WN0B1 are the non-biochar added and biochar added N-free treatments under well-watered irrigation, respectively. DN0B0, DN0B1 are the non-biochar added and biochar added N-free treatments under deficit irrigation, respectively.
Statistical analysis
-
All data were analyzed by SPSS Statistics 23 (SPSS Inc., New York, USA). Multi-factor ANOVA was used to analyze the interactions between B, I, and N as well as three-way interactions. When a particular F-test was significant, means were tested with Duncan at the 0.05 probability level. Relationships between soil and plant parameters were assessed using correlation heatmap, and further principal component analysis (PCA) was performed on all parameters with ORIGIN-Pro 2023. All figures were plotted with ORIGIN-Pro 2023 (OriginLab Inc., Northampton, MA, USA).
-
The effects of B, I, and N on soil physicochemical parameters are shown in Table 2 and Fig. 1. Biochar increased soil pH, EC, and SWC regardless of irrigation and N regimes (p < 0.05) (Fig. 1). STN, STP, STK, and AP were found to be significantly affected only by B (Table 2). Compared to non-biochar addition, biochar addition significantly increased soil AK content (Table 2). Soil AK content was significantly influenced by B, N, and I. There was an interaction between B and N on soil AK (Table 2). Soil AP was significantly higher in the biochar treatments than non-biochar treatments. Under the same irrigation regimes and N levels , biochar addition had significantly higher
${\text{NO}^-_3} $ ${\text{NH}^+_4} $ ${\text{NH}^+_4} $ ${\text{NO}^-_3} $ Table 2. Analysis of variance table and means of biochar (B), irrigation (I), and N fertilizer (N) treatments on soil physicochemical parameters. The meaning of treatments are different biochar (B0 and B1), nitrogen fertilization (N1 and N2) and irrigation (W and D).
Treatments Total N
(g·kg−1)Total P
(g·kg−1)Total K
(g·kg−1)Available K
(mg·kg−1)Available P
(mg·kg−1)${\text{NH}^+_4} $-N
(mg·kg−1)${\text{NO}^-_3} $-N
(mg·kg−1)WN0B0 1.21 ± 0.06c 0.80 ± 0.03b 3.23 ± 0.06b 17.99 ± 0.30f 51.67 ± 2.76b 3.52 ± 0.11ef 15.57 ± 0.71h WN1B0 1.26 ± 0.04bc 0.82 ± 0.04b 3.20 ± 0.04b 18.61 ± 0.99ef 52.22 ± 3.18b 6.90 ± 0.52c 44.17 ± 0.91e WN2B0 1.41 ± 0.05bc 0.82 ± 0.02b 3.26 ± 0.05b 18.96 ± 0.80ef 52.92 ± 4.88b 8.66 ± 1.10b 50.71 ± 1.14b WN0B1 1.78 ± 0.07a 1.16 ± 0.03a 4.21 ± 0.05a 27.27 ± 1.68d 121.99 ± 2.30a 3.68 ± 0.07e 18.51 ± 0.63g WN1B1 1.73 ± 0.19a 1.16 ± 0.06a 4.26 ± 0.17a 28.22 ± 0.75cd 124.40 ± 3.28a 6.97 ± 0.19c 47.64 ± 0.80c WN2B1 1.76 ± 0.21a 1.17 ± 0.05a 4.25 ± 0.09a 30.12 ± 0.99ab 124.56 ± 10.67a 9.21 ± 0.15a 55.98 ± 1.15a DN0B0 1.31 ± 0.04bc 0.81 ± 0.04b 3.15 ± 0.04b 18.29 ± 0.38ef 53.77 ± 2.40b 3.09 ± 0.18f 14.04 ± 1.43h DN1B0 1.23 ± 0.06c 0.82 ± 0.02b 3.22 ± 0.09b 18.90 ± 0.10ef 52.91 ± 2.59b 6.16 ± 0.05d 40.49 ± 1.77f DN2B0 1.27 ± 0.10bc 0.85 ± 0.06b 3.24 ± 0.06b 19.44 ± 0.46e 54.54 ± 2.86b 8.26 ± 0.07b 44.69 ± 1.48de DN0B1 1.76 ± 0.11a 1.18 ± 0.05a 4.25 ± 0.10a 28.86 ± 0.55bc 124.92 ± 5.95a 3.46 ± 0.11ef 14.85 ± 1.36h DN1B1 1.78 ± 0.12a 1.17 ± 0.04a 4.31 ± 0.14a 29.32 ± 1.09bc 126.06 ± 4.51a 6.50 ± 0.05cd 44.63 ± 1.10de DN2B1 1.80 ± 0.13a 1.17 ± 0.05a 4.32 ± 0.12a 31.16 ± 0.90a 125.79 ± 4.32a 8.50 ± 0.20b 46.36 ± 0.81cd ANOVA I ns ns ns *** ns *** *** N ns ns ns *** ns *** *** B *** *** *** *** *** ** *** I * N ns ns ns ns ns ns *** I * B ns ns ns ns ns ns * N * B ns ns ns * ns ns ns I * N * B ns ns ns ns ns ns * Each value is the average (± SE) of four biological replicates. Different letters in the table represent significant differences between treatments at the level of p < 0.05. *, **, and *** indicate significant levels at p < 0.05, p < 0.01, and p < 0.001, respectively; ns denotes no significance. The treatments are biochar (B0 and B1), nitrogen fertilizer (N0, N1, and N2) and irrigation (W and D). 
Figure 1.
Effect of different treatments on soil pH, electrical conductivity (EC), and soil water content (SWC). The different letters indicate significant differences (p < 0.05) between different treatments. The treatments are biochar (B0 and B1), nitrogen fertilizer (N0, N1, and N2) and irrigation (W and D).
Gas exchange parameters
-
Factors including B, I, and N had significant effects on photosynthetic parameters Pn, Tr, and gs in perennial ryegrass leaves (Table 3). Biochar and nitrogen fertilizer had positive effects on Pn, Tr, and gs under both well-watered and deficit irrigation conditions. Biochar addition significantly increased Pn, Tr, and gs under the same irrigation conditions and N levels (Fig. 2a−c). Biochar addition increased Fv/Fm under the same irrigation regimes and N levels (except WN2) (Fig. 2d).
Table 3. Analysis of variance table and means of biochar (B), irrigation (I), and N fertilizer (N) treatments on plant physiological parameters. The meaning of treatments are different biochar (B0 and B1), nitrogen fertilization (N1 and N2) and irrigation (W and D).
Factors Pn Tr gs Fv/Fm PWU WUEp WUEins DW TN TP TK POD SOD MDA ABA I *** *** *** ns *** *** *** *** *** *** ns *** *** *** *** N *** *** *** *** *** *** *** *** *** *** ns *** *** *** *** B *** *** *** *** *** *** *** *** ** *** *** *** *** *** *** I * N *** *** *** *** *** *** *** *** *** ns ns *** ns *** *** I * B *** ns ** ns ns *** *** *** *** ns ns *** * *** *** N * B *** *** *** *** ns *** ns *** ns ns ns *** *** ** *** I * N * B *** ns *** ns ns *** * *** ns ns ns *** *** *** *** Photosynthetic rate (Pn), transpiration rate (Tr), stomatal conductance (gs), photochemical efficiency (Fv/Fm), plan water use (PWU), plant water use efficiency (WUEp), instantaneous water use efficiency (WUEins), total dry biomass (DW), total N (TN), total P (TP), total K (TK), peroxidase (POD) activity, Superoxide dismutase (SOD) activity, malondialdehid (MDA) content, and abscisic acid (ABA) content. The outputs of the three-way ANOVA are shown where *, **, and *** indicate significant levels at p < 0.05, p < 0.01 and p < 0.001, respectively; ns denotes no significance. The treatments are biochar (B0 and B1), nitrogen fertilizer (N0, N1, and N2) and irrigation (W and D). 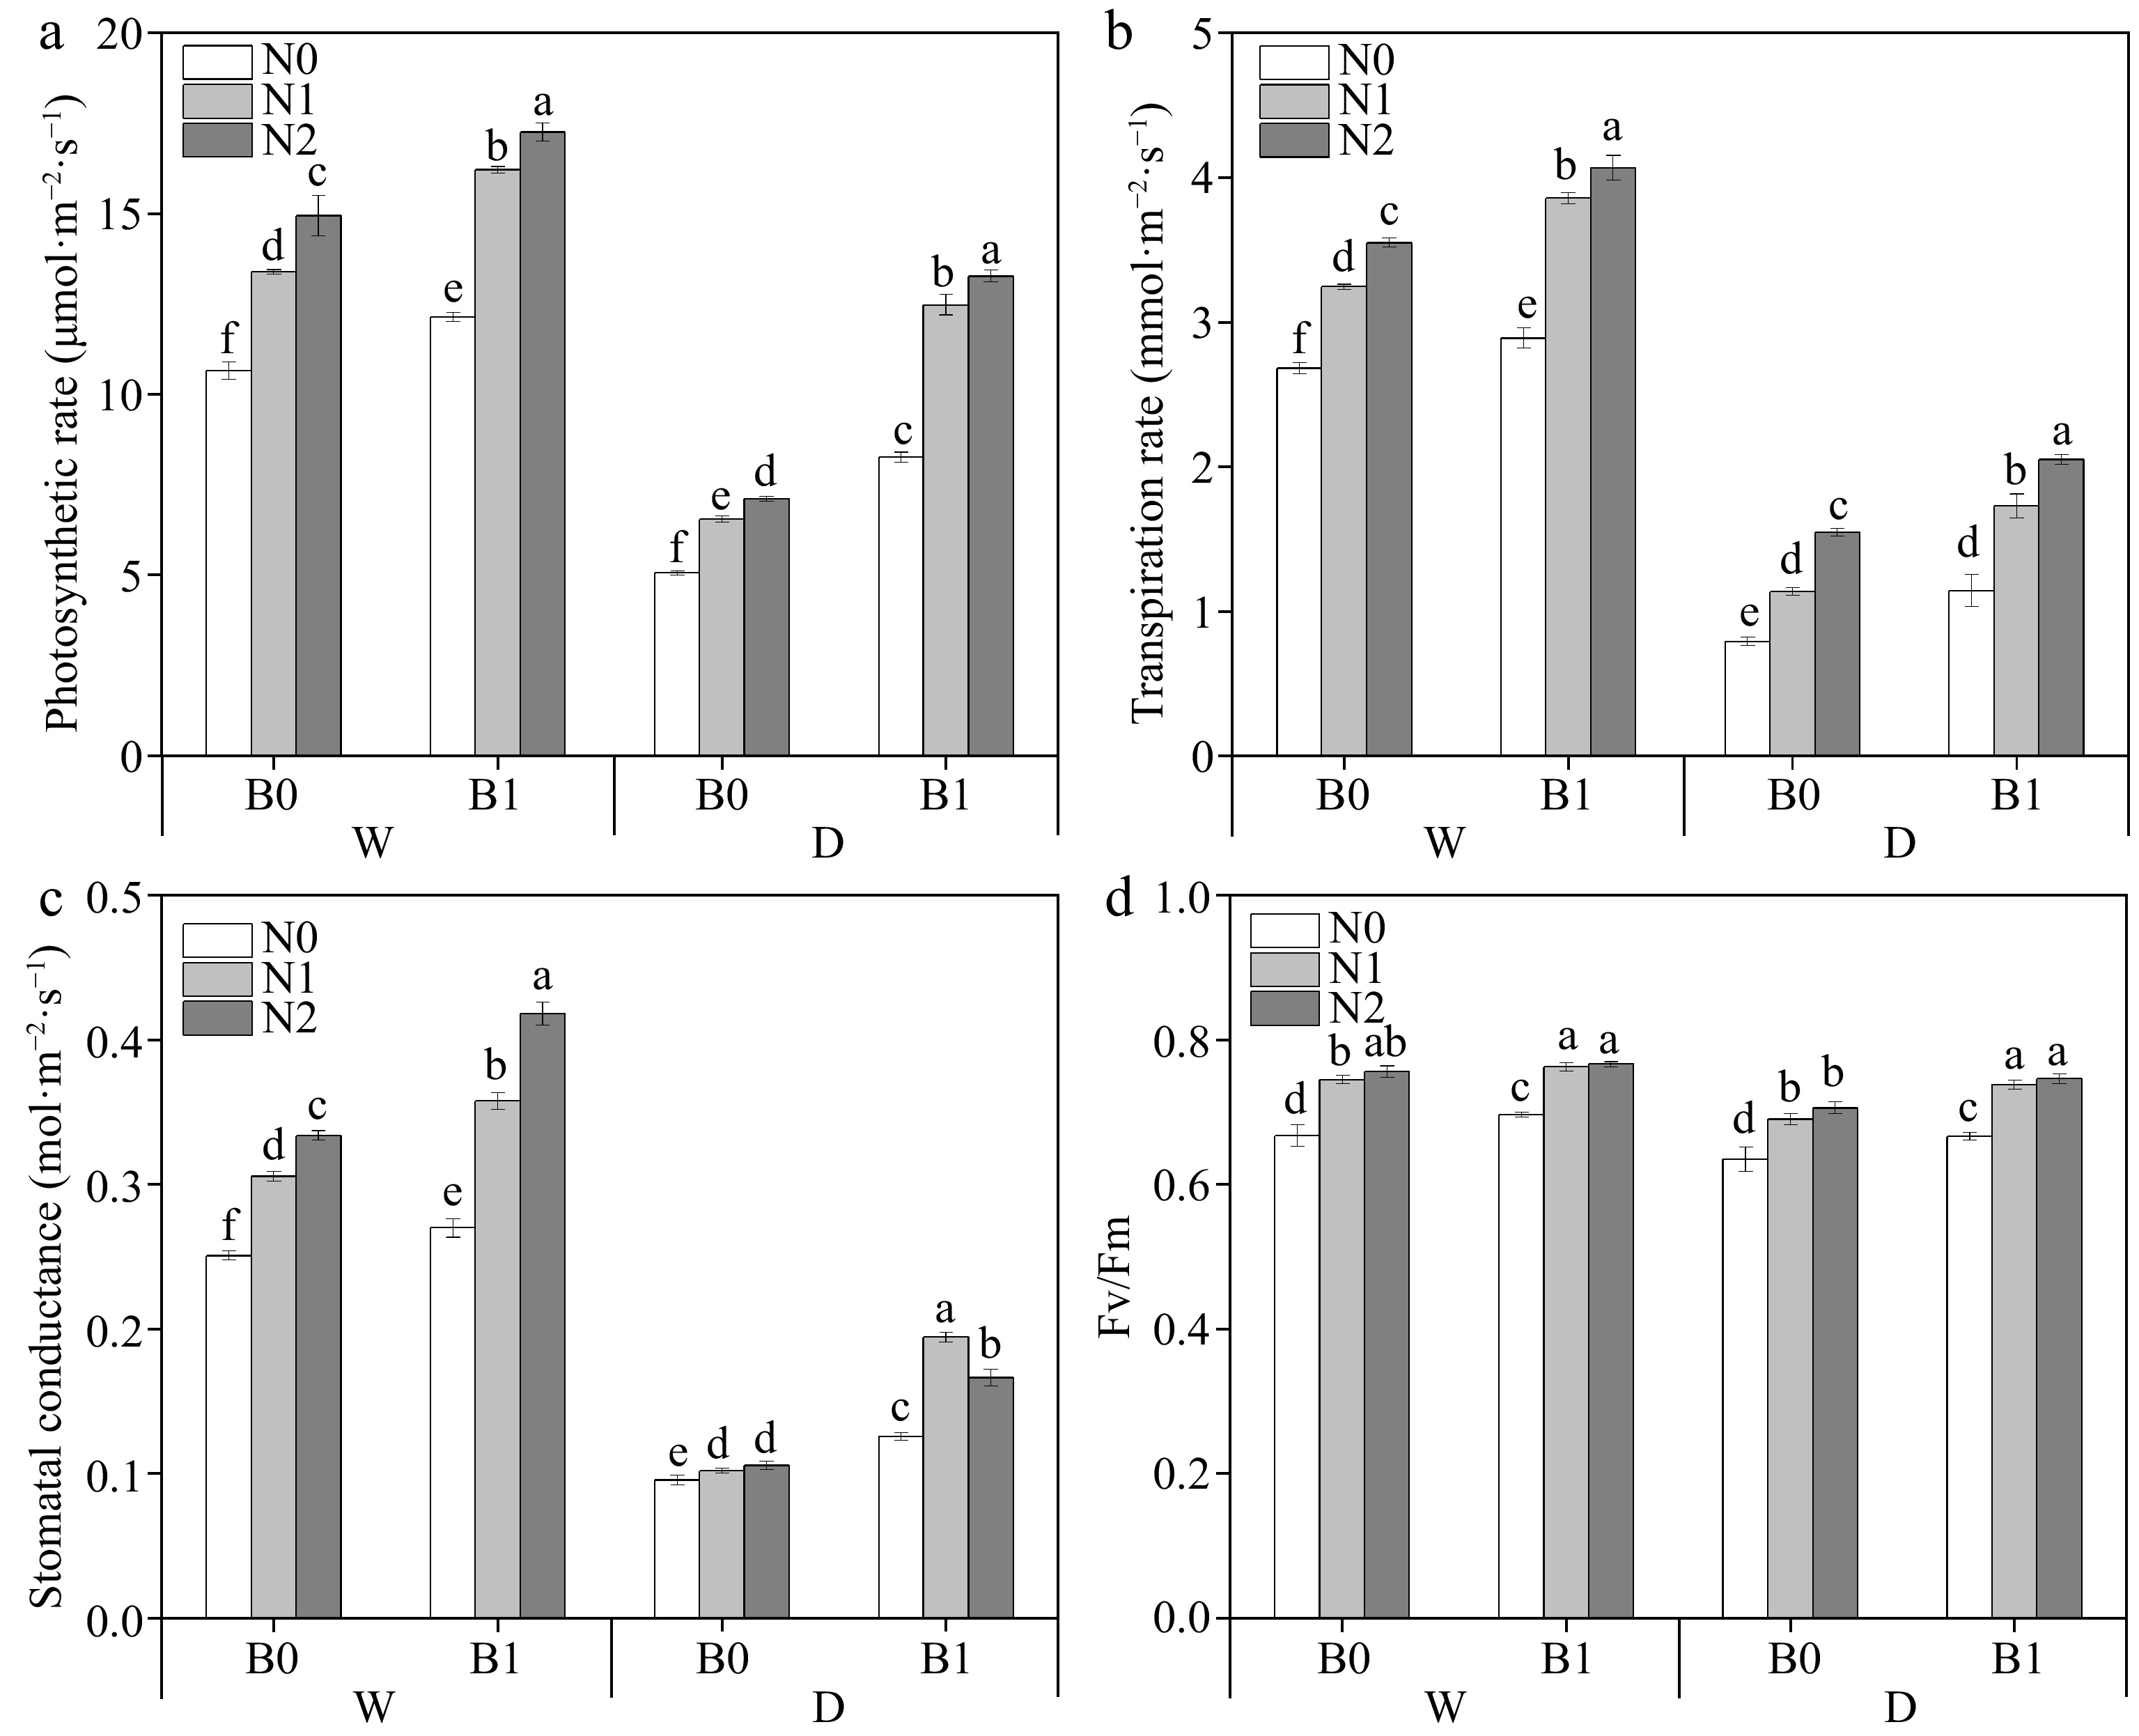
Figure 2.
Effects of different treatments on photosynthetic rate (Pn), transpiration rate (Tr), stomatal conductance (gs) and photochemical efficiency (Fv/Fm) in perennial ryegrass. The different letters indicate significant differences (p < 0.05). The treatments are biochar (B0 and B1), nitrogen fertilizer (N0, N1, and N2) and irrigation (W and D).
ABA and MDA content, POD and SOD activities of leaves
-
Factors including B, I, and N had significant effects on POD, SOD, MDA, and ABA of perennial ryegrass leaves. The three-way interaction (I * N * B) were significant on POD, SOD, MDA, and ABA (Table 3). Under well-watered irrigation conditions, nitrogen addition significantly reduced MDA content, whereas biochar addition had no significant effect (except WN1) (Fig. 3c). Under deficit irrigation, the non-biochar treatments had higher MDA content than the biochar treatments at the same N levels (p < 0.05). Under the same irrigation regimes and N levels, biochar application was able to significantly increase POD (except WN0) and SOD activities (Fig. 3a, b) and conversely significantly decreased ABA (Fig. 3d).
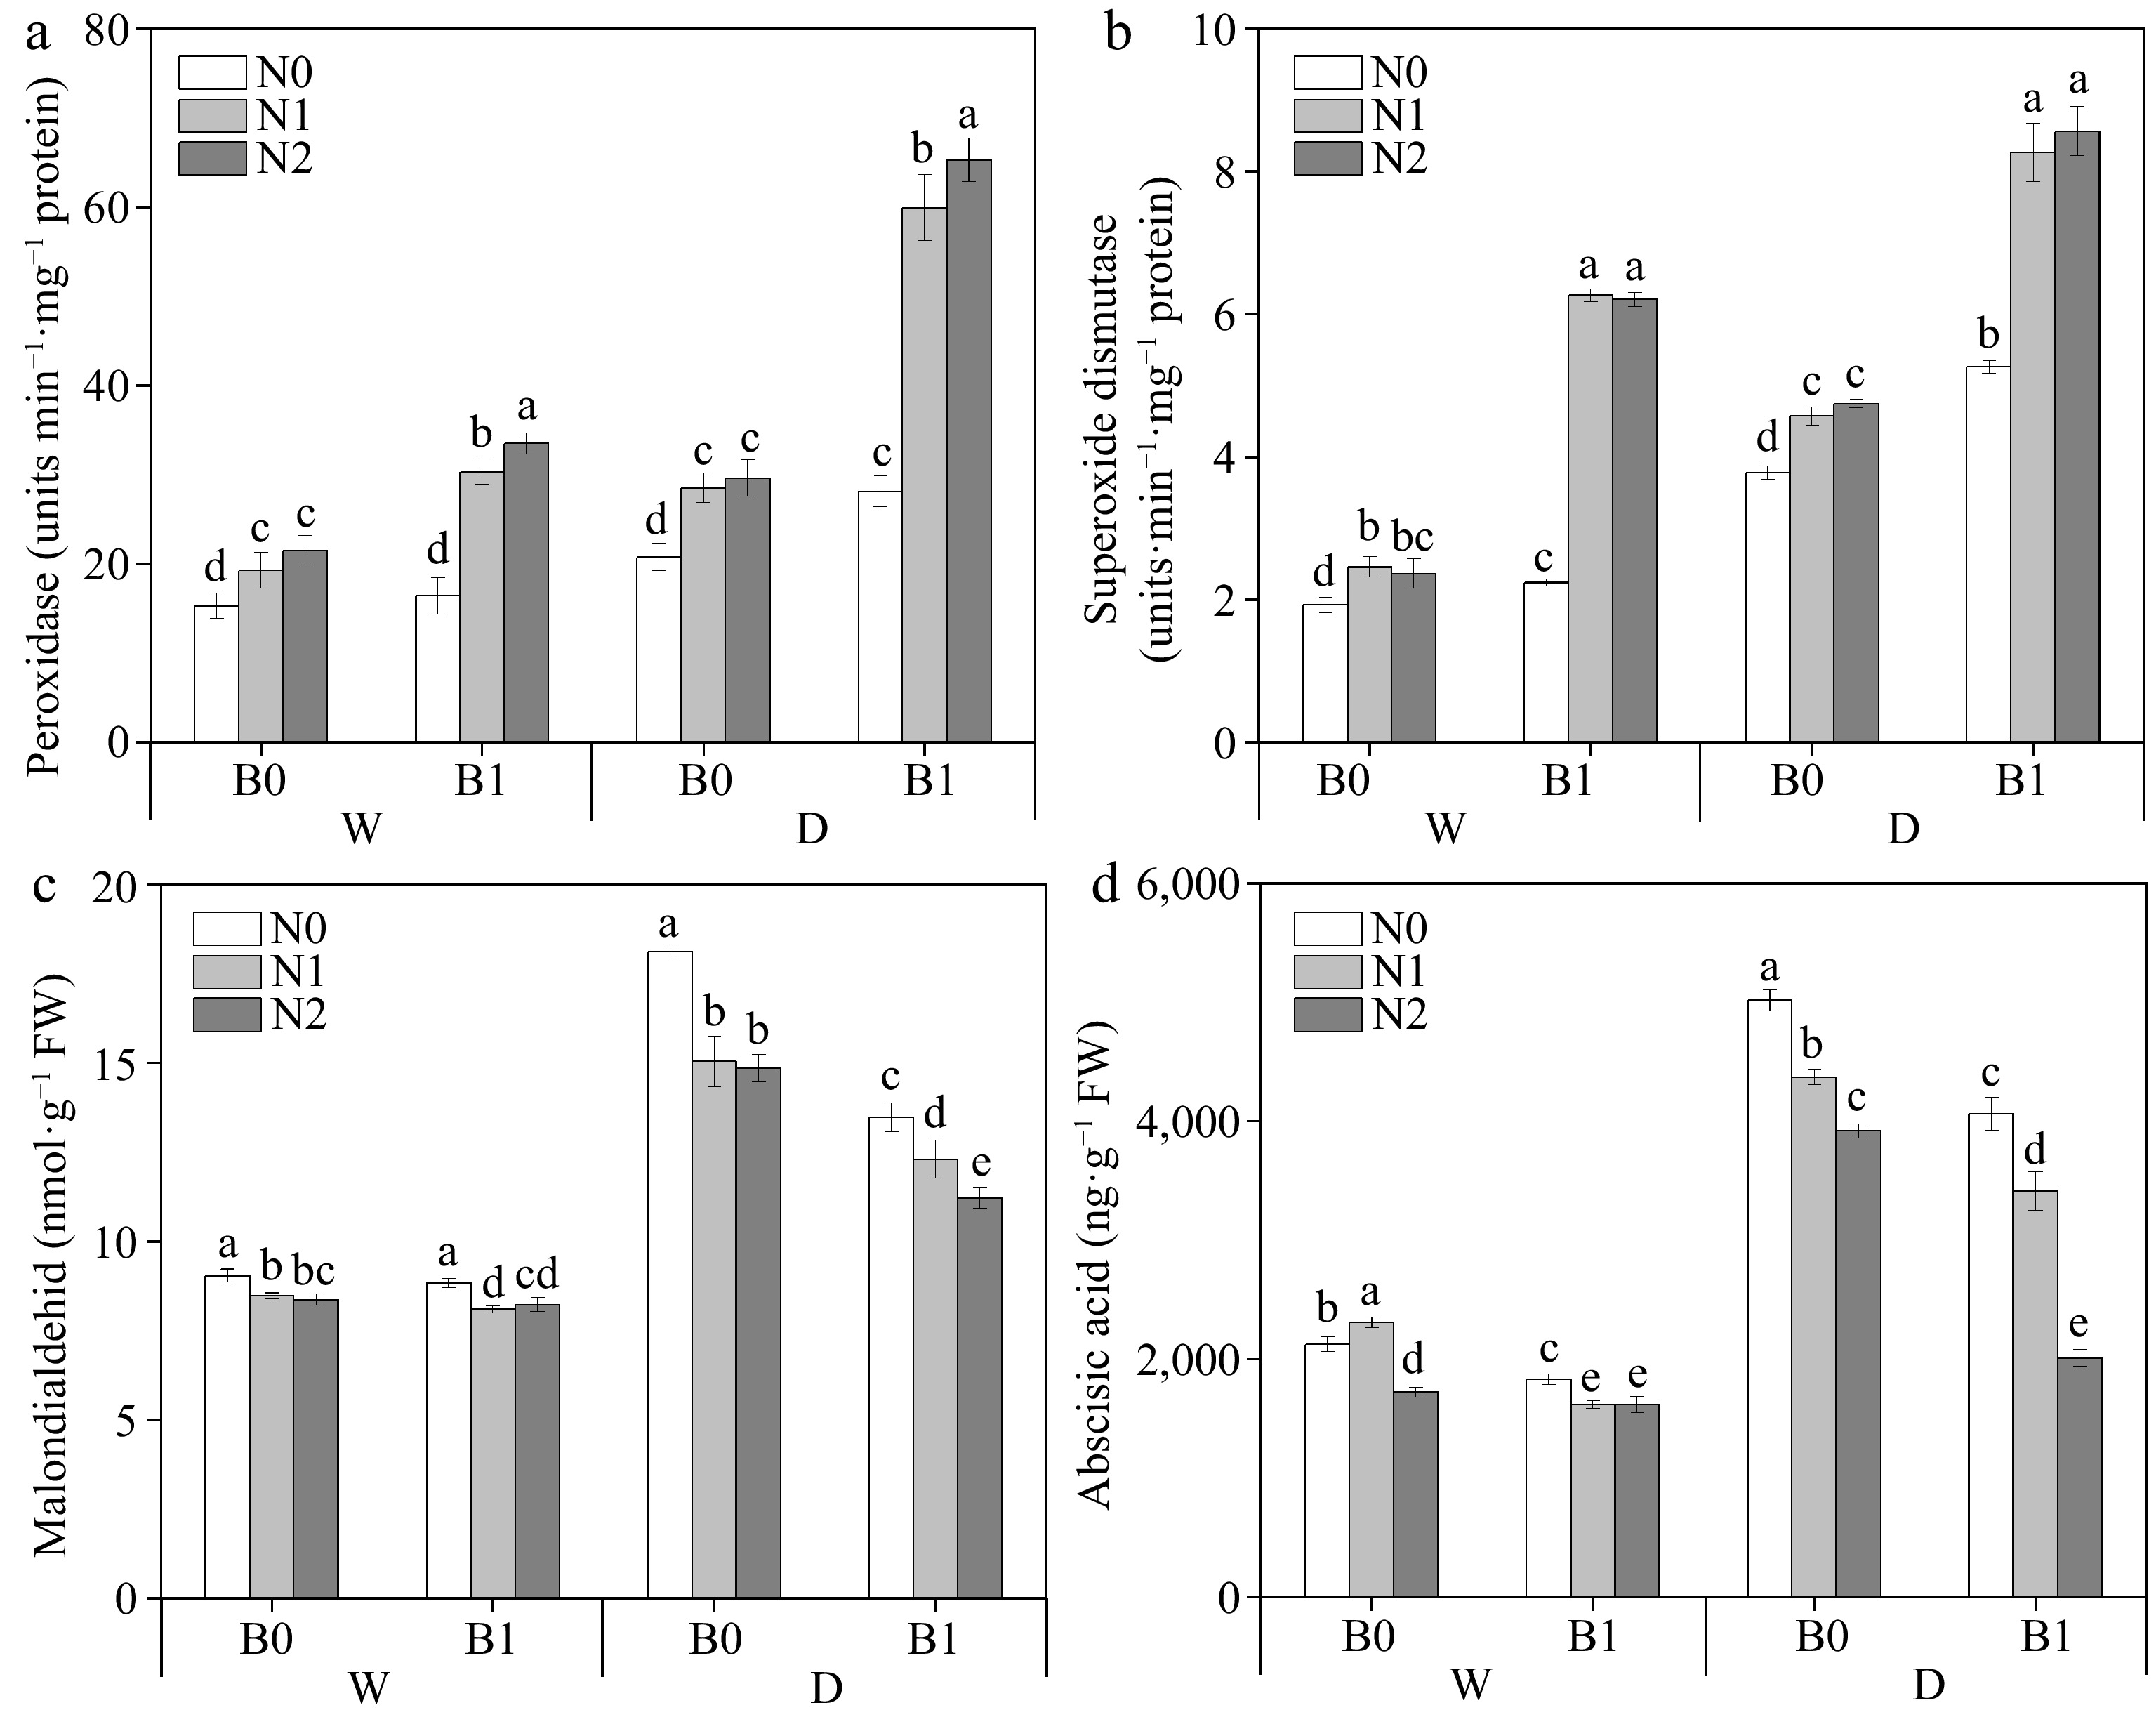
Figure 3.
Effects of different treatments on perennial ryegrass leaf peroxidase (POD) activity. (a) Photosynthetic rate, (b) superoxide dismutase (SOD) activity, (c) malondialdehid (MDA) content, and (d) abscisic acid (ABA) content. The different letters indicate significant differences (p < 0.05). The treatments are biochar (B0 and B1), nitrogen fertilizer (N0, N1, and N2) and irrigation (W and D).
Plant water use and efficiency, dry biomass
-
Three factors (B, I, and N) and their interactions significantly affected DM (Table 3). Similarly, PWU and WUEp were also affected by (B, I, and N) and I * N (Table 3). Under the same irrigation regimes, biochar addition and N supply significantly increased PWU (except for comparison between WN0B0 and WN0B1) and DM (Fig. 4a, d). The addition of biochar significantly increased WUEp under the same irrigation regimes and N levels (except WN0 and WN2) (Fig. 4b). It was found that under well-watered conditions, biochar addition only increased WUEins under N0. Under deficit irrigation, WUEins was significantly higher in biochar treated plants than that of non-biochar treatment at the same N levels (Fig. 4c).
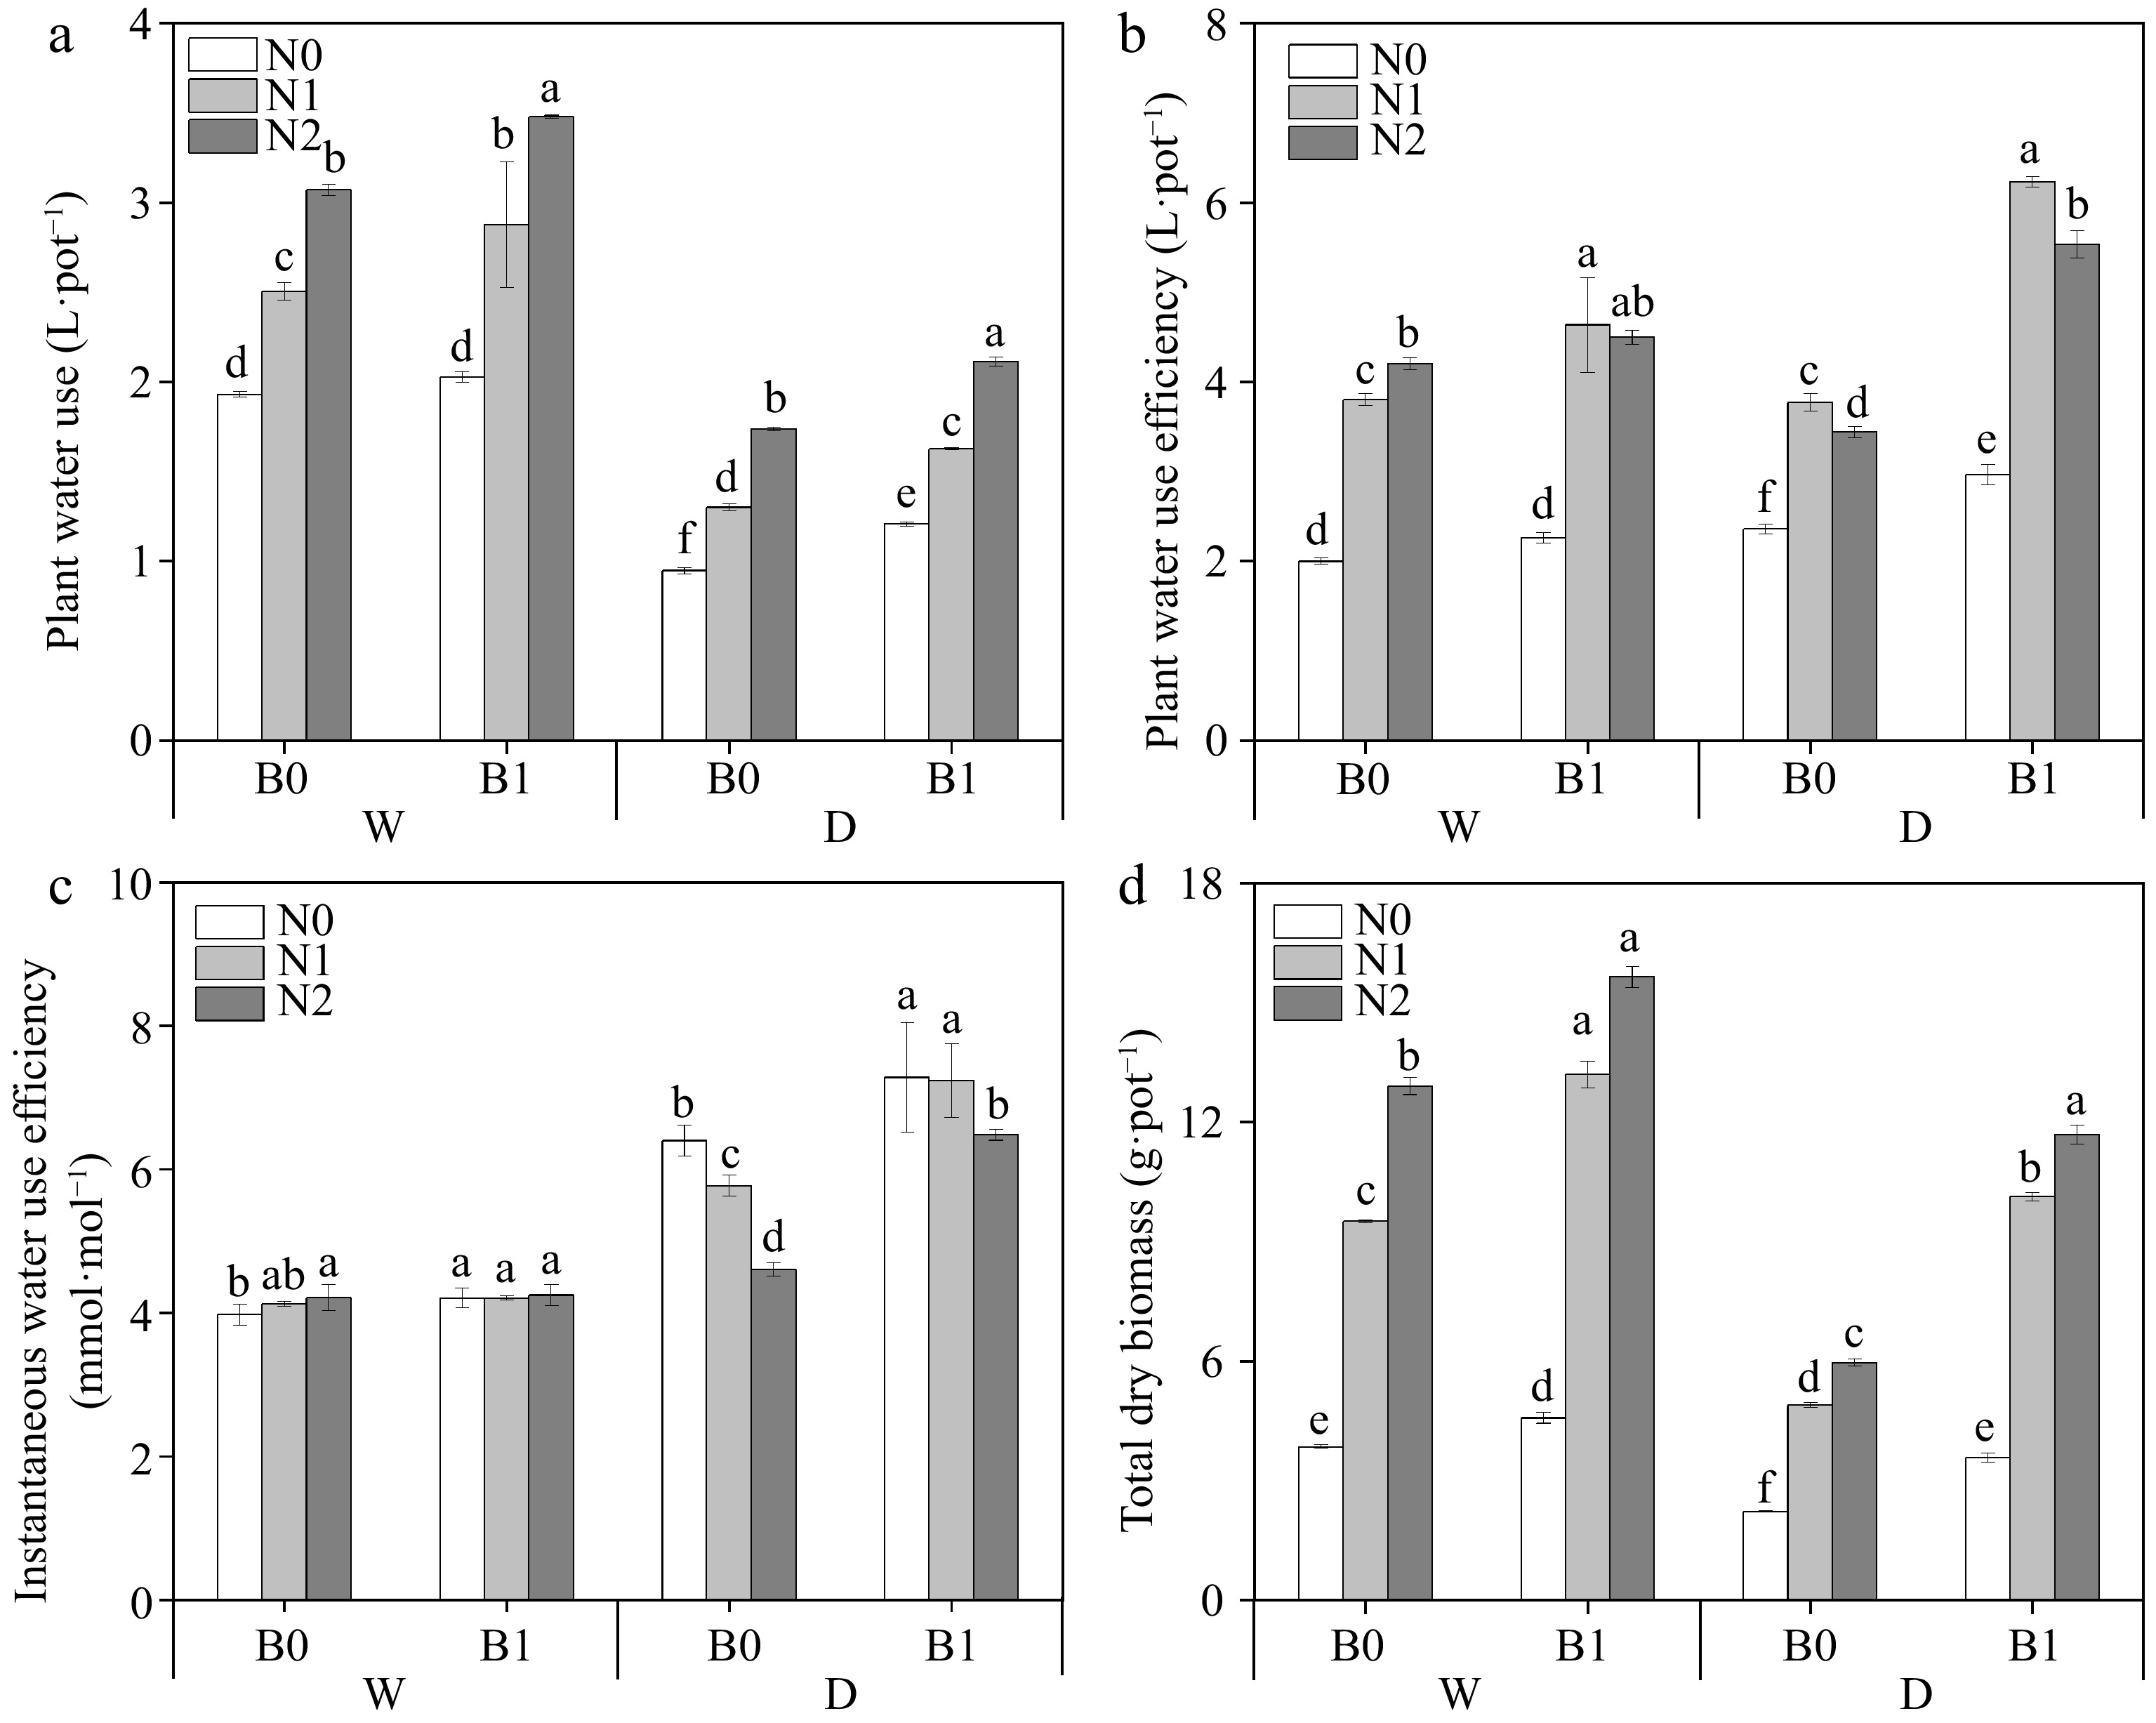
Figure 4.
Effects of different treatments on plant water use (PWU), plant water use efficiency (WUEp), instantaneous water use efficiency (WUEins) and total dry biomass (DW). The different letters indicate significant differences (p < 0.05). The treatments are biochar (B0 and B1), nitrogen fertilizer (N0, N1, and N2) and irrigation (W and D).
Leaf elemental content and total chlorophyll
-
Biochar significantly increased the total chlorophyll content of perennial ryegrass under the same irrigation regimes and N levels (Fig. 5a). All three factors (B, I, and N) had significant effects on leaf TN and TP, while leaf TK was only significantly affected by B (Table 3). Under the same irrigation regimes, leaf TN increased significantly with increasing N fertilizer. Under deficit irrigation, biochar addition significantly increased leaf TN compared to non-biochar addition at the same N levels (Fig. 5b). Leaf TP content was increased by biochar addition under well-watered conditions (except for the comparison between WN1B0 and WN1B1); under deficit irrigation, biochar increased leaf TP content of N2 (Fig. 5c). Biochar addition significantly increased leaf TK content under the same irrigation and nitrogen regimes (except N0) (Fig. 5d).
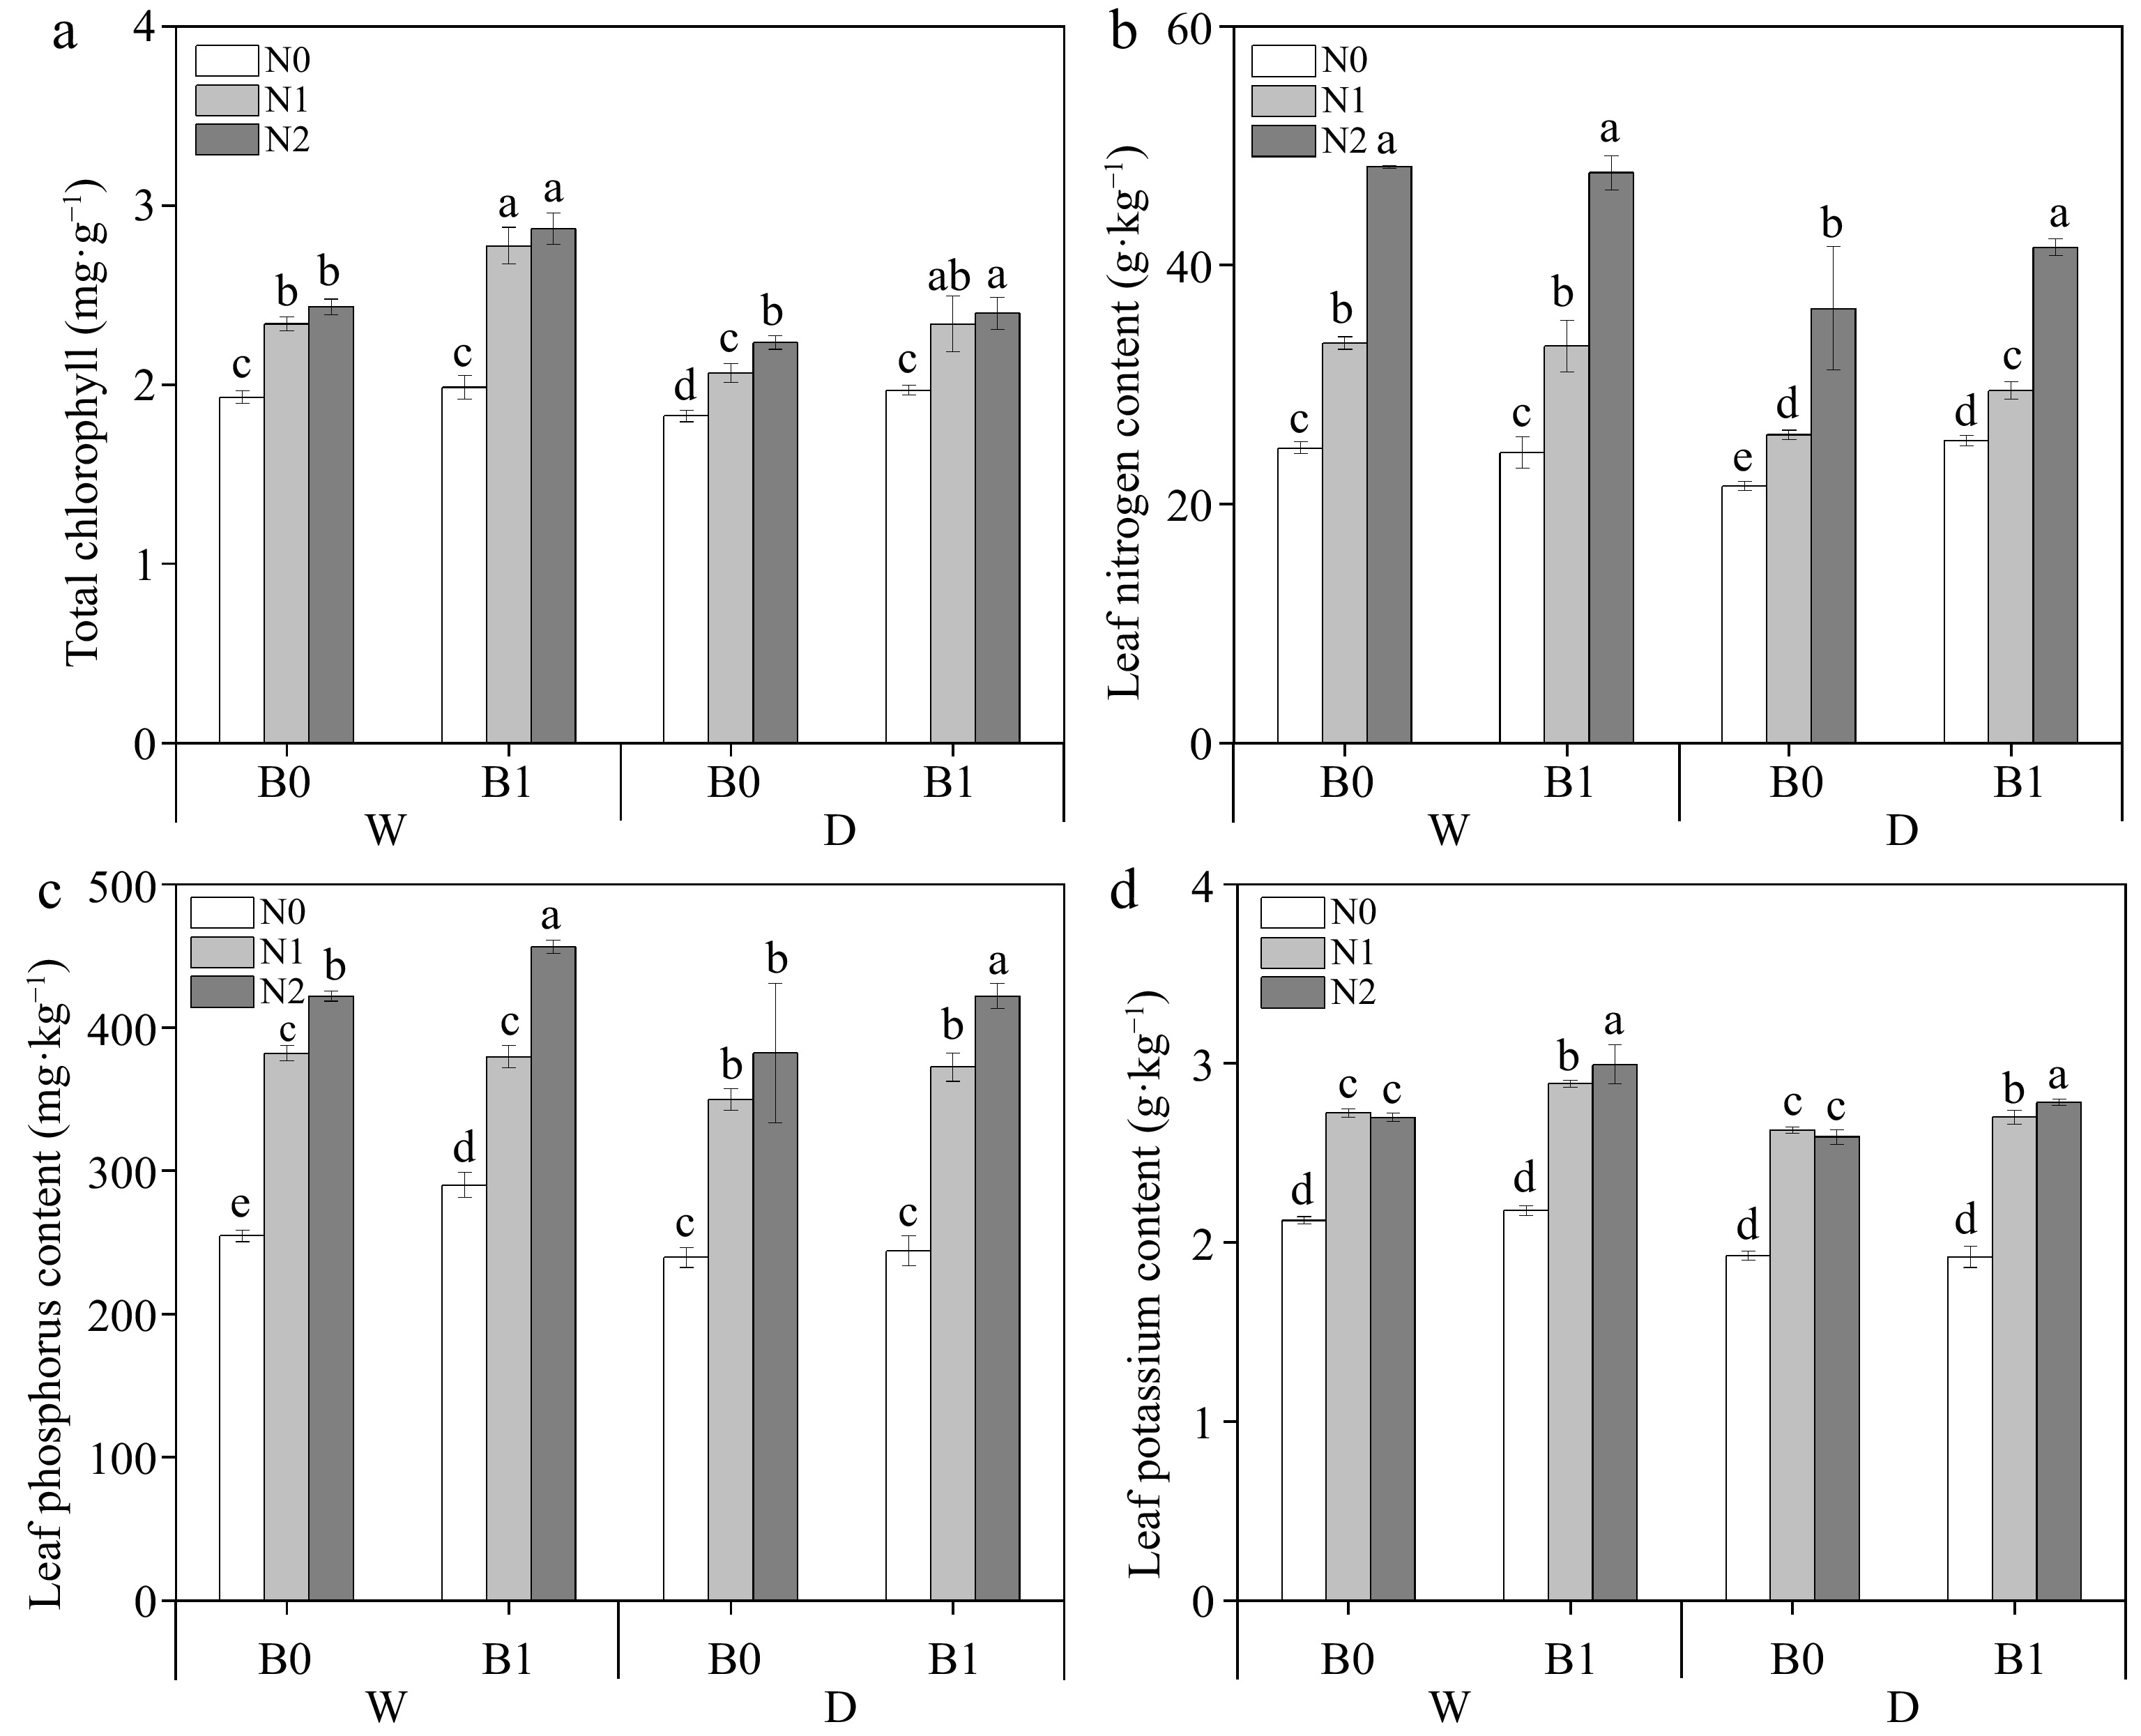
Figure 5.
Effect of different treatments on total chlorophyll content, total nitrogen (TN), total phosphorus (TP) and total potassium (TK) in perennial ryegrass leaves. The different letters indicate significant differences (p < 0.05). The treatments are biochar (B0 and B1), nitrogen fertilizer (N0, N1, and N2) and irrigation (W and D).
Nitrogen agronomic efficiency of plant
-
As shown in Fig. 6, among the non-biochar treatments, NAE was not significantly different between high (N2) and low (N1) under the same irrigation regimes. At the same N levels, biochar addition significantly increased NAE regardless of irrigation regimes. Interestingly, the NAE of WN1B1 and DN1B1 was significantly higher than that of WN2B1 and DN2B1, respectively.
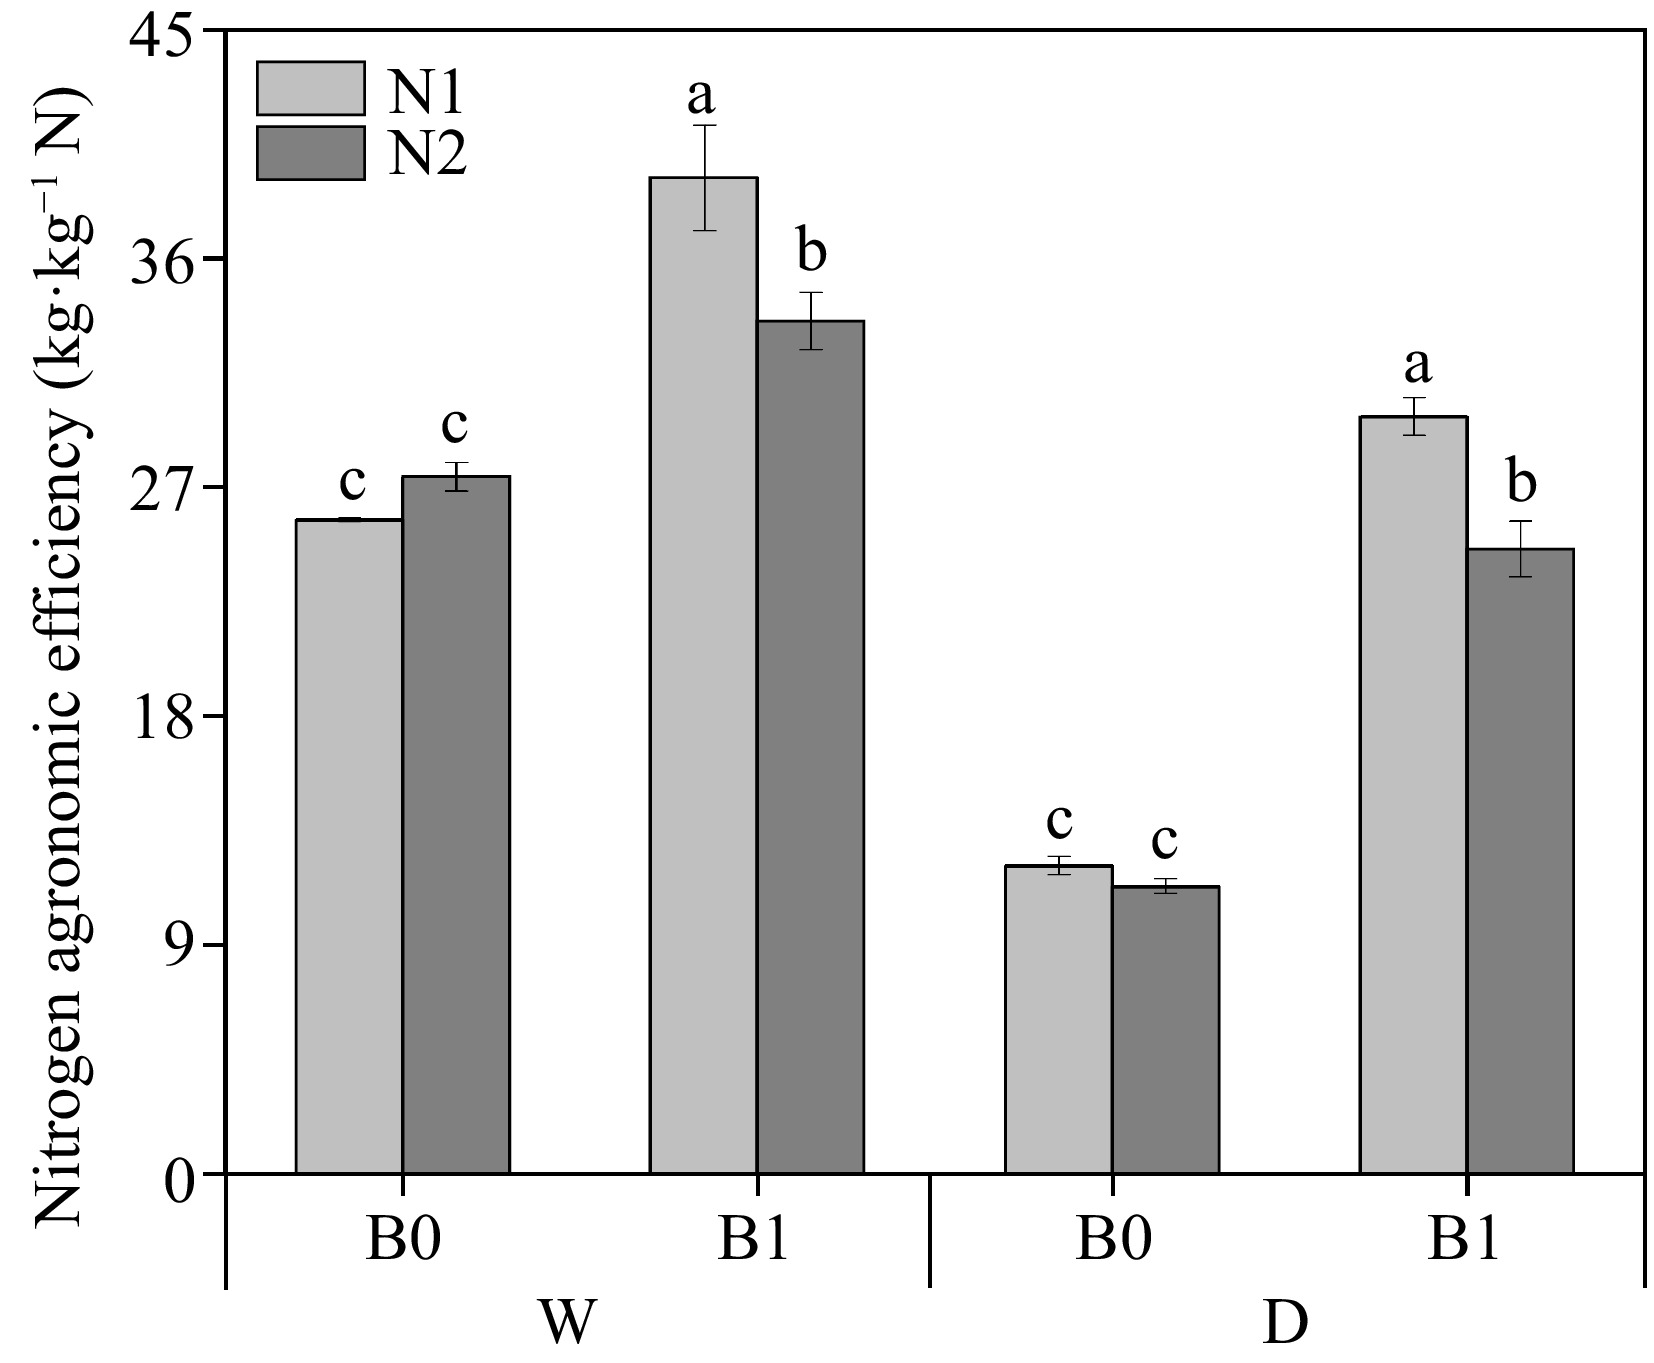
Figure 6.
Effect of different treatments on nitrogen agronomic efficiency (NAE) of perennial ryegrass. The different letters indicate significant differences (p < 0.05). The treatments are biochar (B0 and B1), nitrogen fertilizer (N1 and N2) and irrigation (W and D).
Relationship between plant and soil parameters
-
All data were divided into plant and soil parameters for correlation heatmap analysis (Fig. 7). MDA and ABA were negatively correlated with Pn, gs, Tr, Fv/Fm, TN, TP, TK, DM, and PWU, and positively correlated with WUEins in perennial ryegrass. POD and SOD were positively correlated with WUEins, TP, TK, DM, DM, and WUEp. Soil EC, AP, AK, and SWC were positively correlated with Pn and DM, and negatively correlated with ABA. Soil
${\text{NH}^+_4} $ ${\text{NO}^-_3} $ 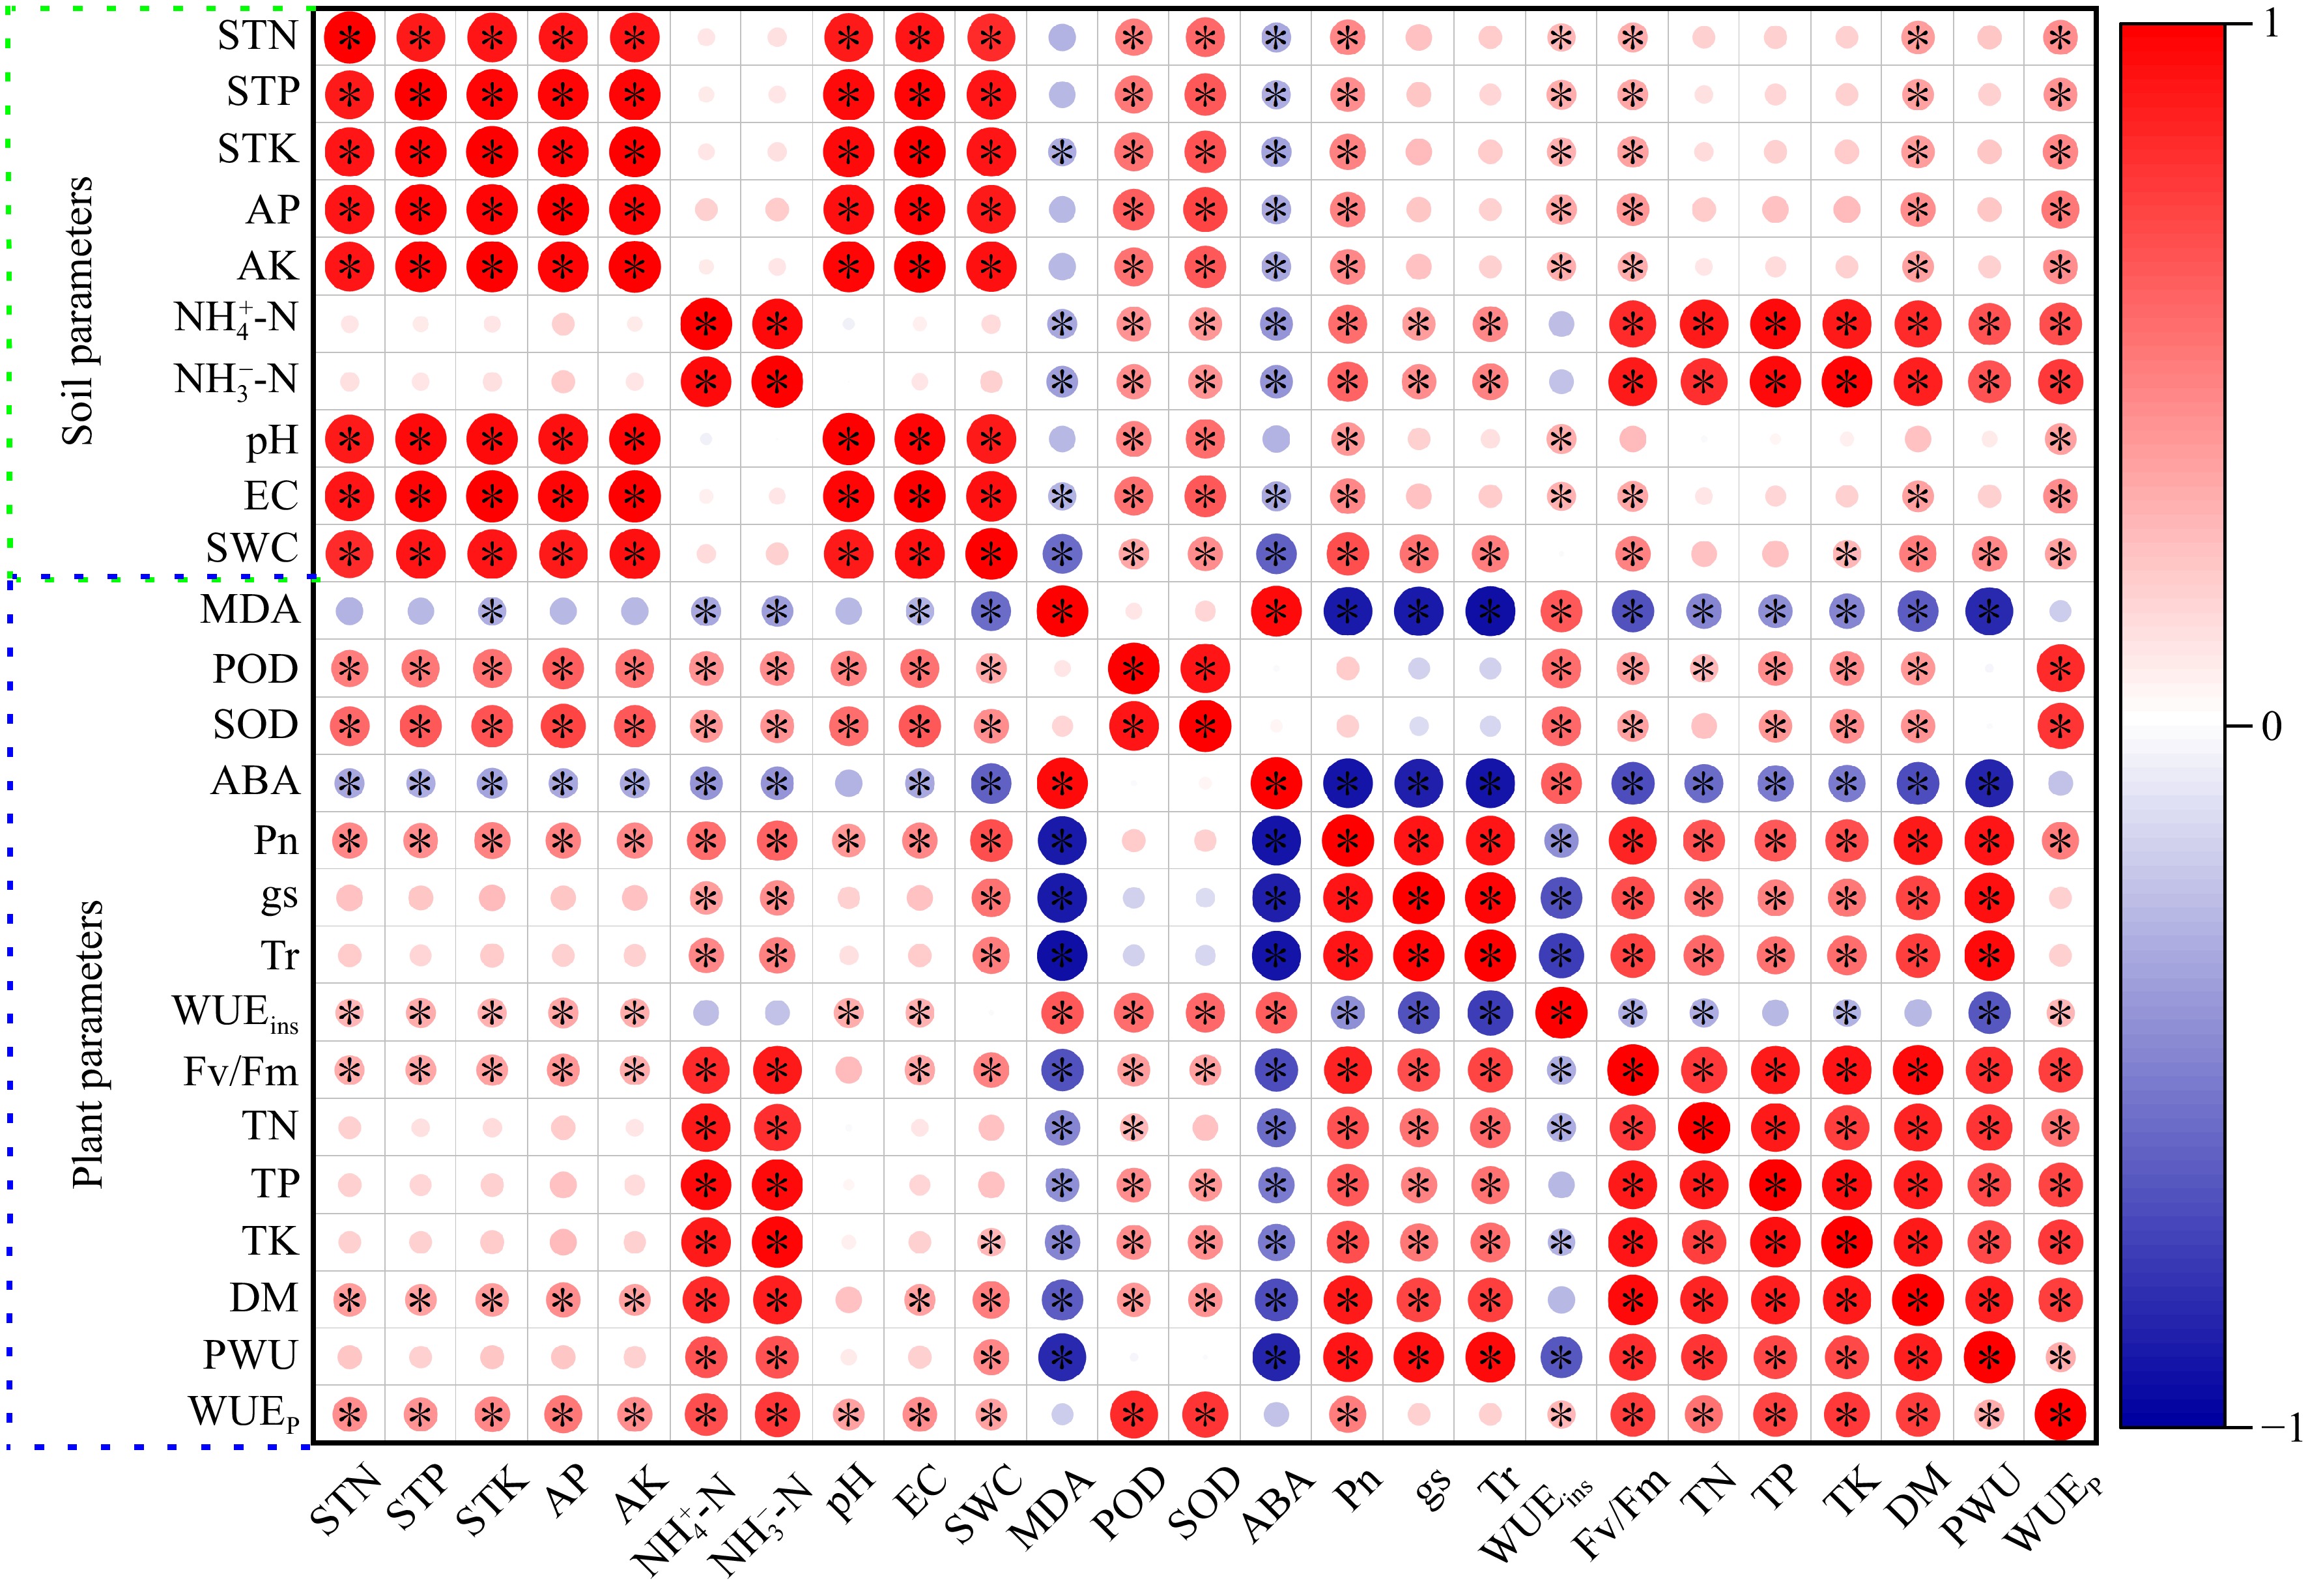
Figure 7.
Heatmap of Pearson's correlation coefficients between soil and plant system under well-watered (W) or deficit irrigation (D) with nitrogen fertilizer (N0, N1, and N2) supply and with biochar (B0 and B1). * stands for significant at the level of p < 0.05. Increases and decreases in abundance are indicated by bars of color, in red and blue, respectively. Photosynthetic rate (Pn), transpiration rate (Tr), stomatal conductance (gs), photochemical efficiency (Fv/Fm), plan water use (PWU), plant water use efficiency (WUEp), instantaneous water use efficiency (WUEins), total dry biomass (DW), total N (TN), total P (TP), total K (TK), peroxidase (POD) activity, Superoxide dismutase (SOD) activity, malondialdehid (MDA) content and abscisic acid (ABA) content, total N (STN), total P (STP), total K (STK), soil water content (SWC), electrical conductivity (EC), ${\text{NH}^+_4} $-N, ${\text{NO}^-_3} $-N and pH.
PC1 and PC2 explained 50.7% and 27.5% of the variation respectively (Fig. 8). The biochar and non-biochar treatments were generally separated by PC1. Biochar treatments were usually clustered on the right and the non-biochar treatments were usually clustered on the left. Pn, gs, Tr, TN, TP, TK, Fv/Fm, PWU, and DM in perennial ryegrass, and soil physicochemical parameters had a positive effect on the clustering of the biochar treatments. Non-biochar treatments were clustered mainly based on ABA, MDA, and WUEins. Irrigation regimes generally separated the treatments along PC2, with deficit irrigated treatments above and well-watered irrigation treatments below.
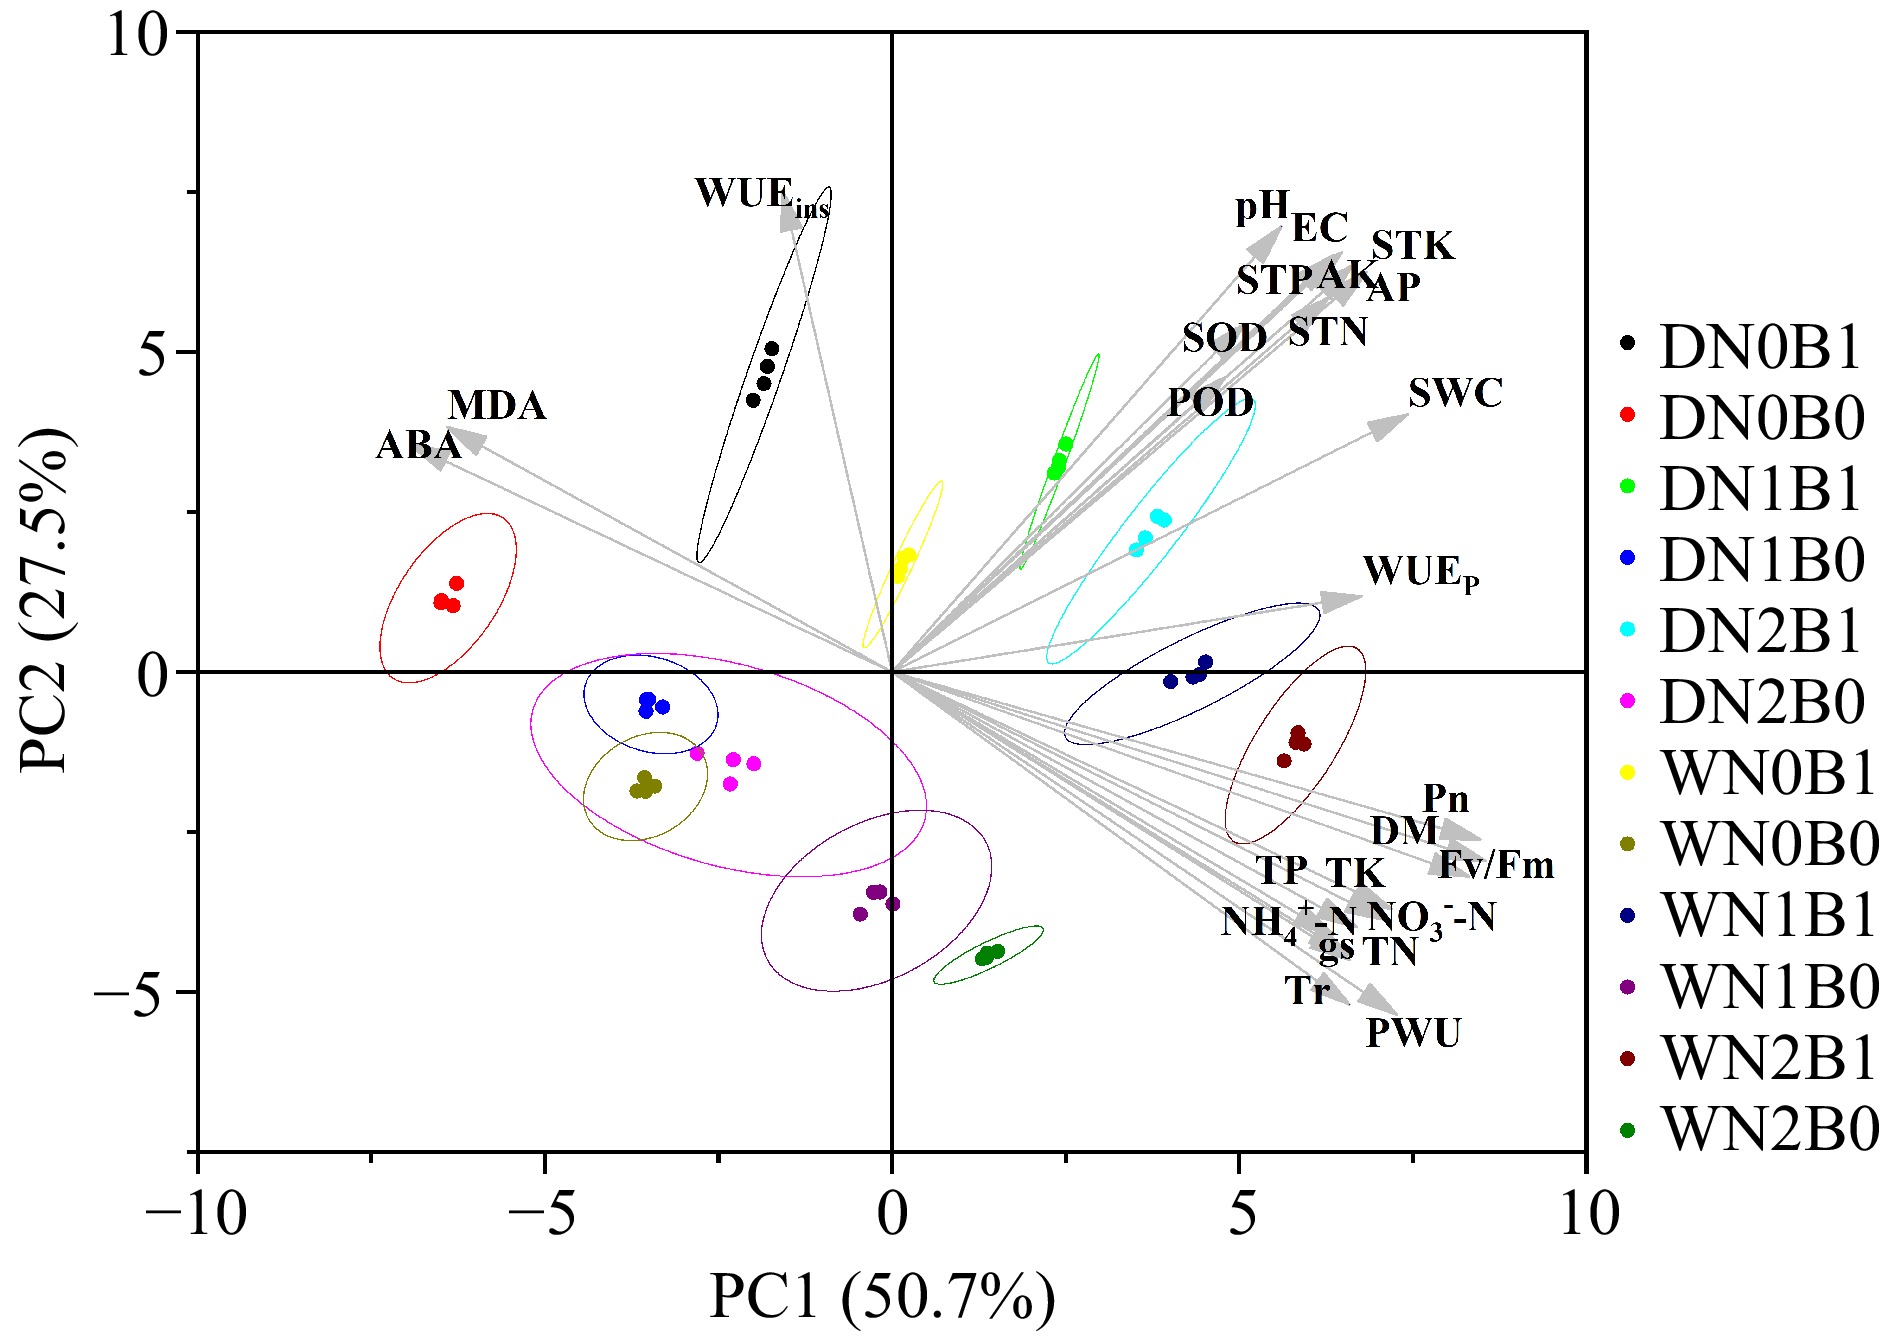
Figure 8.
Principal component analysis (PCA) of plant and soil parameters under well-watered (W) or deficit irrigation (D) with nitrogen fertilizer (N0, N1, and N2) supply and with biochar (B0 and B1). Photosynthetic rate (Pn), transpiration rate (Tr), stomatal conductance (gs), photochemical efficiency (Fv/Fm), plan water use (PWU), plant water use efficiency (WUEp), instantaneous water use efficiency (WUEins), total dry biomass (DW), total N (TN), total P (TP), total K (TK), peroxidase (POD) activity, Superoxide dismutase (SOD) activity, malondialdehid (MDA) content and abscisic acid (ABA) content, total N (STN), total P (STP), total K (STK), soil water content (SWC), electrical conductivity (EC), ${\text{NH}^+_4} $-N, ${\text{NO}^-_3} $-N and pH.
-
SWC, soil pH and available nutrients are critical for plant growth under different irrigation regimes. In the present study, biochar increased soil pH and SWC (Fig. 1). Similar findings showed that biochar could promote plant growth by increasing SWC and soil pH[40,41]. The increase in SWC and pH can be explained by the improvement in soil pore structure due to biochar[42], and the high alkalinity of biochar[43], respectively. Research about the positive effects of biochar addition on the promotion of nutrient availability were extensively reported in various plant species[43,44]. For example, Guo et al. discovered a notable rise in soil
${\text{NH}^+_4} $ ${\text{NO}^-_3}$ Available P and K are important factors in improving soil quality[49,50]. Under two irrigation regimes, soil AP increased significantly with biochar addition. This may be due to biochar altering soil microbial activity by releasing phosphatase and organic acids, and soil microorganisms further promote the hydrolysis of organic and inorganic phosphorus, thereby improving the availability of phosphorus[22,51]. Biochar increased soil AK under two irrigation regimes. This may be due to the high AK content of biochar in our experiment. Alternatively, it may be due to the increased K adsorption capacity of biochar amended soils[45]. In addition, biochar affects the activity of soil microorganisms by altering soil pH, which in turn stimulates the decomposition of soil unavailable potassium, thereby increasing soil potassium availability[52].
Response of perennial ryegrass to biochar amendments under different irrigation and nitrogen fertilizer regimes
-
In addition to improving soil quality, biochar reduces damage caused by water deficit to plants. Drought stress leads to a reduction in total chlorophyll content, which may be related to reduced synthesis of chlorophyll complexes, accumulation of ROS, and reduced N uptake by plants due to damaged root systems[53], which is supported by this experiment (Figs 4a & 5b; Fig. 6). In this study, biochar addition mitigated the adverse effects of drought on chlorophyll (Fig. 5a). The possible reason for this is that biochar amended soils have better water and nutrient conditions, and perennial ryegrass has improved nutrient and water uptake, which increases total chlorophyll content[54]. Several studies have shown that soil available N directly affects the total chlorophyll content of plants[55,56], which is consistent with the results of this experiment (Table 3).
Drought can damage the membrane system of plant cells by increasing MDA and hydrogen peroxide levels, thereby affecting metabolic processes[56,57]. Consistent with our findings (Fig. 3c), drought stress increased MDA content in rice (Oryza sativa L.)[58] and wheat (Triticum aestivum L.)[59]. Similar findings showed that the addition of biochar under drought conditions reduced the MDA content of hollyhock (Althaea rosea L.) leaves[60]. Meanwhile, in the present study, biochar addition increased POD and SOD activities and was negatively correlated with MDA content (Fig. 3a−c; Fig. 7). This may be due to an increase in the activity of POD and SOD as a result of the biochar addition, which improved the ability to remove MDA. An experiment by Khan et al. supported our hypothesis that biochar (30 t·ha−1) was found to increase the tolerance of rapeseed (Brassica napus L.) to drought stress by increasing POD, SOD and CAT activities and reducing MDA and hydrogen peroxide levels[61]. Another study suggests that this may also be due to the porous structure of biochar and the presence of oxygen functional groups, properties that can maintain normal plant growth by increasing SWC[61]. Consistent with this study (Fig. 5; Table 2), biochar induced increases in potassium availability may improve drought tolerance in perennial ryegrass, as potassium has been shown to increase leaf posmotic potential[62,63]. Cakmak's article states that improving the K nutrient status of soybean (Glycine max L.) was able to alleviate drought stress damage by significantly reducing NADPH oxidase activity and thus ROS levels[64]. In the absence of K, photosynthetic fixation of CO2 is greatly reduced, ultimately leading to the production of ROS, which can damage plants[64,65]. Therefore, the increased availability of soil associated nutrients and SWC caused by biochar application may help to mitigate the adverse effects of water deficit on perennial ryegrass.
Water is a key factor in the regulation of plant physiological activity and cellular metabolism. Soil water deficit can induce a series of changes in plant growth characteristics by affecting soil physicochemical parameters and biological cycling processes, thereby stimulating resistance signals in plants to adapt to drought stress[37]. The profound effects of drought stress on cellular metabolic responses related to plant photosynthesis[66,67]. Consistent with our study (Fig. 2a), deficit irrigation significantly reduced SWC, which inevitably reduces the CO2 assimilation capacity of leaves[37]. This also implies that partial stomatal closure of plants under mild or moderate drought conditions leads to lower Pn and gs[68]. In our study, deficit irrigation significantly reduced Pn and gs in perennial ryegrass (Fig. 2a, b), supporting the conclusion that drought is stomatal limiting[69]. Some research has shown that drought stress induces the accumulation of more ABA in leaves[70,71], resulting in lower gs and thus less efficient water transpiration[72,73]. Consistent with our study, leaf ABA content was significantly higher when plants were exposed to deficit irrigation (Fig. 3d), which revealed a negative correlation between ABA and gs (Fig. 7), suggesting that it was the increased ABA that led to lower gs[37]. It is noteworthy that biochar can alleviate the limitation of water deficit on plant photosynthesis by increasing soil moisture content, thereby maintaining a higher Pn, gs, Tr and Fv/Fm for perennial ryegrass (Figs 2 & 7). In addition, deficit irrigation can, to some extent, induce the production of chemical signals that can improve the water use efficiency of potato (Solanum tuberosum L.) by regulating plant physiology and growth characteristics[74]. Some research shows that biochar addition induces less ABA accumulation in leaves, resulting in higher Pn, gs and Tr and thus more efficient water transpiration[37,75]. Consistent with our findings (Fig. 2a−c), Pn, gs and Tr of were higher in biochar amended plants than in non-biochar amended plants under water deficit irrigation, which increased WUEins at the leaf scale of the plant[37].
In this study, both biochar and N fertilizer increased WUEp, PWU, and DW of perennial ryegrass, but biochar addition was more effective at equivalent irrigation and fertilizer levels (Fig. 4a, b, d). The possible reason for this is that biochar-amended soils have better nutrient and water conditions, resulting in higher net photosynthesis rates and chlorophyll content, which in turn improves plant growth and water-fertilizer productivity[37,43]. Si et al. found a positive correlation between N application rate and wheat yield when N application rates were no greater than 240 kg·ha−1[76]. However, consistent with some studies that reported a decreasing trend in NAE with increasing N application[77,78]. Notably, biochar addition significantly increased NAE of perennial ryegrass compared to non-biochar treatments (Fig. 6), and the increased NAE of biochar treatments may be attributed to increased SWC and soil nutrient available[43,79]. The biochar addition alleviated the negative effects of deficit irrigation, enhanced plant nutrient uptake, and improved plant photosynthetic parameters and WUEins and WUEp, thereby increasing DM (Fig. 7). PCA further showed that SWC, fast-acting nutrients, and plant photosynthetic parameters were closely related to DM (Fig. 8). Therefore, our study shows that biochar is effective in promoting plant growth as well as improving water and nitrogen utilization efficiency.
-
The results of this experiment clearly demonstrate that biochar addition can effectively decrease the negative impacts of deficit irrigation on perennial ryegrass, resulting in improved water and nitrogen utilization efficiency. The primary mechanism through which biochar exerts positive effects is likely by increasing SWC and soil available nutrient, which leads to optimal plant water status, higher leaf gas exchange rates, and greater nutrient uptake. Thus, biochar amendment represents a promising strategy for promoting the growth of perennial ryegrass under regimes of limited irrigation and nitrogen. However, given the high rate of biochar used in this experiment, further research is necessary to identify lower but also effective application rates and to develop practical guidelines for the use of biochar in conjunction with deficit irrigation.
-
The authors confirm contribution to the paper as follows: study conception and design: Yang Z, Yu J; data collection: Shen S, Zhang Z; analysis and interpretation of results: Shen S, Zhang Z; draft manuscript preparation: Yang Z, Yu J, Shen S. All authors reviewed the results and approved the final version of the manuscript.
-
The datasets analyzed during the current study are available from the corresponding author on reasonable request.
This work was supported by the Forestry Science and Technology Promotion Demonstration Funding Programme of China (Su [2023] TG1).
-
The authors declare that they have no conflict of interest.
- Copyright: © 2024 by the author(s). Published by Maximum Academic Press, Fayetteville, GA. This article is an open access article distributed under Creative Commons Attribution License (CC BY 4.0), visit https://creativecommons.org/licenses/by/4.0/.
-
About this article
Cite this article
Shen S, Yu J, Zhang Z, Yang Z. 2024. Biochar amendment improves water-fertilizer productivity of perennial ryegrass under different irrigation and fertilization regimes. Grass Research 4: e005 doi: 10.48130/grares-0024-0003
Biochar amendment improves water-fertilizer productivity of perennial ryegrass under different irrigation and fertilization regimes
- Received: 28 November 2023
- Revised: 03 February 2024
- Accepted: 13 February 2024
- Published online: 13 March 2024
Abstract: The quality of turfgrass often comes at the cost of consuming large amounts of water and nitrogen fertilizer resources. Soil management is the key to promote plant growth and achieve high water and nitrogen utilization efficiency. This experiment investigated the effects of biochar on soil physicochemical parameters and perennial ryegrass (Lolium perenne L.) growth under different nitrogen and irrigation regimes. The results showed that although biochar adversely affected soil electrical conductivity, biochar addition significantly increased soil nutrient availability, soil pH, and soil water content (SWC) compared to unamended soil. Although deficit irrigation negatively affected perennial ryegrass growth, biochar addition ameliorated the inhibitory effect of water deficit. Furthermore, biochar addition improved photosynthetic parameters of leaves and increased leaf nutrient content, including total N, total P, total K, total dry biomass, and nitrogen agronomic efficiency. Biochar addition also increased plant water use efficiency suggesting that biochar addition could achieve higher biomass with less water use. In addition, biochar addition reduced malondialdehyde and abscisic acid levels by increasing peroxidase and superoxide dismutase activity in perennial ryegrass. Principal component analysis indicated that soil nutrient content and SWC contributed significantly to the increase in growth and biomass of perennial ryegrass under biochar addition. Therefore, biochar addition may influence plant physiological and biochemical responses by increasing SWC and soil nutrient availability, which in turn maintains normal perennial ryegrass growth. These results suggest that biochar amendment may be an effective sustainable management practice to promote plant growth under deficit irrigation and nitrogen regimes.


