


-
In around one billion hectares worldwide, agriculture productivity is limited by problems of soil salinity and/or sodicity (i.e., halomorphism)[1]. In humid or sub-humid environments, halomorphism occurs in combination with hydromorphism conditions due to a shallow water table and temporary flooding (i.e., halo-hydromorphism, HHM)[2]. About 40% of the Humid Pampas region in Argentina is affected by HHM limitations, mainly due to a shallow water table and drainage problems[3]. In these environments, the main edaphic constraints for plant growth are soil salinization, variable levels of sodicity, alkaline pH, water table proximity to the ground surface, and low nutrient availability (e.g., nitrogen)[4].
The replacement of native vegetation with forage species adapted to HHM conditions increases the forage supply of these environments[2]. Thinopyrum ponticum [(Podp.) Barw. and Dewey; hereafter tall wheatgrass] is a perennial C3 grass characterized by its high tolerance to salt, water, and alkaline stress[5−7] showing high levels of primary and secondary productivity in HHM environments[8]. Tall wheatgrass is a temperate perennial grass native to the western Mediterranean region, the Balkan Peninsula, and Asia Minor, which was introduced in Argentina in the middle of the last century and has naturalized in different environments of the humid Pampean Region[9]. Tall wheatgrass shows high growth rates in late spring and early summer, actively vegetating in autumn, with little or no biomass accumulation during the winter period[9]. Its root system is close to the soil surface, with about 80% of the roots in the first 20 cm, with the capacity to reach depths of 3.5 m. This root system allows a significant and continuous consumption of water throughout the year, which contributes to a lowering of the water table and thus to a reduction in the risk of salts rising to the surface[10].
Nitrogen is the main limiting factor for grass pasture growth[11] and for this reason N fertilization has been proposed as a high-impact technological tool to increase forage production in HHM environments[12]. Moreover, the literature reports significant increases in tall wheatgrass growth rate when fertilized with different doses of N[13], mainly explained by higher tiller density and tiller size[14]. However, these benefits must be weighed against potential environmental consequences, as unabsorbed N can be lost through processes such as volatilization and/or leaching[15]. In a recent study[16], it was demonstrated that N uptake in HHM environments is strongly influenced by environmental characteristics, particularly soil salinity and the quality of the water table (i.e., salinity and depth).
Nitrogen fertilization on grass pastures also produces increases in forage quality parameters like CP content and DMD[17,18]. Forage quality depends on the nutritive value of the aboveground biomass components (i.e., blades, sheaths, stems, inflorescences, and dead material), and the proportion of these components in the forage biomass[19,20]. In vegetative pastures, the continuous decline in dry matter digestibility (DMD) and crude protein (CP) during a regrowth depends on the proportion of blade, the age and length of the blade, and the proportion of senescent material[21], resulting in a negative relationship between accumulated biomass and nutrient quality[22,23]. However, this decline in quality can be partially mitigated through agronomic practices, including N fertilization and grazing management.
In a previous study[16] it was analyzed how HHM conditions affect the response to nitrogen fertilization, with a particular focus on forage productivity, yield components, and the capture and utilization of resources such as water and radiation. The objective of this second paper is to expand our knowledge of the impact of nitrogen fertilization in HHM environments on nutritional quality and its relationship with forage production.
-
The general conditions of the experiment were reported in a previous paper[16]. Briefly, the experiment was conducted in three 3-year-old tall wheatgrass pastures in southeastern Córdoba, Argentina, a region representing over 1.5 million hectares with HHM characteristics. The selected sites were Noetinger (32°21' S; 62°27' W and 114 masl – low HHM), Laboulaye (34°01' S; 63°25' W and 131 masl – intermediate HHM), and Marcos Juárez (32°36' S; 62°00' W and 122 masl – high HHM), with paddocks between 12–20 ha. All sites shared the same soil type (Natracualf), although the intermediate HHM environment had a sandier texture compared to the others. In addition, all sites had the same wheatgrass cultivar ('Barpiro'), sowing date, stocking rate, and grazing management. From 15 initial sites per locality, five were chosen based on pasture cover (> 80%) and salinity level (EC1:2.5). The experiment was carried out during a late spring regrowth (i.e., from 2 November to 16 December 2015), a time when tall wheatgrass shows high growth rates[9]. Plants were cut to ~4 cm height at the beginning of the experiment, on November 2nd. Sites were excluded from grazing throughout the experimental period.
Experimental design
-
The experiment consisted of five blocks (five selected areas per site) and two 15 m2 experimental units (EU) per block (30 m2), following a randomized complete block design (n = 5) with two fertilization treatments randomly assigned to the EU in each of the five blocks. Treatments were N0 (no N addition), and N150 (150 kg N/ha). Nitrogen in the form of urea was broadcasted at the time of the initial cut.
Climatic conditions
-
The region where the study was conducted is classified as a temperate zone labeled Cfa in the Köppen climate classification (i.e., the temperature of the warmest month 22 °C or above)[24]. Maximum and minimum temperature, daily rainfall, and potential evapotranspiration data during the experimental period were obtained from weather stations close to the experimental sites (Fig. 1). The daily maximum and minimum temperatures were used to calculate the mean daily temperature values. Mean daily temperature values were similar to historical data among the three sites (20 °C in November, and 23 °C in December).
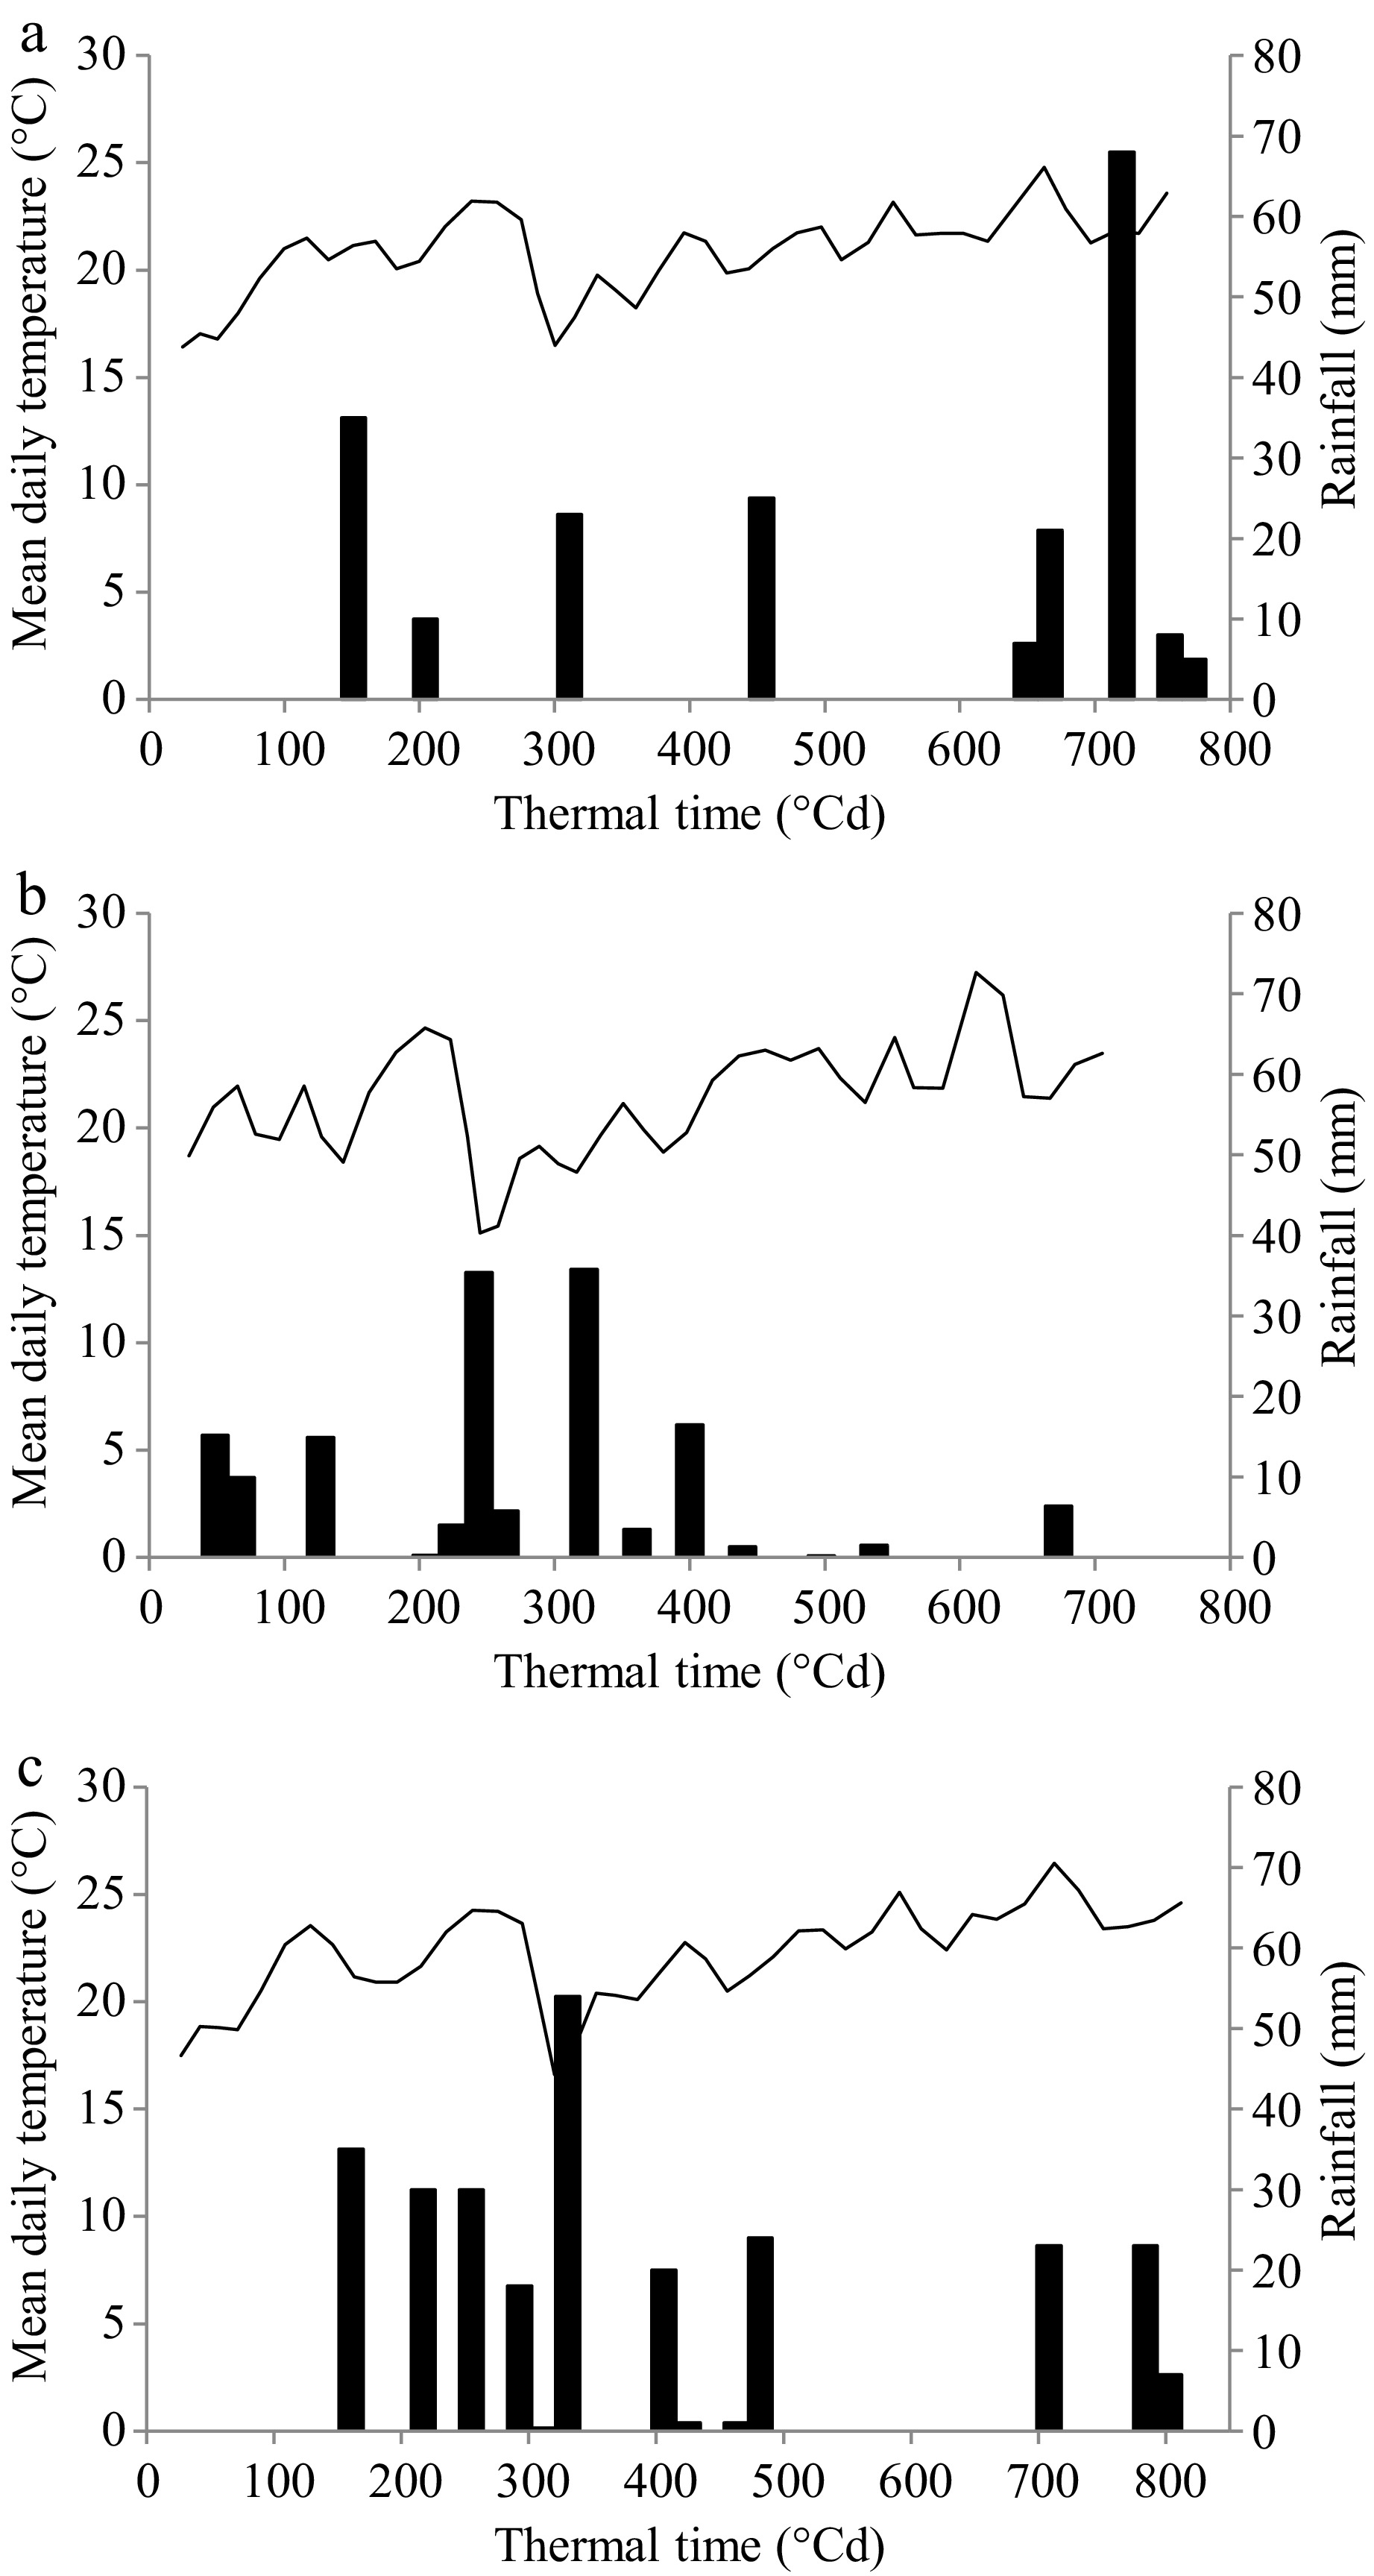
Figure 1.
Evolution of mean daily temperature (°C) and rainfall (mm) for the experimental period in (a) Noetinger (low halo-hydromorphic environment), (b) Laboulaye (intermediate halo-hydromorphic environment), and (c) Marcos Juárez (high halo-hydromorphic environment). The solid line corresponds to mean daily temperature values and the black bars to rainfall. The experimental period was from 02/11/2015 to 16/12/2015 in Noetinger and Marcos Juárez, and from 05/11/2015 to 15/12/2015 in Laboulaye.
In the low HHM environment (Fig. 1a), rainfall during the experimental period amounted to 202 mm, with a notable increase after 600 °Cd. The potential evapotranspiration (PET, mm) in the region during the experimental period was 215 mm, with a PP-PET difference of −13 mm. In the intermediate HHM environment, rainfall during the experimental period totaled 151 mm, with precipitation from the middle of the period onwards being negligible (Fig. 1b). In this environment, PET during the period was 217 mm, with a PP-PET difference of –66 mm. Rainfall in the high HHM environment (Fig. 1c) amounted to 266 mm, evenly distributed throughout the experimental period. The PET for this region was 230 mm, with a PP-PET difference of +36 mm.
Soil and water table characterization of the sites
-
Soil salinity was determined through EC1:2.5. Composite soil samples were taken with a soil auger (four sub-samples per EU) in the 0−20 cm layer, at the beginning and end of the experimental period (Table 1) to record any changes in soil salinity due to leaching by rainfall and/or plant uptake[2,7]. Soil samples were air-dried, ground, and sieved through a 2 mm mesh. The EC1:2.5 was measured with a hand-held conductivity meter (Hanna HI8733, Padova, Italy).
Table 1. Soil organic matter (SOM, g/kg), phosphorus concentration (P-Bray1, mg/kg), and pH at the beginning of the experimental period; average soil salinity between the beginning and end of the experimental period (Soil EC1:2.5, (dS/m) in the 0−20 cm soil layer) and water table attributes (EC in dS/m and average water table depth (cm) between the beginning and end of the experimental period) in tall wheatgrass (Thinopyrum ponticum) pastures from three sites with different halo-hydromorphic (HHM) conditions (low, intermediate, and high). Values are means ± 1 standard error.
Low HHM Intermediate HHM High HHM SOM (g/kg) 15 ± 2.6 17.6 ± 0.5 31.3 ± 1.4 P-Bray 1 (mg/kg) 39.20 ± 7.41 18.20 ± 2.08 20.60 ± 2.66 pH 9.94 ± 0.13 8.18 ± 0.05 7.34 ± 0.11 Soil Ec1:2.5 (dS/m)* 0.97 ± 0.13 3.86 ± 0.40 4.49 ± 0.14 Water table EC (dS/m)* 2.03 ± 0.09 7.40 ± 0.40 7.85 ± 0.35 Water table depth (cm)* 85 ± 10 134 ± 6 31 ± 3 * There were no significant differences (p < 0.05) between values at the beginning and at the end of the experiment, so the average value of both samples is presented. At the beginning of the experimental period pH, phosphorus concentration (Bray 1 method, mg/kg), and soil organic matter (Walkley-Black method; SOM, g/kg) were measured in the 0–20 cm layer (Table 1), using the same samples as for soil salinity. The depth (cm) and quality (i.e., electric conductivity) of the water table were measured at the beginning and end of the experiment in water table monitoring wells installed at each site (Table 1)[25]. The monitoring wells were drilled vertically with a 5,08 cm open-winged auger. Upon reaching the saturated zone, the borehole was cased with a 5,08 cm diameter slotted PVC pipe.
Soil organic matter values at the low and intermediate HHM sites were lower than those of the high HHM site (Table 1). Regarding phosphorus concentration, the low HHM site showed on average approximately twice as much as the intermediate and high HHM sites. The sites were classified according to their level of halo-hydromorphism (HHM) considering the following attributes: based on soil salinity values of the 0–20 cm layer, the low HHM site would be classified as very slightly saline, the intermediate HHM site as moderately saline, and the high HHM site as very highly saline[26]. Water tables can be considered moderate-high salinity at the intermediate and high HHM sites, and light salinity at the low HHM site (Table 1). In terms of soil pH, the low HHM site is classified as alkaline, while the intermediate and high HHM sites could be considered as medium and slightly alkaline, respectively[27].
Plant sampling design and yield determination
-
Determinations of forage production and yield components are detailed in a previous study[16]. Overall, at the beginning of the experiment, plants were cut to 4 cm, and a ground-level sample was taken to estimate the remaining aerial biomass. Subsequent biomass harvests were made every 150–200 degree days (°Cd, with a base temperature of 4 °C)[28] until the first signs of leaf senescence. A total regrowth of 750 °Cd was reached. Biomass harvests were conducted on four dates in the low HHM (Nov. 12th, Nov. 13th, Dec. 2nd, and Dec. 16th, corresponding to 0, 170, 345, 500, and 750 °Cd) and intermediate HHM (Nov. 16th, Nov. 25th, Dec. 3rd, and Dec. 15th, corresponding to 0, 200, 335, 475, and 705 °Cd) environments, but only three in the high HHM site due to heavy rainfall preventing access to the experimental site (Nov. 12th, Dec. 2nd, and Dec. 16th, corresponding to 0, 180, 530, and 810 °Cd). In each experimental unit, 0.4 m² of biomass was sampled (two 0.2 m² subsamples per unit). In every harvest, 200 tillers were used to estimate the blade proportion (blade biomass/total biomass) of the harvested forage. All samples were oven-dried at 65 °C to a constant weight to estimate biomass accumulation per unit area (kg DM/ha).
The percentage of neutral (NDF) and acid detergent fiber (ADF) of the shoot biomass were estimated in the biomass of the last harvest with an Ankom fiber analyzer (ANKOM 220, NY, USA), based on a previous study[29]. Dry matter digestibility (DMD) was estimated using the equation [DMD = 88.9 – (%ADF × 0.779)], proposed by Holland[30]. The N concentration (%N) was obtained by Kjeldahl[31], and the crude protein (CP) content was obtained by multiplying the %N by 6.25.
Statistical analysis
-
Blade proportion was analyzed for each site using mixed linear models, taking into account the possible correlation between repeated measurements over time and heterogeneity of variances. The MIXED procedure of the SAS University Edition statistical package was used[32]. The analysis was done by environment with fertilization, thermal time, and their interaction as fixed effects, while the block was a random effect. The values of NDF, CP, and DMD, were tested by analysis of variance in a complete block design, using the InfoStat statistical package[33]. When significant differences between treatments were detected, they were evaluated using the Least Significant Difference test (LSD, p < 0.05). Nonlinear regression of blade proportion against shoot biomass data from a previous paper[16] was performed[19] by using the whole study dataset grouped by treatments and environment and fitted by using R[34]. Linear regressions of DMD and CP against shoot biomass data from[16], and DMD against blade proportion were fitted by using the lm procedure of R[34].
-
A reduction in blade proportion was observed throughout regrowth at the three evaluated sites (p < 0.05; Fig. 2). At the low HHM site (Fig. 2a) the blade proportion did not differ between treatments (p < 0.05). At the intermediate HHM site (Fig. 2b) there were significant differences between treatments only between 200 and 500 °Cd (p < 0.05), without differences at the end of the experiment. At the high HHM site, no significant differences were detected between treatments (Fig. 2c).
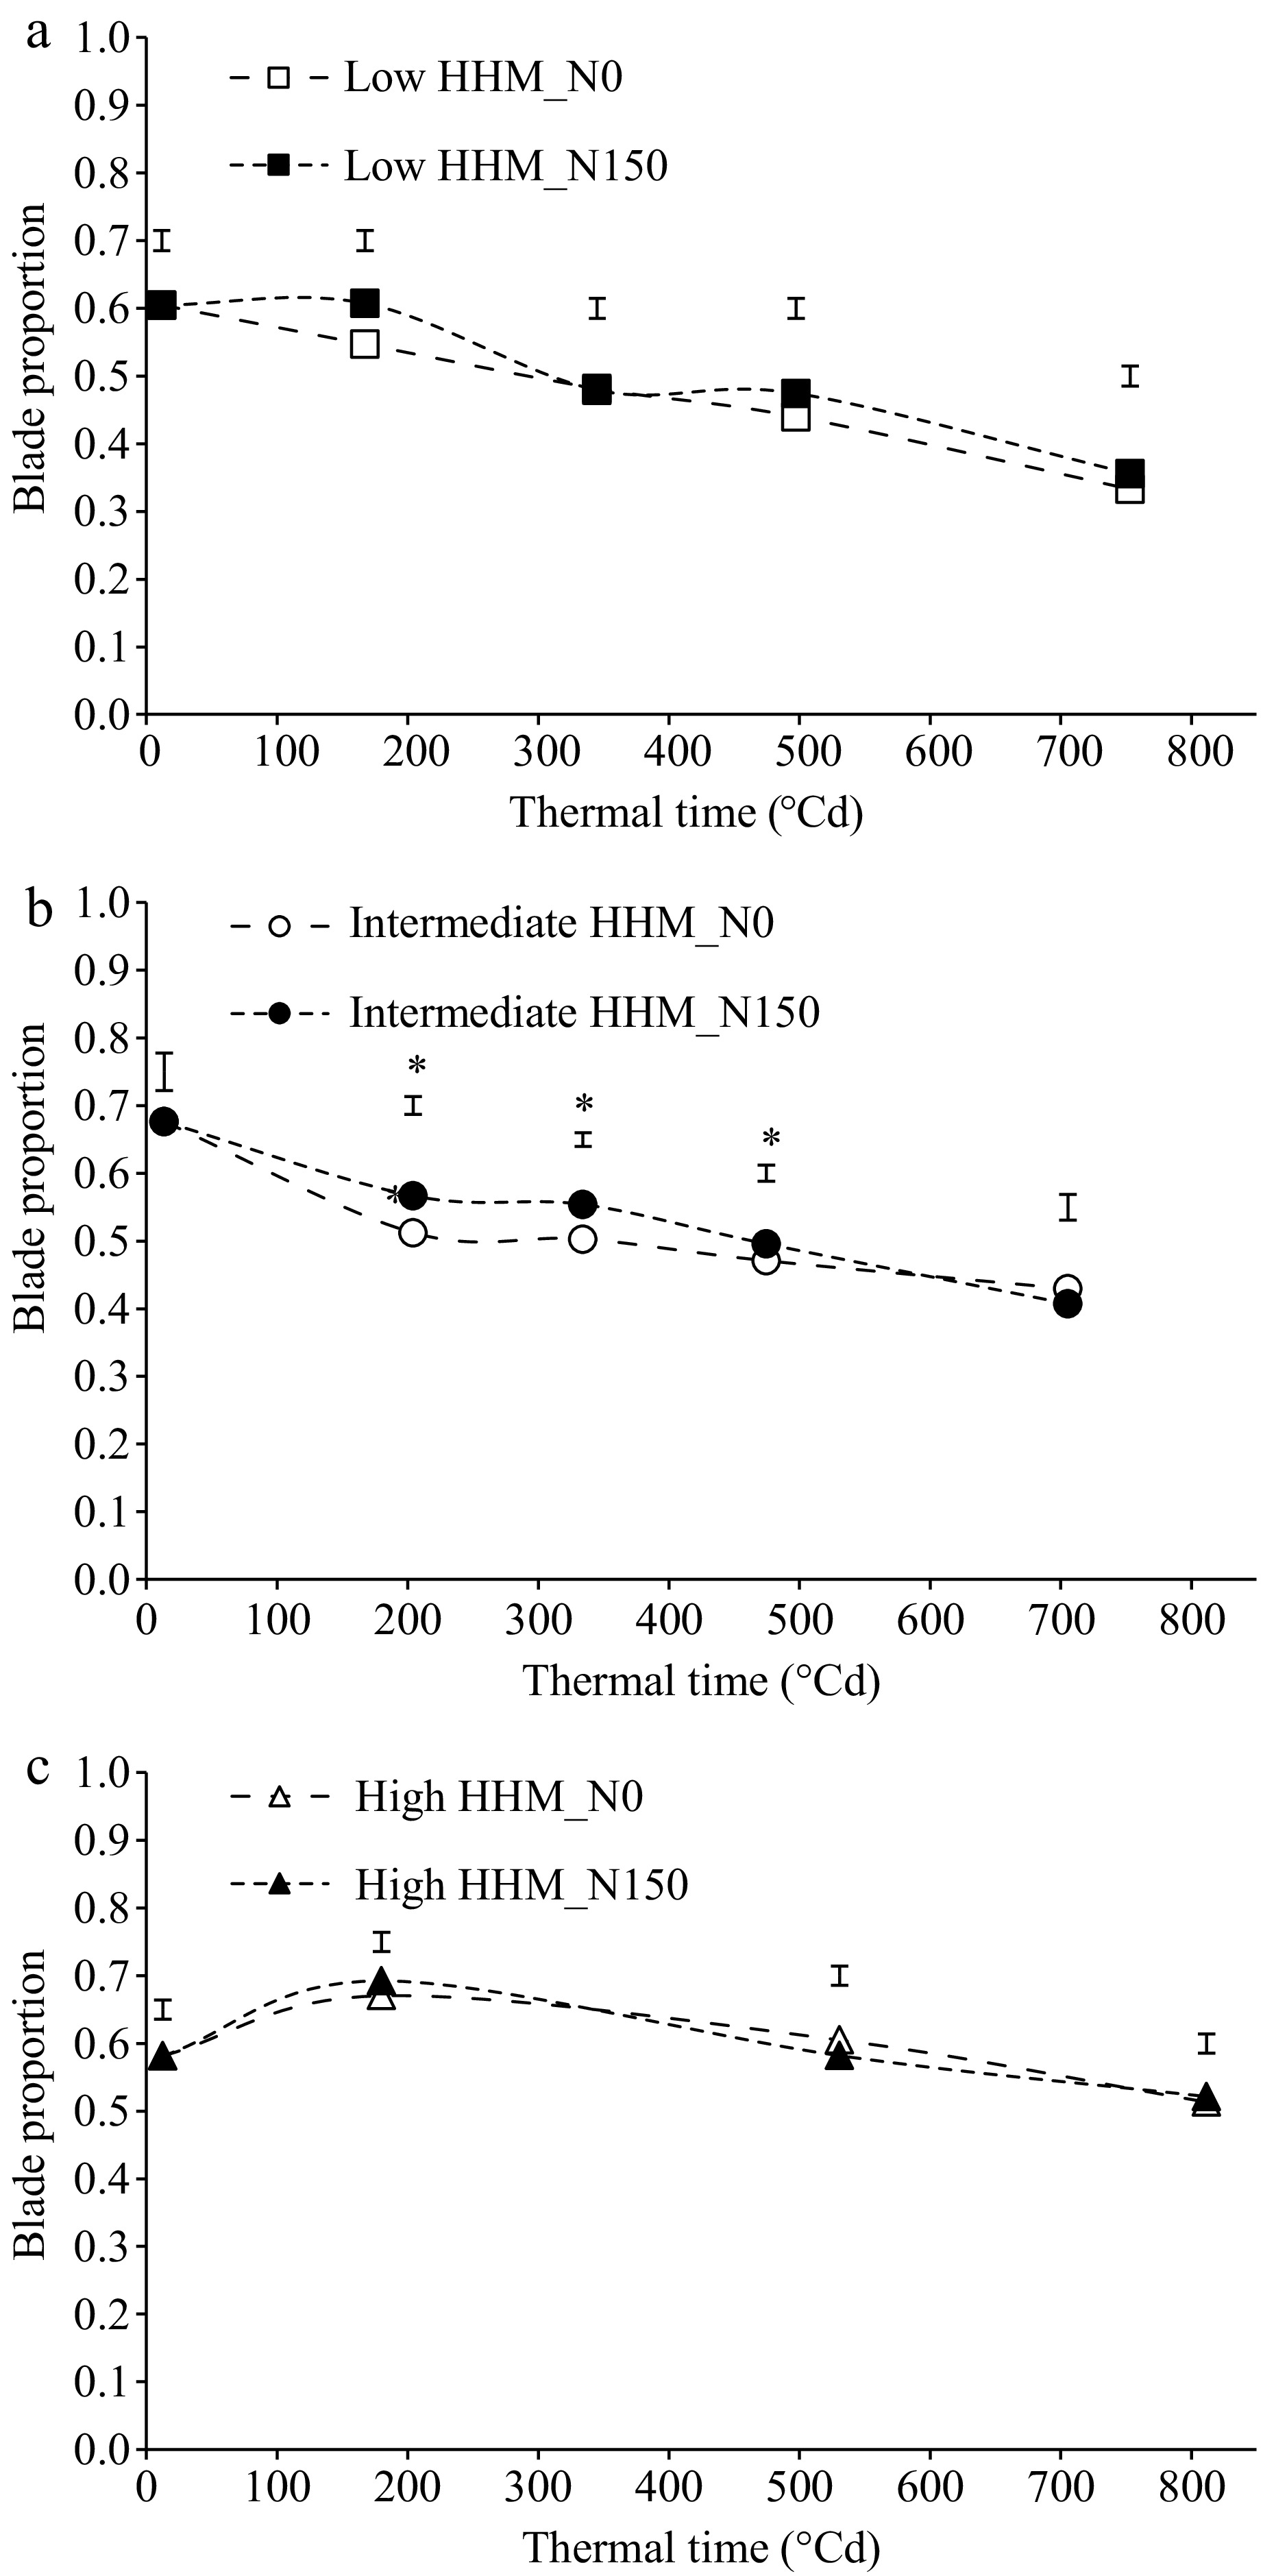
Figure 2.
Blade proportion of tall wheatgrass (Thinopyrun ponticum) pastures during a late spring regrowth at a (a) low HHM, (b) intermediate HHM, and (c) high HHM sites, with two treatments (control: N0, dashed line and empty symbols; fertilized with 150 kg/ha of N: N150, dotted line and filled symbols). Vertical bars indicate the standard error (n = 5), and * denotes significant differences between treatments (p < 0.05). The experimental period was from Nov. 2nd to Dec. 16th at low and high HHM sites, and from Nov. 5th to Dec. 15th at the intermediate HHM sites.
Dry matter digestibility, neutral detergent fiber, and crude protein
-
Nitrogen fertilization increased the DMD at all three sites (p < 0.05; Table 2). At the low HHM site, NDF did not show significant differences between N0 and N150 treatments (Table 2). On the contrary, at the intermediate HHM and high HHM sites, NDF was 2% lower in N150 than in N0 (p < 0.05; Table 2). Regarding CP, at the low HHM and intermediate HHM sites significant increases in CP were found when N was incorporated (Table 2). At the high HHM site, the addition of N had no significant effect on CP.
Table 2. Variables related to forage quality of tall wheatgrass (Thinopyrun ponticum) at the end of late spring regrowth, without (N0) and with N fertilization (N150; 150 kg/ha of N in the form of urea), from three sites with different halo-hydromorphic (HHM) conditions (low, intermediate, high).
Variables Low HHM Intermediate HHM High HHM N0 N150 N0 N150 N0 N150 Dry matter digestibility (DMD, %) 59 ± 0.54 b 60 ± 0.30 a 60 ± 1.16 b 64 ± 0.27 a 63 ± 0.45 b 65 ± 0.35 a Neutral detergent fibre (NDF, %) 67 ± 0.32 68 ± 0.68 63 ± 0.71 a 61 ± 0.64 b 64 ± 0.60 a 62 ± 0.78 b Crude protein (CP, %) 10 ± 0.33 b 16 ± 0.44 a 12 ± 0.19 b 15 ± 0.64 a 14 ± 0.65 16 ± 0.91 Different letters indicate significant differences between nitrogen treatments within each site (p < 0.05). Relationships between forage quality and pasture characteristics
-
Blade proportion and shoot biomass were highly associated without differences between treatments and environments (Fig. 3a). A strong reduction was observed until 1,500 kg DM/ha of shoot biomass. After that, the blade proportion remained relatively constant at a value of 0.35 (Fig. 3a).
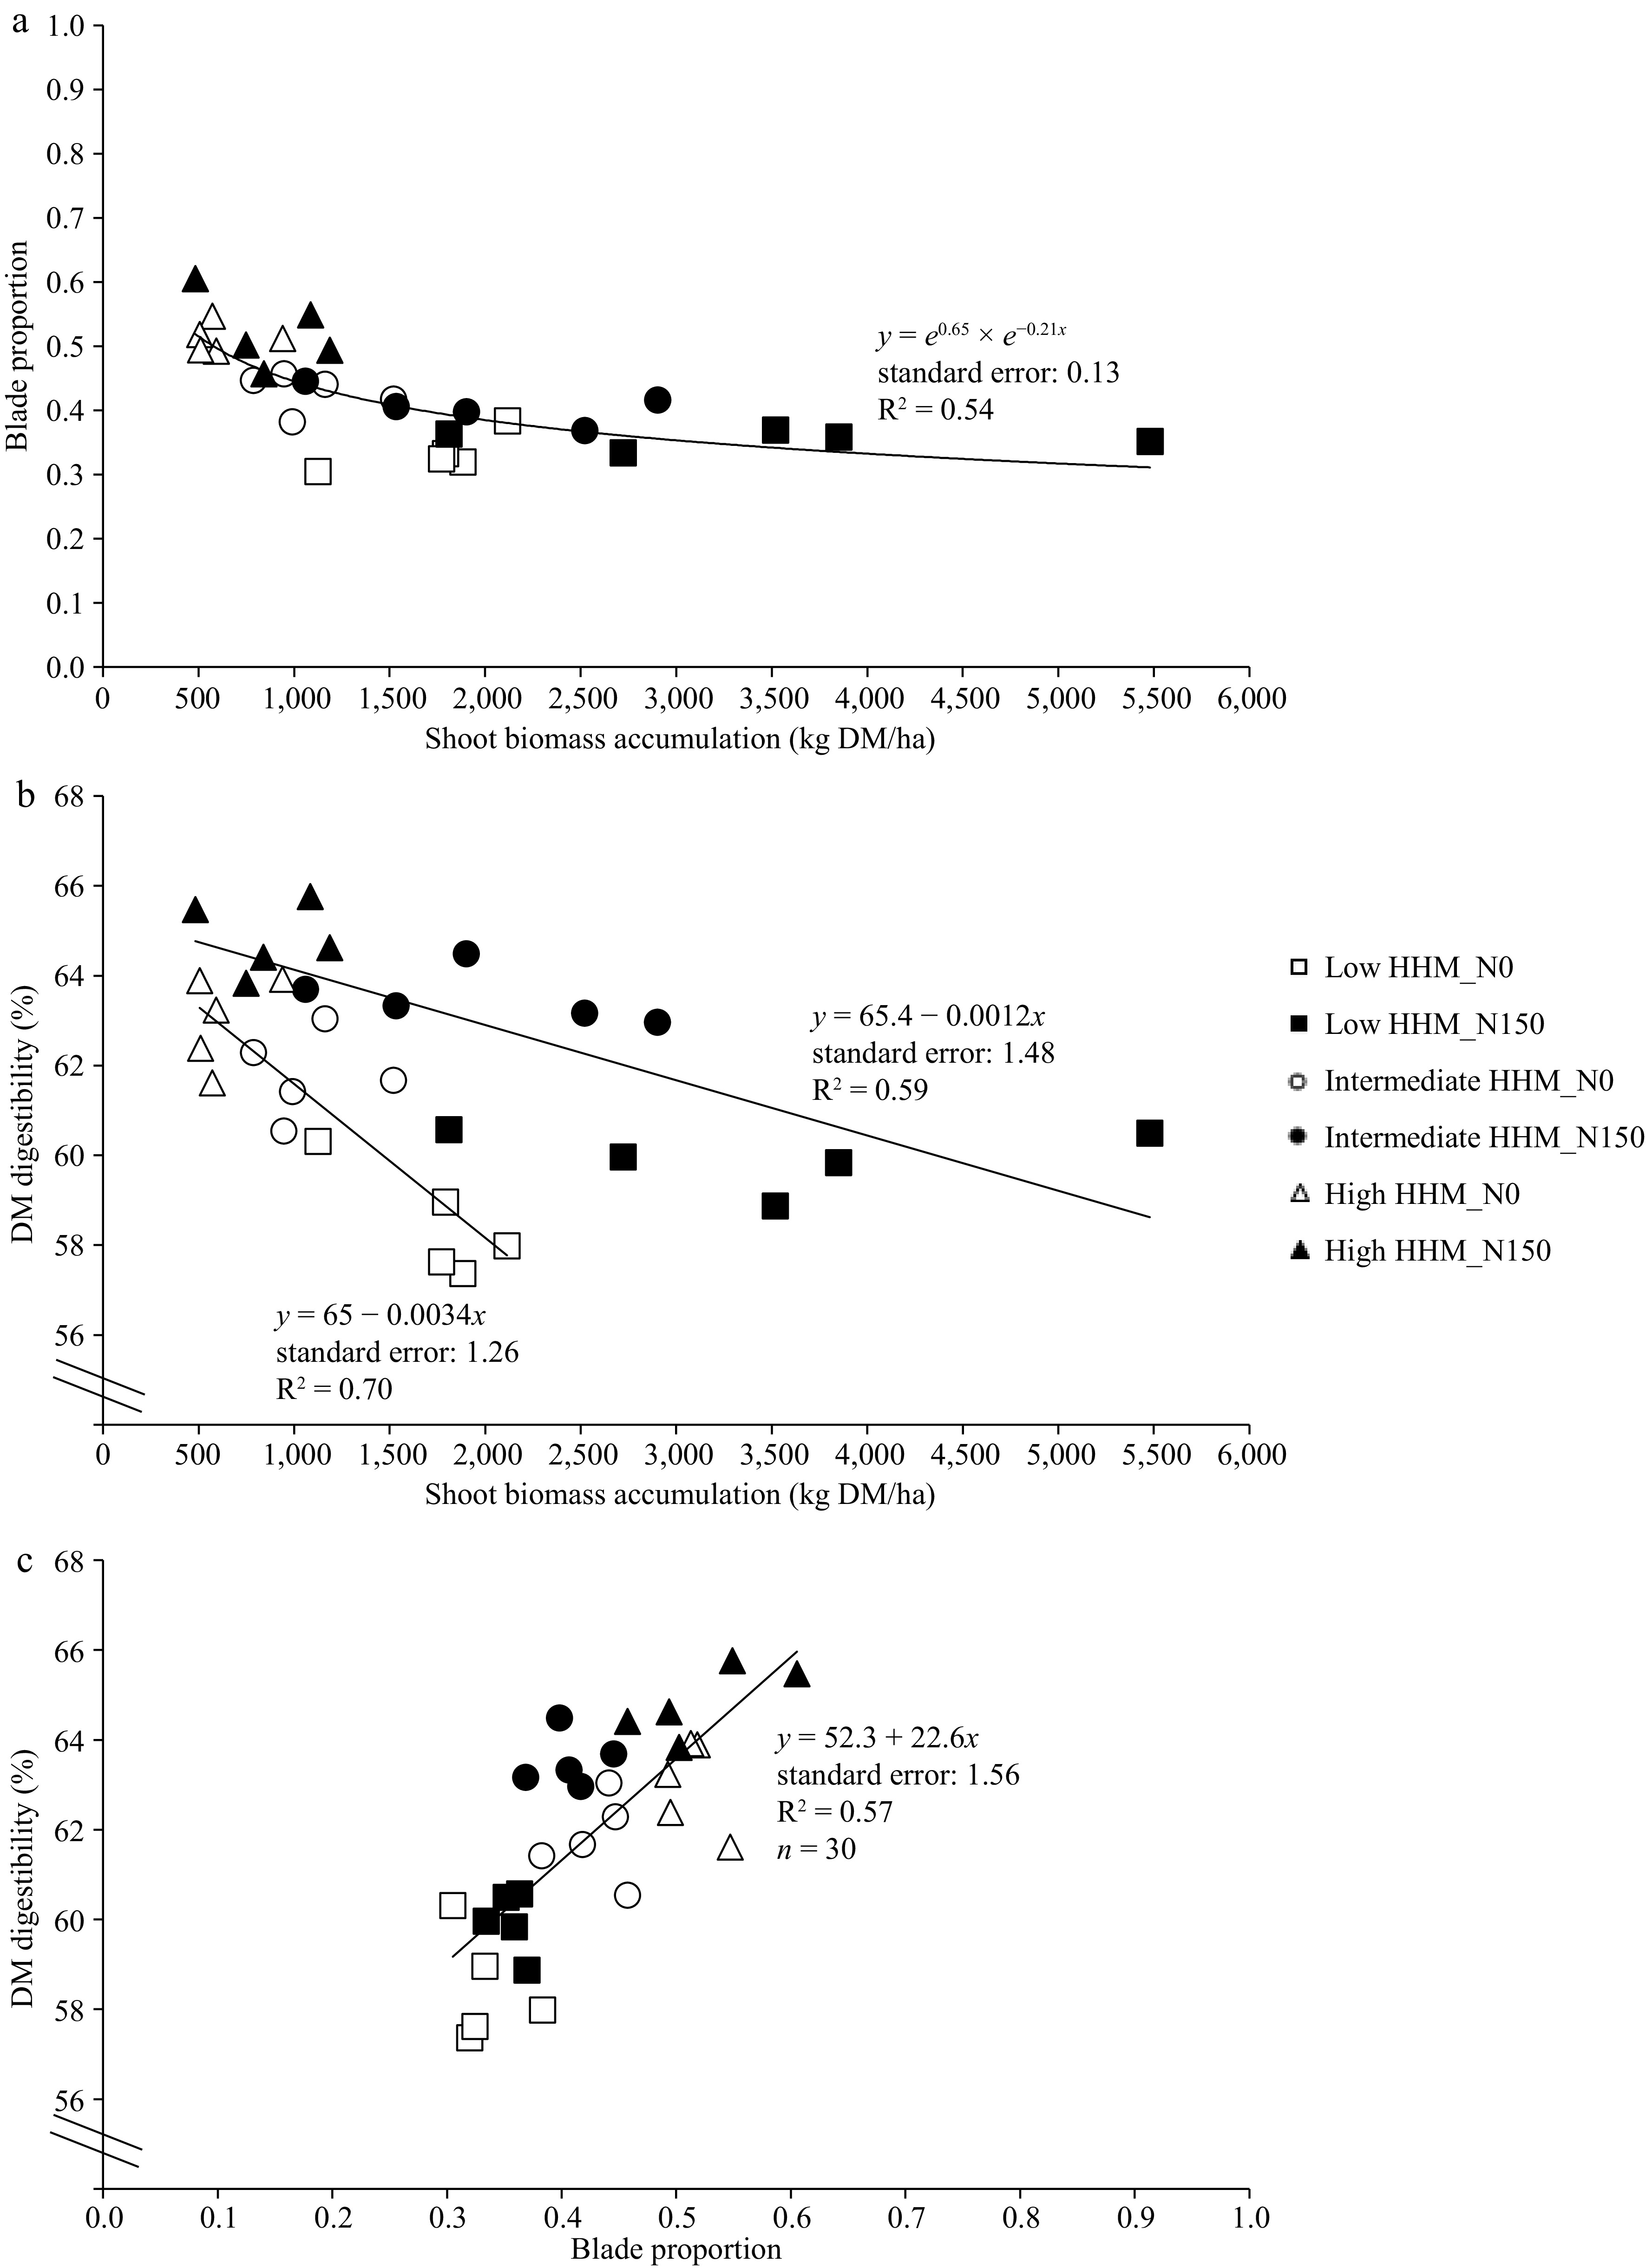
Figure 3.
(a) Relationship between shoot biomass accumulation of tall wheatgrass (Thinopyrun ponticum) and the dry matter digestibility (DM digestibility, %). (b) Relationship between blade proportion of tall wheatgrass and DM digestibility. (c) Relationship between shoot biomass accumulation (kg DM/ha) of tall wheatgrass and blade proportion, at the end of a late spring regrowth, in all blocks and replicates at low HHM site (square symbols, low halo-hydromorphism), intermediate HHM site (circle symbols, intermediate halo-hydromorphism), and at high HHM site (triangle symbols, high halo-hydromorphism), in control treatments (N0, empty symbols) and fertilized with 150 kg/ha of N (N150, filled symbols).
There was a linear and negative effect between shoot biomass and DMD for both, N0 and N150 treatments (Fig. 3b). Regarding the relationship between blade proportion and DMD (Fig. 3c), a single linear and positive relationship was found between both variables (p < 0.0001), independently of the N0 and N150 treatments.
Shoot biomass and crude protein were negatively related in N0 treatment (p: 0.00438; Fig. 4), while no significant relationship was recorded for N150 (p: 0.729). However, it can be noted that in the N150 treatment the crude protein content was higher than in N0 treatment throughout all the range of shoot biomass (Fig. 4).
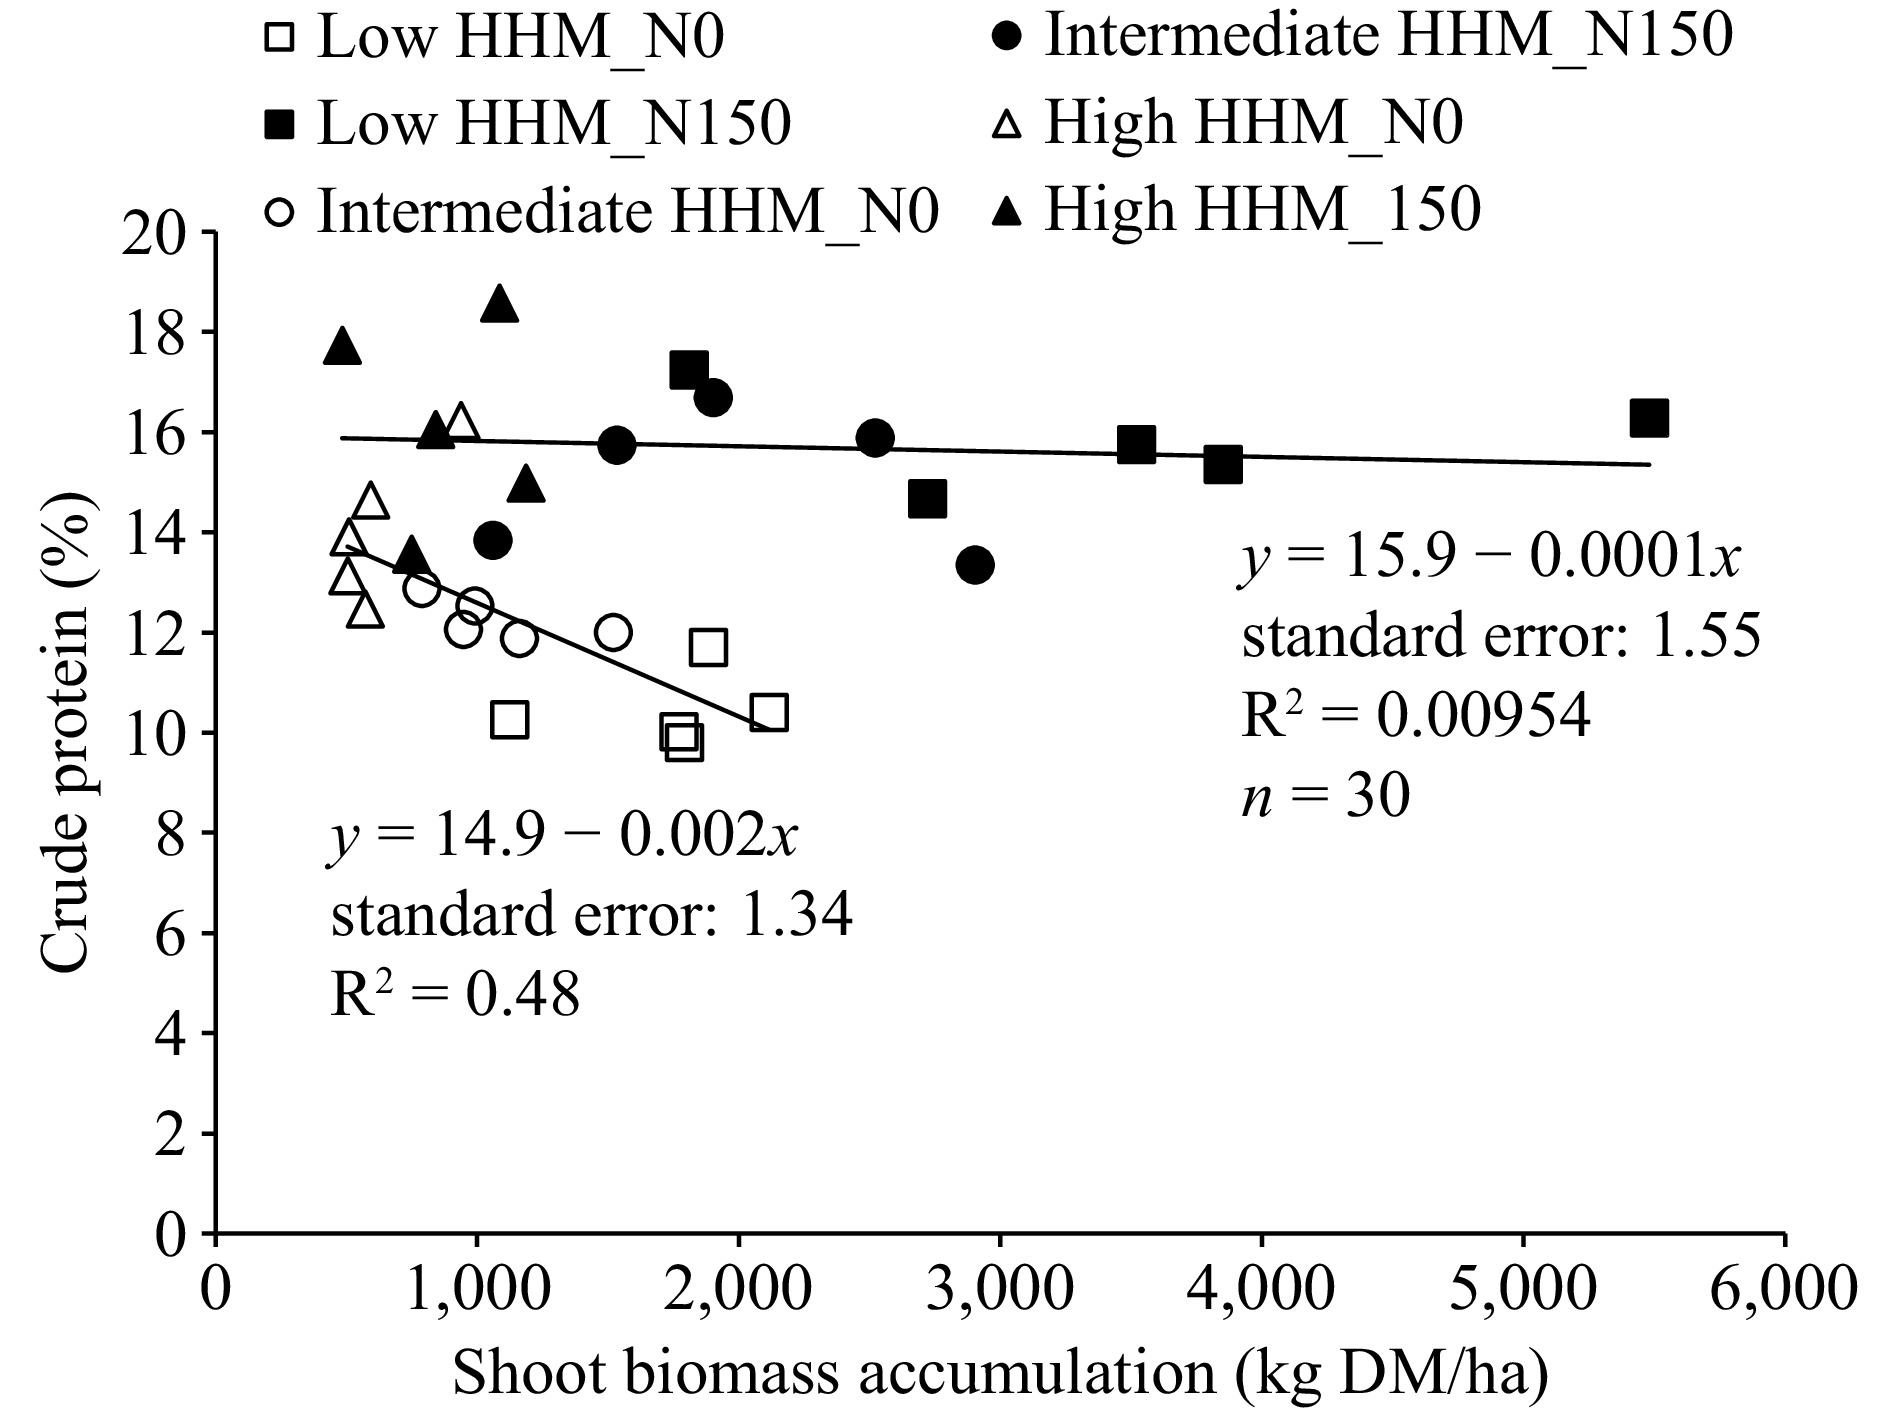
Figure 4.
Relationship between shoot biomass accumulation (kg MD/ha) of tall wheatgrass (Thinopyrun ponticum) and crude protein content (%), at the end of a late spring regrowth, in all blocks and replicates at low HHM site (square symbols, low halo-hydromorphism), intermediate HHM site (circle symbols, intermediate halo-hydromorphism), and at high HHM site (triangle symbols, high halo-hydromorphism), in control treatments (N0, empty symbols) and fertilized with 150 kg/ha of N (N150, filled symbols).
-
A comprehensive analysis of the relationship between each environment, forage production, yield components, and use efficiency of water and radiation under the applied treatments (N0 and N150) was provided from a previous study[16]. In this paper, the focus was on nutritive value and its relationship with forage production data reported in Fina et al.[16], while also discussing some agroecological implications on N fertilization in halo-hydromorphic environments.
Forage quality
-
The addition of N increased DMD of the forage biomass (Table 2). Since differences in blade proportion between N0 and N150 were practically negligible (Fig. 2), the higher DMD of N150 should be due to an intrinsic increment in the DMD of blades and sheaths, which are a function of the amount of soluble compounds, the NDF, and how digestible the NDF is[19,20,29]. N150 treatment produced more forage biomass with larger tillers[16] and, therefore, largest leaves[35], which should lead to a lower NDF digestibility compared to N0 treatment[21]. Nevertheless, at similar biomass and at similar blade proportion (Fig. 3a), the N150 shows higher DMD than N0 (Fig. 3b) which should be mainly due to an increase of metabolic/structural components ratio within blade and sheath tissues[19]. Consequently, it is inferred that the major DMD in N150 was caused by a higher level of soluble compounds, which would have over-compensated for any possible reduction in NDF digestibility associated with higher tiller size. As an example, at the intermediate and high HHM sites, the lower cell wall proportion is evidenced by a significant reduction in NDF content in N150 (Table 2). This implies an increase in the concentration of soluble compounds (i.e., cell content), which have a digestibility close to 100%[29].
In addition, this work shows that there is a strong positive correlation between blade proportion and DMD[19] (Fig. 3c). Thus, these results are in agreement with the inverse relationship between forage yield, leaf ratio, and nutritive quality, previously found for several forage species[22,23]. Therefore, reported variations in nutritive quality among sites of varying degrees of HHM, primarily due to variations in salinity[36], would be due to changes in forage biomass (> HHM, < forage production, > blade proportion, > DMD, < NDF) as was found in this work (Fig. 3a−c).
Crude protein content is another relevant forage quality determinant of individual animal performance, and N fertilization is an effective way to increase CP levels of tall wheatgrass pastures (Table 2). The increase in CP under N fertilization in low and intermediate HHM environments, and the lack of response in high HHM environments, were explained by differences in N uptake, as was reported by Fina et al.[16]. Whereas, in the N0 treatments, CP content decreased as HHM levels declined (Table 2). This pattern is explained by the inverse relationship between forage biomass (higher in less HHM environments;[16]) and N concentration, known as the dilution effect[12].
In general, for growing steers and heifers, protein supplementation needs are strongly increased as the CP content of forage is lower than 12%−14%. Therefore, as long as the forage offered to the animals has %CP values higher than 12%−14%, the supplementation needs will be reduced[37,38]. In this sense, this work shows that N fertilization proved to be an effective way to maintain levels of %CP above a 12%−14% threshold (Fig. 4).
A practical implication of the inverse relationship between biomass and forage quality, discussed above, is the necessity to promote frequent grazing to avoid excessive biomass accumulation[22,23]. In this way, pastures will maintain high levels of blade proportion, which will result in increased animal performance[8,39]. Nevertheless, it is known that low levels of ground cover can lead to higher direct soil water evaporation increasing the risk of topsoil salinization and weed invasion, especially in environments with a high level of HHM[40]. Thus, in HHM environments, grazing methodologies should be designed to maximize the harvest of high forage quality grass, without detriment to the post-grazing biomass.
Agroecological implications of N fertilization in HHM environments
-
N is a key factor that limits the growth of grass pastures, making N fertilization a widely recognized strategy for enhancing forage production and stocking rate in HHM environments. However, N application not only boosts forage yield and livestock load but also improves trophic efficiency by 29% (kg of live weight per kg of forage produced)[41], likely due to the enhanced nutritional quality of the forage. However, the environmental implications of these practices cannot be overlooked, as N not absorbed by plants is prone to losses through volatilization or leaching, with potential environmental consequences. While this study does not aim to present a detailed cost-benefit analysis, it is relevant to discuss the environmental implications of N fertilization.
In a recent study[16], it was demonstrated that N uptake in HHM environments is strongly influenced by soil salinity and the quality of the water table (i.e., salinity and depth). For instance, under conditions of low HHM, N fertilization can enhance N uptake by up to 200% (from 30 to 90 kg N/ha), while under intermediate HHM conditions, the increase is more modest, reaching 130% (from 21 to 48 kg N/ha). Conversely, in high HHM environments characterized by elevated soil salinity and a shallow, saline water table (Table 1), N uptake increases are more constrained, reaching only 60% (from 14 to 22 kg N/ha). Thus, although N fertilization can generate increases in forage quality in high HHM environments (Table 2), fertilization with urea under these conditions should be avoided due to the high likelihood of losses through volatilization and leaching[2,42].
These findings underscore the necessity of conducting thorough environmental assessments before N application to seek forage production and quality increases. Although all environments from Fina et al.[16] and this study were classified as HHM, the variability in N fertilization responses highlights the importance of evaluating key factors such as precipitation, soil moisture, salinity, pH, the salinity, and depth of the water table. Failure to do so can lead to substantial N losses, particularly in soils with high salinity or shallow water tables, resulting in not only economic losses but also environmental hazards, including N leaching, increased NO3 concentration in the water table, and nitrous oxide emissions[15].
-
N fertilization has a positive impact on the nutritive quality of tall wheatgrass pastures at all sites. As expected, N fertilization was an effective way to maintain high levels of CP. In addition, an increase in DMD in the fertilized treatments was not explained by morphological changes in the pasture (i.e., blade proportion), suggesting intrinsic increases in blade and/or sheath quality. The relationship between biomass and forage quality underscores the importance of frequent grazing to prevent excessive biomass accumulation, ensuring a higher proportion of blades and optimizing animal performance. However, low ground cover can increase soil water evaporation, raising the risk of topsoil salinization. Therefore, grazing methods in these areas should aim to maximize the harvest of high-quality forage without damaging post-grazing biomass. Finally, N responses vary significantly depending on factors such as soil salinity and water table depth, with higher HHM levels increasing the risks of N losses. Therefore, in HHM environments, conducting site-specific zoning is a fundamental prerequisite for implementing N fertilization practices aimed at improving both forage production and quality.
Support for the present study was provided by INTA (PI-007: Incremento sostenible de la producción y utilización de pasturas y Forrajes conservados; PE-1133033: Agua; PRET-CORDO-1262102: Sudeste Córdoba) and FCA-UNMDP (AGR603/20: Uso responsable del nitrógeno en ganadería: fertilización y leguminosas).
-
The authors confirm contribution to the paper as follows: study conception and design: Bertram N, Berone GD; data collection: Fina F, Bertram N; analysis and interpretation of results: Fina F; Bertram N, Gatti ML, Berone GD; draft manuscript preparation: Fina F; Bertram N, Gatti ML, Berone GD. All authors reviewed the results and approved the final version of the manuscript.
-
The datasets generated during and/or analyzed during the current study are available from the corresponding author on reasonable request.
-
The authors declare that they have no conflict of interest.
- Copyright: © 2024 by the author(s). Published by Maximum Academic Press, Fayetteville, GA. This article is an open access article distributed under Creative Commons Attribution License (CC BY 4.0), visit https://creativecommons.org/licenses/by/4.0/.
-
About this article
Cite this article
Fina F, Bertram N, Gatti ML, Berone GD. 2024. Forage production and quality of tall wheatgrass (Thinopyrum ponticum) pastures under halo-hydromorphic conditions. Grass Research 4: e025 doi: 10.48130/grares-0024-0023 

Forage production and quality of tall wheatgrass (Thinopyrum ponticum) pastures under halo-hydromorphic conditions
- Received: 25 June 2024
- Revised: 26 November 2024
- Accepted: 03 December 2024
- Published online: 19 December 2024
Abstract: Tall wheatgrass is a perennial C3 grass widely used in halo-hydromorphic environments. Nitrogen fertilization is an important tool to improve forage production and nutritive value. The present objective was to determine the impact of nitrogen fertilization on the forage quality and its relationship with forage production in late spring. Three independent sites were selected in late spring using soil salinity and water table attributes (salinity and depth) as indicators and classified as low, intermediate, and high HHM (halo-hydromorphism) environments. On each site, forage production and forage quality were assessed under two levels of nitrogen fertilization: without (N0) and with nitrogen fertilization (N150). Nitrogen fertilization improved the nutritive quality of tall wheatgrass at all sites by maintaining high crude protein levels and increasing dry matter digestibility without morphological changes, indicating intrinsic quality improvements in the blades and/or sheaths. An inverse relationship was found between biomass and forage quality, suggesting the need for frequent grazing to prevent excessive biomass accumulation and maintain high blade proportions, enhancing animal performance. However, low ground cover raises salinization risk, so grazing methods should maximize high-quality forage harvest without damaging post-grazing biomass. Finally, due to the risk of N losses, in HHM environments conducting site-specific zoning is a fundamental prerequisite for implementing N fertilization practices aimed at improving both forage production and quality.
-
Key words:
- Blade proportion /
- Crude protein /
- Digestibility /
- Salinity stress /
- Water table